optimizing ontology alignment through memetic algorithm based on partial reference alignment
TRANSCRIPT

Expert Systems with Applications 41 (2014) 3213–3222
Contents lists available at ScienceDirect
Expert Systems with Applications
journal homepage: www.elsevier .com/locate /eswa
Optimizing ontology alignment through Memetic Algorithm basedon Partial Reference Alignment
0957-4174/$ - see front matter � 2013 Elsevier Ltd. All rights reserved.http://dx.doi.org/10.1016/j.eswa.2013.11.021
⇑ Corresponding author.E-mail address: [email protected] (Y. Wang).
Xingsi Xue, Yuping Wang ⇑, Aihong RenSchool of Computer Science and Technology, Xidian University, Xi’an, Shaanxi, China
a r t i c l e i n f o a b s t r a c t
Keywords:Ontology alignmentClusteringPartial Reference AlignmentMemetic Algorithm
All the state of the art approaches based on evolutionary algorithm (EA) for addressing the meta-match-ing problem in ontology alignment require the domain expert to provide a reference alignment (RA)between two ontologies in advance. Since the RA is very expensive to obtain especially when the scaleof ontology is very large, in this paper, we propose to use the Partial Reference Alignment (PRA) builtby clustering-based approach to take the place of RA in the process of using evolutionary approach. Thena problem-specific Memetic Algorithm (MA) is proposed to address the meta-matching problem by opti-mizing the aggregation of three different basic similarity measures (Syntactic Measure, Linguistic Mea-sure and Taxonomy based Measure) into a single similarity metric. The experimental results haveshown that using PRA constructed by our approach in most cases leads to higher quality of solution thanusing PRA built in randomly selecting classes from ontology and the quality of solution is very close to theapproach using RA where the precision value of solution is generally high. Comparing to the state of theart ontology matching systems, our approach is able to obtain more accurate results. Moreover, ourapproach’s performance is better than GOAL approach based on Genetic Algorithm (GA) and RA withthe average improvement up to 50.61%. Therefore, the proposed approach is both effective.
� 2013 Elsevier Ltd. All rights reserved.
1. Introduction
With different communities and companies involved in thedevelopment of ontologies, it becomes a common situation thatmultiple ontologies co-exist in the same area for similar applica-tion purposes. However, because of human subjectivity, theseontologies may define one entity with different names or in differ-ent ways, raising so-called heterogeneity problem which poses as abarrier to semantic interoperability on the ontology level (Acam-pora, Loia, Salerno, & Vitiello, 2012). Addressing this problem re-quires to identify correspondences between the entities ofvarious ontologies. This process is commonly known as ontologyalignment which can be described as follows: Given two ontolo-gies, each describing a set of discrete entities (which can be classes,properties, predicates, etc.), find the relationships (e.g., equivalenceor subsumption) that hold between these entities (Euzenat &Valtchev, 2004).
Ontology alignment plays a key role in expansion and utiliza-tion of Semantic Web-based applications (Aumueller, Do, Mass-mann, & Rahm, 2005; Chen & Huang, 2010). However, it is highlyimpractical to align the ontologies manually when the size of
ontologies is considerably large. Thus, numerous alignment sys-tems have arisen over the years. Each of them could provide, in afully automatic or semi-automatic way, a numerical value of sim-ilarity between elements from separate ontologies that can be usedto decide whether those elements are semantically similar or not.Since none of the similar measures could provide the satisfactoryresult independently, most ontology alignment systems combinea set of different similar measures together by aggregating theiraligning results. How to select weights and thresholds in ontologyaligning process in order to aggregate various similar measures re-sults to obtain a satisfactory alignment is called meta-matching(Euzenat & Shvaiko, 2007) which can be viewed as an optimizationproblem and be addressed by approaches like EA.
Nevertheless, most of the approaches based on EA optimize theparameters of meta-matching system with a prerequisite that aReference Alignment (RA) between two ontologies to be alignedshould be given in advance. Since the number of possible corre-spondences grows quadratically with the number of entities insidethe ontology, the typical approach of manually constructing thereference alignment for large scale matching tasks is infeasible.Thus, a new approach utilizes the Partial Reference Alignment(PRA) (Ritze & Paulheim, 2011), which is a set of example map-pings that could be provided by a domain expert in a reasonableamount of time, to determine the parameters of meta-matchingsystem has been proposed. The most common way of constructing

3214 X. Xue et al. / Expert Systems with Applications 41 (2014) 3213–3222
PRA is achieved by randomly selecting a subset from the RA toemulate the process of creating example mappings by a domainexpert. This may not be entirely correct, as the PRA obtainedmay not be a representative random sample of the full mapping(Ritze & Paulheim, 2011). To overcome this shortcoming, in this pa-per, we construct the PRA by a clustering-based approach to ensurethe obtained PRA can represent the RA in semantic to a great ex-tent, and then the MA, which is a kind of hybrid EA and extendsa traditional GA with local optimization methods (e.g., hill climb-ing and simulated annealing) to reduce the likelihood of the pre-mature convergence and improve the quality of solutions ofproblems (Acampora et al., 2012), is proposed to determine theoptimal settings of the meta-matching system through the PRA.
The rest of the paper is organized as follows. Section 2 isdevoted to discuss the related work; Section 3 introduces the basicdefinitions; Section 4 describes the syntactics and structure basedclustering approach to build the PRA; Section 5 proposes theproblem-specific MA; Section 6 shows the experimental results;finally, Section 7 draws conclusions and presents the furtherimprovement.
2. Related work
2.1. Evolutionary algorithm for ontology alignment
In recent years, numerous fully automatic or semi-automaticmatching systems have been developed. Lately, the focus of match-ing systems is on meta-matching. Meta-matching does not useparameters from an expert, but selects those according to a train-ing benchmark, which is a set of ontologies that have been previ-ously aligned by an expert. One group of the meta-matchingtechniques is called heuristic meta-matching, where the most out-standing approaches are based on EA.
The ontology matching systems that make use of EA can bemainly divided into two categories. The first category tackles theontology alignment problem as an optimization problem. The rep-resentative ontology matching system in this class is GAOM(Wang, Ding, & Jiang, 2006) which is developed by Wang. GAOMutilises GA, where each chromosome represents an alignment oftwo ontologies and is evaluated by a fitness function. Besides, Map-PSO (Bock & Hettenhausen, 2012), which exploits the ParticleSwarm Optimization (PSO) instead of GA, also adopts this idea. Re-cently, being inspired by GA, Acampora employs MA in the align-ment problem (Acampora et al., 2012) to improve theperformances of GA both in terms of quality of solutions and com-putational efficiency, and his approach also belongs to this cate-gory. Due to the different objective, it is not directly comparableto our approach. While the second class treats the ontology align-ment problem as a meta optimization problem. The most notableontology matching system in this category is GOAL (Martinez-Gil,Alba, & Aldana-Montes, 2008) which is proposed by Jorge Marti-nez-Gil. GOAL does not directly compute the alignment betweentwo ontologies but it determines, through GA, the optimal weightconfiguration for a weighted average aggregation of several simi-larity measures by considering a reference alignment. The sameidea is also developed in two more recent papers (Ginsca & Ifene,2010; Naya, Romero, & Loureiro, 2010), the former proposes a GAbased approach to find out how to aggregate different similaritymetrics into a single measure, and the latter focus on optimizingthe whole similarity aggregation step as a single unit, includingthe threshold which used for filtering the final alignment. How-ever, all these methods have a drawback which affects stronglytheir applicability: In order to select the most suitable set of theweights, they require a reference alignment which is provided bydomain experts for two ontologies. To overcome this drawback,
recently, Acampora, Loia, and Vitiello (2013) propose to use thenumber of correspondences and the average of the confidence val-ues of the correspondences to approximate the traditional evalua-tion metrics of alignment. In this way, it allows to directly optimizethe set of weights for the ontologies under alignment withoutrequiring a reference alignment. Similar to their work, our workalso utilizes the MA in the whole similarity aggregation step ofmeta-matching system to optimize the ontology alignments.However, the main difference between the work in Acamporaet al. (2013) and ours is the evaluation metrics of alignment, andthe involvement of the domain experts in our approach issupposed to increase the adaptability of our approach in realapplication scenarios.
2.2. Semi-automatic matching system using PRA for tuning parameters
Despite the large body of work in the field of ontology matchingand its predecessor schema matching, there is little work donewhich is focused on semi-automatic matching system using PRAfor tuning parameters.
SAMBO (Lambrix & Liu, 2009) is the most notable matching sys-tem based on PRA which uses PRA as anchors to give hints for par-titioning larger ontologies in a pre-processing step, as well as forfiltering those incorrect mappings in a post-processing step. An-other semi-automatic matching system exploiting PRA and apply-ing machine learning methods is LSD (Doan, Domingos, & Halevy,2001). It asks the user to provide the semantic mappings for asmall set of data sources, then uses these mappings together withthe sources to train a set of learners. ECOMatch (Ritze & Paulheim,2011) also asks the user to provide example mappings instead ofparameter settings, and then determines a suitable parameter set-ting based on those examples. However, so far, among those meta-matching systems that make use of the evolutionary algorithm,none have utilized the PRA for tuning the parameters.
In our approach, we first utilize a syntactics and structure basedclustering algorithm to separate entities (classes and properties) ofeach ontology into a set of small clusters which are relativelyindependent in semantic, and then select entities from thoseclusters to ensure the selected sample entities can represent theoriginal ontology in semantic to a great extent, finally we use theMA based on PRA to determine the optimal settings of the meta-matching system. The key differences between the existingapproaches and ours are that: (1) existing approaches typicallywork in session mode and require constant users attention, whileour approach works in batch mode once the users examples corre-spondences are given; (2) existing approaches determines the enti-ties in PRA in a completely random way, while our approachselects those from different class clusters which can better repre-sent the original ontology in semantic and therefore improvesthe opportunity of finding the better and even optimal parametersettings.
3. Preliminaries
3.1. Ontology and ontology alignment
There are many definitions of ontology over years. But the mostfrequently referenced one was given by Gruber in 1993 which de-fined the ontology as an explicit specification of a conceptualiza-tion. For convenience of the work in this paper, an ontology canbe defined in Definition 1.
Definition 1. An ontology is a triple, O = (C,P, I),
where:

X. Xue et al. / Expert Systems with Applications 41 (2014) 3213–3222 3215
� O is the set of classes, i.e. the set of concepts that populate thedomain of interest;� P is the set of properties, i.e. the set of relations existing
between the concepts of domain;� I is the set of individuals, i.e. the set of objects of the real world,
representing the instances of a concept.
In general, classes, properties and individuals are referred asentities.
Ontologies are seen as the solution to data heterogeneity onthe web. However, the existing ontologies could themselves intro-duce heterogeneity: Given two ontologies, the same entity can begiven different names or simply be defined in different ways,whereas both ontologies may express the same knowledge butin different languages (Maedche A., 2002). To solve this problem,a so-called ontology alignment process is necessary. Formally, analignment between two ontologies can be defined as presented byDefinition 2.
Definition 2. An alignment between two ontologies is a set ofmapping elements. A mapping element is a 4-tuples (e,e
0,n,r),
where:� e and e
0are the entities of the first and the second ontology,
respectively;� n is a confidence measure in some mathematical structure (typ-
ically in the [0,1] range) holding for the correspondencebetween the entities e and e
0;
� r is a relation (typically the equivalence) holding between theentities e and e
0.
An alignment between two ontologies which has been createdby a domain expert user is called RA, and PRA is the subset ofRA. Given an alignment A and a PRA R
0, a partial alignment can
be defined as follows:
Definition 3. A partial alignment A0
is the subset of A whichcontains all elements in A and shares at least one entity with anelement in R
0:
A0 ¼ fhe1; e2;n; ri 2 Aj9e01;n0 : he01; e2;n0; ri 2 R0g [ fhe1; e2;n; ri2 Aj9e02;n0 : he1; e02;n
0; ri 2 R0g
The ontology alignment process can be defined as follows:
Definition 4. The alignment process can be seen as a function /which, from a pair of ontologies O and O
0to align, an input
alignment AI, a set of parameters p, a set of resources r, returns anew alignment AN between these ontologies:
AN ¼ /ðO;O0;AI;p; rÞ
The ontology alignment process computes a mapping elementby using a similarity measure, which determines the closeness va-lue n (related to a given relation R) between the entities e and e
0in
the range [0, 1], where 0 stands for complete inequality and 1 forcomplete equality. Formally, the ontology alignment process canbe formulated as an optimization problem as depicted in Definition5. Our proposal of MA will exploit this definition for implementingan efficient research approach and achieving better performancesthan the existing approaches.
Definition 5. The ontology alignment optimization problem is asix-tuple (O, O
0, Aset, PRA, Wset, F) ,
where:
� O and O0
are the ontologies to align, Aset is the set of variousalignments determined by diverse similarity measures before-hand, and PRA is the Partial Reference Alignment determinedby the clustering algorithm and the domain experts;� Wset is the set of all possible weight set which is used for aggre-
gating various alignment;� F:Wset ? [0, 1] is the objective function for evaluating the qual-
ity of a weight set W e Wset:
FðWÞ ¼ f ðAÞ; A ¼XjAset j
i¼1
wiAi with wi 2W and Ai 2 Aset
where f: A ? [0, 1] determines the similarity degree of A and PRA, orevaluates the quality of W. In this work, a higher value of F (W)means that the aggregated alignment A is nearer to the optimalone. Therefore, the considered alignment problem is a maximumoptimization problem.
Next, we describe a general classification of the most used sim-ilarity measures.
3.2. Similarity measures
Typically, similarity measures between entities of eachontology could be categorized in syntactic, linguistic andTaxonomy-based Measures. In the following, we present somecommon similarity measures belonging to these three categories.
3.2.1. Syntactic MeasuresSyntactic Measures compute a string distance or edit distance
between the ontology entities. In our work, we utilize two widelyused Syntactic Measures: Levenstein distance (Maedche & Staab,2002) and Jaro distance (Euzenat & Shvaiko, 2007).
Levenstein distance calculates the number of operations, suchas modification, deletion and insertion of a character, which arenecessary to transform one string into another. Formally, theLevenstein distance between two strings s1 and s2 is defined bythe following equation:
Levensteinðs1; s2Þ ¼ max 0;minðjs1j; js2jÞ � dðs1; s2Þ
minðjs1j; js2jÞ
� �
where:
� |s1| and |s2| is the length of string s1 and s2, respectively;� d(s1, s2) is the number of operation necessary to transform s1
into s2.
Another measure is the Jaro distance, an edit distance that usesthe number of common characters in the two strings and the posi-tions in which they appear. Given strings s1 and s2, the Jaro dis-tance is defined as follows:
JaroDistðs1; s2Þ ¼13
comðs1; s2Þjs1j
þ comðs1; s2Þjs2j
þ comðs1; s2Þ � transðs1; s2Þcomðs1; s2Þ
� �
where:
� |s1| and |s2| is the length of string s1 and s2, respectively;� com(s1, s2) is the number of common characters of s1 and s2;� trans(s1, s2) is the number of pairs consisting of common char-
acters that appear in different positions.
Here, Levenstein distance is used to count the insertions anddeletions needed to match two strings and Jaro distance to countthe common characters between two strings. We choose thesetwo Syntactic Measures to consider both the commonalities andthe differences of two strings.

3216 X. Xue et al. / Expert Systems with Applications 41 (2014) 3213–3222
3.2.2. Linguistic MeasuresLinguistic Measure calculates the similarity between ontology
entities by considering linguistic relations such as synonymy,hypernym, and so on. In the proposed work, WordNet (Miller,1995), which is an electronic lexical database where various sensesof words are put together into sets of synonyms, is used to calcu-late a synonymy-based distance by considering the name of enti-ties. Given two words w1 and w1, LinguisticDist(w1, w2) equals:
� 1, if the words w1 and w2 are synonymous;� 0.5, if the word w1 is the hypernym of w2 or vice versa;� 0, otherwise.
3.2.3. Taxonomy-based MeasuresTaxonomy-based Measures consider only the specialization
relation. The intuition behind taxonomic measures is that termsconnected with subsumption relation are already similar, there-fore, their neighbors may be also somehow similar. For instance,if super-concepts are the same, the actual concepts are similar toeach other; if sub-concepts are the same, the compared conceptsare also similar. Formally, let c1 and c2 be classes of two ontologiesO1 and O2, s1 and s2 be superclasses or subclasses of c1 and c2,respectively. There is a correspondence c = (s1, s2) with an evalua-tion f(c), then
TaxonomyDistðc1; c2Þ ¼ f ðcÞ:
Each similarity measure mentioned above will generate analignment, then a similarity aggregation strategy aggregates vari-ous alignments generated by different similarity measures intoone final alignment. Finally, a threshold is used to decide whethera pair of entities is an alignment or not. In this work, we utilizeweighted average aggregation which is defined in the following:
/ðsðcÞ;wÞ ¼Xn
i¼1
wisiðcÞ withXn
i¼1
wi ¼ 1 and wi 2 ½0;1�
where:
� s(c) is the vector of similarity measure results;� w is the vector of weights;� n is the number of similarity measures.
Since the quality of resulting alignment, the correctness andcompleteness of the correspondences found already, need to be as-sessed, we will introduce some conformance measures which de-rive from the information retrieval field (Tu, Xiong, & Zhang,2005) in the next section.
3.3. Alignment evaluation
The alignment is normally assessed on the basis of two mea-sures commonly known as recall and precision (Van Rijsbergen,1975). Recall (or completeness) measures the fraction of correctalignments found in comparison to the total number of correctexisting alignments. A recall of 1 means that all of the alignmentshave actually been found, but it does not provide the informationabout the number of additionally falsely identified alignment. Typ-ically, recall is balanced against precision (or correctness), whichmeasures the fraction of found alignments that are actually correct.A precision of 1 means that all found alignments are correct, but itdoes not imply that all alignments have been found. Therefore, re-call and precision are often balanced against each other with theso-called f-measure, which is the uniformly weighted harmonicmean of recall and precision. However, when two alignments’ f-measure is equal, it is difficult to say which one is better or has lessbias to recall or precision.
Given a RA R and an alignment A, recall, precision and f-mea-sure are given by the following formulas:
recall ¼ jR \ AjjRj
precision ¼ jR \ AjjAj
f �measure ¼ 2� precision� recallprecisionþ recall
In order to evaluate the quality of an alignment obtained byusing PRA, we introduce the following measures for computing re-call, precision, and f-measure on PRA. Given a PRA R
0and a partial
alignment A0, recall, precision and f-measure on PRA are defined by
the following formulas:
recallp ¼jR0 \ A0jjR0j
precisionp ¼jR0 \ A0jjA0j
f �measurep ¼ 2�precisionp � recallp
precisionp þ recallp
4. Clustering-based approach for constructing PRA
In order to construct a PRA which could be the representativerandom sample of the full mapping, two class sets that can respec-tively represent all the classes of two ontologies should be ob-tained in advance. To this end, we propose to obtain the classsets by clustering approach. Next, the clustering algorithm willbe presented in details.
4.1. Cohesiveness and coupling
Before presenting the clustering algorithm in detail, in this sec-tion, we first introduce the notion of links which are generated bycombining two kinds of clustering features extracted from ontol-ogy’s class hierarchies.
Typically, large ontology’s class hierarchies usually have twodistinguishing characteristics: (1) linguistic similarities can befound between the local descriptions (e.g., local names, labels,comments) of the classes in these hierarchies; (2) they are oftenrepresented in Directed Acyclic Graph (DAG) structures and sub-sumption relations are the most important built-in relations inthe large ontology’s class hierarchies. Therefore, two kinds of clus-tering features can be extracted from ontology’s class hierarchies:One is syntactic similarities, and the other is structural similarities.
Syntactic similarities are computed by examining the similari-ties between the local descriptions of the classes. In our work, syn-tactic similarities between classes are calculated using Levensteindistance and Jaro distance which are defined in Section 3.2.1.While structural similarities between classes measure how closelythey are related in the hierarchies which can be calculated by thefollowing formula (Hamdi, Safar, & Reynaud, 2010).
Simstructureðci; cjÞ ¼2� depthðcijÞ
depthðciÞ þ depthðcjÞ
where:� ci, cj are two classes and cij are the common superclass of ci and
cj;� depth(ci), depth(cj) and depthðcijÞ are the depth of ci, cj and cij in
the ontology’s class hierarchy, respectively.

X. Xue et al. / Expert Systems with Applications 41 (2014) 3213–3222 3217
Usually, only computing the structure similarities between theclasses with adjacent depths can obtain moderate results. Thus, inour work, we only compute structural similarities between theclasses which satisfy |depth(ci) � depth(cj)| < 1.
Finally, links between the classes are generated by combiningthe syntactic similarities and the structural similarities:
Linkðci; cjÞ ¼ a� Simsyntacticsðci; cjÞ þ ð1� aÞ � Simstructureðci; cjÞ
where a e [0, 1], and the selection of the parameter a depends onthe syntactic and structural characteristics of the ontology’s classhierarchies. In this work, we set a = 0.5 to prefer neither syntacticsimilarity nor structural similarity and choose a small link thresholdfor link filtering in our experiments. This is because the linkageamong the classes is sparse, using a large threshold may causemany small island blocks, i.e., each block only contains severalclasses.
With the notion of link, we are able to elaborate the cohesive-ness within a block and the coupling between two separate blocks.Cohesiveness is a measure of the weight of all links connectingconcepts belonging to the same cluster, and coupling is a measureof the weight of all links connecting concepts of two different clus-ters (Guha, Rastogi, & Shim, 1999). Theses notions are calculatedwith the same measure called cut:
Cutðgi; gjÞ ¼P
ci2gi ;cj2gjLinkðci; cjÞ
sizeðgiÞ � sizeðgjÞ
where:� gi, gj are two clusters,� size(gi) and size(gj) are the size of gi, gj, respectively.
Moreover, Cohensiveness(gi) = Cut(gi, gi) and Coupling(gi, gj) =Cut(gi, gj) where gi – gj.
4.2. Clustering algorithm
The objective of the clustering algorithm is to partition theontology’s classes into a set of disjoint clusters g1, g2,. . ., gn, wherethe cohesiveness among the classes in a cluster gi is high; mean-while the coupling crossing different clusters gi, gj is low. Our clus-tering algorithm is mainly inspired by ROCK (Guha et al., 1999)which is a famous agglomerative clustering algorithm in the fieldof Data Mining. Given an ontology O, our algorithm takes for inputn clusters to partition, where each cluster is initially reduced to asingle class of O, and a k limits the maximum number of classesin each cluster. First, the cohesiveness value and the coupling valueof each cluster are initialized. Then, the algorithm chooses the clus-ter which has the maximum cohesiveness value and the one hasthe maximum coupling value with the first cluster. These two clus-ters are fused and the coupling values of all other clusters are up-dated by taking this new cluster into account. This process repeatsuntil all the clusters have reached the size limit or there is no clus-ter whose cohesiveness is larger than zero. Finally, the algorithmfilters those clusters whose scales are under the threshold.
Once the separate clusters of both ontologies are obtained, werandomly select the classes from all clusters according to the classselect ratio to form two set of classes which could represent thetwo ontologies in semantic to a large extent. Then PRA is con-structed by requiring user to find the correspondences betweenthese two class sets. Based on the PRA, a problem-specific MA,which will be presented in Section 5, is utilized to optimize theontology alignments.
5. MA for optimizing ontology alignments
There are some preparation steps before deploying the MA.First, the similarity measures are chosen. Second, given a set ofpairwise ontologies as the input, the values of these measuresare calculated and the results are stored in XML format. This isdone to avoid recalculating the similarity during the process ofrunning MA.
In this section, MA that extends a GA with the stochastic Hillclimbing search is presented to solve the ontology alignment prob-lem. As similar to GA, MA also starts from a population of randomlygenerated chromosomes and consists of successive generations. Ineach generation, a selection operator provides the mechanism tomake sure the most suitable chromosomes have more opportuni-ties of reproducing themselves. Each solution is evaluated bymeans a fitness function that reflects how good it is, comparedwith other solutions in the population. The higher is the fitness va-lue of an individual, the higher is its chance of surviving. Recombi-nation of genetic material is simulated through two operators:Crossover that exchanges portions between two randomly selectedchromosomes and mutation that causes random alteration of thechromosome genes to assure diversity in the population and pre-vents premature convergence. However, different from GA, MAperforms a local search process within each generation. The algo-rithm evolution terminates when specified conditions such as themaximum number of generations are reached (Acampora et al.,2012).
However, to apply MA for addressing the ontology alignmentoptimization problem, four points, i.e. the chromosome encodingmechanism, the fitness function, the genetic operators and the lo-cal search process, is necessary to define.
5.1. Chromosome encoding
We incorporate in a chromosome both the weights associatedwith the similarity measures and the threshold to decide whethera pair of entities is an alignment or not. Therefore, one chromo-some can be divided into two parts, one stands for several weightsand the other for threshold. Concerning the characteristics of theweights which are mentioned in 3.2.3, our encoding mechanismindirectly represents them by defining the cut or separation pointin the interval [0, 1] that limits the value of the weights. If p is thenumber of weights required, the set of cuts can be represented asc0 ¼ fc01; c02; . . . ; c0p�1g. The chromosome decoding is carried out byqueuing the elements of c
0in ascending order, then we get
c = {c1, c2,. . ., cp�1}, and calculating the weights as follows (Marti-nez-Gil et al., 2008):
wk ¼c1; k ¼ 1
ck � ck�1; 1 < k < p
1� cp�1; k ¼ p
8><>:
For example, given a chromosome I = {0.341, 0.175, 0.766,0.932}, the last bit of I, i.e. 0.932, represents the threshold andthe rest of bits represent the cuts set which could be denoted asc0= {0.341, 0.175, 0.766}. Then we sort the elements in c
0in ascend-
ing order and we get c = {0.175, 0.341, 0.766}. Finally, we calculatethe weight set {0.175, 0.166, 0.425, 0.234}.
Therefore, the decoding result is {0.175, 0.166, 0.425, 0.234,0.932} and the length of a chromosome is (n � 1)cut-Length + thresholdLength, where n is the number of weights, cut-Length and thresholdLength are the chromosome lengths of thecut and threshold, respectively.

Table 1Brief description of benchmarks.
Benchmark Brief description
101–104 The ontologies under alignment are the same or the first one isthe OWL Lite restriction of the second one
201–210 The ontologies under alignment have the same structure, butdifferent lexical and linguistic features
221–247 The ontologies under alignment have the same lexical andlinguistic features, but different structure
248–266 The ontologies under alignment have different lexical, linguisticand structure features
301–314 The ontologies under alignment are real world cases
3218 X. Xue et al. / Expert Systems with Applications 41 (2014) 3213–3222
5.2. Fitness function
In Section 3, we has formulated the ontology alignment processas a maximization problem based on the evaluation of the objec-tive function defined in Definition 5. Therefore, our proposal ofMA for solving the ontology alignment problem will exploit thesame function for evaluating the fitness of the chromosomes. Spe-cifically, the f-measure on PRA is utilized to evaluate the quality ofthe aggregated alignment.
5.3. Genetic operators
5.3.1. SelectionLike in nature, the most suitable chromosomes must have more
opportunities of reproducing themselves. The best chromosomesin a population are the chromosomes that have the best fitness va-lue and the genetic information of these chromosomes can poten-tially provide the best solutions to the problem. Anyway,reproduction opportunities of the less suitable chromosomesshould not be completely removed, because it is important to keepdiversity in the population. In this article, in order to ensure thediversity of the population and accelerate the convergence of thealgorithm, selection operator first queues the chromosomes ofpopulation in descending order according to their fitness values.Then we select half of the chromosomes in the front of the popu-lation and randomly copy one each time until forming a newpopulation.
5.3.2. CrossoverThe crossover operator takes two chromosomes called parents
and generates two children chromosomes, which are obtained bymixing the genes of the parents. Crossover is applied with a certainprobability, a parameter of the algorithm. In this work, we use thecommon one-cut-point method to carry out the crossover opera-tion on the population. First, a cut position in two parents is ran-domly determined and this position is a cut point which cutseach parent into two parts: the left part and the right part. Then,the right parts of them are switched to form two children.
5.3.3. MutationMutation operator assures diversity in the population and pre-
vents premature convergence. In our work, for each chromosomein the individual we check if the mutation could be applied accord-ing to the mutation probability and if it is, the value of that bit isthen flipped.
5.4. Local search process
In general, the local search strategies perform iterative searchfor optimum solution in the neighborhood of a candidate. In orderto tradeoff between the local search and the global search, the localsearch process in our work is designed as follows (Acampora et al.,2012):
� The local search is applied within each evolutionary cycle;� The local search is executed after crossover and mutation
operators;� The local search is applied to the best individual of population;� The local search method is the hill climbing algorithm.
In particular, the hill climbing algorithm is a local search itera-tive method. During iterations, the algorithm attempts to find abetter individual by randomly mutating the current one. If themutation improves the current individual, then the new individualbecomes the current one. The search is repeated until no further
improvements can be found or after a maximum number ofiterations.
Once the chromosome structure, the fitness function, and thelocal search process have been discussed, the MA used to tuningthe parameters of matching system can be presented. Initially,the MA randomly generates a population of possible parametersfor aggregating various alignments obtained by different similaritymeasures. In each generation, the algorithm computes new param-eters by evolving the current population by means of traditionalgenetic operators: The crossover and mutation operators. Afterthese conventional genetic steps are computed, the MA performsa local search to refine the best alignment belonging to the currentgenetic population. Successively, a genetic selection operator, i.e.the roulette wheel selection, is applied to generate a new popula-tion used by the algorithm to start the next iteration. At the end ofeach generation, the quality of the alignment generated is evalu-ated in terms of f-measure on PRA and the algorithm ends whenthe predefined number of generation is performed.
Next, we will perform a comparison by experiments betweenthe alignments obtained by using the PRA constructed by ran-domly selecting entities from two ontologies and by utilizing ourcluster-based approach.
6. Experimental results and analysis
In the experiments, the well-known benchmarks provided bythe Ontology Alignment Evaluation Initiative (OAEI) 2012 (Ontol-ogy Alignment Evaluation Initiative (OAEI), 2013) are used. Eachbenchmark in the OAEI data set is composed of two ontologies tobe aligned and a RA to evaluate the quality of alignment. Moreover,according to OAEI policies, the benchmark reference alignmentstake into account only the matching between ontology classesand properties. Table 1 shows a brief description about the bench-marks of OAEI 2012.
6.1. Experiments configuration
In the experiments, the clustering algorithm uses the followingparameters:
� The maximum number of classes in each cluster = 500;� The combining parameter a in link = 0.5;� The threshold for filtering clusters = 1, which means we take all
possible clusters into consideration;� The class select ratio = 0.15.
When we set class select ratio as 1, it is equivalent to askdomain experts to provide the RA. In our work, through the exper-iments, we observe that the result’s quality significantly increaseswhen the value of class select ratio is above 0.15. However, how toselect the proper class select ratio to trade off between the quality
X. Xue et al. / Expert Systems with Applications 41 (2014) 3213–3222 3219
of alignment and the labor of domain experts still remainsunsettled.
The similarity measures used are as follows:
� Levenstein distance (Syntactic Measure);� Jaro distance (Syntactic Measure);� Linguistic distance (Linguistic Measure);� Taxonomy distance (Taxonomy-based Measure).
The MA uses the following parameters:
� Search space for each parameter is the continuous interval [0,1];� Numerical accuracy = 0.01;� The fitness is the f-measure on the PRA;� Population size = 20 chromosomes;� Local search population size = 50 chromosomes, i.e. for a single
solution, local search algorithm will be carried out 50 times togenerate 50 new chromosomes;� Crossover probability = 0.98;
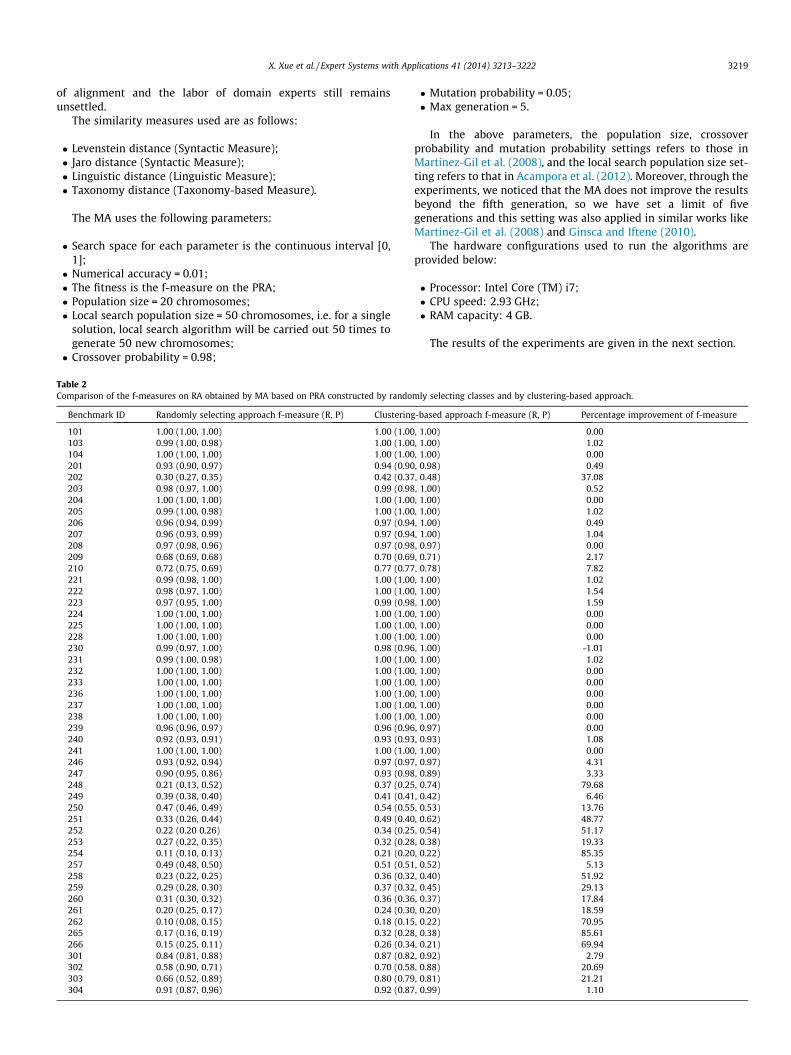
Table 2Comparison of the f-measures on RA obtained by MA based on PRA constructed by rando
Benchmark ID Randomly selecting approach f-measure (R, P) Clustering
101 1.00 (1.00, 1.00) 1.00 (1.00103 0.99 (1.00, 0.98) 1.00 (1.00104 1.00 (1.00, 1.00) 1.00 (1.00201 0.93 (0.90, 0.97) 0.94 (0.90202 0.30 (0.27, 0.35) 0.42 (0.37203 0.98 (0.97, 1.00) 0.99 (0.98204 1.00 (1.00, 1.00) 1.00 (1.00205 0.99 (1.00, 0.98) 1.00 (1.00206 0.96 (0.94, 0.99) 0.97 (0.94207 0.96 (0.93, 0.99) 0.97 (0.94208 0.97 (0.98, 0.96) 0.97 (0.98209 0.68 (0.69, 0.68) 0.70 (0.69210 0.72 (0.75, 0.69) 0.77 (0.77221 0.99 (0.98, 1.00) 1.00 (1.00222 0.98 (0.97, 1.00) 1.00 (1.00223 0.97 (0.95, 1.00) 0.99 (0.98224 1.00 (1.00, 1.00) 1.00 (1.00225 1.00 (1.00, 1.00) 1.00 (1.00228 1.00 (1.00, 1.00) 1.00 (1.00230 0.99 (0.97, 1.00) 0.98 (0.96231 0.99 (1.00, 0.98) 1.00 (1.00232 1.00 (1.00, 1.00) 1.00 (1.00233 1.00 (1.00, 1.00) 1.00 (1.00236 1.00 (1.00, 1.00) 1.00 (1.00237 1.00 (1.00, 1.00) 1.00 (1.00238 1.00 (1.00, 1.00) 1.00 (1.00239 0.96 (0.96, 0.97) 0.96 (0.96240 0.92 (0.93, 0.91) 0.93 (0.93241 1.00 (1.00, 1.00) 1.00 (1.00246 0.93 (0.92, 0.94) 0.97 (0.97247 0.90 (0.95, 0.86) 0.93 (0.98248 0.21 (0.13, 0.52) 0.37 (0.25249 0.39 (0.38, 0.40) 0.41 (0.41250 0.47 (0.46, 0.49) 0.54 (0.55251 0.33 (0.26, 0.44) 0.49 (0.40252 0.22 (0.20 0.26) 0.34 (0.25253 0.27 (0.22, 0.35) 0.32 (0.28254 0.11 (0.10, 0.13) 0.21 (0.20257 0.49 (0.48, 0.50) 0.51 (0.51258 0.23 (0.22, 0.25) 0.36 (0.32259 0.29 (0.28, 0.30) 0.37 (0.32260 0.31 (0.30, 0.32) 0.36 (0.36261 0.20 (0.25, 0.17) 0.24 (0.30262 0.10 (0.08, 0.15) 0.18 (0.15265 0.17 (0.16, 0.19) 0.32 (0.28266 0.15 (0.25, 0.11) 0.26 (0.34301 0.84 (0.81, 0.88) 0.87 (0.82302 0.58 (0.90, 0.71) 0.70 (0.58303 0.66 (0.52, 0.89) 0.80 (0.79304 0.91 (0.87, 0.96) 0.92 (0.87
� Mutation probability = 0.05;� Max generation = 5.
In the above parameters, the population size, crossoverprobability and mutation probability settings refers to those inMartinez-Gil et al. (2008), and the local search population size set-ting refers to that in Acampora et al. (2012). Moreover, through theexperiments, we noticed that the MA does not improve the resultsbeyond the fifth generation, so we have set a limit of fivegenerations and this setting was also applied in similar works likeMartinez-Gil et al. (2008) and Ginsca and Iftene (2010).
The hardware configurations used to run the algorithms areprovided below:
� Processor: Intel Core (TM) i7;� CPU speed: 2.93 GHz;� RAM capacity: 4 GB.
The results of the experiments are given in the next section.
mly selecting classes and by clustering-based approach.
-based approach f-measure (R, P) Percentage improvement of f-measure
, 1.00) 0.00, 1.00) 1.02, 1.00) 0.00, 0.98) 0.49, 0.48) 37.08, 1.00) 0.52, 1.00) 0.00, 1.00) 1.02, 1.00) 0.49, 1.00) 1.04, 0.97) 0.00, 0.71) 2.17, 0.78) 7.82, 1.00) 1.02, 1.00) 1.54, 1.00) 1.59, 1.00) 0.00, 1.00) 0.00, 1.00) 0.00, 1.00) -1.01, 1.00) 1.02, 1.00) 0.00, 1.00) 0.00, 1.00) 0.00, 1.00) 0.00, 1.00) 0.00, 0.97) 0.00, 0.93) 1.08, 1.00) 0.00, 0.97) 4.31, 0.89) 3.33, 0.74) 79.68, 0.42) 6.46, 0.53) 13.76, 0.62) 48.77, 0.54) 51.17, 0.38) 19.33, 0.22) 85.35, 0.52) 5.13, 0.40) 51.92, 0.45) 29.13, 0.37) 17.84, 0.20) 18.59, 0.22) 70.95, 0.38) 85.61, 0.21) 69.94, 0.92) 2.79, 0.88) 20.69, 0.81) 21.21, 0.99) 1.10

3220 X. Xue et al. / Expert Systems with Applications 41 (2014) 3213–3222
6.2. Results and analysis
We use the parameters determined by MA based on PRA toaggregate the alignments obtained by Syntactic Measure, Linguis-tic Measure and Taxonomy based Measure respectively, and thenutilize the f-measure on RA to evaluate the resulting alignment.Table 2 shows the mean f-measures on RA in thirty independentruns, which are determined by MA based on PRA constructed by
Table 3Comparison of f-measure values on RA determined by MA based on RA and PRA.
Benchmark ID MA based on RA f-measure(R, P)
MA based on PRA f-measure(R, P)
101 1.00 (1.00, 1.00) 1.00 (1.00, 1.00)103 1.00 (1.00, 1.00) 1.00 (1.00, 1.00)104 1.00 (1.00, 1.00) 1.00 (1.00, 1.00)201 1.00 (1.00, 1.00) 0.94 (0.90, 0.98)202 0.45 (0.42, 0.48) 0.42 (0.37, 0.48)203 0.99 (0.98, 1.00) 0.99 (0.98, 1.00)204 1.00 (1.00, 1.00) 1.00 (1.00, 1.00)205 1.00 (1.00, 1.00) 1.00 (1.00, 1.00)206 1.00 (1.00, 1.00) 0.97 (0.94, 1.00)207 1.00 (1.00, 1.00) 0.97 (0.94, 1.00)208 0.98 (0.99, 0.98) 0.97 (0.98, 0.97)209 0.71 (0.71, 0.72) 0.70 (0.69, 0.71)210 0.78 (0.78, 0.78) 0.77 (0.77, 0.78)221 1.00 (1.00, 1.00) 1.00 (1.00, 1.00)222 1.00 (1.00, 1.00) 1.00 (1.00, 1.00)223 0.97 (0.95, 1.00) 0.99 (0.98, 1.00)224 1.00 (1.00, 1.00) 1.00 (1.00, 1.00)225 1.00 (1.00, 1.00) 1.00 (1.00, 1.00)228 1.00 (1.00, 1.00) 1.00 (1.00, 1.00)230 1.00 (1.00, 1.00) 0.98 (0.96, 1.00)231 1.00 (1.00, 1.00) 1.00 (1.00, 1.00)232 1.00 (1.00, 1.00) 1.00 (1.00, 1.00)233 1.00 (1.00, 1.00) 1.00 (1.00, 1.00)236 1.00 (1.00, 1.00) 1.00 (1.00, 1.00)237 1.00 (1.00, 1.00) 1.00 (1.00, 1.00)238 1.00 (1.00, 1.00) 1.00 (1.00, 1.00)239 0.99 (1.00, 0.98) 0.96 (0.96, 0.97)240 0.94 (0.95, 0.93) 0.93 (0.93, 0.93)241 1.00 (1.00, 1.00) 1.00 (1.00, 1.00)246 0.97 (0.98, 0.97) 0.97 (0.97, 0.97)247 0.94 (0.99, 0.89) 0.93 (0.98, 0.89)248 0.44 (0.32, 0.72) 0.37 (0.25, 0.74)249 0.44 (0.49, 0.40) 0.41 (0.41, 0.42)250 0.54 (0.71, 0.44) 0.54 (0.55, 0.53)251 0.49 (0.40, 0.62) 0.49 (0.40, 0.62)252 0.39 (0.31, 0.54) 0.34 (0.25, 0.54)253 0.35 (0.43, 0.30) 0.32 (0.28, 0.38)254 0.25 (0.28, 0.22) 0.21 (0.20, 0.22)257 0.52 (0.55, 0.50) 0.51 (0.51, 0.52)258 0.41 (0.58, 0.32) 0.36 (0.32, 0.40)259 0.38 (0.37, 0.40) 0.37 (0.32, 0.45)260 0.37 (0.37, 0.37) 0.36 (0.36, 0.37)261 0.25 (0.35, 0.20) 0.24 (0.30, 0.20)262 0.19 (0.28, 0.14) 0.18 (0.15, 0.22)265 0.37 (0.38, 0.37) 0.32 (0.28, 0.38)266 0.28 (0.38, 0.22) 0.26 (0.34, 0.21)301 0.88 (0.91, 0.86) 0.87 (0.82, 0.92)302 0.71 (0.83, 0.63) 0.70 (0.58, 0.88)303 0.80 (0.82, 0.77) 0.80 (0.79, 0.81)304 0.92 (0.93, 0.91) 0.92 (0.87, 0.99)
Table 4Comparison of the alignments obtained by our approach with state of the art ontology m
Benchmark ID COMA++ f-measure (R, P) eTuner f-measure (R, P
1XX 1.00 (1.00, 1.00) 1.00 (1.00, 1.00)2XX 0.76 (0.70, 0.84) 0.75 (0.67, 0.85)3XX 0.76 (0.69, 0.84) 0.68 (0.59, 0.81)Avg. 0.85 (0.81, 0.89) 0.81 (0.75, 0.89)
randomly selecting entities from two ontologies and those by ourapproach respectively. Table 3 shows the f-measures on RA deter-mined by MA based on RA and our approach respectively. Table 4shows the results obtained by other state of the art systems inontology matching and our approach and Table 5 presents theimprovement of our approach on GOAL. In Tables 2–4, R and P referto recall and precision on RA, respectively.
As can be seen from Table 2, except benchmark 230, the f-mea-sures on RA of all the other test cases show that the qualities ofalignments obtained by MA based on PRA constructed by cluster-ing-based approach are better than or equal to those by usingMA based on PRA built by randomly selecting classes from ontol-ogy, and the maximum improvement of f-measure made by formerapproach on the latter one achieves 85.61%. Besides, except testcase 303, the precisions on RA obtained by our approach are allhigher than those in completely random way, and further in sometest cases our approach can find the solution with higher recall onRA. Since the PRA constructed by clustering-based approach ismore suitable to become the representative sample mapping ofRA, the parameters determined by our approach could find higherquality solutions than MA based on PRA which is constructed inthe way of randomly selecting classes from ontologies.
In Table 3, as it can be seen that, in 22 out of 50 cases, our ap-proach is able to find the solution whose f-measures on RA are thesame to the solution determined by MA based on RA. In the resttest cases, our approach can also find the solution with f-measureson RA very close to those determined by MA based on RA. More-over, in all benchmarks but 201, 208, 209, 239 and 266, the solu-tions obtained by our approach have the precisions equal to orhigher than the solution determined by MA based on RA.
In Table 4, 1XX stands for the benchmarks in Table 1 whosenumber beginning with the prefix digit 1 and so are 2XX and3XX, and the results in Table 4 are the mean value of the corre-sponding alignments’ recall, precision and f-measure. Among sev-eral state of the art ontology matching systems, we pickedCOMA++ (Aumueller et al., 2005), eTuner (Lee, Sayyadian, Doan,& Rosenthal, 2001), and GOAL for the following three reasons: (1)COMA++ also combines more diverse similar measures to deter-mine correspondences between ontology elements but it usesweights determined by an expert; (2) eTuner tries to optimizeautomatically the parameters related to the matching task but itis based on the exhaustive search solutions; (3) GOAL is similarto our approach and it is one of the most notable ontology match-ing systems which use evolutionary algorithm to aggregate differ-ent similarity measures into a single one.
As can be seen from Table 4, for the benchmark 1XX, the aver-age f-measure value of our alignments is equal to the other match-ing systems. For the benchmarks 2XX, the average f-measure valueof our approach’s alignments is equal to COMA++ and better thaneTuner and GOAL. For the benchmarks 3XX, the average f-measurevalue of the alignments obtained by our approach outperformsCOMA++, eTuner and GOAL. Finally, from the average value inTable 4, the f-measure values of the alignments obtained by ourapproach are better than COMA++, eTuner and GOAL. Therefore,comparing to the state of the art ontology matching systems, ourapproach is able to obtain more accurate results.
atching systems.
) GOAL f-measure (R, P) MA based on PRA f-measure (R, P)
1.00 (1.00, 1.00) 1.00 (1.00, 1.00)0.68 (0.64, 0.73) 0.76 (0.74, 0.78)0.80 (0.86, 0.75) 0.82 (0.77, 0.90)0.83 (0.83, 0.83) 0.86 (0.84, 0.89)

Table 5Comparison of the performance of GOAL and our approach.
Benchmark ID GOAL Our approach Percentage improvement
101 33.3 9.0 72.97103 16.3 9.0 44.79104 18.0 9.0 50.00201 15.7 5.0 68.15202 17.3 5.0 71.10203 30.0 12.0 60.00204 45.0 12.0 73.33205 28.0 15.0 46.43206 33.3 15.0 54.95207 32.7 15.0 54.13208 28.3 15.0 47.00209 33.3 15.0 54.95210 35.0 15.0 57.14221 14.7 9.0 38.78222 13.3 9.0 32.33223 28.0 16.0 42.86224 11.7 9.0 23.08225 26.3 9.0 65.78228 4.4 3.0 31.82230 25.3 9.0 64.43231 13.0 9.0 30.77232 31.3 9.0 71.25233 35.0 15.0 57.14236 18.7 9.0 51.87237 36.3 15.0 58.68238 25.3 15.0 40.71239 23.0 12.0 47.83240 23.0 15.0 34.78241 23.0 15.0 34.78246 15.3 9.0 41.18247 24.7 15.0 39.27248 13.0 9.0 30.77249 33.3 15.0 54.95250 28.0 15.0 46.43251 26.3 15.0 42.97252 24.0 15.0 37.50253 18.3 9.0 50.82254 25.3 15.0 40.71257 12.0 9.0 25.00258 28.0 12.0 57.14259 20.0 12.0 40.00260 24.3 12.0 50.62261 19.7 9.0 54.31262 26.3 15.0 42.97265 28.0 15.0 46.43266 26.3 15.0 42.97301 32.3 18.0 44.27302 39.7 28.0 29.47303 37.3 12.0 67.83304 13.7 9.0 34.31Avg. 24.7 12.2 50.61
X. Xue et al. / Expert Systems with Applications 41 (2014) 3213–3222 3221
In addition, we further carry out the Wilcoxons signed rank test,which can be employed to detect significant differences betweenthe performances of two approaches (Stoilos, Stamou, & Kollias,2005), to compare the performance of GOAL, which uses GA ap-proach based on RA, and our approach. To compute the Wilcoxonstest, two samples, representing the performances of the three com-pared approaches respectively, have to be built. In detail, the con-sidered samples are obtained as follows:
� GA, MA are run thirty times for each benchmark;� Each run stops when the f-measure on RA of the obtained align-
ment is greater or equal than 0.8 or when the maximum num-ber of iterations is executed;� During the algorithm executions, the numbers of fitness evalu-
ations are stored in three vectors named Vg and Vm representing,respectively, the sample for the GOAL and our approach.
Once the samples are built, the Wilcoxons test uses them tocompare the performances of the GOAL and our approach. The
values shown in Table 5 are the mean value of the number of fit-ness evaluations in thirty algorithm executions.
As can be seen from Table 5, our approach obtains better resultsthan GOAL in all cases. Moreover, by comparing the average num-ber of fitness evaluations for each benchmark computed by our ap-proach with GOAL, the average improvement up to 50.61% isachieved.
According to the results of the experiment, we may draw thefollowing conclusions: (1) our approach can find better solutionsthan MA based on PRA constructed by randomly selecting classesfrom ontologies and the precisions on RA of the solutions deter-mined by our approach are generally high. This is because the clus-tering-based approach can increase the chance of building a PRAwhich could better represent the original ontologies in semantic,we could obtain the similar tuning effect to that by using RA; (2)comparing with the state of the art ontology matching systems,our approach is able to obtain more accurate results; (3) our ap-proach’s performance is better than GOAL.
7. Conclusions
Ontology alignment is an important step in ontology engineer-ing. Although lots of work have been done to tackle this problem,there are still various important issues left for the researchers todeal with. One of these issues is the construction of RA while tun-ing the parameters in the meta-matching system. To tackle thisproblem, we propose to use PRA constructed by clustering-basedapproach to replace the RA in the process of determining the sub-optimal or even optimal system parameters. To that end, we firstpresent a clustering algorithm to partition the ontology in seman-tic into separate class clusters, and then a PRA is built based on theclusters as the representative sample mappings of RA, finally weutilize MA based on measures on PRA to tune the parameters ofmeta-matching system. The contributions brought about by thispaper are as follows:
� The utilization of problem-specific MA to solve the meta-matching problem in ontology alignment, and to the best ofour knowledge, this is the first time to utilize MA to solve theontology alignment optimization problem;� The proposal of a novel clustering algorithm for PRA
construction;� The application of PRA to overcome the drawback of existing
approaches based on EA for solving the meta-matching problemin ontology alignment, and as far as we know, this is also thefirst time to utilize PRA in solving the meta-matching problemin ontology alignment.
The experimental results have shown that using PRA con-structed by our approach in most cases leads to higher quality ofsolution than using PRA built in randomly selecting classes fromontology and the quality of solution is very close to the approachusing RA where the precision value of solution is generally high.Comparing with the state of the arts ontology matching systems,our approach is able to obtain more accurate results. Moreover,our approach’s performance is better than GOAL which is an ap-proach based on GA and RA with the average improvement up to50.61%. Therefore, the proposed approach is effective.
In continuation of our research, we are also interested inimproving the clustering algorithm by finding a measure to evalu-ate the cluster’s quality, which can be used to decide which clus-ters have better chances to produce a good PRA. Moreover, inorder to further improve the quality of produced alignments, inthe future, our idea is to enable the proposed approach to identifynot only equivalence correspondences but also other kinds of

3222 X. Xue et al. / Expert Systems with Applications 41 (2014) 3213–3222
correspondences based on relations such as subsumption andother relations.
Funding
This work is supported by the National Natural Science Founda-tion of China (No. 61272119).
References
Acampora, G., Loia, V., Salerno, S., & Vitiello, A. (2012). A hybrid evolutionaryapproach for solving the ontology alignment problem. International Journal ofIntelligent Systems, 27, 189–216.
Acampora, G., Loia, V., & Vitiello, A. (2013). Enhancing ontology alignment through amemetic aggregation of similarity measures. Information Sciences, 250, 1–20.
Aumueller, D., Do, H. H., Massmann, S., & Rahm, E. (2005). Schema and ontologymatching with COMA++. In Proceedings of the 2005 ACM SIGMOD internationalconference on Management of data (pp. 906–908).
Bock, J., & Hettenhausen, J. (2012). Discrete particle swarm optimisation forontology alignment. Information Sciences, 7, 152–173.
Chen, Y. J., & Huang, C. Y. (2010). Concept feature-based ontology construction andmaintenance. In Computer Science and Information Technology (ICCSIT) of the 3rdIEEE International Conference Vol. 1 (pp. 28–32).
Doan, A., Domingos, P., & Halevy, A. (2001). Reconciling schemas of disparate datasources: A machine-learning approach. In Proceedings of the 2001 ACM SIGMODinternational conference on Management of data (pp. 509–520).
Euzenat, J., & Valtchev, P. (2004). Similarity-based ontology alignment in OWL-Lite.In Proceedings of the 16th European Conference on Artificial Intelligence (pp. 333–337).
Euzenat, J., & Shvaiko, P. (2007). Ontology matching. Springer. 80.Ginsca, A.-L., & Iftene, A. (2010). Using a genetic algorithm for optimizing the
similarity aggregation step in the process of ontology alignment. In 9thRoedunet Int Conf. (RoEduNet) (pp. 118–122).
Guha, S., Rastogi, R., & Shim, K. (1999). ROCK: A robust clustering algorithm forcategorical attributes. In Proceedings of the 15th International Conference on DataEngineering (pp. 512–521).
Hamdi, F., Safar, B., & Reynaud, C. (2010). Alignment-based partitioning of largescale ontologies. Advances in knowledge discovery and management (292,pp. 702–715). .
Lambrix, P., & Liu, Q. (2009). Using partial reference alignments to align ontologies.In Proceedings of the 6th European Semantic Web Conference (ESWC) (pp. 188–202).
Lee, Y., Sayyadian, M., Doan, A., & Rosenthal, A. (2001). eTuner: Tuning schemamatching software using synthetic scenarios. Journal of VLDB, 16, 97–122.
Maedche, A., & Staab, S. (2002). Measuring similarity between ontologies. InProceedings of the International Conf. on Knowledge Engineering and KnowledgeManagement (EKAW) (pp. 251–263).
Martinez-Gil, J., Alba, E., & Aldana-Montes, J. F. (2008). Optimizing ontologyalignments by using genetic algorithms. In Nature Inspired Reasoning for the,Semantic Web (NatuReS2008) Vol. 419 (pp. 31–45).
Miller, G. A. (1995). WordNet: A lexical database for English. Communications of theACM, 38(11), 39–41.
Naya, J. M. V., Romero, M. M., & Loureiro, J. P. (2010). Improving ontology alignmentthrough genetic algorithms. In Soft computing methods for practical environmentsolutions: Techniques and studies (pp. 240–259).
Ontology alignment evaluation initiative (OAEI), (2013). http://oaei.ontologymatching.org/2012/, accessed July 2013.
Ritze, D., & Paulheim, H. (2011). Towards an automatic parameterization ofontology matching tools based on example mappings. In Proceedings of the 6thInternational Workshop on Ontology Matching (pp. 37–48).
Stoilos, G., Stamou, G., & Kollias, S. (2005). A string metric for ontology alignment. InProceedings of 4th International Semantic Web Conference (ISWC 2005) (pp. 623–637).
Tu, K. W., Xiong, M., & Zhang, L. (2005). Towards imaging large-scale ontologies forquick understanding and analysis. In Proceedings of the 4th InternationalSemantic Web Conference (pp. 702–715).
Van Rijsbergen, C. J. (1975). Information retrieval. London: Butterworth.Wang, J. L., Ding, Z. J., & Jiang, C. J. (2006). GAOM: Genetic algorithm based ontology
matching. In Proceedings of the IEEE Asia-Pacilc Conference on Services Computing(APSCC) (pp. 617–620).