optimizing product development time by using cfd as a ... · definition of cfd computational fluid...
TRANSCRIPT

Optimizing Product Development Time by Using CFD as a Design Tool
November 2011
Michelle Boucher
Optimizing Product Development Time with CFD as a Design Tool Page 2
© 2011 Aberdeen Group. Telephone: 617 854 5200 www.aberdeen.com Fax: 617 723 7897
Executive Summary As companies prepare for economic recovery, rapid innovation to bring new products to market quickly, as well as meeting customer expectations for quality, is critical. In addition, design decisions made by engineers have a significant impact on cost. This means engineers need efficient methods for making the right decisions to design the high quality, cost effective products their customers expect. In addition, increasing complexity is creating a need for better methods for assessing the impact of various physical forces such as fluid flow. This report provides guidance to help companies that develop products impacted by liquid or gas flow, heating or cooling, chemical reactions, turbulence, and other related physical phenomena to make better design decisions that will ultimately lead to greater product profitability.
Best-in-Class Performance Aberdeen used the following five key performance criteria to distinguish Best-in-Class companies with top performers achieving the following results:
• 89% of products met release dates
• 28% decrease in development time since implementing the current approach for assessing product behavior
• 90% of products met quality targets
• 87% of products met cost targets
• 24% reduction in product cost time since implementing the current approach for assessing product behavior
Competitive Maturity Assessment When compared to competitors, firms enjoying Best-in-Class performance share several common characteristics that enable them to make better design decisions:
• 22% more likely to pursue a ‘get it right the first time’ strategy
• 44% more likely to use Computational Fluid Dynamics (CFD) results to promote collaboration between analysts and engineers
• 32% more likely to evaluate what-if scenarios / Design of Experiments (DOE) using CFD analyses
Recommendations To achieve Best-in-Class performance, companies should:
• Assess product behavior against a wider range of real world conditions
• Provide design engineers with access to CFD analysis results
• Use CFD to conduct what-if studies to support trade off decisions
This document is the result of primary research performed by Aberdeen Group. Aberdeen Group's methodologies provide for objective fact-based research and represent the best analysis available at the time of publication. Unless otherwise noted, the entire contents of this publication are copyrighted by Aberdeen Group, Inc. and may not be reproduced, distributed, archived, or transmitted in any form or by any means without prior written consent by Aberdeen Group, Inc.
Research Summary
Aberdeen’s Research provide an in-depth and comprehensive look into process, procedure, methodologies, and technologies with best practice identification and actionable recommendations
Optimizing Product Development Time with CFD as a Design Tool Page 3
© 2011 Aberdeen Group. Telephone: 617 854 5200 www.aberdeen.com Fax: 617 723 7897
Table of Contents Executive Summary ....................................................................................................... 2
Best-in-Class Performance ..................................................................................... 2 Competitive Maturity Assessment ....................................................................... 2 Recommendations ................................................................................................... 2
Chapter One: Benchmarking the Best-in-Class .................................................... 4 The Business Needs to Obtain Better Insight into Product Behavior ........ 4 The Maturity Class Framework ............................................................................ 6 Best-in-Class Strategies ........................................................................................... 9
Chapter Two: Benchmarking Requirements for Success ................................. 12 Capabilities and Enablers ...................................................................................... 12
Chapter Three: Recommendations ....................................................................... 16 Appendix A: Research Methodology ..................................................................... 17 Appendix B: Related Aberdeen Research ............................................................ 18
Figures Figure 1: Top Business Pressures Driving a Better Understanding of Product Behavior ........................................................................................................................... 5 Figure 2: Design Engineer's Top Challenges of Understanding Product Behavior ........................................................................................................................... 6 Figure 3: Additional Benefits Since Implementing Current Approach for Assessing Product Behavior ........................................................................................ 8 Figure 4: Best-in-Class Enjoy a Higher Percent Increase in Profit Margins for New Products ................................................................................................................ 9 Figure 5: Strategies Leading to Better Design Decisions ................................... 10 Figure 6: Biggest Impact if CFD Was Not Used by Design Engineers ........... 11 Figure 7: How the Best-in-Class Help Design Engineers Get It Right the First Time................................................................................................................................ 13 Figure 8: Best-in-Class Tools to Assess Product Behavior ............................... 14
Tables Table 1: Top Performers Earn Best-in-Class Status.............................................. 7 Table 2: Top 5 Most Useful CFD Functions for the Best-in-Class .................. 15
Optimizing Product Development Time with CFD as a Design Tool Page 4
© 2011 Aberdeen Group. Telephone: 617 854 5200 www.aberdeen.com Fax: 617 723 7897
Chapter One: Benchmarking the Best-in-Class
Aberdeen's Q1 2011 business review has found that the top strategy for manufacturers is to improve business execution. This means that currently companies are finding that many important business processes are not optimal and better methods for supporting business processes are needed. In order to improve the process of bringing new products to market, the top challenges must be understood. Aberdeen's October 2010 new product development report, NPD - the 2011 Growth Imperative: Optimizing Speed and Cost in New Product Development reveals that these top challenges are:
• Development schedules have been reduced (72%)
• Development projects are understaffed (43%)
This means that those involved in new product development must get the most from their existing resources in order to improve efficiency. How can the design engineer contribute to this high level strategy of the organization? One area of focus is understanding product behavior during the development cycle. Methods for assessing product behavior vary based on the product and its operating environment. Aberdeen's April 2011 report, Getting Product Design Right the First Time with CFD, found that Computational Fluid Dynamics (CFD) analysis has a significant positive impact on the development of products impacted by fluid flow and related physical phenomena (see sidebar). For that study, 704 companies that develop products impacted by the conditions assessed by CFD were evaluated. This report further explores the benefits of providing design engineers with CFD tools.
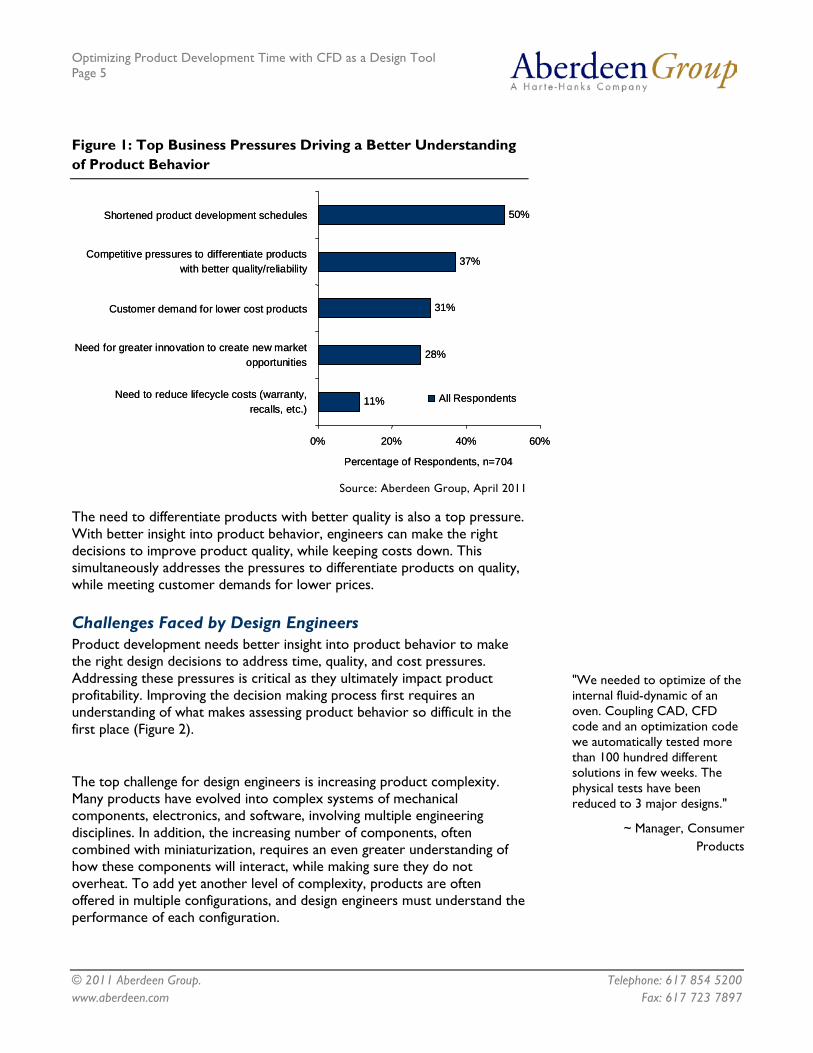
The Business Needs to Obtain Better Insight into Product Behavior Improving business execution first requires an understanding of the business pressures driving a better understanding of product behavior during the development process. Figure 1 shows these top pressures for companies whose products are impacted by the factors assessed by CFD analysis. Respondents were asked to pick the top two. The top pressures are time and quality, followed by cost.
Obtaining better insight into product behavior does consume more time early in the development cycle so it may seem like a counterintuitive step to take when trying to shorten design times. However, investing this time up front pays off in the end. With a greater understanding of how the final product will function, engineers can make more accurate design decisions throughout the development process. Not only does this lead to better designs, but problems can be caught and fixed early on, when it is easiest. Problems found later are much more difficult to address, and are likely to end up costing more to fix, as well as cause delays.
Definition of CFD
Computational Fluid Dynamics (CFD) is a specialized simulation that analyzes fluid flow. It can be used to assess both liquid and gas flows as well as their interactions. Depending on the application, CFD can be used to obtain better insight into:
Air / Gas flow Liquid flow Heating / Cooling Chemical reactions
/combustion Turbulence Other related physical
phenomena
Fast Facts
Since implementing their current process to assess product behavior, Best-in-Class companies have been able to:
√ Reduce development time by 28%
√ Lower product cost by 24%
√ Produce 23% fewer physical prototypes
Optimizing Product Development Time with CFD as a Design Tool Page 5
© 2011 Aberdeen Group. Telephone: 617 854 5200 www.aberdeen.com Fax: 617 723 7897
Figure 1: Top Business Pressures Driving a Better Understanding of Product Behavior
50%
37%
31%
28%
11%
0% 20% 40% 60%
Shortened product development schedules
Competitive pressures to differentiate productswith better quality/reliability
Customer demand for lower cost products
Need for greater innovation to create new marketopportunities
Need to reduce lifecycle costs (warranty,recalls, etc.)
Percentage of Respondents, n=704
All Respondents
Source: Aberdeen Group, April 2011
The need to differentiate products with better quality is also a top pressure. With better insight into product behavior, engineers can make the right decisions to improve product quality, while keeping costs down. This simultaneously addresses the pressures to differentiate products on quality, while meeting customer demands for lower prices.
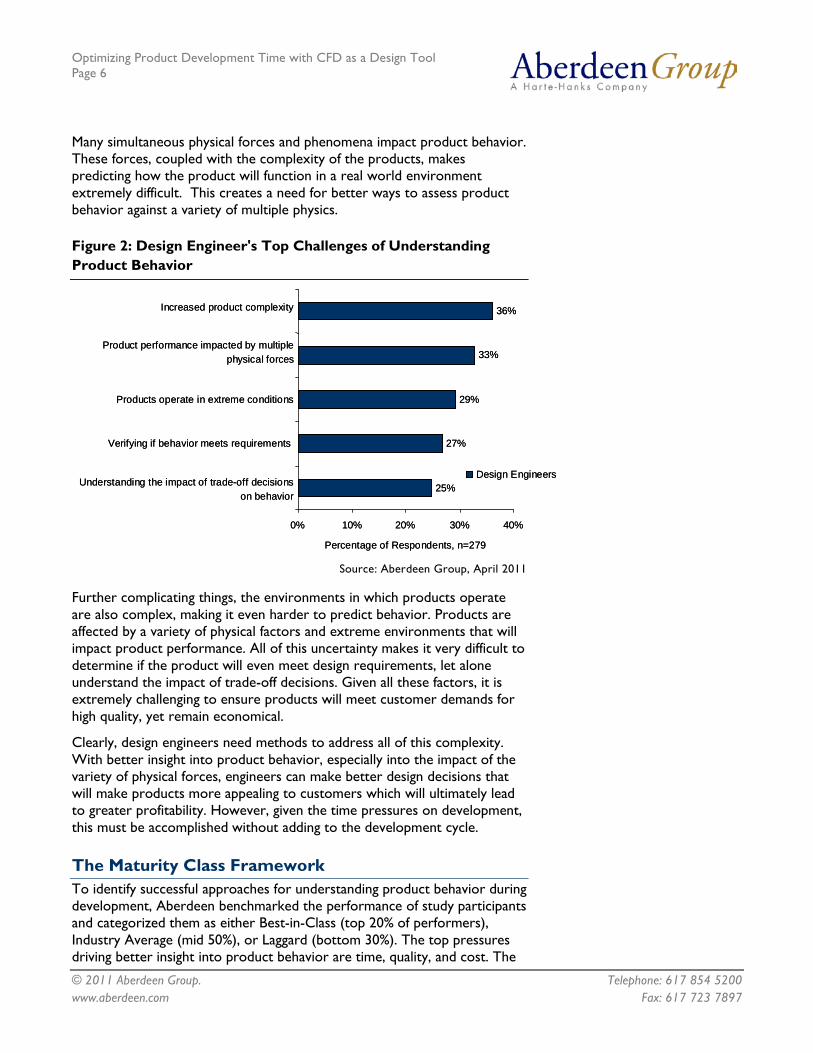
Challenges Faced by Design Engineers Product development needs better insight into product behavior to make the right design decisions to address time, quality, and cost pressures. Addressing these pressures is critical as they ultimately impact product profitability. Improving the decision making process first requires an understanding of what makes assessing product behavior so difficult in the first place (Figure 2).
The top challenge for design engineers is increasing product complexity. Many products have evolved into complex systems of mechanical components, electronics, and software, involving multiple engineering disciplines. In addition, the increasing number of components, often combined with miniaturization, requires an even greater understanding of how these components will interact, while making sure they do not overheat. To add yet another level of complexity, products are often offered in multiple configurations, and design engineers must understand the performance of each configuration.
"We needed to optimize of the internal fluid-dynamic of an oven. Coupling CAD, CFD code and an optimization code we automatically tested more than 100 hundred different solutions in few weeks. The physical tests have been reduced to 3 major designs."
~ Manager, Consumer Products
Optimizing Product Development Time with CFD as a Design Tool Page 6
© 2011 Aberdeen Group. Telephone: 617 854 5200 www.aberdeen.com Fax: 617 723 7897
Many simultaneous physical forces and phenomena impact product behavior. These forces, coupled with the complexity of the products, makes predicting how the product will function in a real world environment extremely difficult. This creates a need for better ways to assess product behavior against a variety of multiple physics.
Figure 2: Design Engineer's Top Challenges of Understanding Product Behavior
36%
33%
29%
27%
25%
0% 10% 20% 30% 40%
Increased product complexity
Product performance impacted by multiplephysical forces
Products operate in extreme conditions
Verifying if behavior meets requirements
Understanding the impact of trade-off decisionson behavior
Percentage of Respondents, n=279
Design Engineers
Source: Aberdeen Group, April 2011
Further complicating things, the environments in which products operate are also complex, making it even harder to predict behavior. Products are affected by a variety of physical factors and extreme environments that will impact product performance. All of this uncertainty makes it very difficult to determine if the product will even meet design requirements, let alone understand the impact of trade-off decisions. Given all these factors, it is extremely challenging to ensure products will meet customer demands for high quality, yet remain economical.
Clearly, design engineers need methods to address all of this complexity. With better insight into product behavior, especially into the impact of the variety of physical forces, engineers can make better design decisions that will make products more appealing to customers which will ultimately lead to greater profitability. However, given the time pressures on development, this must be accomplished without adding to the development cycle.
The Maturity Class Framework To identify successful approaches for understanding product behavior during development, Aberdeen benchmarked the performance of study participants and categorized them as either Best-in-Class (top 20% of performers), Industry Average (mid 50%), or Laggard (bottom 30%). The top pressures driving better insight into product behavior are time, quality, and cost. The
Optimizing Product Development Time with CFD as a Design Tool Page 7
© 2011 Aberdeen Group. Telephone: 617 854 5200 www.aberdeen.com Fax: 617 723 7897
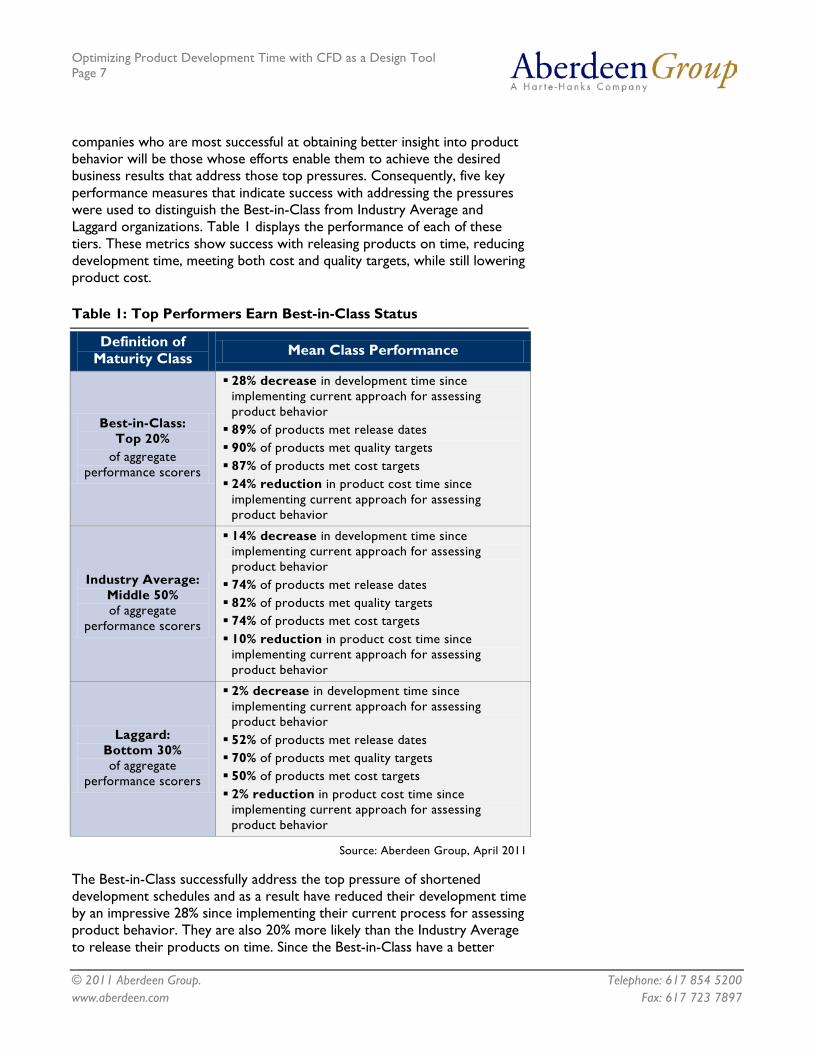
companies who are most successful at obtaining better insight into product behavior will be those whose efforts enable them to achieve the desired business results that address those top pressures. Consequently, five key performance measures that indicate success with addressing the pressures were used to distinguish the Best-in-Class from Industry Average and Laggard organizations. Table 1 displays the performance of each of these tiers. These metrics show success with releasing products on time, reducing development time, meeting both cost and quality targets, while still lowering product cost.
Table 1: Top Performers Earn Best-in-Class Status
Definition of Maturity Class Mean Class Performance
Best-in-Class: Top 20%
of aggregate performance scorers
28% decrease in development time since implementing current approach for assessing product behavior 89% of products met release dates 90% of products met quality targets 87% of products met cost targets 24% reduction in product cost time since
implementing current approach for assessing product behavior
Industry Average: Middle 50% of aggregate
performance scorers
14% decrease in development time since implementing current approach for assessing product behavior 74% of products met release dates 82% of products met quality targets 74% of products met cost targets 10% reduction in product cost time since
implementing current approach for assessing product behavior
Laggard: Bottom 30% of aggregate
performance scorers
2% decrease in development time since implementing current approach for assessing product behavior 52% of products met release dates 70% of products met quality targets 50% of products met cost targets 2% reduction in product cost time since
implementing current approach for assessing product behavior
Source: Aberdeen Group, April 2011
The Best-in-Class successfully address the top pressure of shortened development schedules and as a result have reduced their development time by an impressive 28% since implementing their current process for assessing product behavior. They are also 20% more likely than the Industry Average to release their products on time. Since the Best-in-Class have a better
Optimizing Product Development Time with CFD as a Design Tool Page 8
© 2011 Aberdeen Group. Telephone: 617 854 5200 www.aberdeen.com Fax: 617 723 7897
understanding of product behavior throughout the development process, they make better design decisions so are less likely to discover problems, such as overheating, later on, when product release dates can be at risk. Their up-front work gives them a deeper understanding of the product and key factors that impact performance, saving time later in the development process.
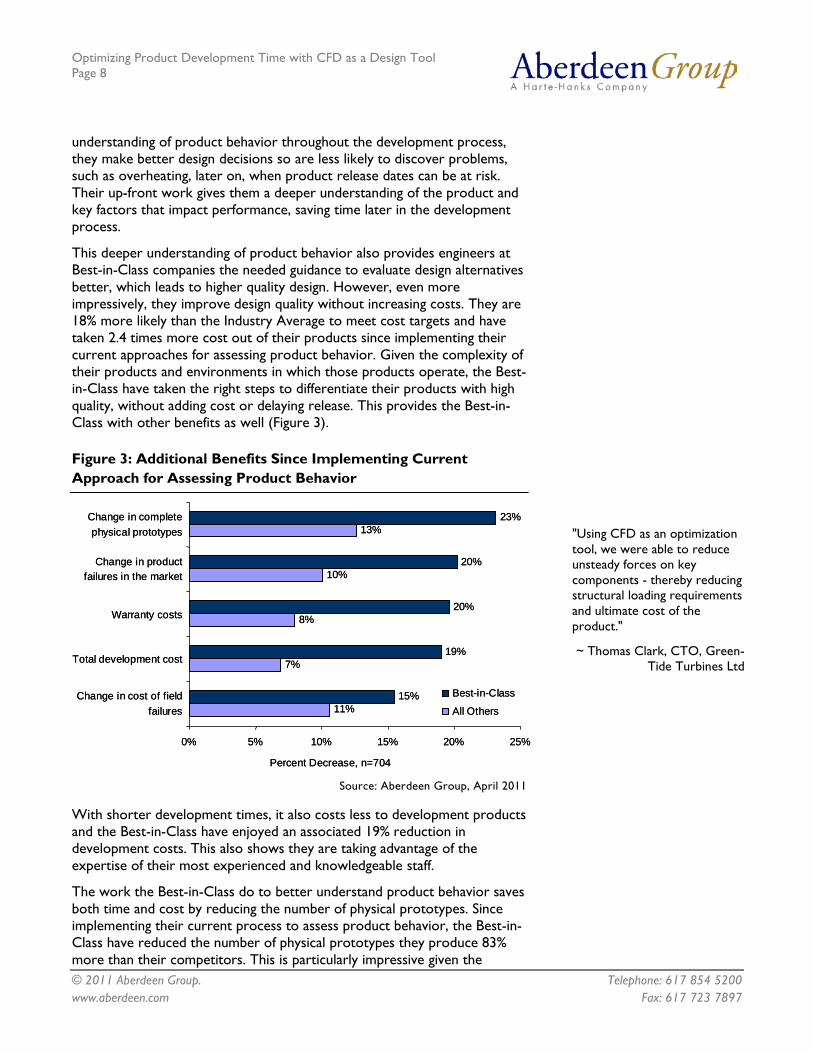
This deeper understanding of product behavior also provides engineers at Best-in-Class companies the needed guidance to evaluate design alternatives better, which leads to higher quality design. However, even more impressively, they improve design quality without increasing costs. They are 18% more likely than the Industry Average to meet cost targets and have taken 2.4 times more cost out of their products since implementing their current approaches for assessing product behavior. Given the complexity of their products and environments in which those products operate, the Best-in-Class have taken the right steps to differentiate their products with high quality, without adding cost or delaying release. This provides the Best-in-Class with other benefits as well (Figure 3).
Figure 3: Additional Benefits Since Implementing Current Approach for Assessing Product Behavior
23%
20%
20%
19%
15%
13%
10%
8%
7%
11%
0% 5% 10% 15% 20% 25%
Change in completephysical prototypes
Change in productfailures in the market
Warranty costs
Total development cost
Change in cost of fieldfailures
Percent Decrease, n=704
Best-in-Class
All Others
23%
20%
20%
19%
15%
13%
10%
8%
7%
11%
0% 5% 10% 15% 20% 25%
Change in completephysical prototypes
Change in productfailures in the market
Warranty costs
Total development cost
Change in cost of fieldfailures
Percent Decrease, n=704
Best-in-Class
All Others
Source: Aberdeen Group, April 2011
With shorter development times, it also costs less to development products and the Best-in-Class have enjoyed an associated 19% reduction in development costs. This also shows they are taking advantage of the expertise of their most experienced and knowledgeable staff.
The work the Best-in-Class do to better understand product behavior saves both time and cost by reducing the number of physical prototypes. Since implementing their current process to assess product behavior, the Best-in-Class have reduced the number of physical prototypes they produce 83% more than their competitors. This is particularly impressive given the
"Using CFD as an optimization tool, we were able to reduce unsteady forces on key components - thereby reducing structural loading requirements and ultimate cost of the product."
~ Thomas Clark, CTO, Green-Tide Turbines Ltd
Optimizing Product Development Time with CFD as a Design Tool Page 9
© 2011 Aberdeen Group. Telephone: 617 854 5200 www.aberdeen.com Fax: 617 723 7897
increasing product complexity and number of variables impacting performance in the real world. This reduction in physical prototypes has not hurt quality, as evidenced by the Best-in-Class's ability to meet quality targets.
Best-in-Class organizations' ability to meet quality targets not only provides valuable brand differentiation, it also saves costs later on. The Best-in-Class have reduced the number of field failures by 20%, which is related to the 15% reduction in the cost of field failures and a 20% reduction in warranty costs.
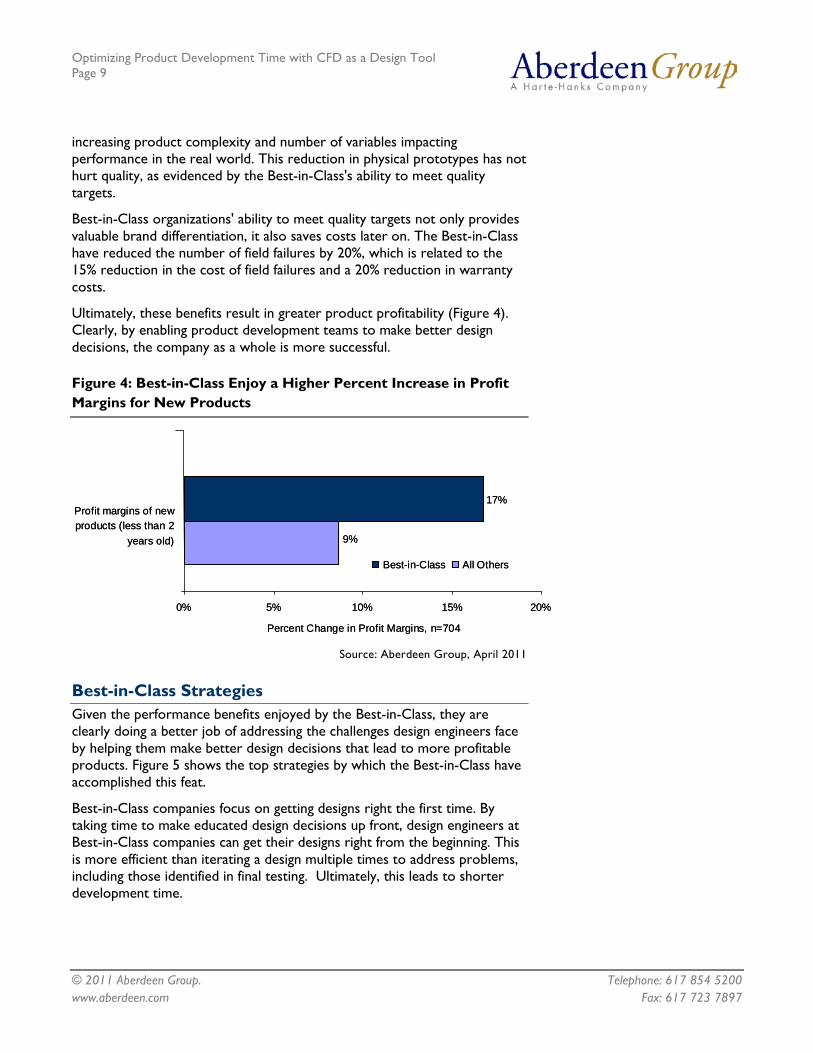
Ultimately, these benefits result in greater product profitability (Figure 4). Clearly, by enabling product development teams to make better design decisions, the company as a whole is more successful.
Figure 4: Best-in-Class Enjoy a Higher Percent Increase in Profit Margins for New Products
17%
9%
0% 5% 10% 15% 20%
Profit margins of newproducts (less than 2
years old)
Percent Change in Profit Margins, n=704
Best-in-Class All Others
17%
9%
0% 5% 10% 15% 20%
Profit margins of newproducts (less than 2
years old)
Percent Change in Profit Margins, n=704
Best-in-Class All Others
Source: Aberdeen Group, April 2011
Best-in-Class Strategies Given the performance benefits enjoyed by the Best-in-Class, they are clearly doing a better job of addressing the challenges design engineers face by helping them make better design decisions that lead to more profitable products. Figure 5 shows the top strategies by which the Best-in-Class have accomplished this feat.
Best-in-Class companies focus on getting designs right the first time. By taking time to make educated design decisions up front, design engineers at Best-in-Class companies can get their designs right from the beginning. This is more efficient than iterating a design multiple times to address problems, including those identified in final testing. Ultimately, this leads to shorter development time.

Optimizing Product Development Time with CFD as a Design Tool Page 10
© 2011 Aberdeen Group. Telephone: 617 854 5200 www.aberdeen.com Fax: 617 723 7897
Figure 5: Strategies Leading to Better Design Decisions
47%
43%
39%
32%
0% 20% 40% 60%
Implement a 'get it rightthe first time' strategy
Assess productbehavior against a
wider range of 'realworld' variables
Percentage of Respondents, n=704
Best-in-Class
All Others
47%
43%
39%
32%
0% 20% 40% 60%
Implement a 'get it rightthe first time' strategy
Assess productbehavior against a
wider range of 'realworld' variables
Percentage of Respondents, n=704
Best-in-Class
All Others
Source: Aberdeen Group, April 2011
The complexity of products, as well as the environments in which they operate, requires assessing requirements against a wider range of real world variables. The Best-in-Class are 33% more likely than their competitors to do this. This strategy also supports getting it right the first time as there is a better understanding of how a variety of variables will impact performance.
Aberdeen Insights — Strategy
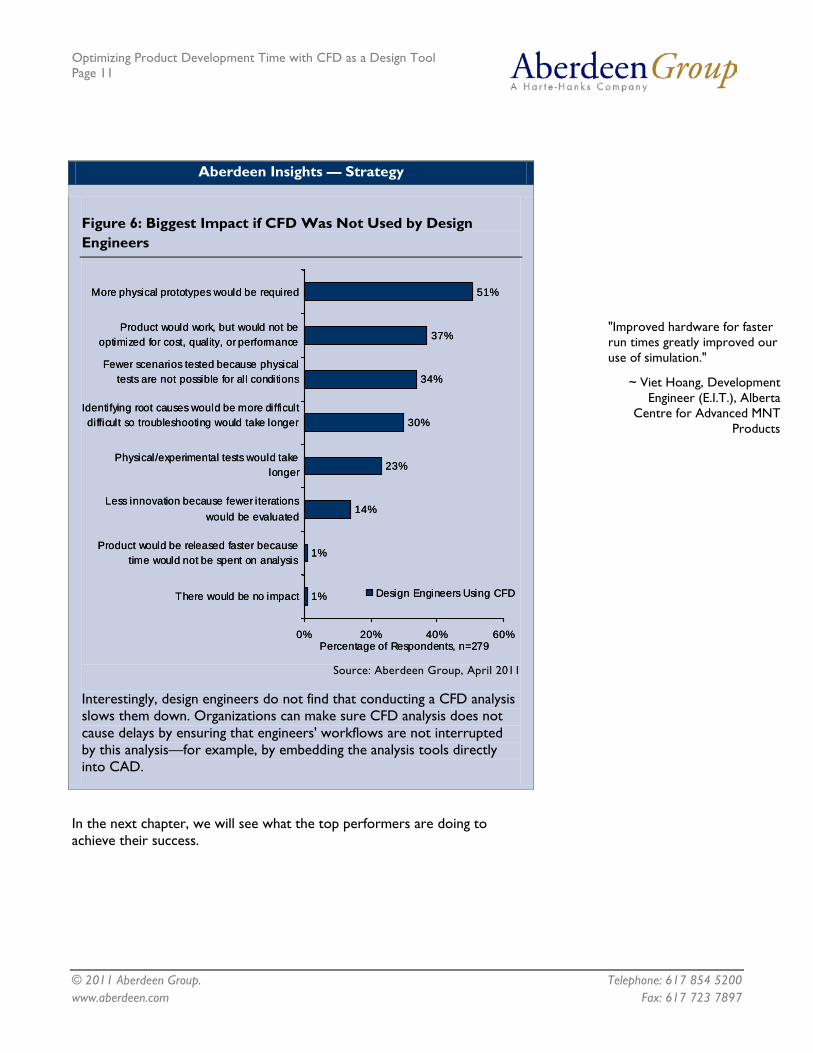
Clearly the strategies used by Best-in-Class companies provide a competitive advantage. The strategies demonstrate that it is important to take the right steps to ensure designs are right the first time and assess product behavior against a wider range of variables. This leads to the question, is CFD an important part of this strategy? Will products that are impacted by liquid and gas flow, heating and cooling, chemical reactions, turbulence, and other related physical phenomena benefit from a CFD analysis? To understand this design engineers were asked the two biggest impacts if CFD was not used. The results are seen in Figure 6.
The vast majority of design engineers, 98%, report value in using CFD. Design engineers find that concurrent CFD during the design phase helps them with testing because they test more design ideas in a virtual environment. As a result, they can bring greater innovation to their products while still being more likely to meet launch dates and quality targets. In addition, they find that concurrent design with CFD analysis tools truly helps them optimize the product design, because CFD results guide engineers to make better design decisions throughout the design phase. Ultimately, this leads to greater product profitability.
continued
Optimizing Product Development Time with CFD as a Design Tool Page 11
© 2011 Aberdeen Group. Telephone: 617 854 5200 www.aberdeen.com Fax: 617 723 7897
Aberdeen Insights — Strategy
Figure 6: Biggest Impact if CFD Was Not Used by Design Engineers
51%
37%
34%
30%
23%
14%
1%
1%
0% 20% 40% 60%
More physical prototypes would be required
Product would work, but would not beoptimized for cost, quality, or performance
Fewer scenarios tested because physicaltests are not possible for all conditions
Identifying root causes would be more difficultdifficult so troubleshooting would take longer
Physical/experimental tests would takelonger
Less innovation because fewer iterationswould be evaluated
Product would be released faster becausetime would not be spent on analysis
There would be no impact
Percentage of Respondents, n=279
Design Engineers Using CFD
Source: Aberdeen Group, April 2011
Interestingly, design engineers do not find that conducting a CFD analysis slows them down. Organizations can make sure CFD analysis does not cause delays by ensuring that engineers' workflows are not interrupted by this analysis—for example, by embedding the analysis tools directly into CAD.
In the next chapter, we will see what the top performers are doing to achieve their success.
"Improved hardware for faster run times greatly improved our use of simulation."
~ Viet Hoang, Development Engineer (E.I.T.), Alberta
Centre for Advanced MNT Products
Optimizing Product Development Time with CFD as a Design Tool Page 12
© 2011 Aberdeen Group. Telephone: 617 854 5200 www.aberdeen.com Fax: 617 723 7897
Chapter Two: Benchmarking Requirements for Success
Chapter One demonstrated the pressures driving companies to improve their understanding of product behavior during development, and the challenges associated with improving this understanding. It also described the performance benefits associated with successful approaches for obtaining insight into product behavior early on, and the strategies used by the most successful companies. Chapter Two explores the capabilities and enabling technologies Best-in-Class companies use to execute those strategies. These tools and techniques allow the Best-in-Class to enjoy greater product profitability and a competitive advantage.
Case Study — Turbine Company
CFD has become critical to one turbine manufacturer's process. Production of a turbine is very costly and time-consuming, which has driven the use of CFD. A CFD Engineer at this company acknowledges, “CFD reduces the design cycle and cost, and enables optimization of the product. It allows us to optimize the aerodynamic performances, sometimes beyond what manufacturing can produce. Through its use, we are able to make design improvements that lead to cost savings and efficiency improvements.”
To achieve this optimization, CFD is used to evaluate many different configurations. Engineers can run simulations with various different component designs, and compare outputs. Setting consistent starting boundary conditions, such as ambient humidity, pressure, and temperature, across all configurations, is key to any such analysis.
“It would be cost prohibitive to build more than one physical prototype. Fortunately, the CFD results are so accurate and reliable, testing will be done on one prototype, made from a design found through CFD simulation, with greater confidence,” said the CFD Engineer.
Capabilities and Enablers Based on the strategies deployed to assess product behavior, Aberdeen’s analysis of the Best-in-Class reveals where companies must improve their ability to get it right the first time when fluid flow, heating and cooling, chemical reactions, or turbulence is involved.
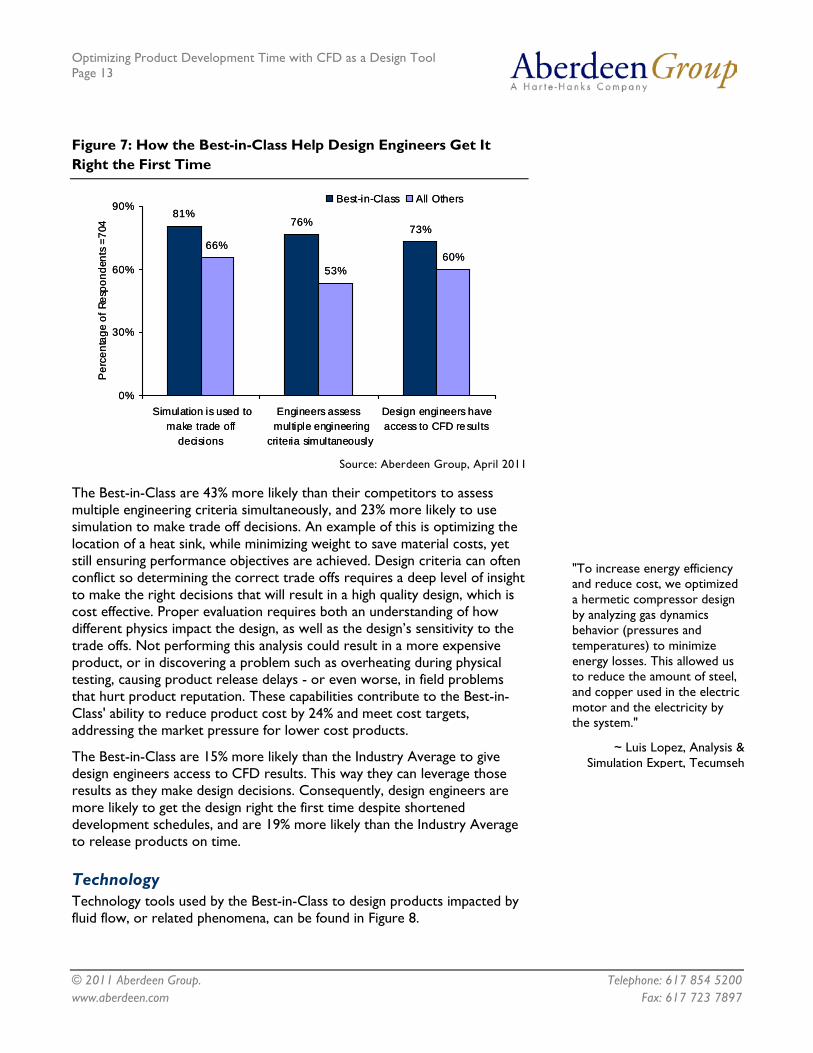
Process and Organizational Capabilities Figure 7 shows process and organizational capabilities implemented by the Best-in-Class to support their ability to get it right the first time.
Fast Facts
Compared to all competitors, the Best-in-Class are:
√ 22% more likely to pursue a ‘get it right the first time’ strategy
√ 44% more likely to use Computational Fluid Dynamics (CFD) results to promote collaboration between analysts and engineers
√ 32% more likely to evaluate what-if scenarios / Design of Experiments (DOE) using CFD analyses
Optimizing Product Development Time with CFD as a Design Tool Page 13
© 2011 Aberdeen Group. Telephone: 617 854 5200 www.aberdeen.com Fax: 617 723 7897
Figure 7: How the Best-in-Class Help Design Engineers Get It Right the First Time
81%76%
73%66%
53%60%
0%
30%
60%
90%
Simulation is used tomake trade off
decisions
Engineers assessmultiple engineering
criteria simultaneously
Design engineers haveaccess to CFD re sults
Per
cent
age
of R
espo
nden
ts =
704
Best-in-Class All Others81%
76%73%
66%
53%60%
0%
30%
60%
90%
Simulation is used tomake trade off
decisions
Engineers assessmultiple engineering
criteria simultaneously
Design engineers haveaccess to CFD re sults
Per
cent
age
of R
espo
nden
ts =
704
Best-in-Class All Others
Source: Aberdeen Group, April 2011
The Best-in-Class are 43% more likely than their competitors to assess multiple engineering criteria simultaneously, and 23% more likely to use simulation to make trade off decisions. An example of this is optimizing the location of a heat sink, while minimizing weight to save material costs, yet still ensuring performance objectives are achieved. Design criteria can often conflict so determining the correct trade offs requires a deep level of insight to make the right decisions that will result in a high quality design, which is cost effective. Proper evaluation requires both an understanding of how different physics impact the design, as well as the design’s sensitivity to the trade offs. Not performing this analysis could result in a more expensive product, or in discovering a problem such as overheating during physical testing, causing product release delays - or even worse, in field problems that hurt product reputation. These capabilities contribute to the Best-in-Class' ability to reduce product cost by 24% and meet cost targets, addressing the market pressure for lower cost products.
The Best-in-Class are 15% more likely than the Industry Average to give design engineers access to CFD results. This way they can leverage those results as they make design decisions. Consequently, design engineers are more likely to get the design right the first time despite shortened development schedules, and are 19% more likely than the Industry Average to release products on time.
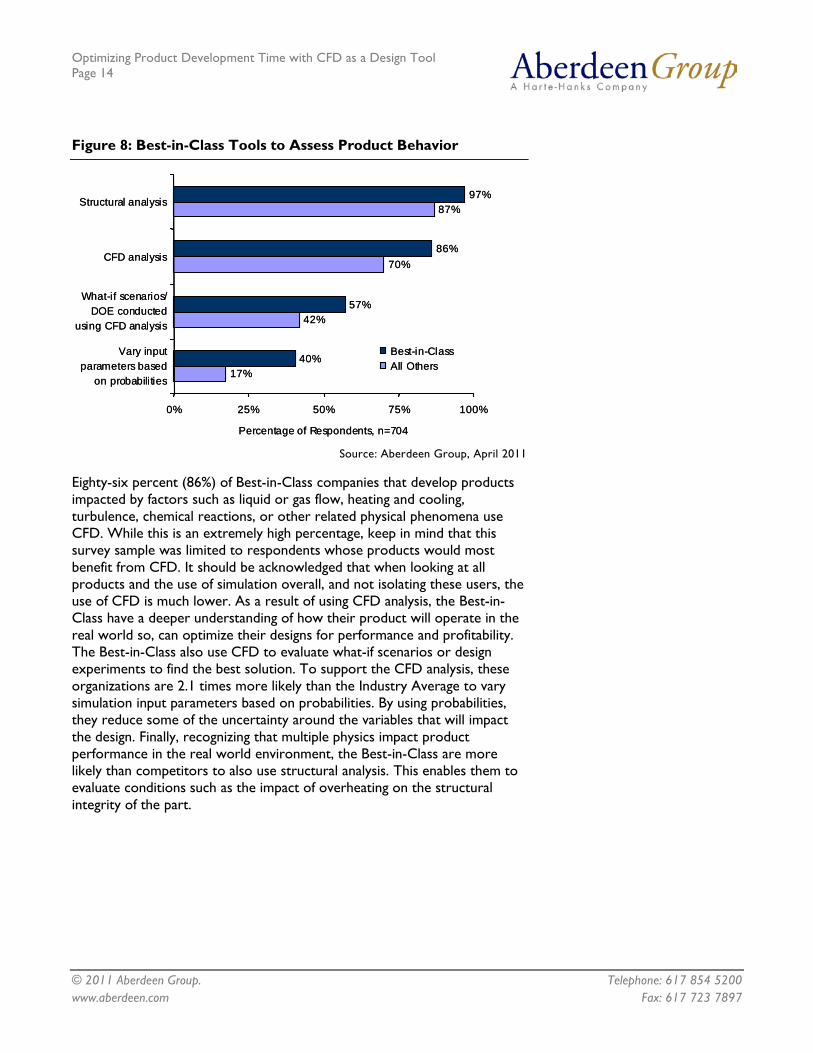
Technology Technology tools used by the Best-in-Class to design products impacted by fluid flow, or related phenomena, can be found in Figure 8.
"To increase energy efficiency and reduce cost, we optimized a hermetic compressor design by analyzing gas dynamics behavior (pressures and temperatures) to minimize energy losses. This allowed us to reduce the amount of steel, and copper used in the electric motor and the electricity by the system."
~ Luis Lopez, Analysis & Simulation Expert, Tecumseh
Optimizing Product Development Time with CFD as a Design Tool Page 14
© 2011 Aberdeen Group. Telephone: 617 854 5200 www.aberdeen.com Fax: 617 723 7897
Figure 8: Best-in-Class Tools to Assess Product Behavior
97%
86%
57%
40%
87%
70%
42%
17%
0% 25% 50% 75% 100%
Structural analysis
CFD analysis
What-if scenarios/DOE conducted
using CFD analysis
Vary inputparameters based
on probabilities
Percentage of Respondents, n=704
Best-in-ClassAll Others
97%
86%
57%
40%
87%
70%
42%
17%
0% 25% 50% 75% 100%
Structural analysis
CFD analysis
What-if scenarios/DOE conducted
using CFD analysis
Vary inputparameters based
on probabilities
Percentage of Respondents, n=704
Best-in-ClassAll Others
Source: Aberdeen Group, April 2011
Eighty-six percent (86%) of Best-in-Class companies that develop products impacted by factors such as liquid or gas flow, heating and cooling, turbulence, chemical reactions, or other related physical phenomena use CFD. While this is an extremely high percentage, keep in mind that this survey sample was limited to respondents whose products would most benefit from CFD. It should be acknowledged that when looking at all products and the use of simulation overall, and not isolating these users, the use of CFD is much lower. As a result of using CFD analysis, the Best-in-Class have a deeper understanding of how their product will operate in the real world so, can optimize their designs for performance and profitability. The Best-in-Class also use CFD to evaluate what-if scenarios or design experiments to find the best solution. To support the CFD analysis, these organizations are 2.1 times more likely than the Industry Average to vary simulation input parameters based on probabilities. By using probabilities, they reduce some of the uncertainty around the variables that will impact the design. Finally, recognizing that multiple physics impact product performance in the real world environment, the Best-in-Class are more likely than competitors to also use structural analysis. This enables them to evaluate conditions such as the impact of overheating on the structural integrity of the part.
Optimizing Product Development Time with CFD as a Design Tool Page 15
© 2011 Aberdeen Group. Telephone: 617 854 5200 www.aberdeen.com Fax: 617 723 7897
Aberdeen Insights — Technology
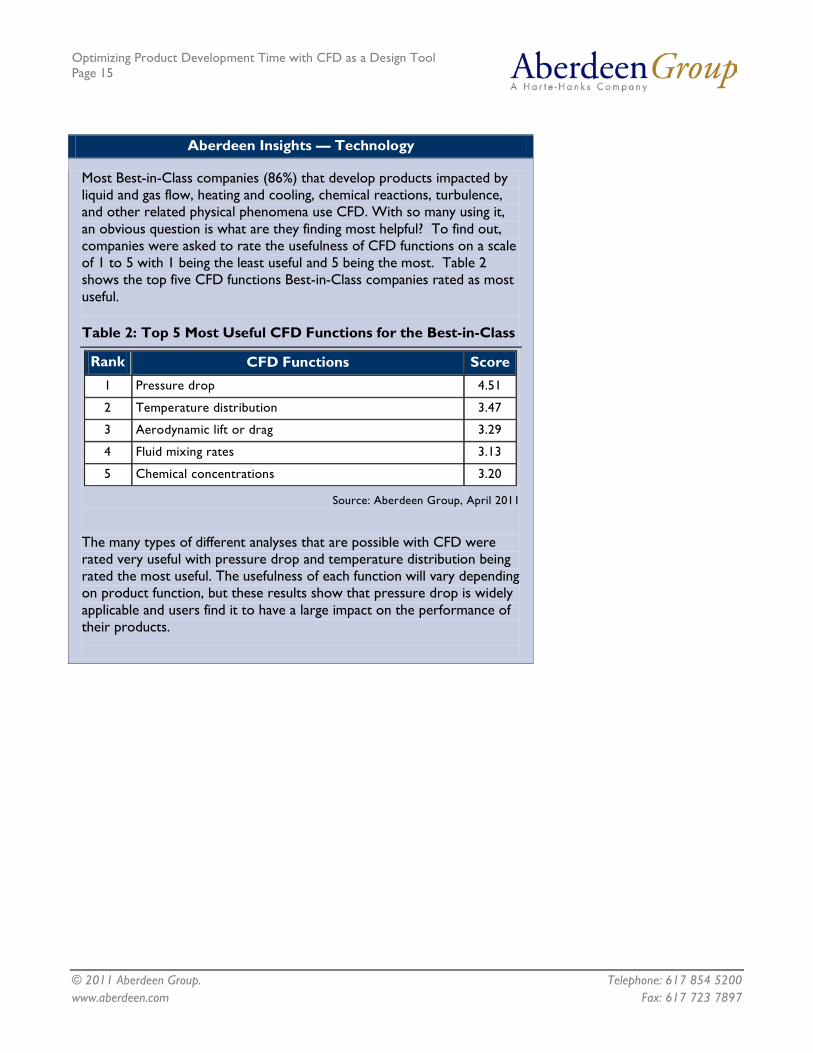
Most Best-in-Class companies (86%) that develop products impacted by liquid and gas flow, heating and cooling, chemical reactions, turbulence, and other related physical phenomena use CFD. With so many using it, an obvious question is what are they finding most helpful? To find out, companies were asked to rate the usefulness of CFD functions on a scale of 1 to 5 with 1 being the least useful and 5 being the most. Table 2 shows the top five CFD functions Best-in-Class companies rated as most useful.
Table 2: Top 5 Most Useful CFD Functions for the Best-in-Class
Rank CFD Functions Score 1 Pressure drop 4.51
2 Temperature distribution 3.47
3 Aerodynamic lift or drag 3.29
4 Fluid mixing rates 3.13
5 Chemical concentrations 3.20
Source: Aberdeen Group, April 2011
The many types of different analyses that are possible with CFD were rated very useful with pressure drop and temperature distribution being rated the most useful. The usefulness of each function will vary depending on product function, but these results show that pressure drop is widely applicable and users find it to have a large impact on the performance of their products.
Optimizing Product Development Time with CFD as a Design Tool Page 16
© 2011 Aberdeen Group. Telephone: 617 854 5200 www.aberdeen.com Fax: 617 723 7897
Chapter Three: Recommendations
CFD is an important design tool when products are impacted by liquid and gas flow, heating and cooling, chemical reactions, turbulence, and other related physical phenomena. The complexity of today's products as well as their operating environments makes assessing product behavior and function extremely challenging. In response, Best-in-Class companies use a variety of practices that allow them to get designs right the first time. As a result, they are more likely to bring products to market on time, with a lower product cost, and more likely to meet quality criteria. The Best-in-Class:
• Assess product behavior against a wider range of real world conditions
• Provide design engineers with access to CFD analysis results
• Use CFD to conduct what-if studies to support trade-off decisions
CFD analysis improves the accuracy with which real world behavior is assessed, helping engineers make better decisions that ultimately lead to more profitable products.
Optimizing Product Development Time with CFD as a Design Tool Page 17
© 2011 Aberdeen Group. Telephone: 617 854 5200 www.aberdeen.com Fax: 617 723 7897
Appendix A: Research Methodology
Between March and April 2011, Aberdeen examined the use, the experiences, and the intentions of more than 700 enterprises whose products are impacted by liquid or gas flow, heating and cooling chemical reactions turbulence, or other related physical phenomena.
Aberdeen supplemented this online survey effort with telephone interviews with select survey respondents, gathering additional information on CFD strategies, experiences, and results.
Responding enterprises included the following:
• Job title: The research sample included respondents with the following job titles: Executive level manager (6%); VP/Director (4%); Manager (19%); Engineers (56%); and other (15%).
• Industry: The research sample included respondents from a wide cross section of industries. The sectors that saw the largest representation in the sample were (some serve multiple industries): industrial equipment (19%), automotive (19%), aerospace and defense (18%), high tech (12%), oil/gas (11%), and military/public sector (9%).
• Geography: The majority of respondents (49%) were from North America. Remaining respondents were from the Europe (40%) Asia-Pacific region (9%) and the rest of the world (2%)
• Company size: Thirty percent (30%) of respondents were from large enterprises (annual revenues above US $1 billion); 38% were from midsize enterprises (annual revenues between $50 million and $1 billion); and 32% of respondents were from small businesses (annual revenues of $50 million or less).
• Headcount: Forty percent (40%) of respondents were from large enterprises (headcount greater than 1,000 employees); 30% were from midsize enterprises (headcount between 100 and 999 employees); and 20% of respondents were from small businesses (headcount between 1 and 99 employees).
Study Focus
Respondents completed an online survey that included questions designed to determine the following:
√ What is driving companies to improve how product behavior is assessed
√ The challenges of assessing product behavior
√ The actions these companies are taking to improve assessing product behavior
√ The capabilities and technology enablers they have in place to support product assessment
The study identifies emerging best practices to evaluate product behavior to make better design decisions and to provide a framework by which readers could assess their own capabilities.
Optimizing Product Development Time with CFD as a Design Tool Page 18
© 2011 Aberdeen Group. Telephone: 617 854 5200 www.aberdeen.com Fax: 617 723 7897
Appendix B: Related Aberdeen Research
Related Aberdeen research that forms a companion or reference to this report includes:
• Cost Saving Strategies for Engineering: Using Simulation to Make Better Decisions, April 2010
• Engineering Evolved: Getting Mechatronics Performance Right the First Time. November 2008
• Engineering Executive's Strategic Agenda, June, 2008
• Complementary Digital and Physical Prototyping Strategies: Avoiding the Product Development Crunch, February 2008
• System Design: New Product Development for Mechatronics,, January, 2008
• Engineering Decision Support, September 2007
• Simulation-Driven Design: Getting it Right the First Time, October, 2006
Information on these and any other Aberdeen publications can be found at www.aberdeen.com.
Authors: Michelle Boucher, Research Analyst, Product Innovation & Engineering Practice, ([email protected]);
For more than two decades, Aberdeen's research has been helping corporations worldwide become Best-in-Class. Having benchmarked the performance of more than 644,000 companies, Aberdeen is uniquely positioned to provide organizations with the facts that matter — the facts that enable companies to get ahead and drive results. That's why our research is relied on by more than 2.5 million readers in over 40 countries, 90% of the Fortune 1,000, and 93% of the Technology 500.
As a Harte-Hanks Company, Aberdeen’s research provides insight and analysis to the Harte-Hanks community of local, regional, national and international marketing executives. Combined, we help our customers leverage the power of insight to deliver innovative multichannel marketing programs that drive business-changing results. For additional information, visit Aberdeen http://www.aberdeen.com or call (617) 854-5200, or to learn more about Harte-Hanks, call (800) 456-9748 or go to http://www.harte-hanks.com.
This document is the result of primary research performed by Aberdeen Group. Aberdeen Group's methodologies provide for objective fact-based research and represent the best analysis available at the time of publication. Unless otherwise noted, the entire contents of this publication are copyrighted by Aberdeen Group, Inc. and may not be reproduced, distributed, archived, or transmitted in any form or by any means without prior written consent by Aberdeen Group, Inc. (2011a).