optimizing the e-business suite with real application ... · • concurrent manager ......
TRANSCRIPT

Ahmed AlomariPerformance Specialist
Optimizing the E-Business Suite with Real Application Clusters (RAC)

• Interconnect
• Concurrent Manager
• TNS Configuration
• Load Balancing
• Parallel Execution
• RAC Tuning
• Q & A
Agenda

Interconnect

Interconnect
• Ensure the topology of the Private Interconnect delivers high bandwidth & low latency.
DB node2 DB node3 DB node4DB node1
Private
Interconnect
Public Network
App node1 App node2 App node3
Shared Disk
Interconnect
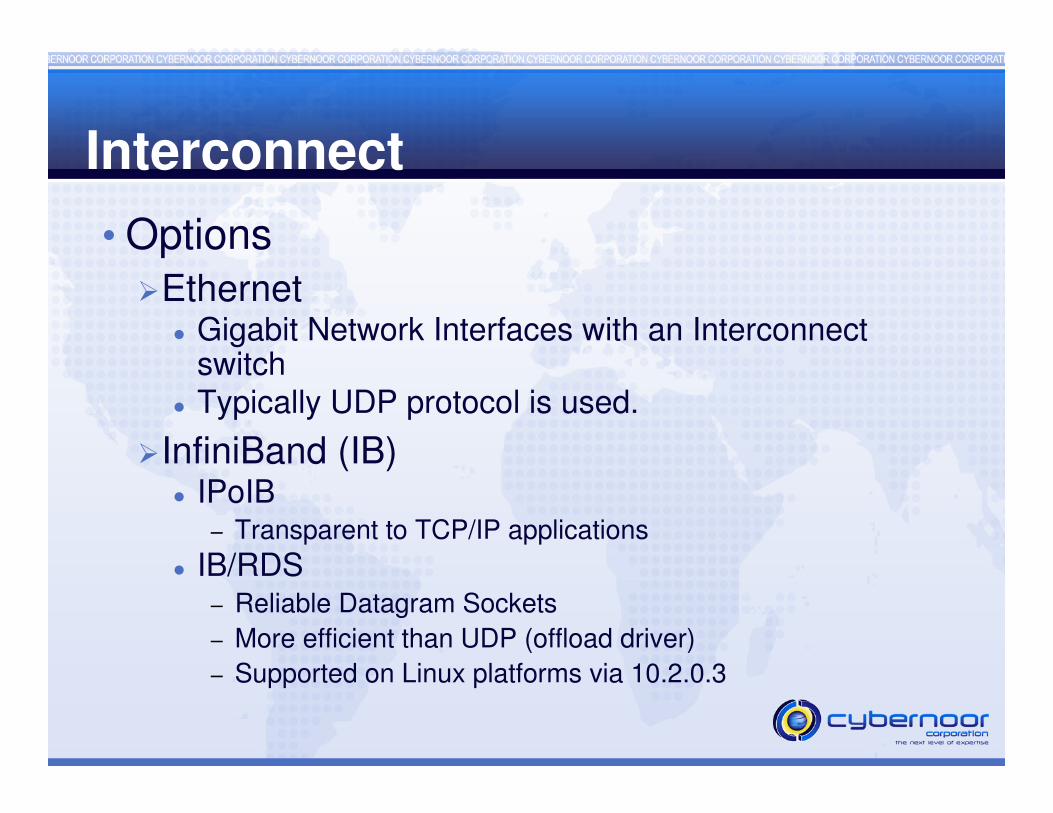
• Options�Ethernet
� Gigabit Network Interfaces with an Interconnect switch
� Typically UDP protocol is used.
�InfiniBand (IB)� IPoIB
– Transparent to TCP/IP applications
� IB/RDS– Reliable Datagram Sockets
– More efficient than UDP (offload driver)
– Supported on Linux platforms via 10.2.0.3
Interconnect
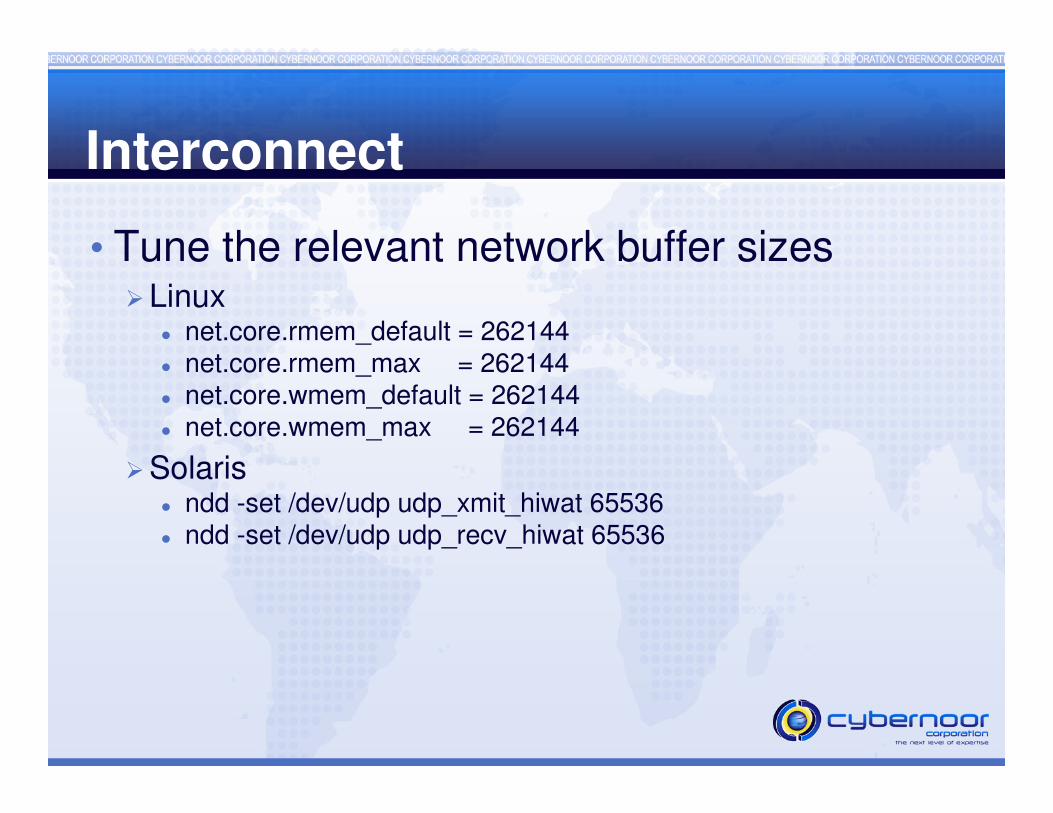
• Tune the relevant network buffer sizes�Linux
� net.core.rmem_default = 262144� net.core.rmem_max = 262144� net.core.wmem_default = 262144� net.core.wmem_max = 262144
�Solaris� ndd -set /dev/udp udp_xmit_hiwat 65536� ndd -set /dev/udp udp_recv_hiwat 65536

Interconnect
• Enable Jumbo Frames
�Increase MTU to ~9000� Minimizes number of packets needed to transfer
data blocks.
� Since Oracle Applications 11i requires an 8K block size, jumbo frames reduces the number of packets overall.
$ /sbin/ifconfig bond1
bond1 Link encap:Ethernet HWaddr 00:1E:4A:06:4E:8A
. . . . . .
UP BROADCAST RUNNING MASTER MULTICAST MTU:1500 Metric:1
$ ifconfig bond1 mtu 9000

Interconnect
• CE based interfaces (Sun/Solaris)�Disable the Task based queue.
� Improves latency by using interrupt based model.
/etc/system file:
set ce:ce_taskq_disable=1

Interconnect
• Monitor the Interconnect latency via ping to ensure optimal latencies.�Use an 8K ping packet size
{racnode1}-> ping racnode4-priv -s 8192 -c 10
PING racnode4-priv (10.10.21.8) 8192(8220) bytes of data.
8200 bytes from racnode4-priv (10.10.21.8): icmp_seq=0 ttl=64 time=0.585 ms
8200 bytes from racnode4-priv (10.10.21.8): icmp_seq=1 ttl=64 time=0.595 ms
8200 bytes from racnode4-priv (10.10.21.8): icmp_seq=2 ttl=64 time=0.567 ms
8200 bytes from racnode4-priv (10.10.21.8): icmp_seq=3 ttl=64 time=0.585 ms
8200 bytes from racnode4-priv (10.10.21.8): icmp_seq=4 ttl=64 time=0.607 ms
8200 bytes from racnode4-priv (10.10.21.8): icmp_seq=5 ttl=64 time=0.598 ms
8200 bytes from racnode4-priv (10.10.21.8): icmp_seq=6 ttl=64 time=0.402 ms
8200 bytes from racnode4-priv (10.10.21.8): icmp_seq=7 ttl=64 time=0.424 ms
8200 bytes from racnode4-priv (10.10.21.8): icmp_seq=8 ttl=64 time=0.509 ms
8200 bytes from racnode4-priv (10.10.21.8): icmp_seq=9 ttl=64 time=0.488 ms
Interconnect
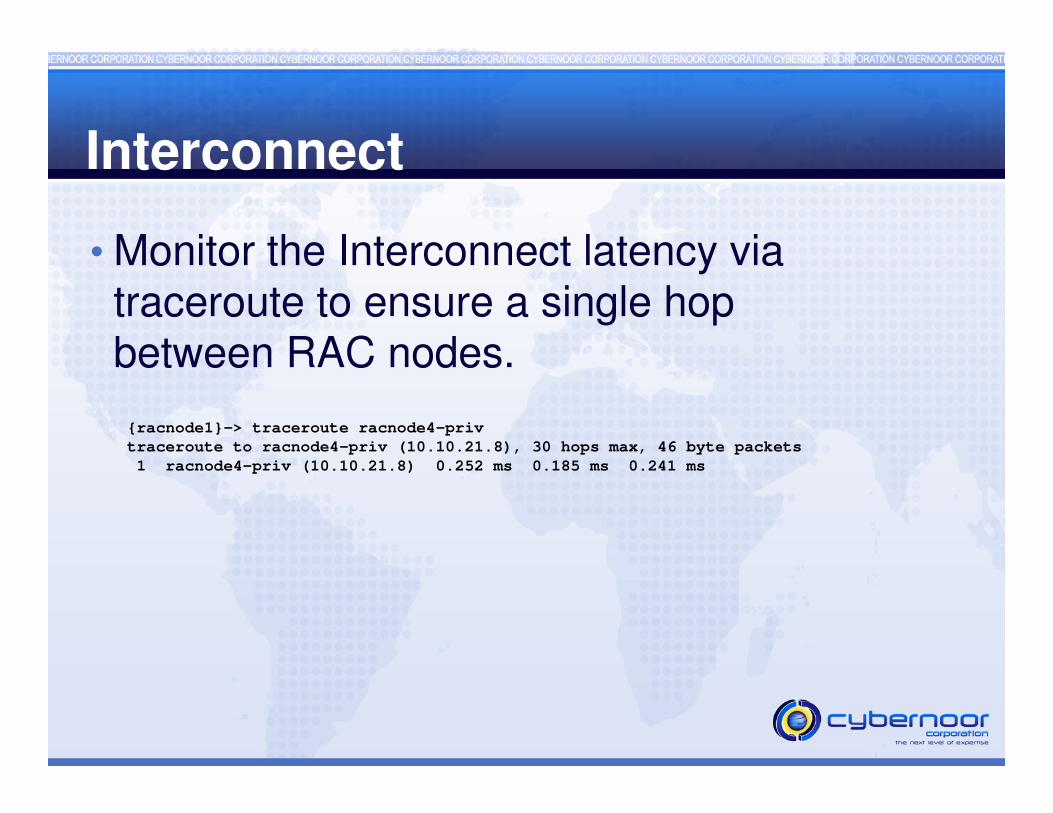
• Monitor the Interconnect latency via traceroute to ensure a single hop between RAC nodes.
{racnode1}-> traceroute racnode4-priv
traceroute to racnode4-priv (10.10.21.8), 30 hops max, 46 byte packets
1 racnode4-priv (10.10.21.8) 0.252 ms 0.185 ms 0.241 ms

Interconnect
• Monitor the Interconnect network traffic via sar or netstat
{racnode1}-> sar -n DEV 1 10 | grep eth4
11:09:57 PM IFACE rxpck/s txpck/s rxbyt/s txbyt/s rxcmp/s txcmp/s rxmcst/s
11:09:58 PM eth4 15.15 11.11 3082.83 1380.81 0.00 0.00 0.00
11:09:59 PM eth4 16.33 6.12 2425.51 1204.08 0.00 0.00 0.00
11:10:00 PM eth4 20.41 12.24 2340.82 9327.55 0.00 0.00 0.00
11:10:01 PM eth4 19.39 5.10 2677.55 880.61 0.00 0.00 0.00
11:10:02 PM eth4 86.60 77.32 9876.29 8917.53 0.00 0.00 0.00
11:10:03 PM eth4 348.98 311.22 74861.22 47782.65 0.00 0.00 0.00
11:10:04 PM eth4 24.49 18.37 2917.35 2867.35 0.00 0.00 0.00
11:10:05 PM eth4 39.80 17.35 4618.37 10250.00 0.00 0.00 0.00
11:10:06 PM eth4 38.38 20.20 4565.66 2574.75 0.00 0.00 0.00
11:10:07 PM eth4 121.65 112.37 34390.72 16051.55 0.00 0.00 0.00
Average: eth4 72.96 58.98 14138.27 10102.24 0.00 0.00 0.00
Interconnect
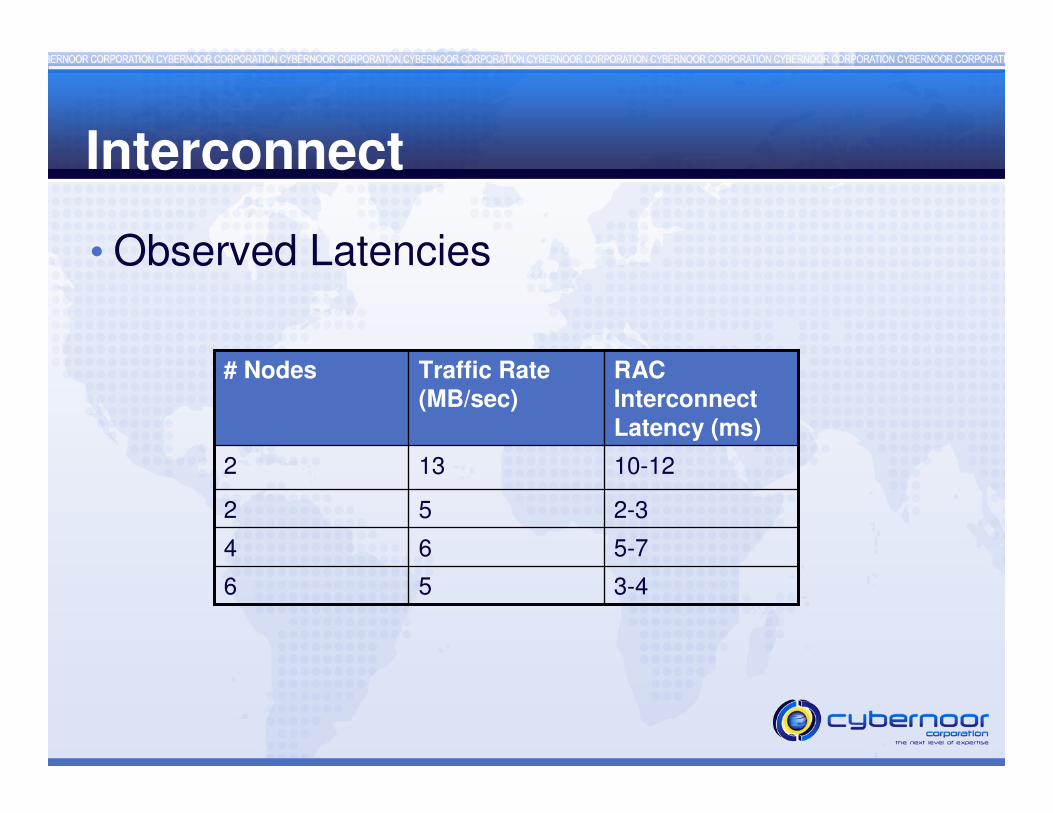
• Observed Latencies
3-456
5-764
2-352
10-12132
RAC Interconnect
Latency (ms)
Traffic Rate (MB/sec)
# Nodes
Interconnect
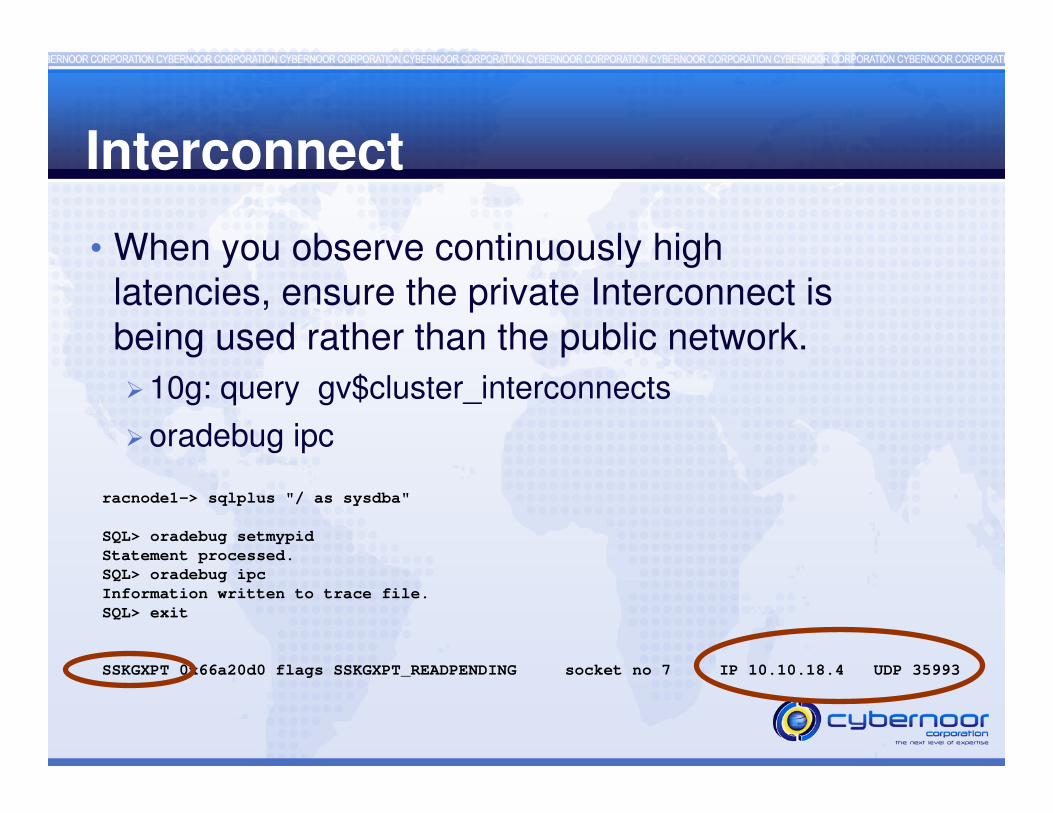
• When you observe continuously high latencies, ensure the private Interconnect is being used rather than the public network.
�10g: query gv$cluster_interconnects
�oradebug ipc
racnode1-> sqlplus "/ as sysdba"
SQL> oradebug setmypid
Statement processed.
SQL> oradebug ipc
Information written to trace file.
SQL> exit
SSKGXPT 0x66a20d0 flags SSKGXPT_READPENDING socket no 7 IP 10.10.18.4 UDP 35993
Interconnect
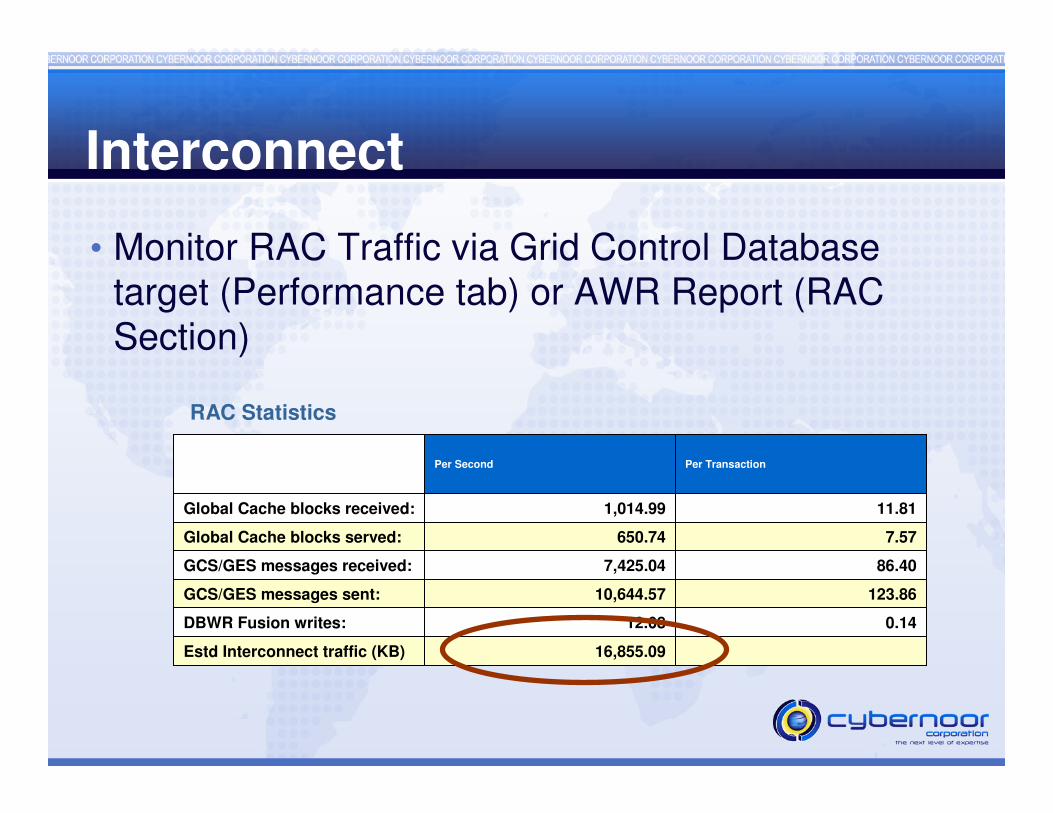
• Monitor RAC Traffic via Grid Control Database target (Performance tab) or AWR Report (RAC Section)
RAC Statistics
Global Cache Load Profile
16,855.09Estd Interconnect traffic (KB)
0.1412.08DBWR Fusion writes:
123.8610,644.57GCS/GES messages sent:
86.407,425.04GCS/GES messages received:
7.57650.74Global Cache blocks served:
11.811,014.99Global Cache blocks received:
Per TransactionPer Second

Concurrent Manager
Concurrent Manager
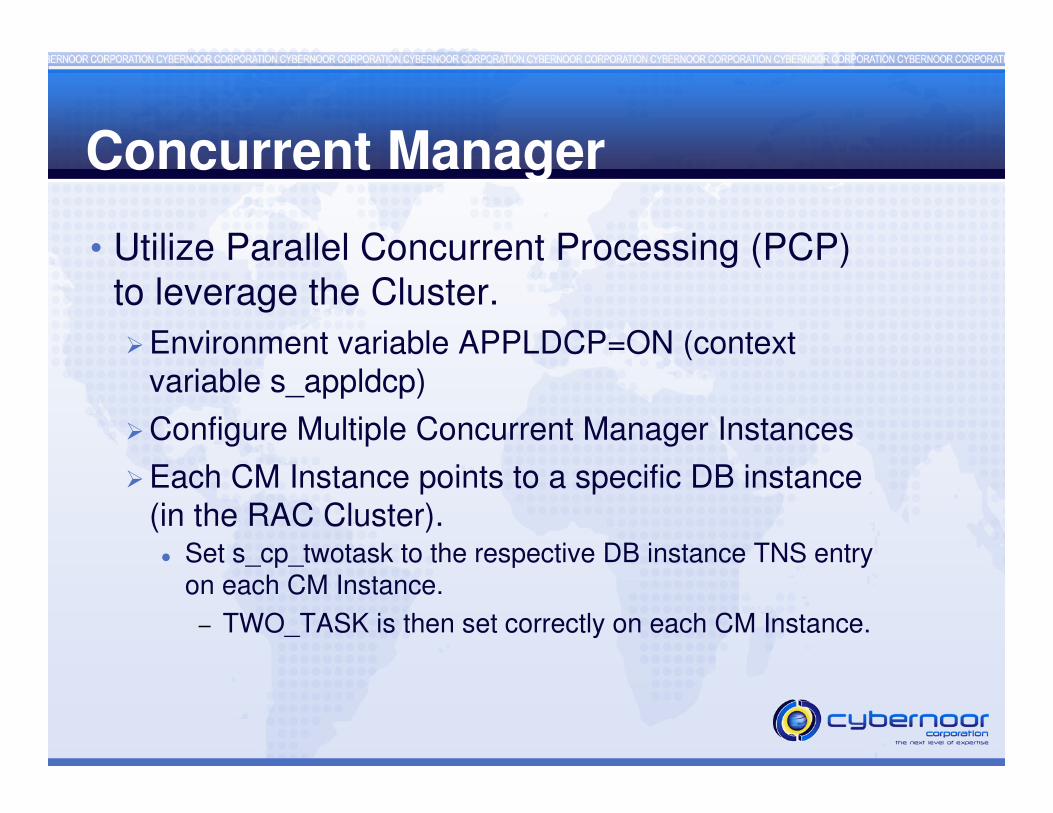
• Utilize Parallel Concurrent Processing (PCP) to leverage the Cluster.
�Environment variable APPLDCP=ON (context variable s_appldcp)
�Configure Multiple Concurrent Manager Instances
�Each CM Instance points to a specific DB instance (in the RAC Cluster).� Set s_cp_twotask to the respective DB instance TNS entry
on each CM Instance.
– TWO_TASK is then set correctly on each CM Instance.

Concurrent Manager
• Parallel Concurrent Processing (PCP)

Concurrent Manager
• Parallel Concurrent Processing (PCP)�Each CM Instance points to a specific DB instance
(in the RAC Cluster).� Certain Interfaces such as the Transaction Managers and
the Planning Manager utilize DB Pipes which requires these programs to be collocated.
� Do not use a load balanced TNS entry for the value of s_cp_twotask.
– The request may hang if the sessions are load balanced. Worker 1 connected to DB Instance 1 places a message in the pipe, and expects Worker 2 (which is connected to DB Instance 2) to consume the message. However, Worker 2 never gets the message since pipes are instance private.
Concurrent Manager
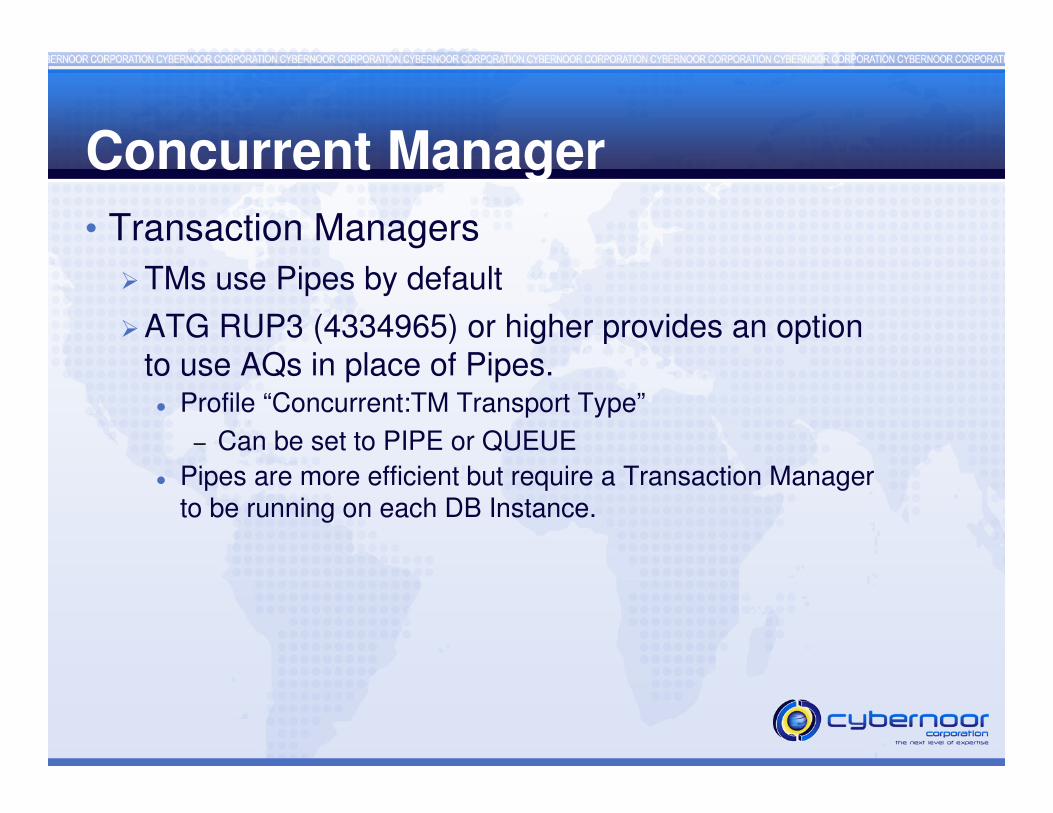
• Transaction Managers
�TMs use Pipes by default
�ATG RUP3 (4334965) or higher provides an option to use AQs in place of Pipes.� Profile “Concurrent:TM Transport Type”
– Can be set to PIPE or QUEUE
� Pipes are more efficient but require a Transaction Manager to be running on each DB Instance.

Concurrent Manager
• Employ Application affinity for concurrent manager jobs to minimize Interconnect traffic and maximize the performance of the concurrent request.
�Order Import request runs on Standard Manager1 which connects to DB Node1
�Workflow Background Engine which processes Order related Item types (OEOH and OEOL) should also be scheduled on DB Node 1 to avoid having to ship the OM related blocks to another node.

Concurrent Manager
• Example: Application Affinity
14,200
11,800
14,100
7,235
0
2,000
4,000
6,000
8,000
10,000
12,000
14,000
16,000
Colocated Different
Nodes
Order Import
WF Background

Concurrent Manager
• Application Affinity�Use Specialization Rules via Inclusion/Exclusion at
the Application level to implement affinity.
�Organize jobs first by Application, and then by dependency based on your knowledge of the Application usage.
�Example:� Order Import (Order Management)� Pick Release (Inventory)� Since one of the first major items of work of Pick release is to
fetch the “pickable” order lines, co-locating Pick Release with Order Import or Sales Order Creation minimizes Interconnect traffic.
Concurrent Manager
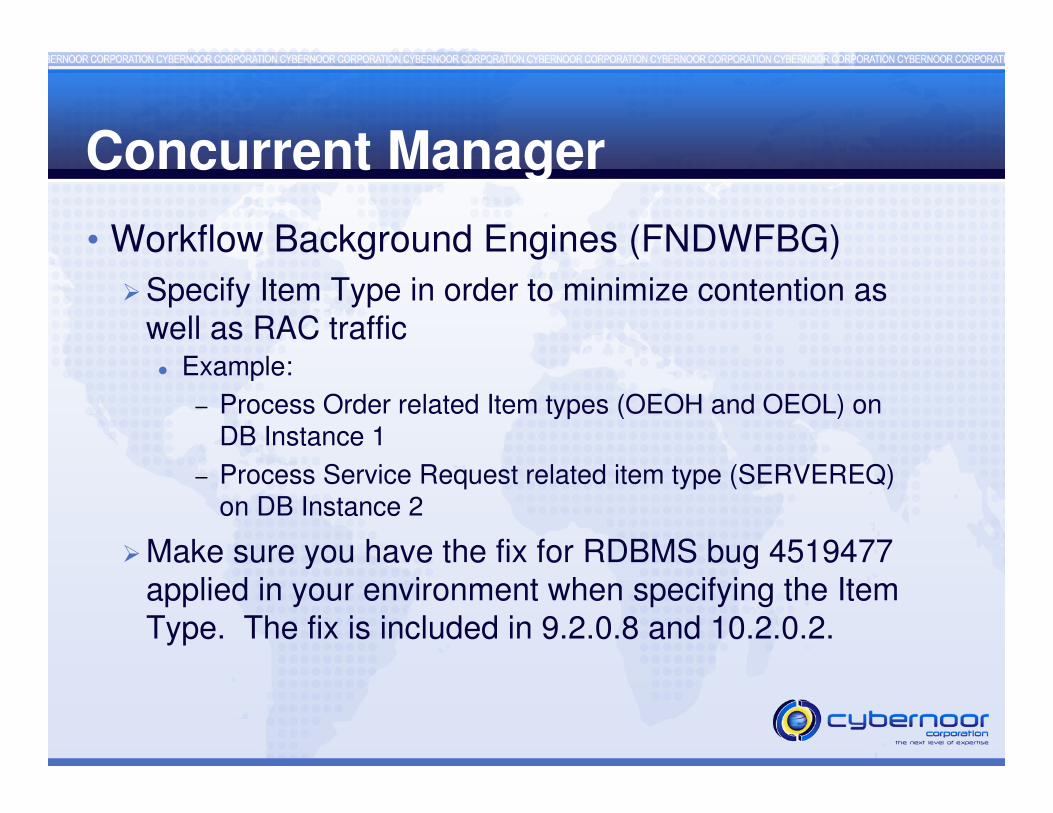
• Workflow Background Engines (FNDWFBG)
�Specify Item Type in order to minimize contention as well as RAC traffic� Example:
– Process Order related Item types (OEOH and OEOL) on DB Instance 1
– Process Service Request related item type (SERVEREQ) on DB Instance 2
�Make sure you have the fix for RDBMS bug 4519477 applied in your environment when specifying the Item Type. The fix is included in 9.2.0.8 and 10.2.0.2.
Concurrent Manager
• Tune the number of target processes per queue as well as the sleep time to avoid excessive lookups against fnd_concurrent_requests
• If the bulk of the system waits involve GC related waits on fnd_concurrent_requests and this time is a significant percentage of the overall DB time (i.e. > 10%), then the number of target processes and manager sleep times need to be revisited.
• Use a dedicated queue for short requests.

TNS Configuration

TNS Configuration
• Use Services in place of port/host/sid.
� Increases availability
�Leverages Server side load balancing
• Use VIP in the listener.ora and tnsnames.ora.
� Improves failover time
�Avoids long waits upon failover due to physical host TCP timeouts

TNS Configuration
• Use VIP in the listener.ora and tnsnames.ora
Listener.ora:
EBIZ_proddb3 =
(DESCRIPTION_LIST =
(DESCRIPTION =
(ADDRESS_LIST =
(ADDRESS = (PROTOCOL = TCP)(HOST = proddb3-vip)(PORT = 8521)(IP = FIRST)))
(ADDRESS_LIST =
(ADDRESS = (PROTOCOL = TCP)(HOST = proddb3)(PORT = 8521)(IP = FIRST)))
(ADDRESS_LIST =
(ADDRESS = (PROTOCOL = IPC)(KEY = EXTPROCEBIZ3)))
)
)
tnsnames.ora:
EBIZ=
(DESCRIPTION=
(ADDRESS=(PROTOCOL=tcp)(HOST=proddb3-vip)(PORT=8521))
(CONNECT_DATA=
(SERVICE_NAME=EBIZ)
(INSTANCE_NAME=EBIZ3)
))

Load Balancing
Load Balancing
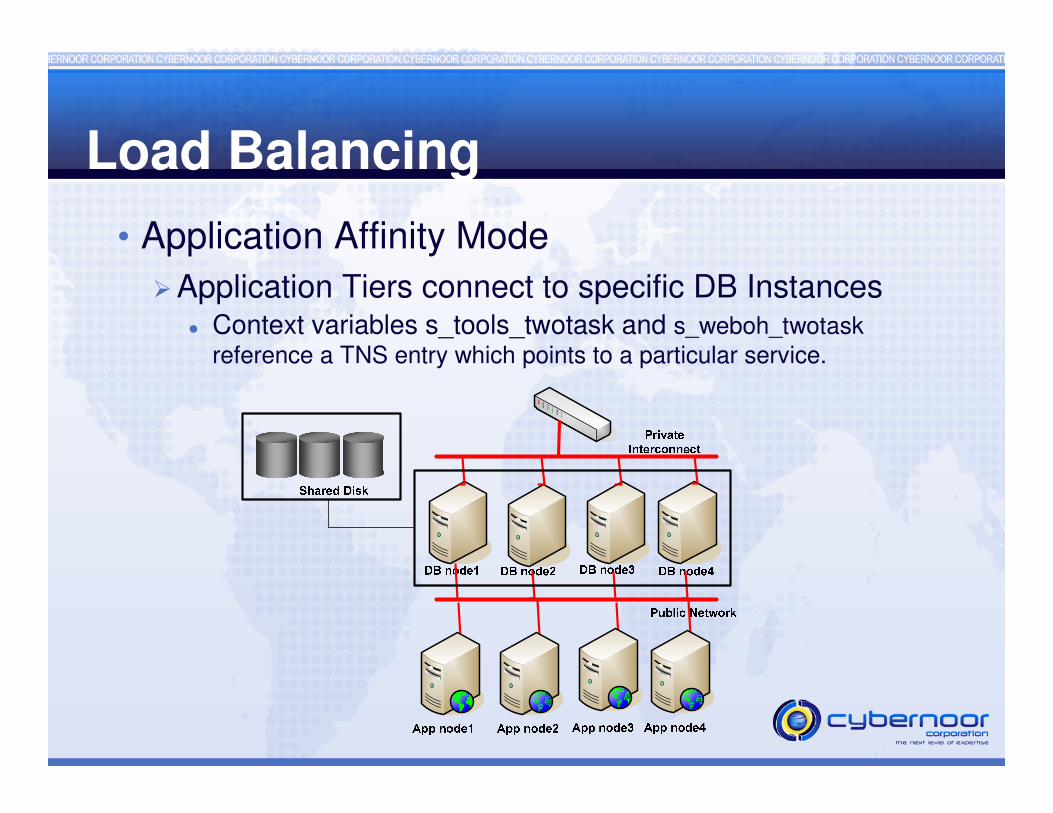
• Application Affinity Mode
�Application Tiers connect to specific DB Instances� Context variables s_tools_twotask and s_weboh_twotask
reference a TNS entry which points to a particular service.

Load Balancing
• Application Affinity Mode
�Application Tiers can also connect to specific DB Instances via profiles:� Applications Database ID
– Name of DBC file to be used for the Web Applications.
� Database Instance
– TNS entry to be used for Forms connections.

Load Balancing
• Application Affinity Mode
�Application Affinity can also be implemented at a higher level via the Agent related profiles.� Application Framework Agent
� Applications JSP Agent
� Apps Servlet Agent
� Applications Web Agent
� In this mode, the profiles can be set at the Application or Responsibility level to point to a specific set of web-tiers which then directly connect to specific Application/Responsibility specific services.
Load Balancing
• Application Affinity Mode
�Reduces RAC traffic caused by load balancing sessions across the Cluster.
�Shared pool utilization is specific to the modules being used per instance.� In the load balancing scenario, more PL/SQL packages and cursors
need to be loaded since all the code being used is being executed on all instances.
� Increases manual maintenance of profiles and Application/Responsibility mapping.

Load Balancing
• Load Balanced Mode
�Utilizes Server Side Load balancing via the init.ora parameters local_listener and remote_listener.� AutoConfig generates the load balanced TNS entries as
follows:
•EBIZ_BALANCE=
• (DESCRIPTION=
• (LOAD_BALANCE=YES)
• (FAILOVER=YES)
• (ADDRESS_LIST=
• (ADDRESS=(PROTOCOL=tcp)(HOST=proddb1-vip)(PORT=8521))
• (ADDRESS=(PROTOCOL=tcp)(HOST=proddb2-vip)(PORT=8521))
•)
• (CONNECT_DATA=
• (SERVICE_NAME=EBIZ)
• )
• )
Load Balancing
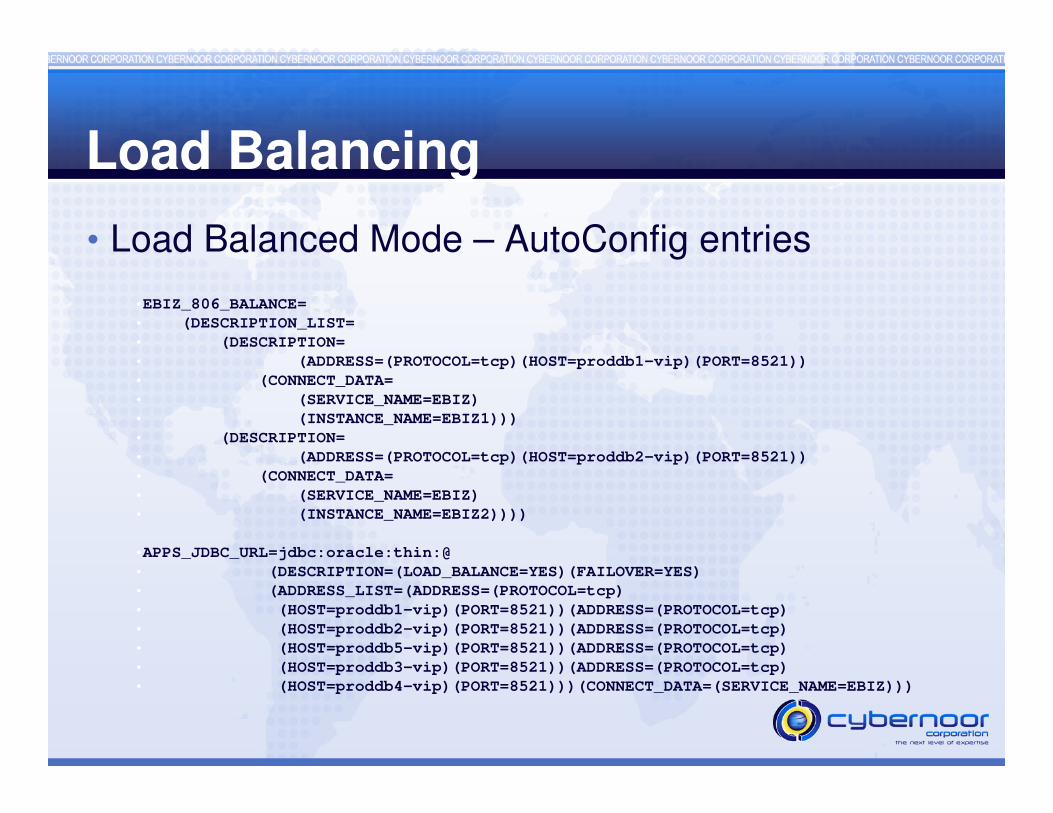
• Load Balanced Mode – AutoConfig entries
•EBIZ_806_BALANCE=
• (DESCRIPTION_LIST=
• (DESCRIPTION=
• (ADDRESS=(PROTOCOL=tcp)(HOST=proddb1-vip)(PORT=8521))
• (CONNECT_DATA=
• (SERVICE_NAME=EBIZ)
• (INSTANCE_NAME=EBIZ1)))
• (DESCRIPTION=
• (ADDRESS=(PROTOCOL=tcp)(HOST=proddb2-vip)(PORT=8521))
• (CONNECT_DATA=
• (SERVICE_NAME=EBIZ)
• (INSTANCE_NAME=EBIZ2))))
•APPS_JDBC_URL=jdbc:oracle:thin:@
• (DESCRIPTION=(LOAD_BALANCE=YES)(FAILOVER=YES)
• (ADDRESS_LIST=(ADDRESS=(PROTOCOL=tcp)
• (HOST=proddb1-vip)(PORT=8521))(ADDRESS=(PROTOCOL=tcp)
• (HOST=proddb2-vip)(PORT=8521))(ADDRESS=(PROTOCOL=tcp)
• (HOST=proddb5-vip)(PORT=8521))(ADDRESS=(PROTOCOL=tcp)
• (HOST=proddb3-vip)(PORT=8521))(ADDRESS=(PROTOCOL=tcp)
• (HOST=proddb4-vip)(PORT=8521)))(CONNECT_DATA=(SERVICE_NAME=EBIZ)))

Load Balancing
• Load Balanced Mode – AutoConfig entries�TWO_TASK on the Application tier hosts is set to the
_806_BALANCE entry such as EBIZ_806_BALANCE.� The _806_BALANCE entry uses the old 806 Client side load
balancing which results in connection skew.
�Edit the Forms startup script ($COMMON_TOP/admin/scripts/$CONTEXT_NAME/adfrmctl.sh) and add an entry for TWO_TASK� TWO_TASK=EBIZ_BALANCE� This allows Forms connections to utilize server side load
balancing and minimize the connection skew.
�Web based Java Applications correctly utilize server side load balancing via the _BALANCE TNS entry.

Parallel Execution

Parallel Execution
• Ensure PX requests do not span instances
�Set the init.ora parameters instance_groups and parallel_instance_group on each instance.� Example:
– Instance 1:
� instance_groups=EBIZ1
� parallel_instance_group=EBIZ1
– Instance 2:
� instance_groups=EBIZ2
� parallel_instance_group=EBIZ2
Parallel Execution
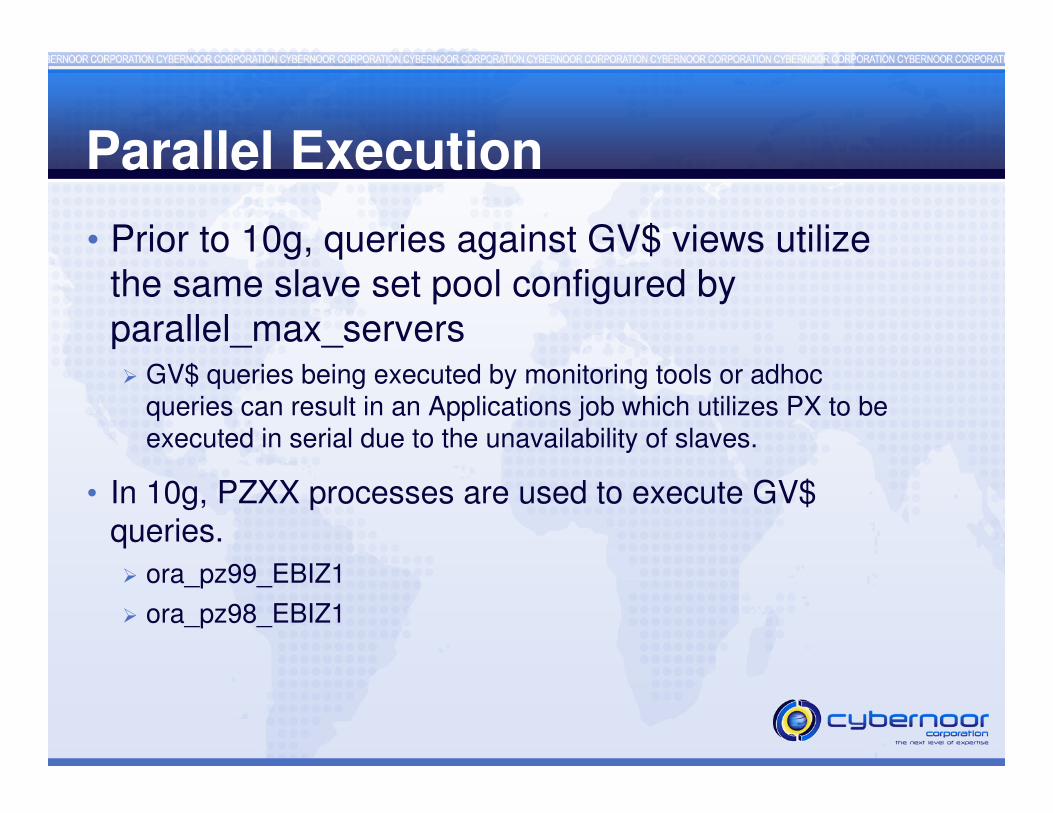
• Prior to 10g, queries against GV$ views utilize the same slave set pool configured by parallel_max_servers� GV$ queries being executed by monitoring tools or adhoc
queries can result in an Applications job which utilizes PX to be executed in serial due to the unavailability of slaves.
• In 10g, PZXX processes are used to execute GV$ queries.
� ora_pz99_EBIZ1
� ora_pz98_EBIZ1

Parallel Execution
• Minimize the use of ad-hoc GV$ queries.
• For ad-hoc queries, connect to the relevant instance if analyzing or debugging a specific issue involving a particular instance and use V$ views rather than GV$ views via a remote session.
Parallel Execution
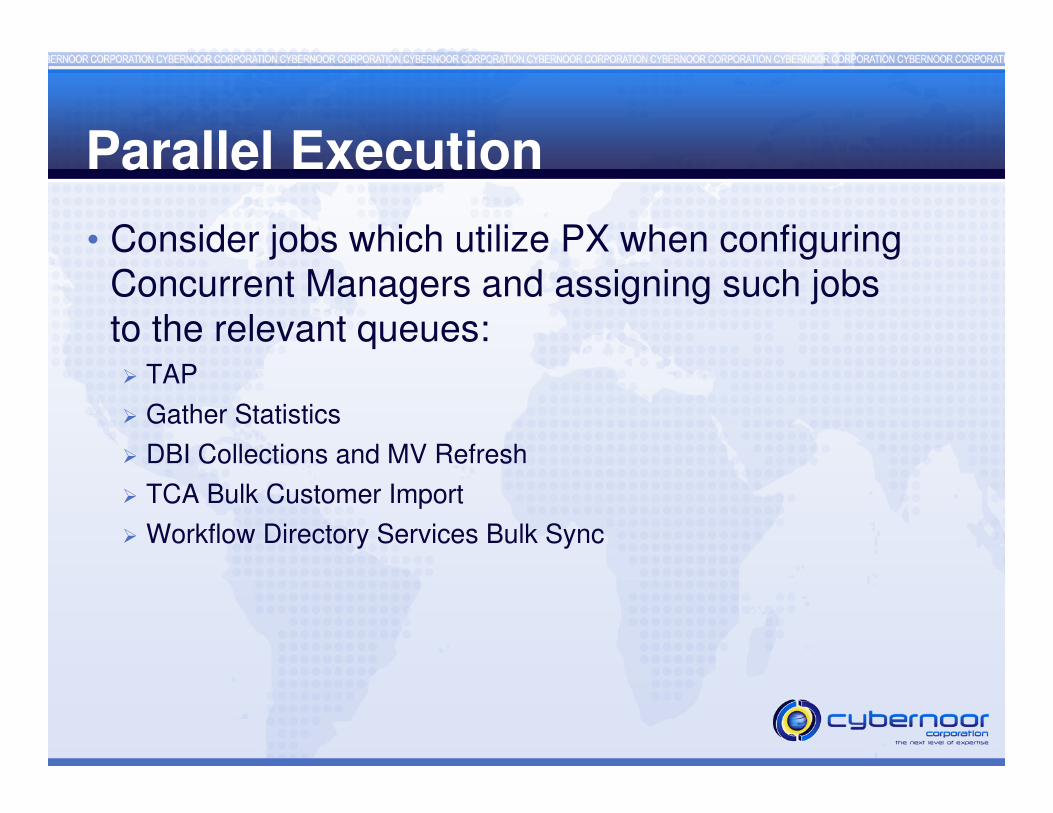
• Consider jobs which utilize PX when configuring Concurrent Managers and assigning such jobs to the relevant queues:� TAP
� Gather Statistics
� DBI Collections and MV Refresh
� TCA Bulk Customer Import
� Workflow Directory Services Bulk Sync

RAC Tuning

RAC Tuning
• Ensure the lms and lgwr processes are running in the real-time (RT) OS class.�priocntl (Solaris)
� renice (Linux)
• Use automatic segment management (ASSM) along with uniform extent sizes (e.g. 4 MB extent size) for tablespaces containing large transaction tables/indexes.�Helps avoid frequent space management operations.
�Ensure fix for 4074953 is present.
RAC Tuning
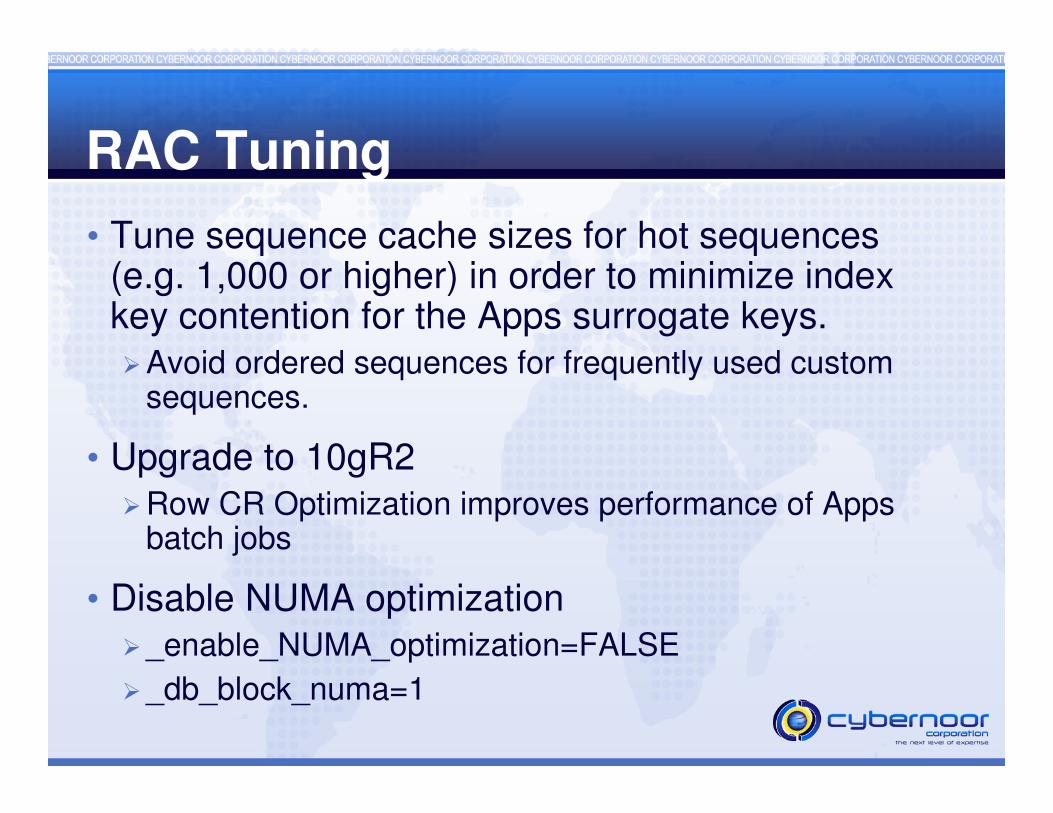
• Tune sequence cache sizes for hot sequences (e.g. 1,000 or higher) in order to minimize index key contention for the Apps surrogate keys.�Avoid ordered sequences for frequently used custom
sequences.
• Upgrade to 10gR2�Row CR Optimization improves performance of Apps
batch jobs
• Disable NUMA optimization�_enable_NUMA_optimization=FALSE
�_db_block_numa=1
RAC Tuning
• Use Broadcast on Commit Scheme
�9iR2: max_commit_propagation_delay=0
�10gR2: Default SCN propogation scheme� _immediate_commit_propagation = TRUE
� _lm_global_posts = TRUE
• Disable Dynamic Resource Mastering (DRM) if Application Affinity mode is being used.
�_gc_affinity_time=0
�_gc_undo_affinity=FALSE
RAC Tuning
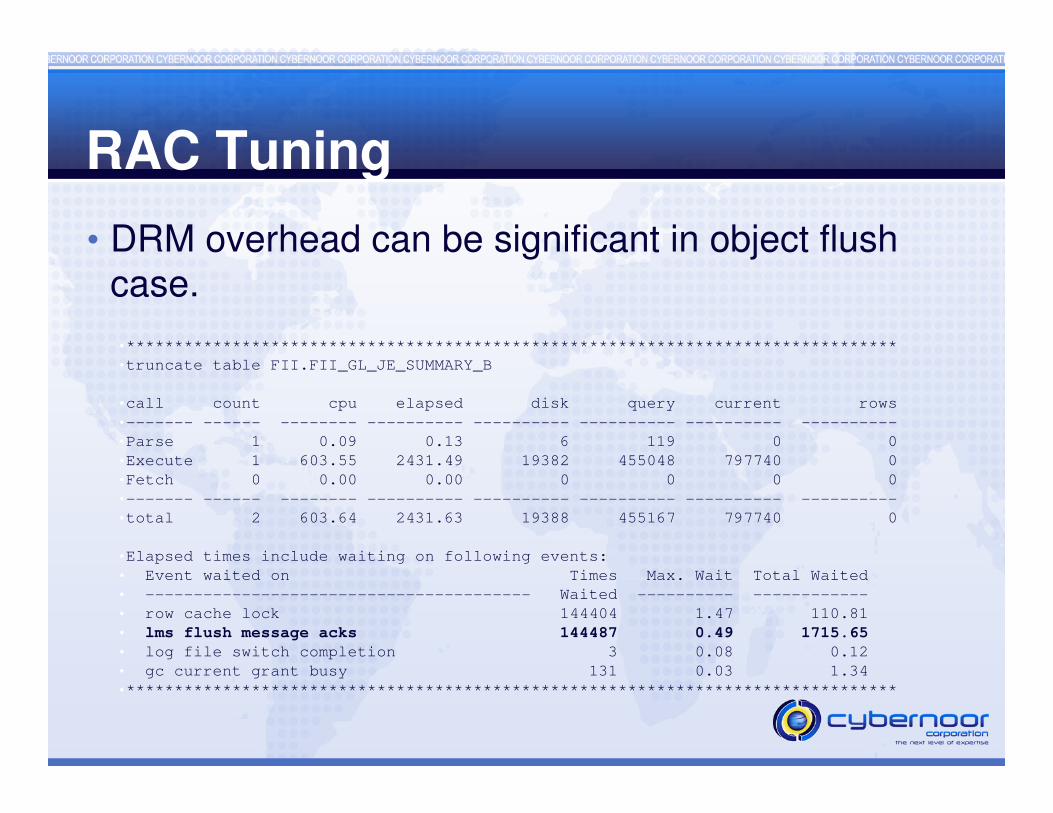
• DRM overhead can be significant in object flush case.
•********************************************************************************
•truncate table FII.FII_GL_JE_SUMMARY_B
•call count cpu elapsed disk query current rows
•------- ------ -------- ---------- ---------- ---------- ---------- ----------
•Parse 1 0.09 0.13 6 119 0 0
•Execute 1 603.55 2431.49 19382 455048 797740 0
•Fetch 0 0.00 0.00 0 0 0 0
•------- ------ -------- ---------- ---------- ---------- ---------- ----------
•total 2 603.64 2431.63 19388 455167 797740 0
•Elapsed times include waiting on following events:
• Event waited on Times Max. Wait Total Waited
• ---------------------------------------- Waited ---------- ------------
• row cache lock 144404 1.47 110.81
• lms flush message acks 144487 0.49 1715.65
• log file switch completion 3 0.08 0.12
• gc current grant busy 131 0.03 1.34
•********************************************************************************
RAC Tuning
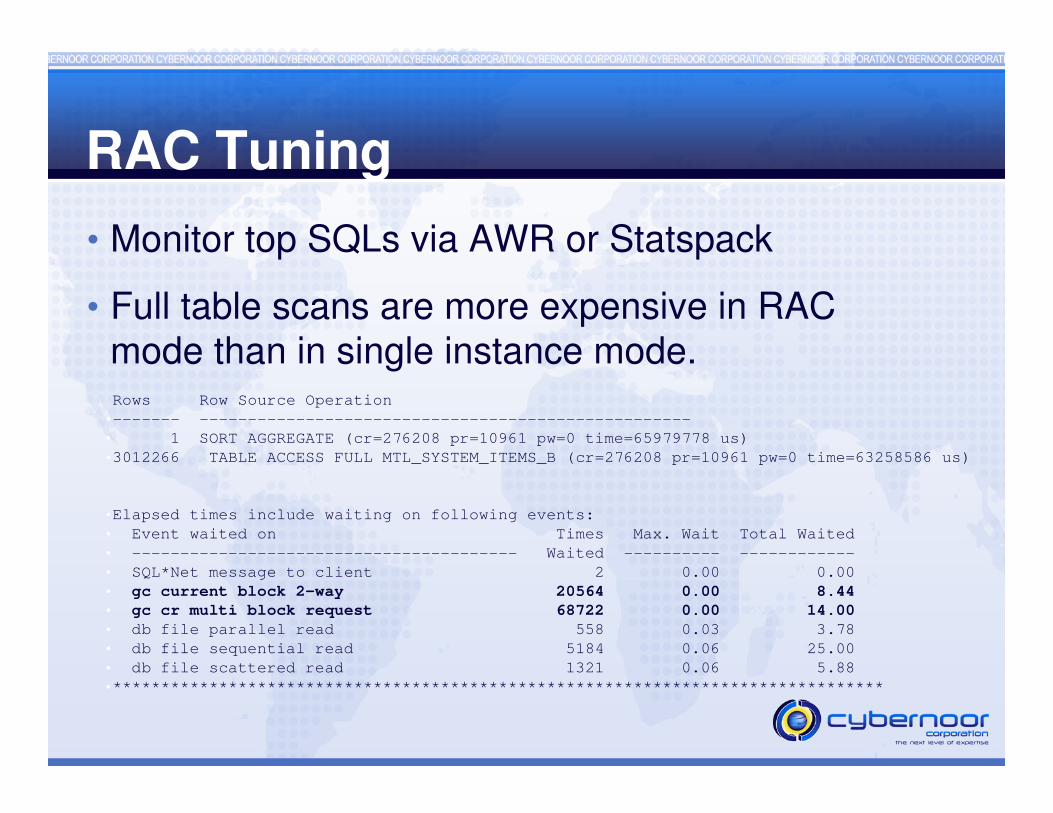
• Monitor top SQLs via AWR or Statspack
• Full table scans are more expensive in RAC mode than in single instance mode.Rows Row Source Operation
•------- ---------------------------------------------------
• 1 SORT AGGREGATE (cr=276208 pr=10961 pw=0 time=65979778 us)
•3012266 TABLE ACCESS FULL MTL_SYSTEM_ITEMS_B (cr=276208 pr=10961 pw=0 time=63258586 us)
•Elapsed times include waiting on following events:
• Event waited on Times Max. Wait Total Waited
• ---------------------------------------- Waited ---------- ------------
• SQL*Net message to client 2 0.00 0.00
• gc current block 2-way 20564 0.00 8.44
• gc cr multi block request 68722 0.00 14.00
• db file parallel read 558 0.03 3.78
• db file sequential read 5184 0.06 25.00
• db file scattered read 1321 0.06 5.88
•********************************************************************************
RAC Tuning
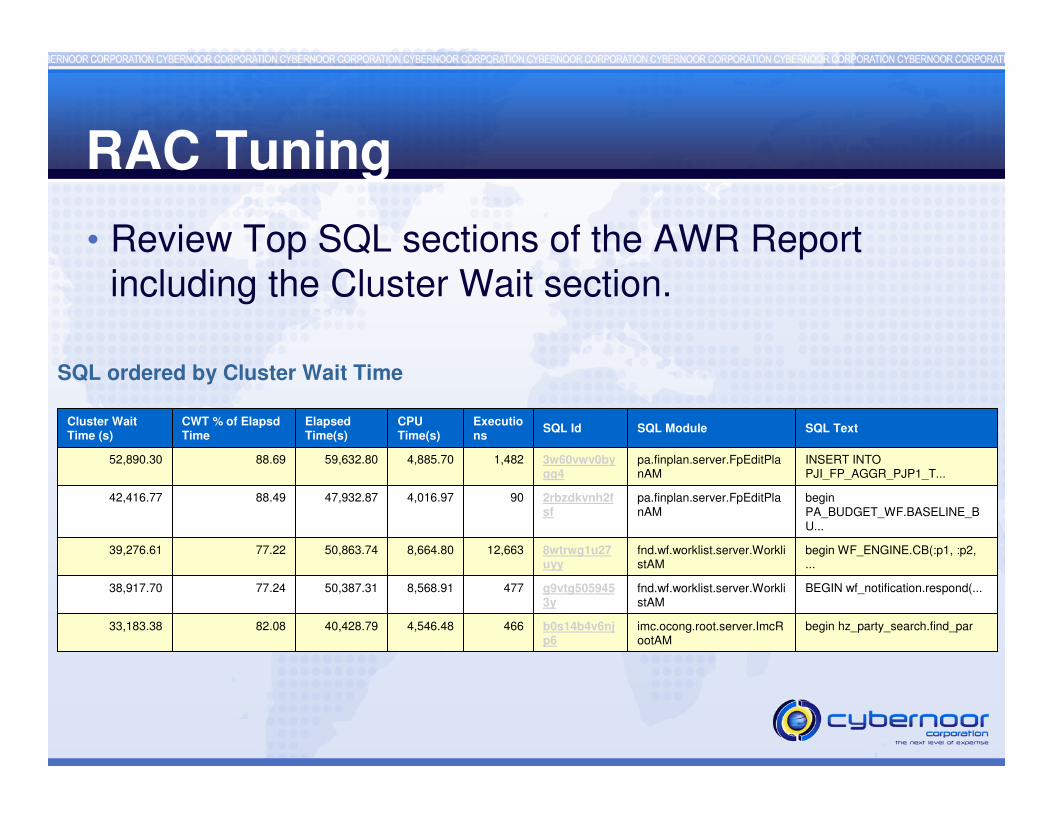
• Review Top SQL sections of the AWR Report including the Cluster Wait section.
SQL ordered by Cluster Wait Time
begin hz_party_search.find_parimc.ocong.root.server.ImcRootAM
b0s14b4v6njp6
4664,546.4840,428.7982.0833,183.38
BEGIN wf_notification.respond(...fnd.wf.worklist.server.WorklistAM
g9vtg5059453y
4778,568.9150,387.3177.2438,917.70
begin WF_ENGINE.CB(:p1, :p2, ...
fnd.wf.worklist.server.WorklistAM
8wtrwg1u27uyy
12,6638,664.8050,863.7477.2239,276.61
begin PA_BUDGET_WF.BASELINE_BU...
pa.finplan.server.FpEditPlanAM
2rbzdkvnh2fsf
904,016.9747,932.8788.4942,416.77
INSERT INTO PJI_FP_AGGR_PJP1_T...
pa.finplan.server.FpEditPlanAM
3w60vwv0bygg4
1,4824,885.7059,632.8088.6952,890.30
SQL TextSQL ModuleSQL IdExecutions
CPU Time(s)
Elapsed Time(s)
CWT % of Elapsd Time
Cluster Wait Time (s)
Relevant OpenWorld Sessions
• S290717 Customer Case Studies: Best Practices for Tuning Oracle E-Business Suite, Wednesday 11/14/2007 9:45 AM - 10:45 AM, Moscone West 2014 -L2
• S290918 Applications Database Optimization Panel,Thursday 11/15/2007 11:30 AM - 12:30 PM, Marriott Golden Gate B2

AppsPerf Event
• An annual forum dedicated to Applications Performance Tuning and Best Practices
• AppsPerf 2008 – A full day event with 14 advanced sessions.
•Visit www.appsperf.com for more information including •registration details.

Q & A
Thank You for Attending.