optimizing the performance of filter baghouses at …
TRANSCRIPT

OPTIMIZING THE PERFORMANCE OF FILTER BAGHOUSES AT PORTLAND
CEMENT RAW MILL
Sara Yasina YusufFahmi Muhammad Ridwan
Tengku Nuraiti Tengku IzharUmi Fazara Md Ali
Lee Xiang Feng Eng Shao Xin
Izzati Amani Mohd JafriMaisuura Mohamed
Nur Ainaa Rasyidah Harman
Technical Report
UNIVERSITIMALAYSIAPERLIS

TECHNICAL REPORT
OPTIMIZING THE PERFORMANCE OF
FILTER BAGHOUSES AT PORTLAND
CEMENT RAW MILL
Sara Yasina Yusuf
Fahmi Muhammad Ridwan
Tengku Nuraiti Tengku Izhar
Umi Fazara Md Ali
Lee Xiang Feng
Eng Shao Xin
Izzati Amani Mohd Jafri
Maisuura Mohamed
Nur Ainaa Rasyidah Harman
Penerbit Universiti Malaysia Perlis
Kangar 2020

ii
©Universiti Malaysia Perlis, 2020
All rights reserved. No part of this book may be reproduced or transmitted in any forms by
any means, electronic, mechanical, or otherwise, whether now or hereafter devised, including
photocopying, recording, or by any information storage and retrieval system without express
written prior permission from the publishers.
e-ISBN 978-967-2829-04-1
Published by:
Penerbit UniMAP, Universiti Malaysia Perlis
Tingkat 10, Bangunan KWSP
Jalan Bukit Lagi,
01000 Kangar, Perlis. MALAYSIA.
Tel: (04) 977 5159, Fax: (04) 977 5135
Website: http://penerbit.unimap.edu.my
E-mail: [email protected]

iii
TABLE OF CONTENTS
PAGE
LIST OF TABLES iv
LIST OF FIGURES v
PREFACE vi
1.0 INTRODUCTION
1.1 Environmental Quality (Clean Air) Regulations 2014
1.2 Objectives
1
3
2.0 PROJECT DEVELOPMENT PLAN 4
3.0 PROCESS FLOWSHEET AND PLANT LAYOUT
3.1 Generating design concept
3.2 Advantages and Disadvantages of Filter Baghouse System
3.3 Characteristics of Particulate Matter
3.4 Cleaning Mechanisms
7
7
8
8
4.0 DETAIL DESIGN WORK
4.1 Design Procedure
4.2 AutoCAD Drawing
10
13
5.0 SAFETY, HEALTH AND ENVIRONMENTAL CONSIDERATION
5.1 Hazard Identification, Risk Assessment and Risk Control
5.2 Hazard and Operability (HAZOP) Worksheet
17
17
6.0 ECONOMIC EVALUATION
6.1 The Equipment Cost
6.1.1 Bare Baghouse Costs
6.2 Total Annual Costs Estimation
6.2.1 Direct Annual Cost
6.2.1.1 Operating and Supervisory Cost
6.2.1.2 Operating Materials
6.2.1.3 Maintenance
6.2.1.4 Replacement Parts
6.2.1.5 Utilities
6.2.2 Indirect Annual Cost
23
26
26
26
27
27
29
CONCLUSION 31
REFERENCES 32
APPENDIX 34

iv
LIST OF TABLES
PAGE
Table 1.1 Fuel quality parameter for fuel burning equipment 2
Table 1.2 Pollutants limiting values for combustion emission for solid and
liquid fuels
2
Table 1.3 Limiting values for the pollutants of kiln 6
Table 2.1 Factors on Choosing Filter Media 6
Table 3.1 Advantages and disadvantages of filter baghouse system 7
Table 3.2 Cleaning parameters of mechanical shaker, reverse air and pulse
jet mechanisms
8
Table 3.3 Advantages and Disadvantages of Cleaning mechanism 9
Table 4.1 The collection efficiency of different outlet flow rate 12
Table 5.1 The HIRARC form of the proposed project 18
Table 5.2 The HAZOP form for the proposed project 21
Table 6.1 List of cost curves for three baghouse types 23

v
LIST OF FIGURES
PAGE
Figure 2.1 Project location 4
Figure 2.2 Project’s Located Point 5
Figure 4.1 Front view of filter baghouse system 13
Figure 4.2 Side view of filter baghouse system 13
Figure 4.3 Inlet flange and outlet flange of filter baghouse system 14
Figure 4.4 Access port and slide gate installed at hopper of filter baghouse
system
15
Figure 4.5 Access port and strike plate installed at hopper of filter baghouse
system
15
Figure 4.6 Simple diagram of system with a near-integrating process response
of baghouse
16
Figure 6.1 Equipment Costs for Pulse-Jet Filters (Common-housing) 24
Figure 6.2 Equipment Costs for Pulse-Jet Filters (Modular) 24
Figure 6.3 Equipment Costs for Cartridge Filters 25

vi
PREFACE
This project is made possible through the help and support from everyone, including the team
members consisting of the academic staffs and final year students (academic session
2019/2020) of the Faculty of Civil Engineering Technology, Universiti Malaysia Perlis.
Special thanks to the Dean of the Faculty of Civil Engineering Technology, Universiti Malaysia
Perlis, Dr. Afizah Ayob for her continuous support and encouragement.
The greatest acknowledgment of gratitude towards the Plant Manager and technical staffs from
the Mechanical and Maintenance Department of Negeri Sembilan Cement Industries Sdn.
Bhd., Perlis Plant, especially Mr Muzzammil bin Haron (the Senior Engineer) for their
assistance in completing this report.
Finally, we sincerely thank to our parents, family and friends, who provide the advice and
support. The product of this project would not be possible without them.

1
1.0 INTRODUCTION
The project proponent is Cement Industries of Malaysia Berhad (CIMA). All the necessary
information pertaining to the project to the consultant to facilities for the upgrading the APC
system designs are provided by them. The proponent concurred and acknowledges the content
of this report including the design criteria.
Negeri Sembilan Cement Industries Sdn. Bhd. (NSCI), Perlis is one of the Portland cement
producers in Malaysia, which involves processes such as selecting, grinding, heating, cooling
and packaging. Each one of these processes discharges certain amount of particulate matter
(PM) and harmful gases. However, when considering budget, only selected processes with
higher particulate matter and harmful gases emission will be equipped with Air Pollution
Control System (APC). The processes that take place in coal mill, kiln and grinder are the most
likely to release high emission of particles, thus suitable air pollution control equipment is
needed.
In this study, the problem related to the under-capacity performance of coal mill at Portland
cement plant from Negeri Sembilan Cement Industries Sdn. Bhd. (NSCI) company in Perlis
will be addressed. The inefficiency of filter bag house at coal mill is viewed as one of the
reasons for this under performance. Filter bag house role is to collect and filtrate the coal during
combustion at the coal mill. Previously in NSCI, the coal mill was able to produce up to 14
tonnes of pulverized coal in an hour but due to some unknown explanation, the amount of
pulverized coal that enter the storage decreases to 12 tonnes per hour. So, any problem-related
aspect of filter baghouse such as dimensions for the baghouse system, support designs and filter
cloth will be discussed.
For the specification of filter cloth provided or manufactured by manufacturer, NSCI is
currently using a woven type fabric filter made up of glass fibre. The strength of fabric filter
came into focus since information regarding low magnehelic pressure of the filter bag house
has been issued by one of the NSCI staff during the site visit. Magnehelic pressure is used in
the industry to measure filter resistance, fan and blower pressure, velocity of air and pressure
drop across the fabric. The drop in the magnehelic pressure indicated the presence of hole on
the fabric. Hence, it is important to evaluate and compare the characteristics of different types
of filter bag media to prevent problem from occurring in the future. The suitable dimension
and modification on the support design and parameters such as cleaning mechanism and
temperature will be analysed thoroughly. This is to reduce the problem such as choking and
fabric tearing of the bag filter at the coal mill that will surely take a toll on the plant
performance.
1.1 Environmental Quality (Clean Air) Regulations 2014
Environmental Quality (Clean Air) Regulations 2014 is the substitution to the Environmental
Quality (Clean Air) Regulations 1978. Gazetted on 4th June 2014 and started enforced on the
5th June 2014. It is applicable for premises that conducts burning or incineration (of waste,
materials etc) activity, premise that discharges air pollutants into the open air any fuel burning
equipment any industrial plant. The regulation related to the emission in CIMA cement is
Regulation 13 that stated:

2
“All activities and industries specified in the First Schedule shall comply with the technical
standards and limiting values as specified in the Second and Third Schedules, as the case may
be”.
Since NSCI is a mineral-based industry and uses mega fuel burning equipment, it can be
categorized under activities listed in the First Schedule of Non-Metallic (mineral) Industry
Cement Production (All-Sizes). Referring to the Second Schedule for liquid and solid fuel type.
The control of fuel quality and combustion emission for fuel burning equipment in general is
as listed below:
Table 1.1: Fuel quality parameter for fuel burning equipment
Fuel Type Fuel Fuel quality parameter
Liquid All Sulphur content <500 ppm (per weight)
Solid
Coal Sulphur content <1% (per weight)
Biomass Wood, agricultural waste, etc.: air dry and in its
natural composition (e.g., wood without coating,
paint or other treatment)
Residues from wood-based industries: without
wood preservatives
Table 1.2: Pollutants limiting values for combustion emission for solid and liquid fuels
Fuel type Pollutant Limit value Monitoring
Liquid Total particulate matter (PM)
Where dust load emitted:
a) >0.33<1.0 kg/hr
b) ≥1.0 kg/h
50 mg/m3
Once/year
2 times/year
Solid Total particulate matter (PM)
Where dust load emitted:
a) >0.44<1.0 kg/hr
b) ≥1.0<1.5 kg/h
c) ≥1.5<2.0 kg/h
d) ≥2.0 <2.5 kg/h
e) ≥2.5 kh/h
150 mg/m3 Once/year
2 times/year
3 times/year
4 times/year
Continuous*
Carbon monoxide (CO) 1000 mg/m3 Periodic *Averaging time for continuous monitoring is 30 minutes
Third schedule address the limiting values and technical standard according to the activities in
the industries. The proposal for this project will need to comply with the limiting values listed
in the Non-Metallic (Mineral) Industry: Cement Production (All Sizes)
Table 1.3: Limiting values for the pollutants of kiln
Source Pollutant Limit value Monitoring
Cement kilns
Sum of NO and NO2
expressed as NO2 800 mg/m3 Continuous*
Total PM 50 mg/m3 Continuous*
Mercury 0.05 mg/m3 Periodic
PCDD/PCDF 1.0 ng TEQ/m3 Periodic

3
1.2 Objectives
The main purpose of this study is to analyse the best design for baghouse filter to filtrate the
coal of Portland cement plant. The baghouse filter will be designed to accommodate the coal
mill of the cement plant.
i. To evaluate the performance of filter baghouse to further lower the particulates
outlet loading to values less than the stipulated standard (control air pollution).
ii. To provide dimensions for the baghouse system based on the key performance
evaluated. The performance factors that are considered are the effects of particle
charge, the air-to-cloth ratio, and the inlet particulates loading.
iii. To provide modifications on various supported designs in the baghouse to
accommodate the new designed system.

4
2.0 PROJECT DEVELOPMENT PLAN
One of the top cement suppliers in Malaysia is Cement Industries of Malaysia Berhad (CIMA),
which is a subsidiary company of the UEM Company Berhad. It has been well known for
manufacturing and supplying high quality cement, ready-mixed concrete and related products
from 1975. CIMA's corporate office is situated in Petaling Jaya, Selangor, and has two strategic
locations in Bukit Ketri, Perlis and Bahau, Negeri Sembilan, which are known as the Negeri
Sembilan Cement Industries Sdn Bhd. Both plants have a gross production capacity of 7.2
million tons of cement per year.
Both plants are supplying an Ordinary Portland Cement/CEM1 (OPC), ASTM Type II Portland
Cement, Low Heat Cement, Masonry Cement and Portland Composite Cement (PCC).
Commonly consumed materials for cement production are sand (silica), iron oxide, alumina
and limestone. These materials contain different properties and each of them each plays a vital
role in creating variety of cement. The study was conducted at Negeri Sembilan Cement
Industries Sdn Bhd. Perlis plant (Figure 2.1). It is located with latitude 6.511816 and longitude
of 100.257870 with a total area almost 4,000,000 ft² were completely equipped with technology
and machines on cement production.
Figure 2.1: Project Area
Cement production needs four type of materials which are sand, iron oxide, alumina and
actually a huge portion of limestone. Most of these raw materials are acquired from the
limestone quarry excavation. Limestone quarry is chosen due to the high content of limestone
contain in it. Thus, by excavating limestone other than limestone itself, we already have all the
raw materials necessary for cement production.
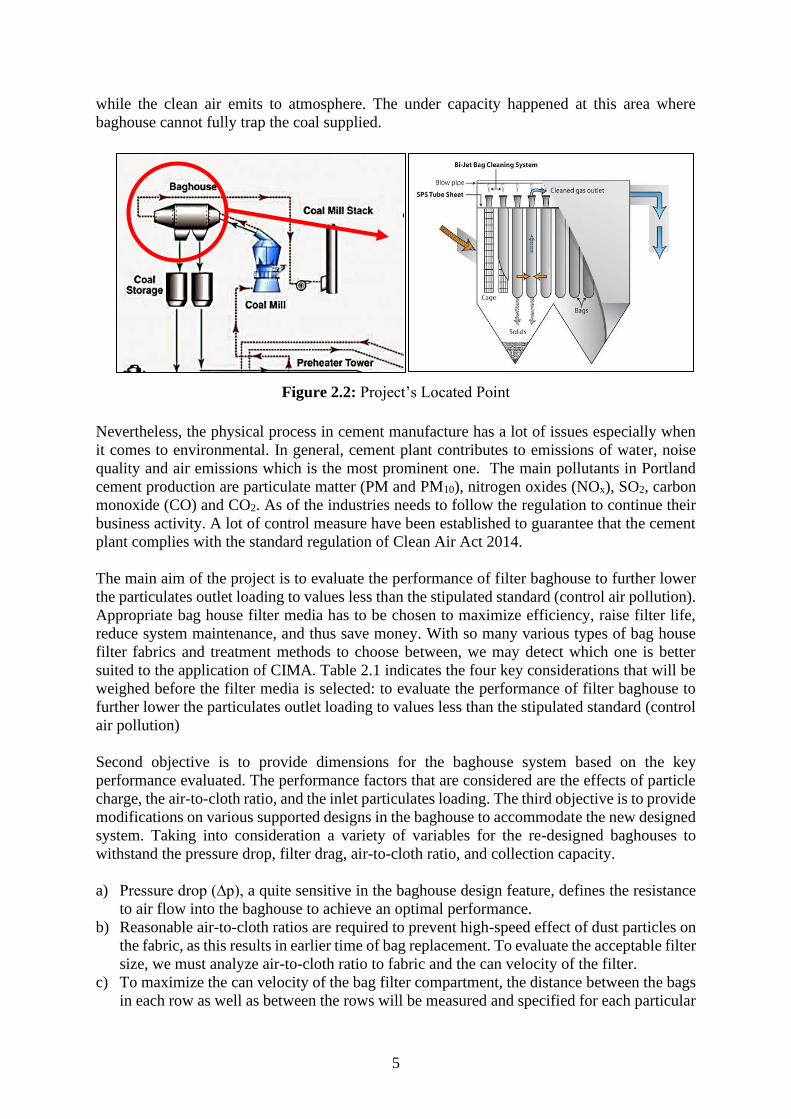
Based on Figure 2.2, our study area is located at stage 2 where the filter baghouse was located.
At coal mill, the coal supply will be grinding, dried, classified and transported the product to
the kiln by undergo the process of filter first. The finer particle of the product will be penetrated
or trap to filter baghouse and due to gravity, the particle will drop as solid to the coal storage
5
while the clean air emits to atmosphere. The under capacity happened at this area where
baghouse cannot fully trap the coal supplied.
Figure 2.2: Project’s Located Point
Nevertheless, the physical process in cement manufacture has a lot of issues especially when
it comes to environmental. In general, cement plant contributes to emissions of water, noise
quality and air emissions which is the most prominent one. The main pollutants in Portland
cement production are particulate matter (PM and PM10), nitrogen oxides (NOx), SO2, carbon
monoxide (CO) and CO2. As of the industries needs to follow the regulation to continue their
business activity. A lot of control measure have been established to guarantee that the cement
plant complies with the standard regulation of Clean Air Act 2014.
The main aim of the project is to evaluate the performance of filter baghouse to further lower
the particulates outlet loading to values less than the stipulated standard (control air pollution).
Appropriate bag house filter media has to be chosen to maximize efficiency, raise filter life,
reduce system maintenance, and thus save money. With so many various types of bag house
filter fabrics and treatment methods to choose between, we may detect which one is better
suited to the application of CIMA. Table 2.1 indicates the four key considerations that will be
weighed before the filter media is selected: to evaluate the performance of filter baghouse to
further lower the particulates outlet loading to values less than the stipulated standard (control
air pollution)
Second objective is to provide dimensions for the baghouse system based on the key
performance evaluated. The performance factors that are considered are the effects of particle
charge, the air-to-cloth ratio, and the inlet particulates loading. The third objective is to provide
modifications on various supported designs in the baghouse to accommodate the new designed
system. Taking into consideration a variety of variables for the re-designed baghouses to
withstand the pressure drop, filter drag, air-to-cloth ratio, and collection capacity.
a) Pressure drop (∆p), a quite sensitive in the baghouse design feature, defines the resistance
to air flow into the baghouse to achieve an optimal performance.
b) Reasonable air-to-cloth ratios are required to prevent high-speed effect of dust particles on
the fabric, as this results in earlier time of bag replacement. To evaluate the acceptable filter
size, we must analyze air-to-cloth ratio to fabric and the can velocity of the filter.
c) To maximize the can velocity of the bag filter compartment, the distance between the bags
in each row as well as between the rows will be measured and specified for each particular

6
event. This kind of criteria are often used to decide the most acceptable length of the bag
and the number of compartments required.
Table 2.1: Factors on Choosing Filter Media
Factors Explanation
Temperature
Because different media have varied optimum temperature
ranges, the working temperature differences will be
investigated to avoid filter media from exceeding the filter
media’s bearable range.
Moisture Content
Air humidity is proportional to the point of dew. It is easy
to create condensation in a filter bag with a high moisture
composition and a high dew point that will influence the
de-dusting results. We shall consider this most suitable
filter media to avoid the filter media from brittle and
damage.
Chemical composition
The anti-acid, anti-alkali and anti-organic solvent filter
media must be chosen when there is a presence of acid,
alkali or organic solvent in the dusty gas.
Combustibility and
explosives
Fire retardant and anti-static filter materials should be
utilized, if the dusty gas consists highly explosive gas,

7
3.0 FORMULATION OF ALTERNATIVES SCHEME
In conveying systems processing granular or dusty substances, the most common and popular
method of filtration is a bag variety textile filter. These filters are usually named as baghouses.
Most of the baghouses are long and tubular, and they are formed of interwoven or felted
material as their filter mechanism. When the dust gas or air is penetrating the baghouse through
hoppers by power pressure and is immediately led into the baghouse part. The optimized
performance of filter baghouse is based on the comparison among all critical parameters, most
important collection efficiency of targeted gaseous pollutants and dust particles. To design
high-efficiency filter baghouses, based on Environmental Quality Act (Clean Air) Regulations
2013 for non-metallic industry such as cement plants, the minimum gaseous pollutant emission
for dust particulates is 50 mg/m3. This limit value will be used as the main criteria for design
as dust is the leading gases pollutant and particulate matter, physical pollution control by using
suction pressure, and is immediately directed into the baghouse section.
3.1 Generating design concept
The selection of the best design filter baghouse system is based on the comparison among all
suggested essential parameters such as cleaning mechanism, size, pressure drop. Most
important is looking at the collection efficiency of target air pollutants, which are able to
perform high efficiency with low cost and resources. Moreover, the financial concern is also
an essential element to put into the design consideration that the company affords with. The
filter baghouse system has been described below.
a) Filter Baghouse
b) Working Principles of filter baghouse
c) Advantages and disadvantages of filter baghouse system
3.2 Advantages and Disadvantages of Filter Baghouse System
Table 3.1 illustrates the advantages and disadvantages of filter baghouse system.
Table 3.1: Advantages and disadvantages of filter baghouse system
Devices Advantages Disadvantages
Baghouse
• Provide high efficiency on
course and fine particulate
• The collected material has been
collected in a dry condition for
subsequent processing or for
disposal
• Efficiency and pressure drop
are not affected by large
changes in inlet dust loadings
especially for continuously
cleaned filters
• Baghouse filter did not require
high used of voltage and need a
simple maintenance
• There is a limitation on gas
temperature to the utilization of
fabric because of the restriction of
the structure itself
• The fabric can thermally degrade, or
the protective surfaces can
volatilize when used at high
temperature
• The fabric filter has limit on
temperature at 260 °C or 500 oF
• Fabric can burn if readily
oxidizable dust is being collected
• High costing

8
3.3 Characteristics of Particulate Matter
The fuel and the coal are used to provide the heat required to convert the kiln feed into clinker.
Coal will deliver to the coal mill and during the coal mill process, the dust particles matter will
be produced. Therefore, it needs a baghouse to filter the dust. Coal is mainly composed of
carbon, hydrogen, oxygen, nitrogen, sulphur and phosphorus and other elements, it is very
essential energy, an important raw material in the cement industry, coal is mainly used in power
generation, steel, cement, fertilizer, system of oil fields. It can be divided into lignite coal,
bituminous coal, anthracite, semi-anthracite and other types. The below is the characteristics
of coal. The ideal size is taken as 74 μm or smaller, but standards allow a range of larger
particles, the amount decreasing with size until the maximum size acceptable is reached. In the
coal mill process the temperature is maintained between 65 to 90 °C. The strength of coal is
between 800 psi and 5000 psi.
3.4 Cleaning Mechanism
After a careful investigation of different cleaning mechanisms, between mechanical shaker,
reverse-air and pulse jet types, we have decided to choose the pulse-jet cleaning mechanism.
This is due to the pulse-jet baghouses having more significant advantages than other
mechanisms. The investigated parameters of different types of cleaning mechanisms along with
their advantages and disadvantages are tabulated in Tables 3.2 and 3.3. The advantages of
pulse-jet cleaning mechanism are it is simple to operate, clean the dust efficiently, requires less
bags and can make it more space-efficient and low cost. Other than that, it is the most suitable
method for using in the coal mill process due to the coal characteristics and the coal mill
temperature.
Table 3.2: Cleaning parameters of mechanical shaker, reverse air and pulse jet mechanisms
Parameter Mechanical Shaker
Cleaning
Reverse Air
Cleaning Pulse Jet Cleaning
Frequency
Usually several
cycles per second;
adjustable
Cleaned one
compartment at a
time, sequencing one
compartment after
another
Usually, a row of bags
at a time, sequenced
one row after another;
can sequence such that
no adjacent rows clean
one after another;
Motion Simple harmonic or
sinusoidal
Gentle collapse of
bag (concave
inward) upon
deflation
Shock wave passes
down bag
Peak acceleration 4 - 8 g 1 - 2 g 30 - 60 g
Amplitude Fraction of an inch
to few inches N/A N/A
Duration 10 - 100 cycles, 30 s
- few minutes
1 - 2min. including
valve opening and
closing and dust
settling periods
Compressed air (40 to
100 psi) pulse duration
0.1 sec
Common filter
baghouse
dimensions
5, 8, 12 diameters
(inches); 8 to 10, 22,
30 length (foot)
8, 12 diameters
(inches); 22, 30, 40
length (foot)
5 to 6 diameters
(inches); 8 to 20 length
(foot)

9
Table 3.3: Advantages and Disadvantages of Cleaning mechanism
Cleaning
Mechanism Advantages Disadvantages
Mechanical Shaker
• Easy to operate
• Low cost
• Can be cleaned easily without
shutting the whole baghouses
• Cannot operate in high
temperature
• Takes up a large area to operate
• Time and energy sensitive
Reversed-air
• Operate in high temperature
• Long baghouses life
• Can be cleaned easily without
shutting the whole baghouses
• Needs to be cleaned regularly
• Difficult to remove dust on the
fabric surface
• Low air-to-cloth area
Pulse-jet
• Space efficient
• Utilized less bags
• Can Cleaned Continuously
• Low-cost
• Simple to operate
• Higher air-to-cloth ratio
• Cannot operate in high
temperature
• Needs dry compressed air
• Cannot operate when the
surrounding is humidity

10
4.0 DETAIL DESIGN WORK
4.1 Design Procedure
To design the filter baghouse system, some of the mathematical equations and calculations
need to be applied. Baghouses are designed by their size and depend on gas-to-cloth ratio and
"can velocity". Other than that, the pressure drop is also an important parameter to consider the
efficiency of the filter baghouse. The collection efficiency is the most important to determine
the characteristics of the filter baghouse. The following are the procedure established for the
calculation of baghouses design.
1. Gas-to-cloth ratio
The gas-to-cloth ratio is the measure of the amount of gas emitted by each square foot in
the baghouse. It is given in terms of the number of cubic feet of gas per minute passing
through one square foot of cloth. In other words, the G/C ratio is equal to the gas volume
rate/cloth area. Also note that this velocity is not the actual velocity through the openings
in the fabric, but rather the possible velocity of the gas surrounding the cloth. When the
G/C ratio is increased, the pressure drop also will increase. The baghouses that usually have
the highest gas-to-cloth ratio is pulse jet baghouses. A high gas-to-cloth ratio means that
there is a large volume of dirty air passes through the bags at a given time.
Factors affecting the G/C include the cleaning process, filter media, dust capacity, dust
quantity, dust loading, and other factors that differ from each situation. Once the gas/cloth
ratio (G/C) has been decided, the size of the baghouse is nearly installed. Variations also
occur in the number of walkways, hopper slope, and other design problems. These different
modifications will influence the total capacity of the baghouse to a limited degree, once
G/C has identified the essential requirements.
𝐔𝐧𝐢𝐭𝐬 𝐠𝐚𝐬𝐜𝐥𝐨𝐭𝐡 𝐫𝐚𝐭𝐢𝐨⁄ =
𝐠𝐚𝐬 𝐯𝐨𝐥𝐮𝐦𝐞 𝐫𝐚𝐭𝐞
𝐭𝐨𝐭𝐚𝐥 𝐜𝐥𝐨𝐭𝐡 𝐚𝐫𝐞𝐚=
𝒇𝒕𝟑/𝒎𝒊𝒏
𝒇𝒕𝟐= 𝒇𝒕/𝒎𝒊𝒏
For the pulse jet filter baghouse with felted fabric for coal:
G/ C = 3.5 ft/min
= 0.01778 m/s
2. Gas flow rate
Area of filter baghouse
𝐴 = 𝜋𝐷𝐿 Where, A=bag surface area, m2
D=bag diameter, m
L=bag length, m
Bag diameter= 0.152 m
Bag length= 3.66 m
𝐴 = 𝜋𝐷𝐿 = 𝜋(0.152)(3.66) = 1.75 𝑚2

11
Total Area of filter baghouse
Assume number of bags = 240
Compartments of baghouses = 4
𝐴𝑟𝑒𝑎 𝑏𝑎𝑔ℎ𝑜𝑢𝑠𝑒 × 𝑛𝑢𝑚𝑏𝑒𝑟 𝑜𝑓 𝑏𝑎𝑔ℎ𝑜𝑢𝑠𝑒 × 𝑐𝑜𝑚𝑝𝑎𝑟𝑡𝑚𝑒𝑛𝑡 = 1.75 × 240 × 4 = 1677.82 𝑚2
Gas flow rate
𝐹 =𝑄
𝐺/𝐶
Where, F=total fabric area, m2
Q=gas flow rate, m3/s
G/C=gas-to-cloth, (m3/s)/m2
Assume Pulse jet baghouse with felted fabric, so
G/ C = 3.5 ft/min
= 0.01778 m/s
𝑄 = (𝐺
𝐶) × 𝐹 = 0.01778 × 1677.82 = 29.83 𝑚3/𝑠
Gas-to-cloth ratio increase, the air flow rate will increase.
3. Pressure drops
Δp = k1Vf
Where: Δp = pressure drop across the clean fabric (in. H20)
k1 = fabric resistance in H20 / (m/s)
Vf = filtration velocity, m/s
Assumption felted fabric as our fabric, therefore the k1 = 281.21 m/s
The filtration velocity will be 0.01778 m/s.
Therefore,
𝛥𝑝 = (281.21) × 0.01778 = 5 𝑖𝑛. 𝐻2𝑂
The pulse-jet baghouse is usually operated with pressure drops of 5 in. H20.
4. Can velocity Can Velocity = (ACFM / At - (N x (Ab))
Where: At= tubesheet area (m2)
N= number of bags
Ab= area of the bottom of the bag (m2)
ACFM = 29.83 m3/s
= 1053.44 ft/s
At = 1677.82 m2
N = 240
Ab = 1.75 m2

12
𝐶𝑎𝑛 𝑉𝑒𝑙𝑜𝑐𝑖𝑡𝑦 = (2983 ÷ (1677.82 − (240 × 1.75)) = 2.38 𝑚/𝑠
Velocity should not exceed 468 fpm or 2.38 m/s.
5. Filter drags
𝑆 = Δp/𝑉𝑓
Where: S = filter drag, in. H2O
Δp = pressure drop across the clean fabric (in. H20)
Vf = filtration velocity, m/s
Δp = 5 in
Vf = 0.01778 m/s
Therefore,
𝑆 =5
0.01778= 281.21 𝑖𝑛 𝐻2𝑂
Filter drag in pulse jet baghouse would be 281.21 in. H2O
6. Collection efficiency
Assuming volumetric flow rate (Q) inlet = 29.83m3/s when using pulse-jet filter
baghouse with felted fabric.
Assuming Q outlet is 10% from Q inlet: 2.983 m3/s
𝐸 = (𝐼𝑛𝑙𝑒𝑡 𝑙𝑜𝑎𝑑𝑖𝑛𝑔 − 𝑜𝑢𝑡𝑙𝑒𝑡 𝑙𝑜𝑎𝑑𝑖𝑛𝑔)
(𝐼𝑛𝑙𝑒𝑡 𝑙𝑜𝑎𝑑𝑖𝑛𝑔) × 100%
𝐸 =(29.83 − 2.983)
(29.83)× 100% = 90%
Assuming Q inlet = 29.83 m3/s
Assuming Q outlet is 7% from Q inlet: 2.09 m3/s
𝐸 =(29.83 − 2.09)
(29.83)× 100% = 93%
Assuming Q inlet = 29.83 m3/s
Assuming Q outlet is 5% from Q inlet: 1.50 m3/s
𝐸 =(29.83 − 1.50)
(1.50)× 100% = 95%
Table 4.1: The collection efficiency of different outlet flow rate
Inlet flow rate (m3/s) Outlet flow rate (m3/s) Collection efficiency (%)
29.83 2.983 90
29.83 2.09 93
29.83 1.50 95

13
7. Particulate matter emission from a coal mill
Particulate matter emissions from a coal mill process. The results indicated that an
emission of total particulate matter is 121 mg/m3. The outlet loading is 28.7 mg/m3. According
to Malaysia emission standards, the particulate matter emission limit value should not exceed
50 mg/m3. Therefore, the design is following the emission standards. The removal efficiency
was achieved 76.3 % (Lu, Wu, & Pan, 2010).
𝐸 =(121 − 28.7)
(121)× 100% = 76.3 %
4.2 AutoCAD Drawing
Figure 4.1: Front view of filter baghouse system
4 compartments
Hopper Screw Conveyor
14
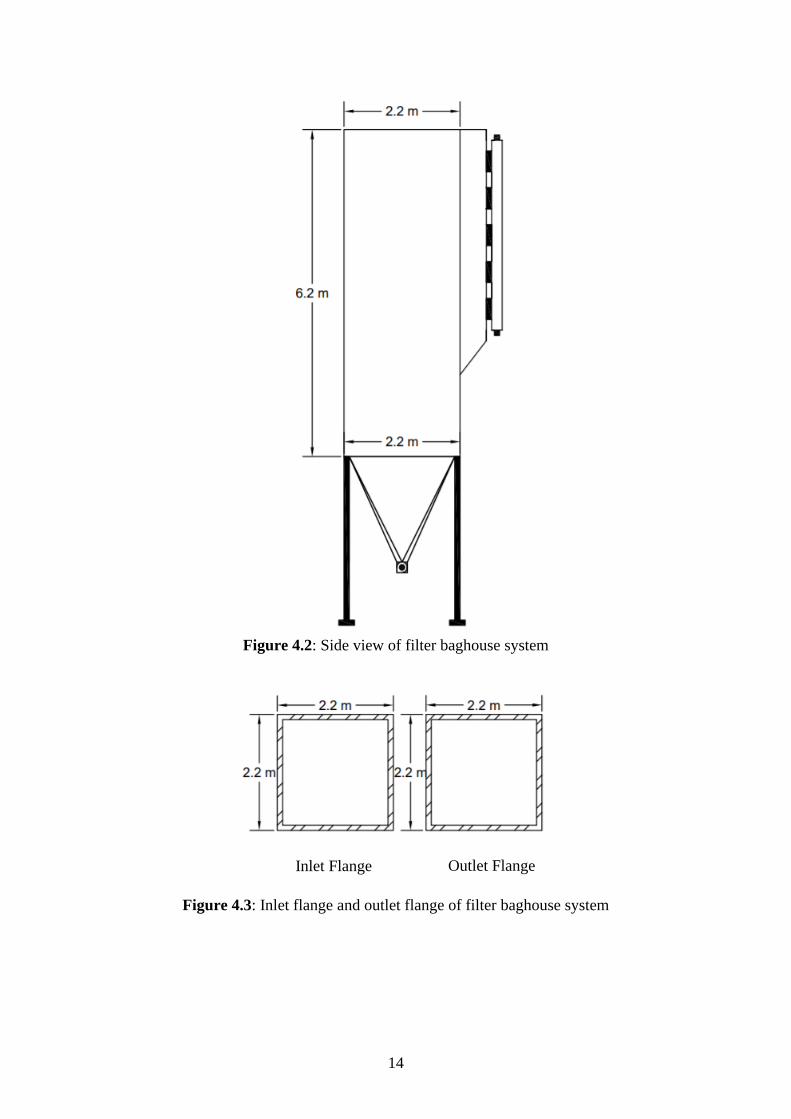
Figure 4.2: Side view of filter baghouse system
Figure 4.3: Inlet flange and outlet flange of filter baghouse system
Outlet Flange Inlet Flange

15
Figure 4.4: Access port and slide gate installed at hopper of filter baghouse system
Figure 4.5: Access port and strike plate installed at hopper of filter baghouse system
Access Port
Hopper
Slide Gate
Access Port
Strike Plate
Hopper
Screw Conveyor
16
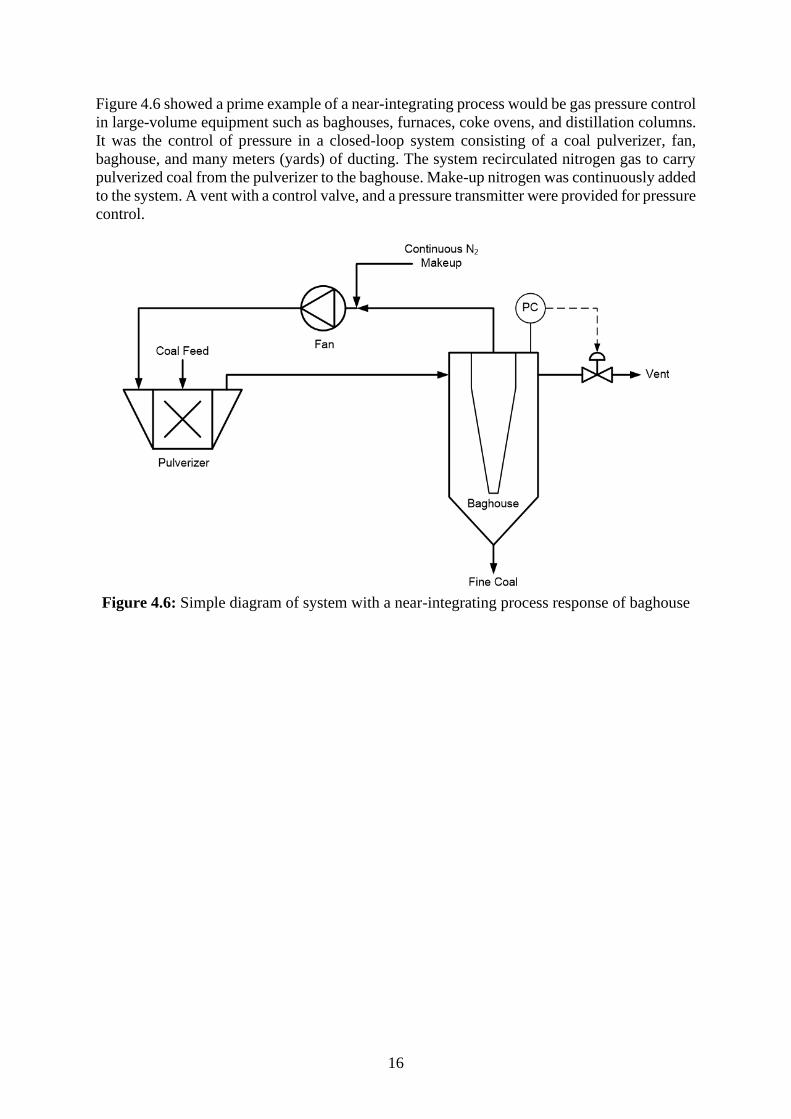
Figure 4.6 showed a prime example of a near-integrating process would be gas pressure control
in large-volume equipment such as baghouses, furnaces, coke ovens, and distillation columns.
It was the control of pressure in a closed-loop system consisting of a coal pulverizer, fan,
baghouse, and many meters (yards) of ducting. The system recirculated nitrogen gas to carry
pulverized coal from the pulverizer to the baghouse. Make-up nitrogen was continuously added
to the system. A vent with a control valve, and a pressure transmitter were provided for pressure
control.
Figure 4.6: Simple diagram of system with a near-integrating process response of baghouse

17
5.0 SAFETY, HEALTH AND ENVIRONMENTAL CONSIDERRATION
5.1 Hazard Identification, Risk Assessment and Risk Control
Bag failures occur at varying times depending on the operation of the collector. Hence, it is
important to schedule monitoring and maintenance activities of the bag houses. The bag house
that is maintained properly will ensure the smooth run for filtration process as the possibilities
for damaged can be avoided. The hazard identification, risk assessment and risk control is
identified as in the following Table 5.1.
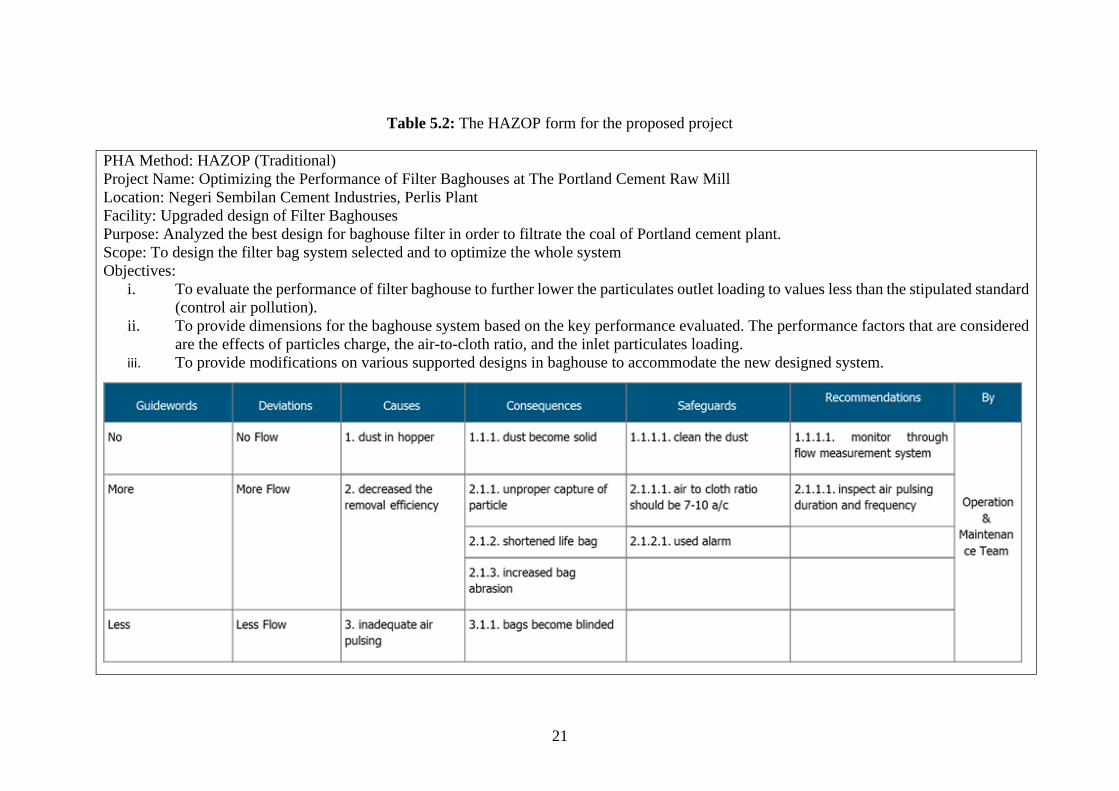
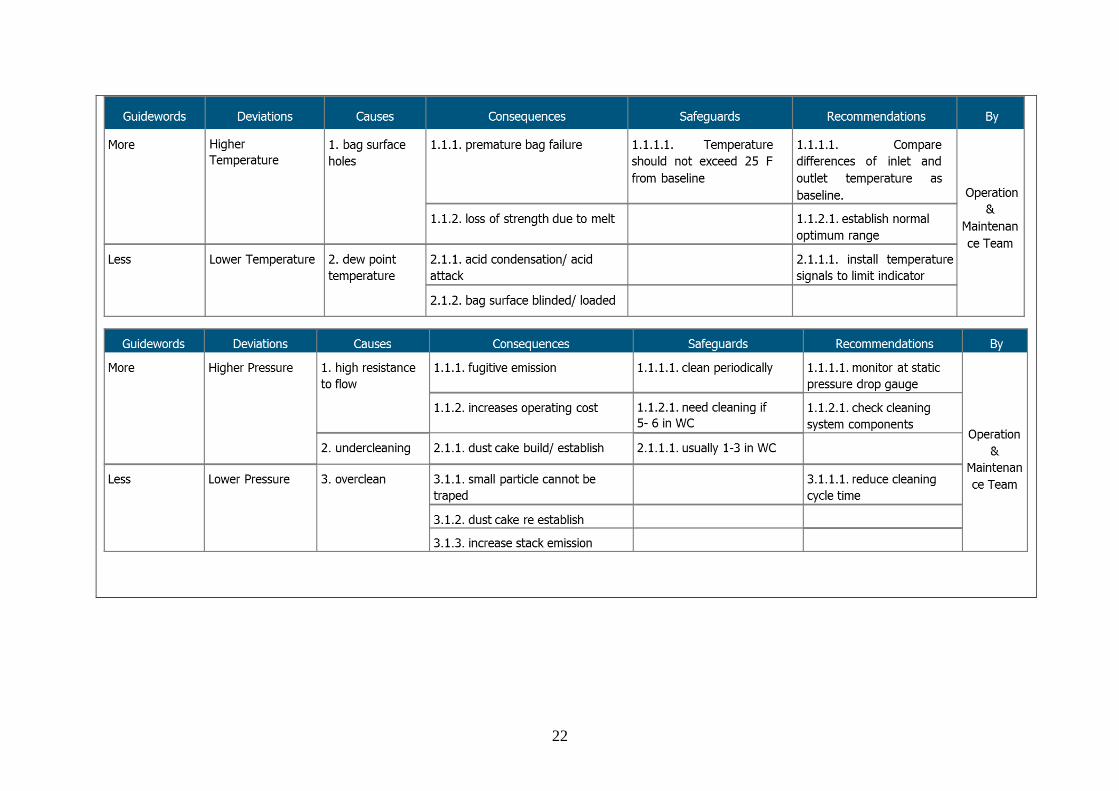
5.2 Hazard and Operability (HAZOP) Worksheet
Hazard and Operability (HAZOP) report is a comprehensive approach to recognize hidden
dangers in the working system. In this method, the procedure is broken down into stages, and
any change in the function parameters is evaluated from each step to see what might go wrong.
The report extensively examines the growing aspect of the system. The purpose is to detect
possible scenarios that might allow the item to present a danger or to restrict the activity of the
system as a whole. The HAZOP report is carried out during the planning stage of the new
project. The success of the analysis ensures that all possible sources of failure will be known.
The HAZOP report would include an overview of the possible deviations, consequences,
causes, safeguard and recommendation. From this stage on, improvements to the program will
be made to eliminate issues from happening. In the ongoing facilities, HAZOP has been
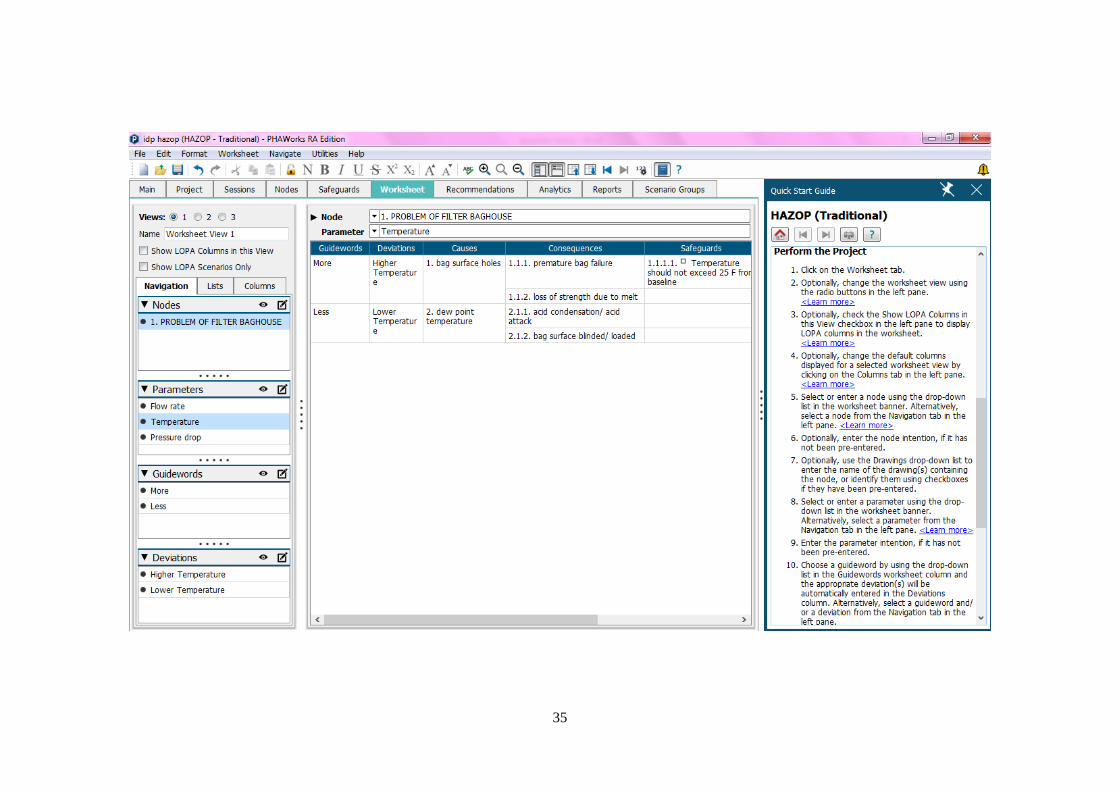
operating to enhance the procedure without any defined end date. The HAZOP worksheet for
this research was developed using Process Hazard Analysis (PHAWorks) software and
tabulates in Table 5.2.

18
Table 5.1: The HIRARC form of the proposed project
Job Sequence
of Job Step
Hazard Identification
Existing
control
Risk
Assessment Control
Hazard
Effect
L S RR
Control measures Recommendation Status
Recommendation
Occurrence
of a
hazardous
Event or
exposure
Injury or Ill
Health E SB EN A P
Maintenance
Visual
inspection
on system
fan,
dampers,
electrical
control etc.
Ergonomic
hazard
Wrong
working
posture
Musculoskeletal
disorders
(MSDs)
Safety
checklist
card
3 2 6 ✓ Take a break for
every 30 minutes
Remove
inspection
door and
check
conveyor
for loose
items or
obstructions
Physical
hazard
Sharp
objects
Broken finger
and
Bruised arm
Signage
regarding
procedure
for
inspection
2 2 4 ✓ ✓ ✓ Wear rubber
gloves

19
Adjust duct
work
dampers -
open or at
proper
setting
Electrical
hazard
Damage
wiring Electrocution
Safety
manual 1 2 2 ✓
Double check the
on off switch
Remove
any
temporary
baffles
Physical
hazard
Sharp
objects Bleeding
Wears
Personal
Protective
Equipment
1 2 2 ✓ ✓ Wear gloves
Test horn
alarm
system, if
included,
by jumping
connected
sensors
Physical
hazard
Exposure
to high
noise level
Temporary loss
of hearing
Wear
hearing
protection
gear
1 2 2 ✓ ✓ Administration
announcement
Check cell
plates for
dust leaks
Physical
hazard
Sharp
objects
Heavy
objects
Bruised arm
and
Broken leg
Full body
harness 2 3 6 ✓
Provide standing
platform for
workers

20
Check to
see that
dust is
being
discharged
from
hopper
Chemical
hazard
Exposure
to
particulate
matter
Respiratory
problem Mask 1 1 1 ✓ ✓
Build up
temporary walls
Walk
through
baghouse to
check for
normal or
abnormal
visual and
audible
condition
Physical
hazard
Falling
objects Head injuries
Safety
helmet 2 4 8 ✓ ✓ Warning signs
Chemical
hazard
Dust and
particulate
matter
Coughing and
asthma Mask 1 1 1 ✓
Close the area
for outsiders
Replace
high-wear
parts on
cleaning
system
Physical
hazard
Falling
from high
place
Broken leg and
Death
Full body
harness 3 4 12 ✓
Personnel
inspection
Ergonomic
hazard
Awkward
working
posture
Stiff neck and
Musculoskeletal
disorders
Personnel
inspection 2 3 6 ✓
Scheduled a
routine work
21
Table 5.2: The HAZOP form for the proposed project
PHA Method: HAZOP (Traditional)
Project Name: Optimizing the Performance of Filter Baghouses at The Portland Cement Raw Mill
Location: Negeri Sembilan Cement Industries, Perlis Plant
Facility: Upgraded design of Filter Baghouses
Purpose: Analyzed the best design for baghouse filter in order to filtrate the coal of Portland cement plant.
Scope: To design the filter bag system selected and to optimize the whole system
Objectives:
i. To evaluate the performance of filter baghouse to further lower the particulates outlet loading to values less than the stipulated standard
(control air pollution).
ii. To provide dimensions for the baghouse system based on the key performance evaluated. The performance factors that are considered
are the effects of particles charge, the air-to-cloth ratio, and the inlet particulates loading.
iii. To provide modifications on various supported designs in baghouse to accommodate the new designed system.
22

23
6.0 ECONOMIC EVALUATION
Total capital investment includes the baghouse structure costs, bags’ initial complement costs,
auxiliary equipment costs, usual direct costs and indirect costs correlated with installing or
erecting new structures. These costs are introduced below.
6.1 The Equipment Cost
6.1.1 Bare Baghouse Costs
Relationship between cost and fabric area for 3 types of baghouses are presented. These three
types which are preassembled are listed in Table 6.1. Figures 6.1 and 6.2 show common-
housing and modular pulse-jet baghouses, respectively. Common housing units have all bags
within one housing; modular units are constructed of separate modules that may be arranged
for off-line cleaning. Note that in the single-unit (common-housing) pulse jet, for the range
shown, the height and width of the unit are constant and the length increases; thus, for a
different reason than that for the modular units discussed above, the cost increases linearly with
size. Because the common housing is relatively inexpensive, the stainless-steel add-on is
proportionately higher than for modular units. Added material costs and setup and labor
charges associated with the less workable stainless-steel account for most of the added expense.
Figure 6.3 shows costs for cartridge baghouses cleaned by pulse.
Table 6.1: List of cost curves for three baghouse types
Baghouse Type Figure No.
Preassembled Units
Continuous Pulse-jet (common housing) 6.1
Continuous Pulse-jet (modular) 6.2
Continuous Pulse-jet (cartridge) 6.3

24
Figure 6.1: Equipment Costs for Pulse-Jet Filters (Common-housing)
Figure 6.2: Equipment Costs for Pulse-Jet Filters (Modular)

25
Figure 6.3: Equipment Costs for Cartridge Filters
The capital cost factors are calculated as the following:
Cost Item Factor (MYR)
Direct costs
Purchased equipment costs
Fabric filter (EC) 60,000
Bags 28,000
Auxiliary equipment 12,000
Total, A 100,000
Instrumentation, 0.10A 10,000
Sales taxes, 0.03A 3,000
Freight, 0.05A 5,000
Purchased Equipment Cost, PEC, B = 1.18 A 118,000
Direct installation costs
Foundations & supports, 0.04 B 4,720
Handling & erection, 0.50 B 59,000
Electrical 0.08 B 9,440
Piping, 0.01 B 1,180
Insulation for ductwork, 0.07 B 8,260
Painting, 0.04 B 2,360
Direct installation costs, 0.74 B 84,960
Total Direct Cost, DC, B+ 0.74B = 1.74 B 202,960

26
Indirect Costs (installation)
Engineering, 0.10 B 11,800
Construction and field expense, 0.20 B 26,600
Contractor fees, 0.10 B 11,800
B Start-up, 0.01 B 1,180
Performance test, 0.01 B 1,180
Contingencies, 0.03 B 3,540
Total Indirect Cost, IC, 0.45 B 53,100
Total Capital Investment = 1.74 B + 0.45 B = 2.19 B 256,060
The construction estimation cost of the baghouse filter including equipment costs, installation
cost and total capital investments estimated around RM 256,060. The equipment cost including
fabric filter with insulation, bag, cages and auxiliary equipment which is RM 118,000 while
for total indirect cost is RM 202,960.
6.2 Total Annual Costs Estimation
6.2.1 Direct Annual Costs
Direct annual costs include operating and supervisory labor, operating materials, replacement
bags, maintenance, utilities, and dust disposal. Majority costs are talked separately below. They
differ with place and time and should be gained to fit the particular baghouse system being
costed.
6.2.1.1 Operating and Supervisory Cost
Typical operating labor requirements are 3 hours per 8-hours shift for a wide range of filter
sizes. When fabric filters are operated to meet Maximum Achievable Control Technology
(MACT) regulations, it is likely that the upper end of the range is suitable. Small or well-
performing units may need less time, while very large or troublesome units may need more.
Supervisory labor is taken as 15% of operating labor.
Operator cost (OL): requirement of 3 h per 8 h shift = RM56.21/h
Annual cost of OL = (3 h/shift / 8 h/shift) X 6,000 hours/year X RM56.21/h = RM12,472.50
Supervisory cost (SL): 15 % of OL = 0.15 x RM 12,472.50 = RM 1,870.88
6.2.1.2 Operating Materials
Operating materials are usually not essential for baghouses. An exception is the precoat
materials used injected on the inlet side of the baghouse to give a layer with protective dust on
the bags when adhesive or destructive particles may hurt them. Adsorbents might be injected
in the same way while the baghouse is used for simultaneous particle and removal of gas.
Materials costs shall be cover on a dollars-per-mass.

27
6.2.1.3 Maintenance
Maintenance labor differs from 1 to 2 hours per shift. As with operating labor, these values
may be minimized or surpass rely on the particular unit’s size and operating difficulty.
Maintenance materials costs are expected to be equivalent to labor costs of maintenance.
Maintenance Labor (ML) of 1 hour per 8-hour shift = RM 61.85/h
Annual cost of ML = (1 hr/shift / 8 hr/shift) x 6,000 days/year x RM61.85/h = RM 46,387.50
Maintenance Materials (MM) is assumed to equal the Maintenance Labor (ML), MM = ML
MM = RM 46,387.50
6.2.1.4 Replacement Parts
Replacement parts consist of filter bags, which have a typical operating life of about 2 to 4
years. The following formula is used for computing the bag replacement cost:
CRCB = (CB + CL) x CRFB
CRCB = bag capital recovery cost (RM/year)
CB = initial bag cost including taxes and freight (RM)
CL = bag replacement labor (RM)
CRFB = capital recovery factor whose value is a function of the annual interest rate and the
useful life of the bags (For instance, for a 7% interest rate and a 2-year life, CRFB = 0.5531.)
CRCB = (CB + CL) x CRFB
CB = RM 118,000
CL = RM6.57/m2 net bag area x (1677.82 m2) = RM 11,023.28
CRFB = 0.5531
CRCB = (CB + CL) x CRFB
CRCB = (RM 118,000 + RM 11,023.28) x 0.5531
CRCB = RM 71,362.78

28
6.2.1.5 Utilities
Electricity
The cost of electricity depends largely on the fan power requirement. For an estimation of fan
power requirement, assuming a 65 % fan motor efficiency and a fluid specific gravity of 1.00:
Fp = (0.000181) (Qe,a) (P) (HRS)
Fp = electricity cost (RM)
Qe,a = emission stream flow rate (acfm)
P = the system pressure drops (in. H2O)
HRS = the operating hours (h/year)
Fp = 1.81 × 10⁻⁴ (Qe,a)(P)(HRS)
Fp = (0.000181) (63,206.19 acfm) (5 in. H2O) (6,000 h/year) (RM0.26/kWh)
Fp = RM 89234.50
Compressed air
Compressed air (dried and filtered) = (2 scfm/1,000 acfm) (63,206.19 acfm) (RM0.69/1,000
scfm) (60 min/h) (6,000 h/year)
Compressed air (dried and filtered) = RM 31,400.84
Waste Disposal
• Varies with size and location
• Ranging from RM 86.78/ton to RM 130.17/ton for non-hazardous waste,
• Hazardous material 10 times of this amount.
Waste disposal, at RM86.78/ton onsite for essentially 100% collection efficiency:
(4 g/ft3) (1 lb/7,000 g) x 63,206.19 ft3/min x 60 min/h x 6,000 h/year x (1 ton/2000 lb) x (RM
86.78/ton) = RM 564,174.84

29
6.2.2 Indirect Annual Costs
Indirect annual costs such as property taxes, capital recovery, administrative costs, insurance
and overhead. The capital recovery cost is based on the lifetime of equipment and the annual
interest rate adopted. The system lifetime differs from 5 to 40 years, with 20 years being typical
for fabric filters. Nevertheless, this does not apply to the bags that generally have shorter
lifetime. Therefore, one should base system capital recovery cost predicts on the installed
capital cost, reduce the bags replacement cost.
Property Tax = 0.01TCI = 0.01 (RM 256,060) = RM 2560.60
*Capital recovery factor is assumed as 10% interest rate for estimated 20 years equipment life.
*Capital Recovery = 0.1175 (TCI – 0.05 CL – 1.08 CB) = 0.1175 {RM 256,060 – 0.05 (RM
11,023.28) – 1.08 (RM 118,000)} = RM 15,048.09
Administrative = 0.02TCI = 0.01 (RM 256,060) = RM 5121.20
Insurance = 0.01 TCI = 0.01 (RM 256,060) = RM 2560.60
Overhead = 0.6 (OL + ML) = 0.6 (RM 12,472.50+ RM 46,387.50) = RM 58,860
Thus, the total summary of annual costs is listed as follows (Section 6.2):
Cost Items Factor (MYR)
Direct Annual Cost
Operating Cost 12,472.50
Supervisory Cost 1,870.88
Operating Materials -
Maintenance
Material Labor 46,387.50
Material Materials 46,387.50
Replacement Parts 71,362.78
Utilities
Fan Power Requirement 89,234.50
Compressed Air 31,400.84
Waste Disposal 564,174.84
Total Direct Annual Costs 863,291.34
Indirect Annual Costs
Property Taxes 2,560.60
Capital Recovery 15,048.09
Administrative Costs 5,121.20
Insurance 2,560.60
Overhead 58,860
Total Indirect Annual Costs 84,150.49
Total Annual Cost 947,441.83

30
The total direct annual cost of the baghouse filter including operating cost, supervisory cost,
operating materials, maintenance, replacement parts and utilities is estimated around RM
863,291.34 while for total indirect annual cost including property taxes, capital recovery,
administrative, costs insurance and overhead is RM 88,150.49. The total annual cost including
total direct annual costs and total indirect annual costs is RM 947,441.83.

31
CONCLUSION
Negeri Sembilan Cement Industres Sdn. Bhd. (CIMA, Perlis Plant) has mentioned their needs
of reducing emission of particulate matter from the coal mill process and increase the efficiency
production of cement by solving the problem of inefficiency baghouses. An air pollution
control device has been upgraded to accommodate the new designed system and introduce to
the client to fulfil the needs of customer by installing the baghouses system. By modifying the
new baghouse system, the cleaning mechanism of pulse-jet method was chosen in this project
and the fabric material is felted fabric. This is due to this method being the most suitable for
the coal mill process. The advantages of the pulse-jet method are it is simple to operate, clean
the dust efficiently, requires less bags and can make more space-efficient and low cost. Besides
that, the design is evaluated with the concern of health and safety and economic consideration.
This is since the design must be sustainable and environmentally friendly. The design
formulation and calculation will be provided with drawing and visualization through the
simulation. Thus, the parameters of air-to-cloth ratio, pressure drop, can velocity, airflow rate
and the removal efficiency are important in our design project. Therefore, the problem of
particulate matter emission from the coal mill process and under-capacity of cement can be
solved. The proposed technology considered the environmental and sustainability concern,
which will be able to reduce the impact to the environment.

32
REFERENCES
Litchwark, J. O., Winchester, J., & Nijdam, J. J. (2015). Design of pulse-jet systems for milk
powder baghouses. Powder Technology, 284, 379–386.
Lu, H. C., & Tsai, C. J. (1998). A Pilot-Scale Study of the Design and Operation Parameters
of a Pulse-Jet Baghouse. Aerosol Science and Technology, 29(6), 510–524.
Lu, H. C., & Tsai, C. J. (1999). Influence of design and operation parameters on bag cleaning
performance of pulse-jet baghouse. Journal of Environmental Engineering, 125(6),
583–591.
Lu, H. C., & Tsai, C. J. (2003). Influence of different cleaning conditions on cleaning
performance of pilot-scale pulse-jet baghouse. Journal of Environmental
Engineering, 129(9), 811–818.
Pham, M., Clark, C., & McKenna, J. (2012). The evolution and impact of testing baghouse
filter performance. Journal of the Air and Waste Management Association, 62(8), 916–
923.
Scala, F., Lancia, A., Nigro, R., & Volpicelli, G. (2005). Spray-dry desulfurization of flue gas
from heavy oil combustion. Journal of the Air and Waste Management
Association, 55(1), 20–29.
Simon, X., Bémer, D., Chazelet, S., & Thomas, D. (2014). Downstream particle puffs
emitted during pulse-jet cleaning of a baghouse wood dust collector: Influence of
operating conditions and filter surface treatment. Powder Technology, 261, 61–70.
Simon, X., Bémer, D., Chazelet, S., Thomas, D., & Régnier, R. (2010). Consequences of high
transitory airflows generated by segmented pulse-jet cleaning of dust collector filter
bags. Powder Technology, 201(1), 37–48.
Turner, J. H., Viner, A. S., Jenkins, R. E., Vatavuk, W. M., & McKenna, J. D. (1987).
Sizing and costing of fabric filters part II: Costing considerations. JAPCA, 37(9),
1105-1112.
Carr, R. C., & Smith, W. B. (1984). Fabric filter technology for utility coal-fired power
plants. Journal of the Air Pollution Control Association, 34(1), 79-89.
Mohurle, N., & Thakare, N. R. (2013). Analysis on fabric filtration material for pulse jet fabric
filter. Int. J. Emg. Tech. Adv. Eng, 3, 603.
Bao, L., Yu, M., Kishma, T., Uyama, S., & Kemmocchi, K. (2011). Improving bag cleaning
efficiency of a bag filter dust collector using multiple jet pulses. T Jpn Soc Mech Eng,
Series C, 77, 179-186.

33
Mukhopadhyay, A. (2009). Pulse-jet filtration: An effective way to control industrial pollution
Part I: Theory, selection and design of pulse-jet filter. Textile Progress, 41(4), 195-315.
Purnomo, C. W., Budhijanto, W., & Alfisyah, M. (2018, March). Improvement of
cement plant dust emission by bag filter system. In IOP Conference Series:
Materials Science and Engineering (Vol. 316, No. 1, p. 012031). IOP Publishing.

34
APPENDIX
The HAZOP planning via PHAWorks
35

36
Proposed Project Scheduling
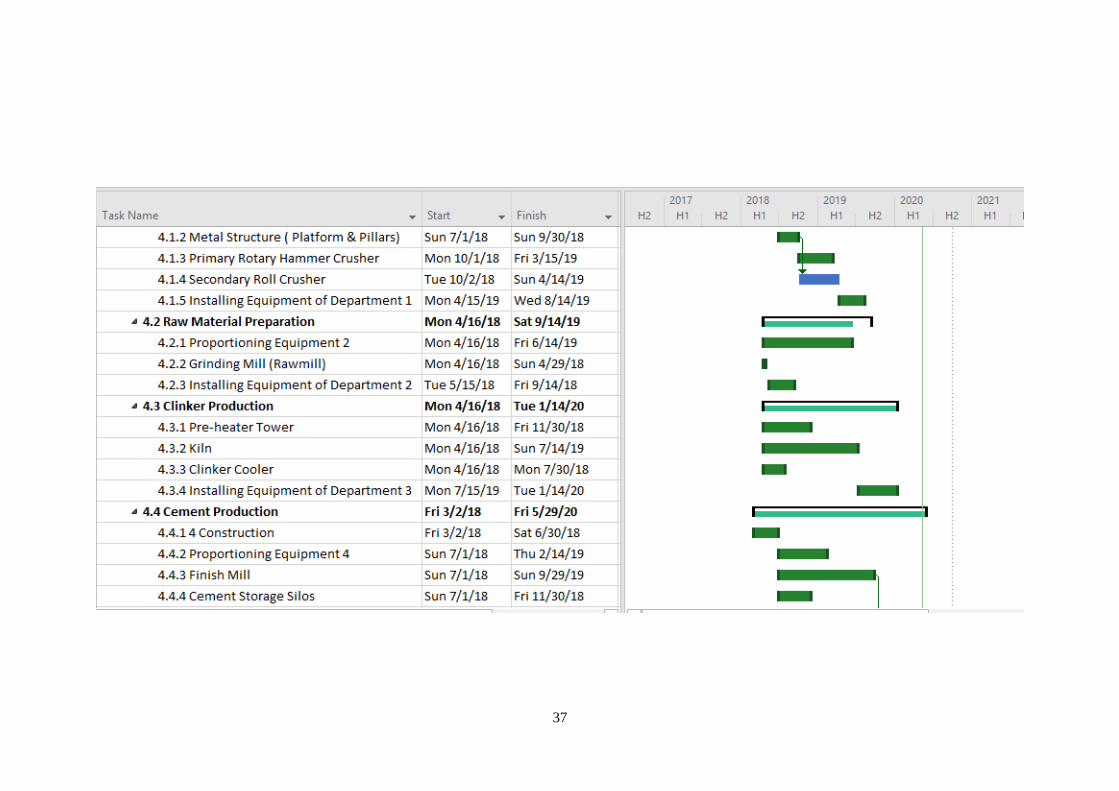
37