optimum ship routeing for bulk carrierweathernews.com/tfms/topics/seminar/2011/pdf/seminar... ·...
TRANSCRIPT

Optimum Ship Routeingfor Bulk Carrier
The 12th TFMS Forum 9 June 2011
YOKOKAWA Kazuo
不定期船における理想運航とは

Optimum Ship Routeing for Bulk Carrier
なぜ、全体最適化?Total optimization instead of partial optimization
どのように実現するか?
目標値の設定と管理へ- Target Management -

意思決定プロセスの形式知化
○ 運航の可視化(見える化)Visualization
○ コミュニケーション(対話型)Communication
Optimum Ship Routeing for Bulk Carrier

理想の運航とは ~配船計画通り?
○ 運送契約 貨物(種類、量)、区間、期間(含荷役)、運賃
☑ 本船性能の把握
☑ 運航指針の実現 (意思決定のサポート)
SpotCOA (Contract of Affreightment, 数量運送契約)CVC (Consecutive Voyage Charters, 連続航海傭船契約)
Optimum Ship Routeing for Bulk Carrier
What is your Ideal Voyage?

Arrival Time Window
Time
荷役可能期間 (運送契約:数日~10日間)
到着時間幅 (本船性能:~数日以下)
Max RPM770mt
Min RPM660mt
(例)
Optimum Ship Routeing for Bulk Carrier
Possible arrival time window based on performance (-few days)
Available arrival time window for loading/discharging (few - 10 days)
(ご質問1)出発前から、荷役可能期間内の到着は困難と分かる場合はありますか?Do you have some difficult cases to arrive in lay/can window before departure ?
(ご質問2)その場合、荷役可能期間を再設定できますか?Is it possible to adjust lay/can window?

0
100,000
200,000
300,000
400,000
500,000
600,000
700,000
200 300 400 500 600 700 800
Gain Maximumを目指す運航指針とは
合計Total
用船料Charterage
燃料費Bunker Cost
本船性能 (85%MCR)15 [knots] at 50 [mt/24h]
航海条件距離 5000 [nm]Arrival Time Window
400 – 640 [h]
運航コスト用船料 14,000 [USD/24h]滞船料 7,500 [USD/24h]燃料費 700 [USD/mt]
Optimum Ship Routeing for Bulk Carrier
航海時間 [h]
運航コスト
[USD
]

0
100,000
200,000
300,000
400,000
500,000
600,000
700,000
200 300 400 500 600 700 800
Gain Maximumを目指す運航指針とは
航海時間 [h]
運航コスト
[USD
]
本船性能 (85%MCR)15 [knots] at 50 [mt/24h]
航海条件距離 5000 [nm]Arrival Time Window
400 – 640 [h]
運航コスト用船料 14,000 [USD/24h]滞船料 7,500 [USD/24h]燃料費 700 [USD/mt]
滞船料を含めた合計+ Demurrage
Arrival Time Window
Optimum Ship Routeing for Bulk Carrier
合計Total
用船料Charterage
燃料費Bunker Cost

Service Procedure for OSR Bulk Carrier (意思決定のフロー)
Time Saving v.s. Bunker Savingby NCR / CP Spd < by 70% MCRFor minimizing > 60%charterage for the least FOC
Instruction/voyMCR xx %
Policy/fleetMCR 70>60>50%
Optimum Voyage Planning (OSR)
Evaluation / Auditing
Optimized time window based Lay-time/Canceling-date
Ship/Voyage Performance DB

Quick Instruction Template (QIT)
業務プロセスを形式知化⇒ 変化の激しい情報の管理と共有化へ。
WNI
Operator Master
QITPlan
Instruction
Vessel F
Jun. Jul. Aug.
Vessel A
Vessel B
Vessel C
Vessel D
Vessel E
Optimum Ship Routeing for Bulk Carrier

Speed/Consumption早見表 同型船比較Performance comparison
with sister vessels
本船性能データの蓄積と活用
20
25
30
35
40
90 100 110 120 130
8
10
12
14
16
18
90 100 110 120 130
RPM Speed [knots] FOC[rpm] Ballast Loaded [mt/24h]100 12.7 12.1 21.4105 13.3 12.7 24.8110 14.0 13.3 28.5115 14.6 13.9 32.6120 15.2 14.5 37.0
20
25
30
35
40
90 100 110 120 130
8
10
12
14
16
18
90 100 110 120 130
RPM Speed [knots] FOC[rpm] Ballast Loaded [mt/24h]125 15.1 14.6 41.0120 14.5 14.0 36.2115 13.9 13.4 31.9110 13.3 12.9 27.9105 12.7 12.3 24.3100 12.1 11.7 21.095 11.5 11.1 18.090 10.9 10.5 15.3
10
20
30
40
50
8 10 12 14 16 18
Speed [knots]
Dai
ly F
OC
[m
t/2
4h
] Vessel AVessel B
Optimum Ship Routeing for Bulk Carrier
Vessel performance data for fleet/voyage planning

Summary
☑ 本船性能の把握
☑ 運航指針の実現
Lay / Can に到着できない場合の船社様のアクション
運航指針のパターン
合理的な採算計画を見積るための基礎データ
不定期船における理想の運航を目指して

サービス事例Sample voyages
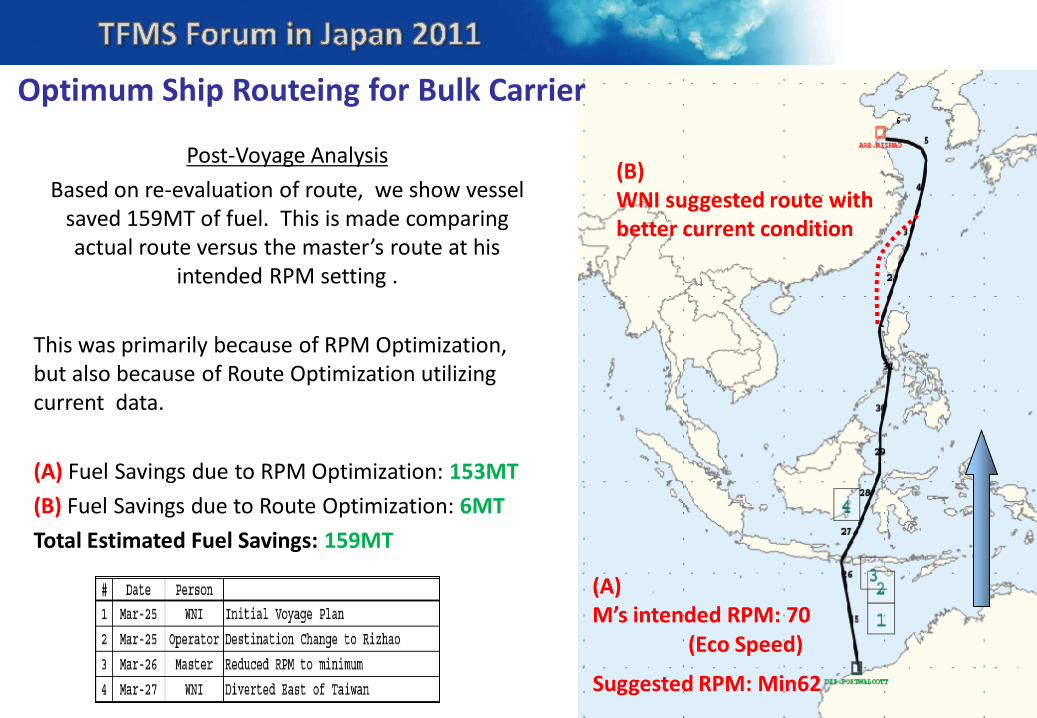
Post-Voyage Analysis
Based on re-evaluation of route, we show vessel saved 159MT of fuel. This is made comparing actual route versus the master’s route at his
intended RPM setting .
This was primarily because of RPM Optimization, but also because of Route Optimization utilizing current data.
(A) Fuel Savings due to RPM Optimization: 153MT
(B) Fuel Savings due to Route Optimization: 6MT
Total Estimated Fuel Savings: 159MT
Suggested RPM: Min62
(A)M’s intended RPM: 70
(Eco Speed)
(B)WNI suggested route with better current condition
Optimum Ship Routeing for Bulk Carrier

Actual ResultInitial Plan
Actual
Intention & update
Voyage Plan update throughCommunication!
Communication!Communication!
Optimum Ship Routeing for Bulk Carrier
“Shortest Route” vs. “Master’s Intended Route”
FO saved: 11-20 mt
Shortest
M’s Intention
“You can go to shortest atpresent timing!”
