options for low emission development in the sri lanka … for low-emission development in the sri...
TRANSCRIPT

OptiOns fOr lOw-emissiOn develOpment in the sri lAnKAdAiry sectOr Reducing enteric methane for food security and livelihoods


Published by
the Food and Agriculture Organization of the United Nations
and
the New Zealand Agricultural Greenhouse Gas Research Centre
Rome, 2017
OptiOns fOr lOw-emissiOn develOpment in the sri lAnKAdAiry sectOr Reducing enteric methane for food security and livelihoods

The designations employed and the presentation of material in this information product do not imply the expression of any opinion whatsoever on the part of the Food and Agriculture Organization of the United Nations (FAO) or New Zealand Agricultural Greenhouse Gas Research Centre (NZAGRC) concerning the legal or development status of any country, territory, city or area or of its authorities, or concerning the delimitation of its frontiers or boundaries. The mention of specific companies or products of manufacturers, whether or not these have been patented, does not imply that these have been endorsed or recommended by FAO or NZAGRC in preference to others of a similar nature that are not mentioned. The views expressed in this information product are those of the author(s) and do not necessarily reflect the views or policies of FAO or NZAGRC.
ISBN ISBN 978-92-5-109881-3
FAO encourages the use, reproduction and dissemination of material in this information product. Except where otherwise indicated, material may be copied, downloaded and printed for private study, research and teaching purposes, or for use in non-commercial products or services, provided that appropriate acknowledgement of FAO as the source and copyright holder is given and that FAO’s endorsement of users’ views, products or services is not implied in any way.
All requests for translation and adaptation rights, and for resale and other commercial use rights should be made via www.fao.org/contact-us/licence-request or addressed to [email protected].
FAO information products are available on the FAO website (www.fao.org/publications) and can be purchased through [email protected]
© FAO, 2017
Recommended citation:FAO & New Zealand Agricultural Greenhouse Gas Research Centre. 2017. Options for low-emission development in the Sri Lanka dairy sector – reducing enteric methane for food security and livelihoods. Rome. 38 pp.

iii
Acknowledgements iv
Executive summary v
Chapter 1A ClimAte ResilieNt dAiRy seCtOR FOR FOOd seCURity 1
Chapter 2OBJeCtiVes ANd APPROACH 2
Chapter 3OVeRVieW OF dAiRy PROdUCtiON 5 Chapter 4emissiONs ANd emissiON iNteNsities 10 Chapter 5eXPlORiNG tHe mitiGAtiON POteNtiAl iN dAiRy CAttle PROdUCtiON 16
Chapter 6PRiORitiZAtiON OF iNteRVeNtiONs tO AddRess eNteRiC metHANe 21
Chapter 7UN-lOCKiNG tHe POteNtiAl OF ‘NO ReGRets’ OPPORtUNities 25
Chapter 8Key messAGes ANd POliCy CONClUsiONs 26
Contents
iv
Acknowledgements
This document is a product of the collaborative ef-
fort between the Department of Animal Production
and Health in Sri Lanka and The National Science
Foundation, Sri Lanka; the Food and Agriculture
Organization of the United Nations (FAO); the New
Zealand Agricultural Greenhouse Gas Research
Center (NZAGRC) and the Climate and Clean Air Co-
alition (CCAC).
This project was led by a national core team com-
prising of Thakshala Serasinghe, University of Ruhuna;
Weerasinghe, Department of Animal Production and
Health, Gatambe; Sujatha Premarattne, University
of Peradeniya, Noble Jayasuriya, M.M.P Sumith,
University of Sabaragamuwa; Sudath Munasinghe,
Milco Ltd; U.L.P. Mangalika, Veterinary Research
Institute; Ijas Mohamed, Department of Animal
Production and Health, Colombo.
Overall project implementation, guidance and
support has been provided by the Project Team
including Carolyn Opio (FAO), Henning Steinfeld
(FAO), Pierre Gerber (FAO), Harinder Makkar (FAO),
Harry Clark (New Zealand Agricultural Greenhouse
Gas Research Centre - NZAGRC), and Victoria Hatton
(New Zealand Agricultural Greenhouse Gas Research
Centre - NZAGRC). Alessandra Falcucci (FAO), Monica
Rulli (FAO) and Juliana Lopes (FAO) provided input in
the research, modelling and analytical work.
This report has been written by Carolyn Opio
(FAO), Harry Clark (NZAGRC), Pierre Gerber (FAO)
and Henning Steinfeld (FAO).
Finally, special thanks to the Climate and Clean
Air Coalition (CCAC), the New Zealand Government
and Food and Agriculture Organization of the
United Nations for the funding support.

v
Executive summary
This study evaluates the potential for improving
milk production while reducing enteric methane
emission intensity from dairy production in Sri Lan-
ka. The overall objective of this study is to support
Sri Lanka in identifying low-cost strategies to re-
duce enteric CH4 emissions while contributing to the
countries’ short- to long-term social and economic
development and increasing resilience to climate
change.
The dairy sector has been identified as one of the
key sectors to contribute to the projected annual
national economic growth. The sector is envisaged
to ensure food security, provision of raw materi-
als for agro-industries, creation of employment
opportunities, generation of income and foreign
exchange earnings. The sector is however the most
vulnerable to the impacts of climate change and
extreme weather events. Due to these challenges,
the government recognizes the need to develop
interventions that make agriculture more resilient
to climate change and extreme weather events
while minimizing its contribution to greenhouse gas
emissions.
Benefits of moving towards a climate-resilient dairy sectorWith this in mind, Sri Lanka in its Intended Nation-
ally Determined Contributions (INDC) has put forth
adaptation actions to reduce its vulnerability to
climate change. These actions will also play a key
role in realizing the transition to a low-carbon, cli-
mate-resilient economy.
Adopting a low-carbon and climate resilient growth
pathway for the dairy sector could benefit Sri Lanka
in several ways:
• The dairy industry is the most important live-
stock sub-sector. It contributes 7.5 percent to
agricultural Gross Domestic Product (GDP) and
0.8 percent of total GDP. The dairy sector current-
ly provides income and employment to about
400,000 farmers. Milk production in Sri Lanka is
predominantly managed by small-scale farmers,
who own one to three dairy animals, and pro-
duce about 70 percent of the milk in the country.
Milk production is primarily a small farmer enter-
prise; 72 percent of the milking herd is found on
holdings of less than one hectare and another 20
percent on holdings that are in the 1-2 hectare.
Amongst these dairy farmers are some of the
poorest and most marginalized such as women.
Considering the importance of the dairy sector to
rural livelihoods and its potential role in poverty
reduction, implementing a low-emissions devel-
opment strategy for the dairy sector through the
adoption of performance-enhancing technolo-
gies and use of incentives is expected to signifi-
cantly increase milk yields with net benefits in the
short-to-medium term.
• Milk is one of the most complete foods; it is rich
in high quality protein providing all ten essential
amino acids and is an excellent source of calci-
um and vitamin B2, vitamin A, and a fair source
of vitamin D. Milk is therefore a crucial source
of nutrition in a country which has one of the
highest rates of under-nutrition in the world; 30
percent of the children under 5-years of age are
undernourished. Current per capita consumption
of milk and milk products in Sri Lanka is on aver-
age 35 litres of milk per day - very low compared
with the World Health Organization’s recommen-
dation of 200 litres per year.
• Dairying represents one of the fastest returns for
dairy farmers in the developing world. It provides
milk for home consumption, regular cash flow
from milk sales to farmers, especially to women,
enhances household nutrition and food security
and creates off-farm employment. In Sri Lanka,
dairy animals are one of the most valuable assets
for rural households playing many functions such
as traction, nutrient value and risk management.

OptiOns fOr lOw emissiOn develOpment in the sri lAnKA dAiry sectOr
Vi
• The “National Policy on Agriculture and Livestock”
provides a clear statement of the Government’s
objective to move towards increasing sufficiency.
The dairy industry has been earmarked as a pri-
ority area for investment and development in the
livestock sector. The main policy target is attain-
ing 50 percent self-sufficiency by 2015 and the
medium term goal is to reduce the proportion of
imported milk from the current level of 70 percent
to 35 percent by 2020. This will help reduce the
drain on the country’s foreign exchange resources,
support employment and family incomes in the
rural areas.
• The current productivity of dairy animals in gen-
eral is low, which results in a shortage of supply
of dairy products. For example, on average, milk
yields range from 6.5 litres per cow per day in the
intensive systems (Upland and Mid-country pro-
duction zone) to 1 litres per cow per day in exten-
sive systems in the Dry Lowland production zone.
Seasonal fluctuation of milk production – the yield
per cow and by extension the total amount of milk
produced fluctuates greatly during the year. Milk
yields are low and largely variable mainly because
of poor and limited feed resources, disease and
poor herd management. Milk yields remain low
even in semi-intensive and intensive systems in the
Upland and Mid-country production zone that rear
high yielding exotic breed and cross-breeds. These
animals cannot reach their full genetic potential if
factors in their environment are limiting.
• Given the dependence of the country on agricul-
ture and natural resources, Sri Lanka is also highly
vulnerable to climate change. Sri Lankan agricul-
ture has already felt the effect of extreme weather
events and impacts of a changing climate, includ-
ing: a slow but steady rise of ambient temperature
(0.01–0.03 °C per year); high-intensity rainfall
resulting in landslides and soil and coastal erosion;
salinity intrusion into soils and aquifers; torna-
do-type winds; and increasingly extreme droughts
and floods. Future climate change will continue
to impact the agricultural sector in general, but
will be especially acute for Sri Lanka’s smallholder
farmers. Solutions that both enhance the sector’s
resilience to climate change while at the same
time reduce its contribution to GHG emissions are
required.
Emissions and emission intensities from the dairy productionThe dairy cattle sector produces about 0.32 million
tonnes of milk; of this 43 percent of the milk is pro-
duced by the intensive systems in the Upland and
Mid-country production zones, while 31 percent, 18
percent and 8 percent is produced in the Dry Low-
land, Coconut Triangle and Wet Lowland zones, re-
spectively.
Milk production from the dairy cattle sector in
Sri Lanka emits about 2.3 million tonnes CO2 eq. The
emission’s profile of milk is dominated by methane
(93.2 percent), while the nitrous oxide (N2O) and
carbon dioxide (CO2) contribute 1.6 percent and 5.2
percent of the total emissions, respectively.
Three sources of emission contribute the bulk of
emissions from dairy cattle. Approximately 88 per-
cent of the emissions arise from methane produced
by the rumination of cows and 5 percent from
the management of stored manure. CO2 emissions
associated with feed production, transport and pro-
cessing contribute an additional 5 percent to total
emissions.
At national level, the emission intensity of milk
produced in Sri Lanka is on average 6.9 kg CO2
eq./kg FPCM; the highest values were estimated
for the low input-output dairy systems in the Dry
Lowland zone and the lowest in in the intensive
systems in the Upland and Mid-country production
zone. Emissions were on average, 13.8, 6.8, 4.8
and 2.3 kg CO2 eq./kg FPCM for the Dry Lowland,
Coconut Triangle, Wet Lowland and Upland and
Mid-Country systems, respectively
Options for improving productivity and reducing enteric methane per unit of outputImproving animal and herd productivity is one of the
key pathways to reduce enteric CH4 emissions per
unit of product. Methane is produced in the process
of feed energy utilization by the animal. Changes in
the efficiency of feed energy utilization therefore
influence enteric methane emissions of animals. The
efficiency of feed energy utilization depends on the
type of animal, the type or quality and quantity of
feed, environmental conditions, etc. The way feed
energy is partitioned between the different body
functions (maintenance and production) also ex-
plains the variation in emission intensity.

OptiOns fOr lOw emissiOn develOpment in the sri lAnKA dAiry sectOr
Vii
Upland and mid-country
Coconuttriangle
Wetlowland
Drylowland
Productive efficiency and dilution of the maintenance requirements
The nutrient requirements of cows come from two com-
ponents – maintenance and production. Maintenance re-
quirements are the nutrients needed for cows to live every
day. They are used to maintain metabolic functions such
as walking around, breathing, digesting food and regulat-
ing body heat. All animals have a necessary maintenance
requirement that must be met and results in no produc-
tion, yet are still associated with CH4 losses. Once all main-
tenance requirements are met then leftover nutrients can
be used for milk production and other functions such as
reproduction and growth.
The biological processes underlying improved produc-
tive efficiency is known as the ‘dilution of maintenance’
effect (Bauman et al., 1985; VandeHaar and St-Pierre,
2006). A lactating dairy cow requires daily nutrients for
maintenance and for milk synthesis. The maintenance
requirement does not change with production level and
therefore can be thought of as a fixed cost needed to
maintain vital functions.
As shown in the Figure below, the average maintenance
energy requirement for milking cows in Upland and
Mid-country, Coconut triangle, Wet lowland and Dry low-
land systems is 27.8, 25.8, 20.5 and 19.9 MJ per day, re-
spectively. Assuming milk composition remains constant,
the nutrient requirement per unit of milk production also
does not change, but the total energy cost for lactation
increases as a function of milk production. It can therefore
be thought of as a ‘variable cost’ of dairy production. A
high-producing dairy cow requires more nutrients per day
than a low producing animal; the cow with a daily milk
output of 6.5 kg per day uses 56 percent of consumed
energy for maintenance whereas the low producing cow
(1 kg milk/day) uses 70 percent of energy intake for the
maintenance (Figure below). Increased production thus
dilutes out the fixed cost (maintenance) over more units
of milk production, reducing the total energy requirement
per kg of milk output. A cow producing an average of 6.5
kg milk/day in Upland and Mid-country systems requires
7.6 MJ/kg milk, whereas a cow yielding 1 kg/day in Dry
Lowland dairy systems needs 32 MJ/kg milk.
Energy requirement for milking cows in dairy systems in Sri Lanka
Source: GLEAM, 2017
Bauman, d.e., s.N. mcCutcheon, W.d. steinhour, P.J. eppard and s.J. sechen. 1985. Sources of variation and prospects for improvement of productive efficiency
in the dairy cow: A review. J. Anim. Sci. 60:583-592; VandeHaar, m.J. and N. st- Pierre. 2006. Major advances in nutrition: Relevance to the sustainability of the
dairy industry. J. Dairy Sci. 89:1280-1291
64%56% 68% 70%
5
0
10
15
20
25
30
35
40
45
50
OptiOns fOr lOw emissiOn develOpment in the sri lAnKA dAiry sectOr
Viii
Research shows that there are several technol-
ogies that if comprehensively applied throughout
the sector would make a rapid and important con-
tribution to improving the technical performance
and profitability of dairy production while reducing
GHG emissions. Improved practices and technolo-
gies such as strategic supplementary feeding, and
improving the diet quality, adequate animal health
control, and improved animal husbandry practices
are some of the techniques that can improve dairy
productivity and reduce emission intensity.
In the assessment of technical options for the main
dairy cattle production systems, the following crite-
ria were used:
• Interventions had to have potential for improv-
ing productivity while at the same time reducing
enteric CH4 emissions per unit of output.
• Interventions had to be feasible in the short or
medium term. Feasibility was first determined by
sectoral experts and selected interventions had to
have already been implemented or in use at least
at farm level in Sri Lanka.
A team of national experts identified key areas to
address low productivity in dairy systems including:
(i) improving the quality and availability of feed re-
sources; (ii) strategic feeding and supplementation
to address feed seasonality constraints; and (iii) im-
proved herd management and animal health inter-
ventions. Within this broad categorization, 6 single
interventions and 1 ‘package’ consisting of combina-
tion of single interventions were assessed.
Mitigation of enteric methane results in 15 percent - 45 percent increase in milk production
This work shows that significant reductions in
methane emission intensity can be realized through
the adoption of existing and proven technologies
and practices. Overall, the analysis shows that there
scope to reduce emission intensities; methane emis-
sion intensity (kg CO2 /kg FPCM) can be reduced by
10 percent to 29 percent, the magnitude of impact
will vary depending on the intervention and produc-
tion system; not all systems have equal opportunity
to mitigate emissions.
Many of the biological effects are interrelated
and interdependent and, accordingly, the changes
in enteric CH4 emissions per unit of milk (kg CH4/kg
FPCM) are not additive. The reduction in CH4/FPCM
range is modest because the range of alterations was
restricted to what might reasonably be implemented
or expected occur in dairy production. The implemen-
tation of many of the improvements is limited to lac-
tating dairy cattle for practical or economic reasons
and, thus, the reductions in enteric CH4 are modest.
All interventions returned a positive productivity
outcome with increases in milk production ranging
between 15 percent and 45 percent.
Reduction of enteric methane emissions is profitable for farmersA key incentive to farmers adoption is increased rev-
enue and/or reduced production costs. To better un-
derstand the implications for farmers, a cost benefit
analysis was conducted to assess the profitability of
adopting mitigation intervention. The benefit-cost
ratio (BCR) indicates the overall value for money of
the interventions. Generally, if the ratio is greater
than 1, benefits of the interventions outweigh the
costs. In this study the, the BCR for different mitiga-
tion options ranged from 1.6 to 4.3 indicating that
benefits exceed economic costs for the different op-
tions considered.
The results from the BCR analysis shows the
investment returns as a result, those interventions
with low investment requirements tend to perform
better. Low-input systems with relatively low
production costs such as those in the Dry Lowland
zone, also returned higher benefits compared to the
intensive systems.
A preliminary ranking of interventions per pro-
duction system to identify interventions with high
reduction potential, increased production and high
economic return was undertaken to provide an
indication of what is workable. Putting the reduc-
tion potential, productivity increase and returns
to farmers allows for a first-order prioritization of
interventions.
Out of the 6 interventions assessed, only one (use
of total mixed rations) was considered relevant for
the Upland and Mid-country production zone. Only
two of the four interventions selected for the Dry
and Wet Lowland systems were included in the prior-
itization process. Three interventions were assessed
for Coconut triangle. Interventions excluded from
the prioritization process intervention did not meet

OptiOns fOr lOw emissiOn develOpment in the sri lAnKA dAiry sectOr
iX
the threshold methane reduction target of more
than 10 percent.
The use of total mixed ration (TMR) in the Upland
and Mid-country production zone ranks high on the
productivity criteria and low on the methane reduc-
tion and economic criteria.
The interventions (all related to feed) assessed
for the 3 other production zones (Coconut triangle,
Wet lowland, and Dry lowland) gave similar ben-
efits (ranging from moderate to high) in terms of
methane reduction, milk yield increase and financial
returns to farmers.
The full summary of interventions analyzed inter-
ventions analyzed for each production systems is
presented in the figure below. It demonstrates the
comparative benefits (in quantitative terms) of each
intervention covering increase in milk production,
a benefit cost ration (BCR) score for each interven-
tion to indicate the investment performance and
the annual emissions reduced/avoided through the
adoption of each intervention.
Reducing enteric CH4 via increasing productivity
is economically viable in most situations; several
activities that reduce methane emissions have low
or negative economic costs when considering the
increase in production. This study has identified
a range of abatement options with negative net
present cost which should be attractive investment
opportunities, yet are not implemented. All
interventions assessed are cost-beneficial (i.e.
measures that not only reduce GHG emissions but
also save money in the long term) accounting
for an abatement potential of 1.4 million tonnes
CO2 eq., annually. The idea of significant savings
opportunities being ignored by the sector does not
make economic sense. Clearly, there are barriers
preventing these savings-creating measures from
being taken up at once.
INTERVENTIONS MILK PRODUCTION GHG EMISSIONS SAVINGSBCR
68.2
8.5
8.5
1.58
1.90
1.58
1.64
1.88
2.08
2.95
1.63
3.43
3.73
4.28
3.38
1.56
1.79
2.8
1.55
142
Use of total mixed ration
BASELINE
Animal comfort (heat stress)
Mastitis prevention and control
Thousand tonnes milk Thousand tonnes C02 eq. * year
COCO
NU
T TR
IAN
GLE
WET
LO
WLA
ND
DRY
LOW
LAN
DU
PLAN
D AN
D M
IDCO
UN
TRY
PRO
DU
CTIO
N Z
ON
E
53.5
16.9
13.6
Animal comfort (heat stress)
Supplementation with fodder trees and low cost concentrate
Udder health management (prevention of mastitis)
BASELINE
BASELINE
Supplementation of forage diet with gliricidia Blocks
Supplementation with rice straw concentrate mixture
60
3.6
3.6
1.5
1.5
2.9
5.5
12.2
28.3
34.9
65.4
90.4
11.3
19.1
109.5
182.8
Supplementation with fodder trees and low cost concentrate
Supplementation of forage diet with gliricidia Blocks
Udder health management (prevention of mastitis)
Animal comfort (heat stress)
Supplementation with fodder trees and low cost concentrate
Udder health management (prevention of mastitis)
Animal comfort (heat stress)
26.4
25.9
50.3
26.7
Supplementation with rice straw concentrate mixture 59.1
101.9
6.1
6.1
42.2
46.6
401.7
304.8
74.3
Summary of quantitative impacts of each interventions
Note: BCR: benefit-cost ratio; Milk production (Red column=Baseline): additional milk production with the adoption of the intervention (Gray columns=Mitigation);
Emission savings: GHG emissions reduced with the intervention


1
CHAPTER 1
A climate resilient dairy sector for food security
The dairy industry is earmarked as the priority area for
investment and development in the livestock sector.
The main policy target is attaining 50 percent self-suf-
ficiency by 2015 and the medium term goal is to dou-
ble the local milk production to reduce the proportion
of imported milk from the current level of 70 to 35
percent by 2020.
Currently, only 35 percent of the national milk
requirement is met through local production. The
consumption of milk and other dairy products is
expected to increase over the next few years, with
increasing per-capita income and living standards of
people. Sri Lanka spends around US$ 400 million a
year on the importation of milk powder. With the
aim of reducing the drain on the country’s foreign
exchange resources and supporting employment gen-
eration and family income, the government and the
dairy industry has committed to improving productiv-
ity. To be self-sufficient in milk a further 482 million
liters has to be produced annually. It would be an
impossible task to achieve this production target with
the present production of the national herd. In a
business as usual situation, meeting this target given
current levels of production would mean a doubling
of the number of milking animals.
Around 28 percent of the country’s population
depends on livelihoods related to agriculture.
The sector is however the most vulnerable to
the impacts of climate change and extreme weath-
er events. Enhanced temperatures and change in
precipitation regimes have led to reduced suitability
of agro-based enterprises; reducing productivity of
crops, livestock and fisheries due to temperature
and water stresses; and rising production costs. The
increase in frequency and intensity of extreme weath-
er events such as droughts and floods have led to loss
of investments, incomes and livelihoods, the destruc-
tion of agro-based infrastructure as well as increased
frequency of weather related disasters. Due to these
challenges, the government recognizes the need to
develop interventions that make agriculture more
resilient to climate change and extreme weather
events while minimizing its contribution to green-
house gas emissions.
In particular, the National Adaptation Plan for
Climate Change Impacts1 has identified adaptation
priority areas for livestock including: development
of heat tolerant breeds, promote intensive manage-
ment of livestock, develop disease resistant breeds,
improvement of pasture and fodder management
(diversification into other feeds other than pasture,
promote feed conservation, silage and hay). Many of
these interventions will also have positive impacts on
both productivity and emissions from the sector.
This report presents the findings and recommen-
dations from an initial assessment of the dairy cattle
sector of Sri Lanka. It is undertaken in collaboration
with the Department of Animal Production and Health
in Sri Lanka and the National Science Foundation and
funded by Climate and Clean Air Coalition (CCAC),
the New Zealand Government and the Food and
Agriculture Organization of the United Nations (FAO).
The primary focus of this initial assessment is
to identify and prioritize interventions to reduce
enteric methane emission intensity from ruminant
systems that are consistent with other development
goals. To that end, this report examines the scale of
enteric methane emissions from the dairy sector, and
identifies cost-effective interventions through which
methane can potentially be reduced. This analysis is
meant to inform where reductions can be made and
to systematically explore emission reduction opportu-
nities with the objective to translate emission savings
into benefits for producers.
1 Government of Sri Lanka (2015). National adaptation plan for climate change impacts in Sri Lanka, 2016-2025. http://www.climatechange.lk/NAP/NationalAdaptationPlan_RevisedFinal.26.10.2015.pdf

2
This study seeks to identify and evaluate low-cost options
that Sri Lanka can implement in the short-to-medium
term geared towards improving productivity in dairy
cattle production systems, reducing enteric methane
emissions and fostering economic development.
Three main methodological steps were employed in
this study (Figure 2.1):
1) establishment of a baseline scenario; Including
the selection and characterization of production
system, estimation of GHG emissions and emission
intensity, and identification of key determinants of
low productivity and emission intensity.
2) Assessment of the mitigation potential. Identi-
fication of system specific interventions consistent
with development objectives for improving pro-
ductivity, addressing enteric methane emissions and
quantification of the mitigation potential.
3) Prioritization of interventions. Prioritization of in-
terventions is undertaken by drawing on modeling
results and cost-benefits analysis. It assesses produc-
tivity impacts, the potential profitability for farmers
in adopting implementing the selected interven-
tions and identifies the implementation barriers.
A key focus of this work is on interventions that reduce
emission intensity while maintaining or increasing milk
production such that climate change and productivity
improvement can be pursued simultaneously (Box 1).
The analysis focuses on the dairy cattle sector,
a strategic sector in Sri Lanka that was selected in
consultation with front-line government ministries
e.g. ministry of livestock, environment, academia
institutions, and public and private stakeholders.
The huge and diverse livestock population, varied
and favorable agro-ecology for dairying, increasing
demand for dairy products in urban and peri-urban
areas, as well as the long-standing culture of dairy
products consumption, are criteria that have sup-
ported this choice.
Smallholder dairy development presents a prom-
ising option to boost rural incomes, improve food
and nutrition security, and create employment along
the dairy value chain; thus contributing to the
National rural development policy and strategy.
The study undertakes biophysical modeling
and scenario analysis using the Global Livestock
Environmental Assessment Model2 (GLEAM) to
CHAPTER 2
Objectives and approach
Figure 2.1: Process framework for the identification and prioritization of interventions to address enteric methane
2 FAO – The Global Livestock Environmental Assessment Model – GLEAM http://www.fao.org/gleam/en/

OptiOns fOr lOw emissiOn develOpment in the sri lAnKA dAiry sectOr
3
Box 1: Absolute emissions versus emission intensity
Box 2: Modelling GHG emissions from dairy production systems in Sri Lanka
The primary determinants of enteric methane emissions
are feed intake, and fermentation characteristics of that
feed in the rumen. In general, management practices that
increase the proportion of feed used to produce meat or
milk rather than maintain the animal, reduce the amount
of methane per unit of animal product produced (emis-
sions intensity). Higher individual animal productivity gen-
erates more animal product and more methane per animal
but as a smaller proportion of the feed consumed is used
to maintain the animal emissions intensity is reduced.
The same amount of animal product can be produced
with fewer methane emissions if producers keep fewer
animals. More intensive production provides flexibility
to control emissions and generally improves profitability.
However, increasing feed intake per animal will always
lead to an increase in total farm methane production un-
less the total number of animals is reduced.
In low and medium-income countries, the concept of
emission intensity remains the most attractive mitigation
route because it allows for the harnessing of synergies
between food security and development objectives and
climate change mitigation goal. Emissions intensity re-
ductions will reduce absolute emissions below the busi-
ness-as-usual.
In this study, the Global Livestock Environmental Assess-
ment Model (GLEAM; Gerber et al. 2013) is the main
analytical tool used to assess the emissions and emission
intensities in the baseline scenario and to assess the emis-
sion reduction potentials of selected interventions.
GLEAM is a spatially explicit model of livestock produc-
tion systems that represents the biophysical relationships
between livestock populations, production, and feed in-
puts (including the relative contribution of feed types—
forages, crop residues, and concentrates—to animal di-
ets) for each livestock species, country, and production
system. The production parameters and data in GLEAM
have been drawn from an exhaustive review of the lit-
erature and validated through consultation with experts
during several joint projects and workshops. The relation-
ships between GHG emissions and production have also
been cross validated for ruminants across a range of re-
gions and studies, and published reports on GLEAM have
also been through rigorous peer review (Opio et al. 2013;
Gerber et al. 2013). GLEAM works at a definition level
of 1 km2, the spatially explicit GLEAM model framework
allows the incorporation of heterogeneity in emissions,
emission reductions and production responses.
The model was further developed to meet the needs of
this study. The dairy production systems in GLEAM were
further refined to reflect the specificities of the dairy cat-
tle production systems in Sri Lanka and the database of
production systems parameters was updated with more
recent and system specific information and data on cattle
populations, performance parameters, feeding systems,
manure management, etc. taken from national databas-
es. The GLEAM framework is used to characterize the
baseline production and GHG emission output of dairy
production systems. Emissions and emission intensities are
reported as CO2 eq. emissions, based on 100-year global
warming potential (GWP100) conversions factors as re-
ported by the IPCC in its 5th Assessment Report (AR5).
The abatement potential for each practice was calcu-
lated by estimating the changes from the baseline GHG
emissions, following the application of system specific
interventions. To specify each abatement practice within
GLEAM, it was necessary to incorporate additional data
and information on the impacts associated with the ap-
plication of the interventions. These data were obtained
from a range of literature sources and databases.
The calculations are performed twice, first for the base-
line scenario and then for the mitigation scenario. Emis-
sion intensity reductions and changes in productivity can
then be compared to those under the baseline scenario.
Source: http://www.fao.org/gleam/en/
Gerber, P. J., Steinfeld, H., Henderson, B., Mottet, A., Opio, C., Dijkman, J.,
Falcucci, A. & Tempio, G. (2013). Tackling climate change through livestock: a
global assessment of emissions and mitigation opportunities;
FAO. 2013a. Greenhouse gas emissions from ruminant supply chains – A global
life cycle assessment, by C. Opio, P. Gerber, A. Mottet, A. Falcucci, G. Tempio,
M. MacLeod, T. Vellinga, B. Henderson & H. Steinfeld. Rome.

OptiOns fOr lOw emissiOn develOpment in the sri lAnKA dAiry sectOr
4
Figure 2.2: Process for exploring mitigation impacts
Consultation withexperts to identify
system specific interventions
Literature reviewto provide
evidence and data of impacts
List of technologies and practices
List of parameters and quantified impacts
Quantified impacts for single and packages of interventions:
El reduction potential (kg C02 eq./kg FPCM)and productivity change (kg FPCM)
Quantified emissionreduction impacts
1.
2.
Model impact on emissions and
emission intensitiesand productivity
3.
Select and design intervention
packages and modelling of impact
4.
provide a broad perspective of opportunities and
attainable goals in terms of productivity gains and
emission intensity reduction in the dairy sector
(Box 2). The scenario analysis uses the outputs of
the biophysical analysis combined with information
taken from published literature, existing studies
and expert knowledge on potential impacts of each
intervention on herd performance and production to
quantify the emission intensity reduction potential.
The range of options evaluated (referred to as
“interventions”) were selected by national sec-
tor experts based on their potential for methane
emission intensity reductions, their impact on milk
production and their feasibility in terms of political,
social, institutional, and other preconditions. The
interventions identified are presented individually
and with a subset evaluated as a ‘package’, in order
to demonstrate to stakeholders how a combination
of interventions would impact reduction potential
and productivity gains. It also gives the ability to
assess this flexibly within the framework of polit-
ical conditions, available resources, and other con-
siderations. Figure 2.2 presents the generic steps
undertaken in the identification of interventions
and assessment of their impacts on enteric meth-
ane emissions and production. ability to assess this
flexibly within the framework of political condi-
tions, available resources, and other considerations.
Figure 2.2 presents the generic steps undertaken in
the identification of interventions and assessment
of their impacts on enteric methane emissions and
production.

5
The dairy industry is single largest agricultural sub-sec-
tor in Sri Lanka. It contributes 7.5 percent to agricul-
tural Gross Domestic Product (GDP) and 0.8 percent of
total GDP. The dairy sector currently provides income
and employment to about 400,000 farmers. In terms
of nutrition and food security, per capita consumption
of milk in 2014 was 35 litres and demand for dairy
products is projected to continue to grow rapidly as a
consequence of population growth.
Total milk production from dairy cows in 2014
was about 0.32 million tonnes. Milk production is
only sufficient to satisfy 25-30 percent of the national
demand; the rest is imported. Powdered milk and
milk products imports have increased by 3.3 percent
compared to 20133. It has been estimated that a fur-
ther 482 million liters has to be produced annually for
the country to be self-sufficient in milk4. Thus to fulfill
this gap of demand the country heavily depends on
milk imports, mainly as powdered milk. Twenty-five
years ago, Sri Lanka barely imported 5,000 Mt of milk
powder per year, and in 2012, it rose to almost 85,000
tonnes5. Sri Lanka spends around US$ 400 million a
year on the importation of milk powder6. The main
policy target of the National Livestock Development
Policy is to attain 50 percent self-sufficiency by 2015
and the medium term goal is to double the local milk
production to reduce the proportion of imported milk
from the current level of 70–35 percent7.
Milk production in Sri Lanka is predominantly
managed by small-scale farmers, who own one to
three dairy animals, and produce about 70 percent of
the milk in the country.
Many factors influence the distribution of live-
stock in Sri Lanka dominant among them being the
agro-ecological zoning (Box 3) and proximity to
markets and feed resources.
Dairy cattle management systems in different
parts of the country have largely been infuenced by
the climate, type of crops grown and cropping pat-
terns, availability of grazing land, genetic make-up
of the animals and the main production objectives.
From the point of view of livestock production,
the country is divided into four production zones,
namely: Upland and Mid-country, Coconut Triangle,
Wet Lowland and Dry Lowland (Map 3.1).
• The Upland and mid-Country are characterized
by small holdings under intensive/semi-inten-
sive management, with pure-bred or cross bred
European breeds of cattle, zero-grazing with
high inputs of feed. Primary objective is milk
production with meat as a by-product of the
dairy industry.
• The Coconut triangle, is a high potential area for
dairy development and is characterized by small
herds managed under semi-intensive system with
either tethered or free grazing on natural pas-
tures/legumes under coconut and other perenni-
al crops. Primary products are milk and draught
with surplus animals being sold for meat.
• The Wet lowland covers both the highlands and
the southwest region. This is the most inten-
sively exploited zone with 67 percent of its area
under permanent agriculture. Cattle comprise of
crosses of exotic breeds, Zebu types, Indigenous
CHAPTER 3
Overview of dairy production
3 Government of Sri Lanka. 2014. Statistical Bulletin, Department of Animal Production and Health. http://www.daph.gov.lk/web/images/content_image/publications/livestock_stat_bulletin_2014.pdf
4 National Livestock Development Board, (2013). ‘Sri lanka Dairy Development Project’, http://www.nldb.gov.lk/Doc/Dairy_Development_Project.pdf5 Nanayakkara, P. (2013). ‘Liquid Milk: On the path to self-sufficiency’, Business Today, 2013.05, http://www.businesstoday.lk/cover_page.php?issue=2626 Nathaniel, C. (2014). ‘Milk Production in a Quandary?’7 Marambe B; Silva P; Weerahewa J; Pushpakumara G; Punyawardena R; Pallawala R. 2014. Enabling policies for agricultural adaptations to climate change in Sri Lanka. In: Handbook of
Climate Change Adaptation. Leal W. (ed.). Springer-Verlag Berlin Heidelberg. (Available at: http://link.springer.com/ referenceworkentry/10.1007/978-3-642-40455-9_108-2).

OptiOns fOr lOw emissiOn develOpment in the sri lAnKA dAiry sectOr
6
animals and their crosses, with limited grazing
and mostly cut and carry from roadsides.
• The dry lowland covers virtually two thirds of
the island and encompasses a considerable variety
of settings, from sub-humid forest to dry scrub
to large irrigated rice-growing areas. The largest
number of cattle is found in the dry zone, where
herd sizes are also the largest. Characterized by
indigenous cattle, zebu cattle and their crosses
and buffaloes, generally free grazing.
Milk production takes place in all parts of the
country (Map 3.1). While the largest cattle popula-
tion is found in the dry and intermediate zones, the
mid-country and upland zones are the main milk
production areas. These zones also reflect the level of
production intensity where: intensive stall feeding is
practiced in Upland area; semi-intensive production in
Mid-country; tethering/semi-extensive in the Coconut
Triangle and grazing/extensive production in the Dry
Zone. Table 3.1 summarizes the key features of the
four systems.
The dairy cattle sector produces about 0.32 mil-
lion tonnes of milk; of this 43 percent of the milk
is from the Upland and Mid-country systems, while
Box 3: Agro-climatic zones of Sri Lanka
Sri Lanka can be divided into three Agro-climatic zones;
Dry Zone, Intermediate Zone and Wet Zone (Figure below).
The Wet Zone covers both the highlands and the
southwest region. This is the most intensively exploited
zone with 67 percent of its area under permanent agri-
culture. This zone receives relatively high mean annual
rainfall of 1800-2,500 mm/year without pronounced
dry periods.
The dry Zone covers virtually two thirds of the island
and encompasses a considerable variety of settings,
from sub-humid forest to dry scrub to large irrigated
rice-growing areas. It covers predominantly the north-
ern and eastern part of the country. The Lowland Dry
zone receives a mean annual rainfall of less than 1,750
mm with a distinct dry season from May to September.
The intermediate Zone covers an area of about
1.2 million ha of the country. The intermediate zone re-
ceives a mean annual rainfall between 1,750 to 2,500
mm with a short and less prominent dry season. It is
dominated by coconuts along the Western Coastal re-
gion, where dairy production has a long tradition.
The largest number of cattle is found in the dry
zones, where herd sizes are also the largest. The rela-
tive distribution of cross-bred dairy cattle is highest in
the Upland and mid-country zones as well in the wet
lowlands near Colombo. In the former case, this can be
attributed to the temperate climatic conducive to the
health and performance of improved animals. While in
the latter, it may be attributed to the high milk prices
available through the informal market close to the urban
area, under which circumstances the risks to improved
animals of lowland conditions are acceptable.
Within these three climatic zones four major ruminant
livestock production zones can be identified, namely Up-
land country and Mid-country system, Coconut triangle,
Wet lowland and Dry lowland systems.
Agro-ecological zones in Sri Lanka
DRY ZONE
INTERMEDIATE ZONE
WET ZONE

OptiOns fOr lOw emissiOn develOpment in the sri lAnKA dAiry sectOr
7
Map 3.1: Geographical distribution of dairy cattle herd across production zones
Source: GLEAM, 2017
Ampara
Anuradhapura
Monaragala
Kurunegala
Badulla
Puttalam
Galle
Kandy
BatticloaMatale
Mulathiv
Rathnapura
Polonnaruwa
Mannar
Kegalle
Vavuniya
Trincomalee
Kalutara
Hambanthota
Matara
Jaffna
Gampaha
Nuwaraeliya
Kilinochchi
Colombo
Heads per sq. km
Dry lowland
< 10
10 - 20
20 - 30
30 - 40
> 40
Coconut triangle
< 18
18 - 22
22 - 26
> 26
Upland and mid-country
< 5
5 - 15
15 - 25
> 25
Wet lowland
< 6
6 - 12
12 - 22
> 22
Cells with low density of animals
31 percent, 18 percent and 8 percent is produced
in the Dry Lowland, Coconut Triangle and Wet
Lowland systems, respectively. The productivity of
dairy cows in Sri Lanka is highly variable within
the same systems but also increases as production
intensifies (Map 3.2).
The Upland and Mid-country dairy systems pro-
duce the largest share of milk from 13 percent of
milking animals. The Dry Lowland, Coconut Triangle
and Wet Lowland contribute to total milk produc-
tion with 65 percent, 16 percent and 6 percent of
the milking cows, respectively (Figure 3.1).

OptiOns fOr lOw emissiOn develOpment in the sri lAnKA dAiry sectOr
8
Table 3.1: Summary description of dairy cattle production systems in Sri LankaProduction system Characterization
Up-Country and mid-Country (Wet Zone)
Semi-intensive /stall feeding
Diet Cut and carry (local fodder) with high inputs of concentrate feed; small herds some tethering
Genotype Pure exotic/crossbred, some Zebu crosses
Productivity Exotic breeds: 12-18 litres milk/cow per day Crossbred: 5-8 litres/cow per day
Reproductive Practice Breeding by artificial insemination, average calving interval 12-18 months
Coconut triangle
Free grazing on natural pasture/Tethering
Diet Mixed grazing on natural pasture/legumes under coconut; tethering on the roadside and fallow land; rice straw freely available along with limited concentrate.
(Wet Zone & Intermediate Zone)
Crosses of exotic breeds, Zebu types, Indigenous animals and crosses.
ProductivityIndigenous: 2-3 litres/cow/day Crossbred: 5-8 litres/cow/day Average herd size is two cattle
Reproductive strategy Artificial insemination and natural breeding
lowland dry (dry Zone) Grazing/
extensive
Diet Free grazing with rice straw; sedentary small herds in irrigation schemes
Genotype Mainly indigenous, very few crossbreds
Productivity Indigenous cattle: 1-2 litres/cow/day Crossbred: 5-8 litres/cow/day
Reproductive Practice Free range natural breeding; average age at first calving 30 months
lowland wet (Wet Zone and intermediate Zone) Semi-extensive
Diet Mainly natural grazing during the day time. Some cut and carry with straw and small amount of concentrate
Genotype Crosses of exotic breeds and improved indigenous
ProductivityCrossbred: 3-5 litres/cow/day Indigenous breed 1-2 litres/cow/day Average herd size of five cattle
Reproductive Practice Natural breeding with some artificial insemination
Figure 3.1: Milk yield and contribution to milk production by production zone
Source: GLEAM, 2017
43%18%
8%
31%
0
10
20
30
40
50
60
70
80
0 1 2 3 4 5 6 7 8
Shar
e of
milk
ing
cow
s (%
)
Milk yield (kg per cow per day)
Upland and mid-country
Dry lowland
Wet lowland
Coconut triangle
⃝ Size of bubble represents the contribution of system to milk production (%)

OptiOns fOr lOw emissiOn develOpment in the sri lAnKA dAiry sectOr
9
Ampara
Anuradhapura
Monaragala
Kurunegala
Badulla
Puttalam
Galle
Kandy
BatticloaMatale
Mulathiv
Rathnapura
Polonnaruwa
Mannar
Kegalle
Vavuniya
Trincomalee
Kalutara
Hambanthota
Matara
Jaffna
Gampaha
Nuwaraeliya
Kilinochchi
Colombo
kg milk/cow/day
Dry lowland
0.3
0.6
0.7
1
1.2
1.3
1.8
Coconut triangle
1.4
2.7
2.9
Upland and mid-country
2.2
3.4
4.5
6.2
15.3
Wet lowland
1.8
2.2
2.4
2.6
2.7
Cells with low density of animals
Map 3.2: Milk yield by production system
Source: GLEAM, 2017
10
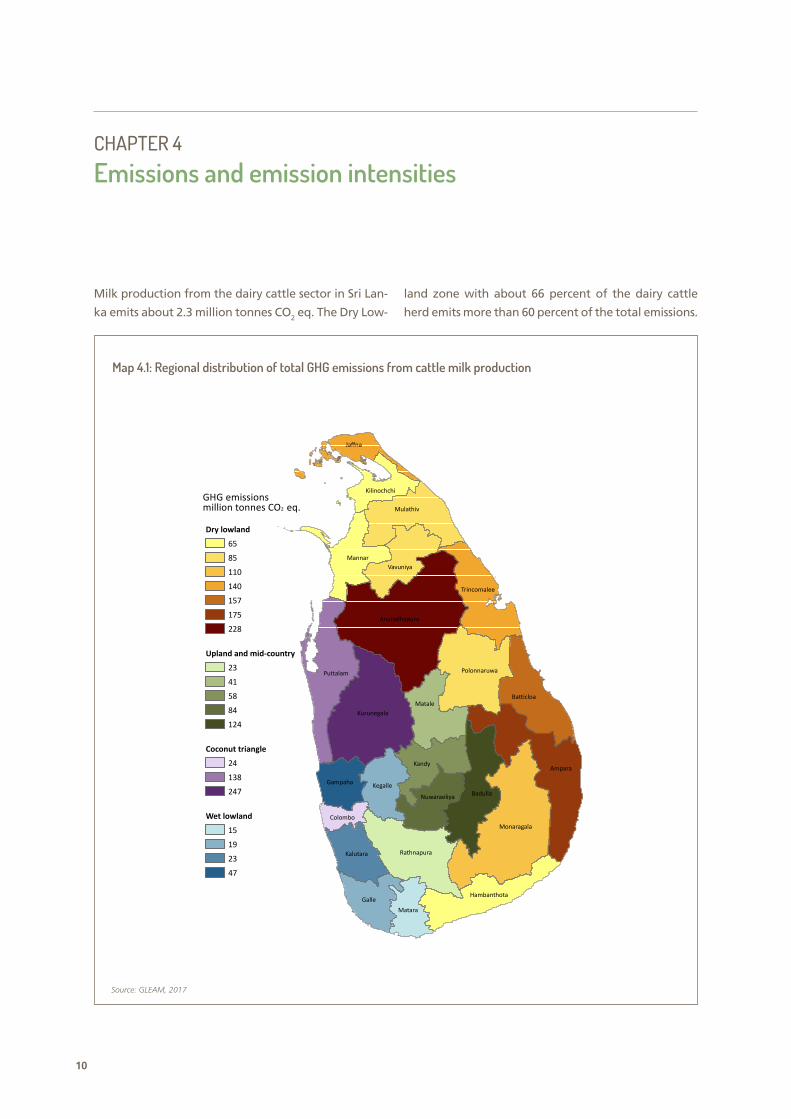
Milk production from the dairy cattle sector in Sri Lan-
ka emits about 2.3 million tonnes CO2 eq. The Dry Low-
land zone with about 66 percent of the dairy cattle
herd emits more than 60 percent of the total emissions.
CHAPTER 4
Emissions and emission intensities
Ampara
Anuradhapura
Monaragala
Kurunegala
Badulla
Puttalam
Galle
Kandy
BatticloaMatale
Mulathiv
Rathnapura
Polonnaruwa
Mannar
Kegalle
Vavuniya
Trincomalee
Kalutara
Hambanthota
Matara
Jaffna
Gampaha
Nuwaraeliya
Kilinochchi
Colombo
GHG emissionsmillion tonnes CO2 eq.
Dry lowland
65
85
110
140
157
175
228
Upland and mid-country
23
41
58
84
124
Coconut triangle
24
138
247
Wet lowland
15
19
23
47
Map 4.1: Regional distribution of total GHG emissions from cattle milk production
Source: GLEAM, 2017

OptiOns fOr lOw emissiOn develOpment in the sri lAnKA dAiry sectOr
11
The activities and processes that contribute
towards the GHG emissions from dairy cattle sector
are shown in Figure 4.1. The GHG profile of milk
is dominated by methane (93.2 percent), while
the nitrous oxide (N2O) and carbon dioxide (CO2)
contribute 1.6 percent and 5.2 percent of the total
emissions, respectively.
Three sources of emission sources contribute the
bulk of emissions from dairy cattle. Approximately
88 percent of the emissions arise from methane
produced by the rumination of cows and 5 percent
from the management of stored manure. CO2 emis-
sions associated with feed production, transport
and processing contribute an additional 5 percent
to total emissions.
Production system contribution to the total GHG emissions Within the dairy cattle sector, the Dry Lowland dairy
production system which produces 31 percent of
the national milk, is responsible for 62 percent (1.4
million tonnes CO2 eq.) of the total GHG emissions.
The Coconut Triangle, Upland and Mid-Country,
and wet lowland systems contribute 18 percent, 15
percent and 5 percent of the emissions, respectively
(Figure 4.2).
Across all production systems methane emissions
from enteric fermentation comprise the bulk of
emissions ranging from 77-92 percent of the total
emissions. Extensive and semi-intensive systems have
very similar emission profiles; enteric methane and
Figure 4.1: Share of total emissions by emission source
Source: GLEAM, 2017
87.9%
5.2%
0.08%
Manure applied to feed, N2O0.001%
Fertilizer, N2O0.01%
Crop residue decomposition, N2O
0.002%
Manure management, CH4
5.3%
Manure management, N2O1.5%
Enteric fermentation, CH4
Feed production, transport & processing, CO2
Manure deposited on pasture, N2O

OptiOns fOr lOw emissiOn develOpment in the sri lAnKA dAiry sectOr
12
N2O emissions from manure deposited on pasture
dominate both profiles. Emissions from manure
management especially methane is important in
the Coconut Triangle, upland and mid-country, and
wet lowland systems (Figure 4.2).
Greenhouse gas emissions per kg of fat and-protein corrected milk (FPCM) At national level, the emission intensity of milk pro-
duced in Sri Lanka is on average 6.9 kg CO2 eq./kg
FPCM; the highest values were estimated for dairy
systems in the Dry Lowland zone and the lowest in
Upland and Mid-country systems. Emissions were on
average, 13.8, 6.8, 4.8 and 2.3 kg CO2 eq./kg FPCM
for the Dry Lowland, Coconut Triangle, Wet Lowland
and Upland and Mid-Country systems, respectively
(Figure 4.3).
Variability in emission intensity within dairy production systems At production system level, there is a wide variation
in emission intensity which is closely related to di-
versity the production and management practices
in the dairy production systems. At production sys-
tem level, the highest variability in emission inten-
sity is observed for the Dry Lowland extensive sys-
tems with a range from 8 to 48 kg CO2 eq./ kg FPCM
(Figure 4.4). The existence of a wide variability is
strong indication of the potential for reductions in
GHG intensity of milk through the adoption of prac-
tices associated improvements in efficiency.
Determinants of emissions and emission intensities A number of factors influence emissions and emis-
sion intensities from dairy production in Sri Lanka:
• inadequate and poor quality feed. An inadequate
supply of quality feed is the major factor limiting
dairy production in Sri Lanka. Feed resources, are
either not available in sufficient quantities due
to fluctuating weather conditions or even when
available are of poor nutritional quality. Gener-
ally, the productivity of dairy farmers is relatively
low. While the small scale of dairy farm operations
Figure 4.2: Absolute emissions by production system and emission source
Source: GLEAM, 2017
Upland andmid-country
Coconut triangle
Wet lowland
Dry lowland
Manure management, N2O
Manure management, CH4
Crop residue decomposition, N2O
Fertilizer, N2O
Manure applied to feed, N2O
Manure deposited on pasture, N2O
Feed production, transport &processing, CO2
Enteric fermentation, CH4
0
100
200
300
400
500
600
700
800
900
1,000
1,100
1,200
1,300
1,400
1,500
thou
sand
tonn
es C
O2 e
q.

OptiOns fOr lOw emissiOn develOpment in the sri lAnKA dAiry sectOr
13
Figure 4.3: Emission intensity per kg FPCM, by production system
Source: GLEAM, 2017
0
2
4
6
8
10
12
14
Upland andmid-country
Coconut triangle
Wet lowland
Dry lowland
kg C
O2 e
q. p
er k
g FP
CM
Manure management, N2O
Manure management, CH4
Crop residue decomposition, N2O
Fertilizer, N2O
Manure applied to feed, N2O
Manure deposited on pasture, N2O
Feed production, transport &processing, CO2
Enteric fermentation, CH4
and the lack of broad-based use of modern
farm technologies/practices and improved breeds
explain a great deal of the productivity gap, a
notable factor is the lack of access to feed. Across
all systems, fodder availability is inadequate and
prices are too high for smallholder dairy farmers
to access. This is constraining their milk output
and their ability to expand production. This
problem is compounded by seasonal changes in
pasture conditions, with poor productivity during
dry seasons. High milk fluctuations arise because
most farmers depend on rain-fed feed production
and rarely make provisions for preserving fodder
for the dry-season. In addition to seasonality of
feed supply, the diet is largely made up of low
quality feed products such as crop residues and
native pastures of poor nutritive value. Conse-
quently, the digestibility of feed rations in all
systems is low: ranging between 58 percent in
extensive systems in Dry Lowlands to 62 percent
in intensive systems. These constraints explain the
low milk yields and short lactations, high mortal-
ity of young stock, longer parturition intervals,
low animal weights and high enteric methane
emissions per unit of metabolizable energy.
• Animal health. The prevalence of various animal
diseases, tick-borne diseases, internal and exter-
nal parasites affects the performance of dairy
cattle. Animal health affects emission intensity
through the “unproductive emissions” related
to mortality and morbidity. Animal mortality
rates are high (ranging between 7 percent and
16 percent) regardless of the system. Many of
the health problems result from poor animal
condition as a result of inadequate nutrition,
but also disease. Major animal diseases include
brucellosis, mastitis, foot and mouth disease,
and other internal parasites. Morbidity has an
indirect effect on emission intensities through
slow growth rate, reduced mature weight, poor
reproductive performance and decreased milk
production. This is particularly true for improved
exotic dairy cattle breeds which often have
higher nutritional demands, poor adaptability,

OptiOns fOr lOw emissiOn develOpment in the sri lAnKA dAiry sectOr
14
Figure 4.4: Variability in milk emission intensity
Source: GLEAM, 2017
kg C
O2 e
q. p
er k
g FP
CM
50
45
40
35
30
25
20
15
10
5
0Dry
lowland
* IQR = Interquartile range (Q3-Q1)
Coconuttriangle
Q3 + 1.5xlQR
Q3 (75%)
IQR*
Q1 (25%)
Q1 - 1.5xlQR
Wet lowland
Upland and mid-country
often inherently more susceptible to diseases
compared to the indigenous cattle and low pro-
duction efficiency under smallholder conditions.
• Reproductive efficiency. Reproductive efficiency
affects emission intensity by influencing the por-
tion of the herd that is in production (e.g. milked
cows and young stock fattened for meat). It is also
a key parameter to the economic performance of
dairy systems. Improvements in reproductive per-
formance is a major efficiency goal of the dairy
industry. However, achieving this goal is currently
hampered by a number of factors, particularly
feed availability and quality. Poor reproductive
performance of the dairy herd is manifested in a
number of parameters such as low fertility rates
(37 percent to 55 percent), delayed time to reach
puberty and age at first calving (3.3 and 4 years
in intensive/semi-intensive and extensive systems,
respectively), long calving intervals, short pro-
ductive life (due to culling for infertility or sterili-
ty) and high calf mortality (8 percent-16 percent).
• Better management of genetics: Enhancing the
genetic potential of the animal is critically impor-
tant, but it is equally important not to promote
high genetic potential animals into climates and
management environments where high-produc-
ing animals can never achieve their potential and
will, in fact, perform worse than native breeds
or crossbreeds due to management, disease, or
climatic challenges. In intensive systems, farmers
generally rely on exotic breeds such as Friesian
and Ayrshire which are high yielding animals
which have high feed requirements, have a high
demand for clean water, susceptible to disease
and other climatic stressors. In the extensive, sys-
tems animals have been bred for draft purposes,
disease resistance, etc.
All these factors contribute to low milk yield, both
at animal and herd levels. As a result, we observe
a strong inverse correlation between the emission

OptiOns fOr lOw emissiOn develOpment in the sri lAnKA dAiry sectOr
15
Figure 4.5: Variation in greenhouse gas (GHG) emission intensity of milk in relation to milk productivity per cow (kg FPCM, fat and protein corrected milk per cow). Each dot represents a district
Source: GLEAM, 2017
R² = 0.9759
0
10
20
30
40
50
0 1000 2000 3000 4000 5000 6000
kg C
O2e
q. p
er k
gFPC
M
kg FPCM per cow per year
Upland and mid-country
Coconut triangle
Wet lowland
Dry lowland
intensity and the average annual milk yield per
animal in dairy production systems in Sri Lanka
(Figure 4.5). For animals with a higher annual milk
yield, the overall farm GHG emissions (from all an-
imal cohorts) are distributed over a larger amount
of milk. In terms of feed energy utilization, the
herd directs a higher percentage of feed energy
intake to generate the products, rather than sim-
ply maintain body and reproduction functions. The
R2 value describes the proportion of the variation
in values that is explained by the trend. In other
words, an R2 value of 0.97 means that 97 percent
the variation in emissions intensity is explained by
milk production per cow.

16
The analysis of current production of milk in Sri Lan-
ka shows that improved management practices and
technologies that increase milk production per cow
can reduce the GHG emissions intensity of milk pro-
duction. This approach to mitigation is compatible
with the national objective of increasing overall milk
output for improved nutrition and food security. The
abatement technologies and practices assessed in
this study were selected for their potential impact
on enteric CH4. This is not a purely technical process
but incorporates other factors such as existing po-
litical priorities. As such other considerations taken
into account during the selection of interventions
was the need to integrate mitigation with a number
of key developmental goals for the dairy sector, such
as their role in promoting food security, rural and
overall economic development.
The mitigation options evaluated in this analysis
were selected in a consultative process with nation-
al experts. These options identified as having the
potential for large improvements in productivity
were assessed alongside their potential to reduce
on-farm greenhouse gas intensity while taking into
account the feasibility of implementation and their
potential economic benefits at the farm level. Box
3 summarizes the criteria used to identify interven-
tions that were included in the analysis.
Enhancing animal productivity has several dimen-
sions including animal genetics, improved feeding,
reproduction, health and overall management of
the herd. The interventions evaluated ranged from
improved feeding practices to better herd health
and management. These comprised: supplemen-
tation of basal diets with fodder trees and low
cost concentrate, supplementation with rice straw
concentrate mixture, use of total mixed ration, sup-
plementation of forage diets with Gliricidia blocks,
mastitis prevention and control and reduction of
heat stress. Interventions were selected to address
the key determinants of low productivity and ineffi-
ciencies in dairy production cycle such as seasonality
of feed resources, low quality of feed, poor repro-
ductive status of breeding herd, and animal health.
Table 5.1 provides a summary of the pre-selected
interventions. The interventions were not applied
uniformly, but selected for each production system,
animal category, and agro-ecological zone using evi-
dence from modelling and field studies and expert
judgement of their specific operating requirements
and likely impact on performance. For example, all
interventions were applied only to a proportion of
lactating, pregnant cows, and replacement heifers.
Quantitative summary of mitigation outcomes from the application of single interventions The potential outcomes (emission reductions and im-
provements in productivity) from the application of
the single interventions evaluated in this study are
presented in Figures 5.1. Overall, the analysis shows
that there is a high potential to reduce emission in-
tensities; methane emission intensity (kg CO2 /kg
FPCM) can be reduced by by as low as 3 percent to
50 percent, the magnitude will vary depending on
the intervention, adoption rate and production sys-
tem assessed (Figure 5.1). All interventions returned
a positive productivity outcome with increases in
milk production ranging between 6 percent and 108
percent.
Multi-purpose fodder tress are a known and
cheap source of protein for dairy cattle. They help
bridge the gap between supply and demand of
protein especially during the dry season. Most
small-scale dairy farmers graze their animals on
unimproved, natural grass. Natural pastures which
commonly form the bulk of roughage for dairy
cows, are generally low in crude protein, especially
so during the dry season. Although crop residues
may be added to grass-based diets, they are not
sufficient and balanced to support milk production.
CHAPTER 5
Exploring the mitigation potential in dairy cattle production

OptiOns fOr lOw emissiOn develOpment in the sri lAnKA dAiry sectOr
17
Box 4: Criteria for selection of interventions
Three principal criteria were used to identify interventions
for analysis in the study; the potential for improving
production efficiency, technical feasibility of adop-
tion by farmers and the potential to reduce enteric
methane emission intensity.
improving production efficiency is a strategy that
farmers can implement to decrease methane emissions.
Enhancing animal productivity has several dimensions in-
cluding animal genetics, feeding, reproduction, health and
overall management of the herd.
Reduction in enteric CH4 emission intensity. Many
measures that have the potential increase productivity are
associated with increased individual animal performance
and this increased performance is generally associated
with a higher level of absolute emissions (unless animal
numbers are decreasing) but reduced emissions intensity.
The figure below demonstrates some of these impacts.
The impacts from the application of 4 diets were evalu-
ated for dairy cattle across the 4 production systems. For
three of the feeding strategies, enteric methane emissions
increased because feeding better quality feed rations in-
creased dry matter intake as a consequence of improved
digestibility and palatability of the diet (Figure below). The
total daily methane emissions (g/day) increase with higher
levels of milk production. This is logical since more feed
is being consumed and processed in the rumen. From an
emission intensity perspective, these interventions howev-
er translate into a decrease in emission intensity (see Fig-
ure 5.1). Some practice changes however can result in a
decrease in both absolute enteric emissions and emissions
intensity.
Feasibility of implementation. The third criterion is
that the interventions had to be feasible in the short or
medium term. For the purposes of selecting interventions,
“feasibility” was first determined by sectoral experts in
terms of their technical potential, production system and
territorial applicability, and market development. The study
also assumed reliance on existing and proven technologies.
The selected interventions were subsequently discussed
with a broader group of stakeholder to assess the social
and institutional feasibility of adoption and up-scaling of
interventions. Ensuring that this criterion was met also
required investigation of information on barriers to adop-
tion. Other aspects taken into consideration with regard
to feasibility included: location of interventions should be
informed by location-specific determinants e.g. soil type,
and potential to enhance other benefits, e.g. raising in-
come of target population (poverty reduction).
Impacts of feeding strategies on enteric methane emissions
18.7
-10
0.9 3.
6
-6
9.9
-11
0.3
Perc
enta
ge c
hang
e in
ent
eric
CH
4
em
issi
ons
rel
ative
to b
asel
ine
Upland and Mid-country Coconut triangle Wet lowland Dry lowland
Supplementationwith fodder trees and low
cost concentrate
Supplementationwith rice straw
concentrate mixture
Use of total mixedration
Supplementation offorage diet withgliricidia bocks
Source: GLEAM, 2017

OptiOns fOr lOw emissiOn develOpment in the sri lAnKA dAiry sectOr
18
In addition, commercial protein sources that could
supplement these roughages are too costly for many
smallholder dairy farmers to purchase on a regular
basis and in adequate quantities. Production and
utilization of fodder trees is a low-cost method for
improving both the quantity and quality of live-
stock feeds on smallholder farms. Fodder trees are
an ideal solution to supplement dairy animals with
high quality feed especially during the dry season.
Feeding lactating animals and heifers on fodder
trees (Gliricedia) and low cost concentrate returned a
reduction in enteric CH4 emission intensity of 39 per-
cent, 36 percent and 37 percent in Coconut Triangle,
Wet Lowland and Dry Lowland system, respectively.
Improving feed availability and quality will be a
key strategy to realize the largest proportion of the
desirable animal productivity levels. Feed seasonal-
ity is a major constraint to achieving the targeted
milk production because of heavy reliance on rain-
fed forage and pasture production. However during
the dry season, feed availability reduces and animals
are forced to survive on scarce, low quality mature
grass and crop residues. In addition, there is low
adoption of alternative feeding strategies such as
use of conserved fodder or use of non-conventional
feed resource materials to smoothen seasonal fluc-
tuations in milk production.
Due to feed shortages, dairy farmers tend to
compensate for some of the shortages by purchas-
ing concentrate feed, however evidence from a
number of studies indicates that the large major-
ity of farmers feed a low, flat rate of concentrate
throughout lactation. This often results in under-nu-
trition in the early part of lactation and can have a
negative effect on milk production later in lactation.
Supplementation with rice straw concentrate mix-
ture resulted in a reduction in enteric CH4 intensity
by 36 percent in Wet Lowland and Coconut Triangle
systems. And a corresponding increase in milk produc-
tion by 58 percent in both systems. The use of total
mixed ration applied in the intensive systems (Upland
and Mid-Country systems) resulted in a reduction in
enteric CH4 intensity by 19 percent and a correspond-
ing increase in milk production by 48 percent.
A major constraint faced by the dairy farmers
in Sri Lanka is the severe drop in body condition
Table 5.1: Summary of selected interventions for dairy cattle systems in Sri Lanka
intervention Objective and constraint addressed mitigation mechanism
supplementation with fodder trees and low cost concentrate
•Minimize quantitative and qualitative deficiency of basal diet to address feed seasonality and quality constraints
• Lower CH4 observed with legumes is attributed to lower fiber content and faster rate of passage of feed through the rumen and therefore intakes are higher with legume forages
supplementation with rice straw concentrate mixture
• Supplementation of diet with good-quality concentrates helps overcome problem of palatability and digestibility
•A high proportion of concentrate in diet reduces rumen pH and consequently affects the protozoa population
Use of total mixed ration
• Increase efficiency of dietary nutrient use by providing critical nutrients that are deficient in the diet and therefore balancing nutrient availability with animal requirements
•Alters rumen fermentation towards more production of microbial protein and lower volatile fatty acid production. Improves efficiency of nutrient utilization, improves productivity and reduces methane emissions
supplementation of forage diet with Gliricidia blocks
• Improve the quality of low basal diets and addresses feed availability during periods of scarcity
• Provides rumen fermentable nitrogen and by-pass protein to fibrous diets. Promotes high dry matter intake and have a faster rate of passage through the rumen and reduction of CH4/FPCM
Udder health management (prevention of mastitis)
• Improve health status of animals, increase productivity, reduce
• Economic losses for farmers and reduce human health risks
•High morbidity, reduced milk production and milk wastage
• Enhanced animal productivity and reduced GHG emission intensity
Animal comfort (heat stress management)
• Improve productive and reproductive performance of animals
•Addresses reduced milk production, decreased reproductive efficiency
• Enhanced animal productivity and reduced GHG emission intensity

OptiOns fOr lOw emissiOn develOpment in the sri lAnKA dAiry sectOr
19
Figure 5.1: Impact of single interventions on milk production and enteric CH4 emission intensity relative to baseline emissions
Source: GLEAM, 2017
- 19.8
- 4.5
- 5.7
- 38.8
- 36.1
- 50.4
- 5.3
- 3.1
- 36.1
- 36.5
- 45.6
- 5.0
- 2.7
- 37.1
- 5.6
- 3.5
-60 -50 -40 -30 -20 -10 0
Supplementation withfodder trees and low cost
concentrate
Supplementation withrice straw concentrate
m ixture
Use of totalmixed ration
Supplementation offorage diet withgliricidia Blocks
Udder health management(prevention of mastitis)
Animal comfort(heat stress)
Reduction in enteric CH4 emissions Intensity (%)
Dry lowland Wet lowland Coconut triangle Upland and mid-country
48.0
6.0
47.0
58.0
108.6
6.0
47.0
58.0
101.9
6.0
41.4
6.0
6.0
6.0
6.0
6.0
20 40 60 80 100 120
Percentage change In production relative to baseline (%)
during prolonged droughts due to scarcity of feed.
Therefore, forage diets need to be supplemented
with an additional energy or protein source (concen-
trates) and minerals to satisfy the cows’ nutritional
requirements. In order to ensure a steady supply of
quality feeds for livestock even during the dry sea-
son, excess forages could be preserved as leaf meal.
Gliricidia is widely used as a source of nitrogen for
ruminants, especially during the dry spell. It could
be fed as a fresh diet or in dried form as leaf meals.
Gliricidia leaf meal can be formed into blocks to
improve the storage quality and these blocks can be
improved nutritionally by mixing leaf meal with other
feed ingredients such as coconut poonac and rice
bran. Supplementation of forage diet with Gliricidia
blocks reduced enteric CH4 emission intensity by
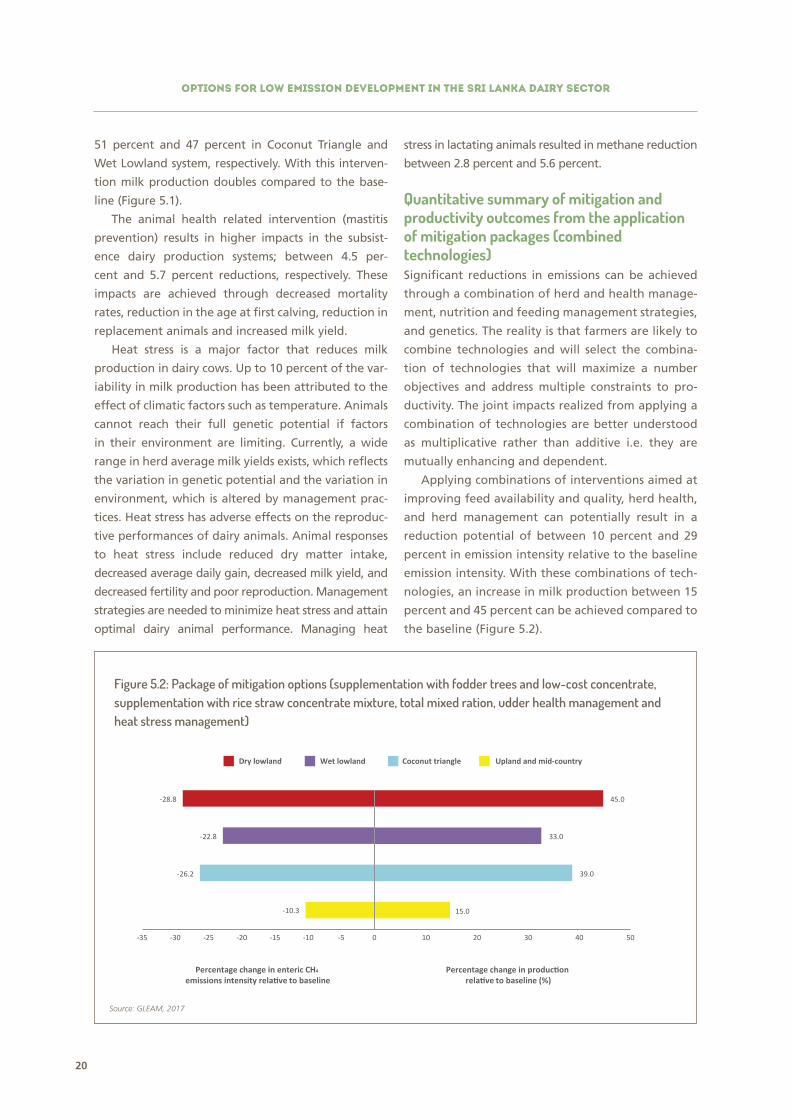
OptiOns fOr lOw emissiOn develOpment in the sri lAnKA dAiry sectOr
20
51 percent and 47 percent in Coconut Triangle and
Wet Lowland system, respectively. With this interven-
tion milk production doubles compared to the base-
line (Figure 5.1).
The animal health related intervention (mastitis
prevention) results in higher impacts in the subsist-
ence dairy production systems; between 4.5 per-
cent and 5.7 percent reductions, respectively. These
impacts are achieved through decreased mortality
rates, reduction in the age at first calving, reduction in
replacement animals and increased milk yield.
Heat stress is a major factor that reduces milk
production in dairy cows. Up to 10 percent of the var-
iability in milk production has been attributed to the
effect of climatic factors such as temperature. Animals
cannot reach their full genetic potential if factors
in their environment are limiting. Currently, a wide
range in herd average milk yields exists, which reflects
the variation in genetic potential and the variation in
environment, which is altered by management prac-
tices. Heat stress has adverse effects on the reproduc-
tive performances of dairy animals. Animal responses
to heat stress include reduced dry matter intake,
decreased average daily gain, decreased milk yield, and
decreased fertility and poor reproduction. Management
strategies are needed to minimize heat stress and attain
optimal dairy animal performance. Managing heat
stress in lactating animals resulted in methane reduction
between 2.8 percent and 5.6 percent.
Quantitative summary of mitigation and productivity outcomes from the application of mitigation packages (combined technologies) Significant reductions in emissions can be achieved
through a combination of herd and health manage-
ment, nutrition and feeding management strategies,
and genetics. The reality is that farmers are likely to
combine technologies and will select the combina-
tion of technologies that will maximize a number
objectives and address multiple constraints to pro-
ductivity. The joint impacts realized from applying a
combination of technologies are better understood
as multiplicative rather than additive i.e. they are
mutually enhancing and dependent.
Applying combinations of interventions aimed at
improving feed availability and quality, herd health,
and herd management can potentially result in a
reduction potential of between 10 percent and 29
percent in emission intensity relative to the baseline
emission intensity. With these combinations of tech-
nologies, an increase in milk production between 15
percent and 45 percent can be achieved compared to
the baseline (Figure 5.2).
Figure 5.2: Package of mitigation options (supplementation with fodder trees and low-cost concentrate, supplementation with rice straw concentrate mixture, total mixed ration, udder health management and heat stress management)
Source: GLEAM, 2017
-10.3
-26.2
-22.8
-28.8
-35 -30 -25 -20 -15 -10 -5 0
Percentage change in enteric CH4 emissions intensity relative to baseline
15.0
39.0
33.0
45.0
10 20 30 40 50
Percentage change in production relative to baseline (%)
Coconut triangleWet lowlandDry lowland Upland and mid-country

21
Having identified and assessed the mitigation of
potential, these technologies can be prioritized for
wider dissemination and adoption. Prioritization
should not only consider enteric methane mitigation
potential but also the productivity benefits, income
advantages to farmers and other co-benefits that are
likely to provide additional incentives for farmers to
adopt mitigation interventions. A key incentive to
farmers for adoption is increased revenue and/or re-
duced costs. To better understand the implications
for farmers, a cost benefit analysis was conducted
to assess the profitability of each intervention. The
benefit-cost ratio is the ratio between the present
value of the benefit stream and the present value
of the cost stream. It provides an indication of how
much the benefits of an intervention exceed its
costs. The results from the cost-benefit analysis are
presented in Box 4.
CHAPTER 6
Prioritization of interventions to address enteric methane
Box 4: Assessing the costs and benefits of mitigation Interventions
The benefit-cost ratio (BCR), i.e. the ratio of the present
value of the benefits to the present value of the costs.
Costs were calculated as production costs (baseline sce-
nario) plus costs involving the implementation of the mit-
igation strategy while benefits were calculated as total
revenue from meat output within a year. The benefit-cost
ratio indicates the overall value for money of the inter-
ventions. Generally, if the ratio is greater than 1, benefits
of the interventions outweigh the costs. In this study the,
the BCR for different mitigation options ranged from 1.6
to 4.4 (table below) indicating that benefits exceed eco-
nomic costs for the different options under consideration.
The results also show wide differences in benefits
across the production zones. Highest returns per dollar
invested are achieved in the Dry Lowlands where costs
of productions are lower compared to the other three
production zones. On the other hand, the returns in the
intensive systems though positive are lower due to higher
costs of production and the lower price received for milk
in the formal markets.
Benefit-cost ratios of mitigation interventions Benefit-cost ratios of mitigation interventions
intervention Upland and mid-country Coconut triangle Wet lowland dry lowland
supplementation with fodder trees and low cost concentrate
** 1.88 1.79 3.73
supplementation with rice straw concentrate mixture ** 2.08 ** 4.28
Use of total mixed ration 1.9 ** ** **
supplementation of forage diet with Gliricidia blocks ** 2.95 2.8 **
mastitis prevention and control
1.58 1.64 1.56 3.43
Animal comfort (heat stress) 1.58 1.63 1.55 3.38
Note: ** intervention not applied; Source: Authors own calculations

OptiOns fOr lOw emissiOn develOpment in the sri lAnKA dAiry sectOr
22
The prioritization processAll individual practices were ranked for their ability
to reduce enteric methane. Given that there is always
uncertainty around any estimation of reduction po-
tential we discarded any practice that would reduce
emissions by <10 percent. This reduces the risk of
promoting practices that have marginal or no enteric
methane reduction benefit. The remaining practices
were then assessed against their enteric methane re-
duction potential and two other criteria; productivity
improvement and economic benefits (Figure 6.1).
For ease of interpretation a ‘coloured light’ sys-
tem was developed for assessing impact where red
was ‘high’, blue ‘medium’ and yellow ‘low’. As the
impact of an individual practice varies by system,
practices were prioritized separately for each system.
The values associated with the high, medium and
low classification system are shown at the bottom
of Table 6.1. It must be emphasized that this system
was developed as an aid to facilitate the identifica-
tion of those practices with the highest potential
both within and between practices and systems. It
does not signal potential since even practices ranked
‘low’ against all three criteria reduced enteric meth-
ane emissions, increased output and returned a net
financial benefit. The outcomes of the prioritization
process are shown in Table 6.1.
Comparison of individual interventionsAcross all production zones, two interventions (heat
stress management and udder health management) re-
sulted in methane emission reductions of less than 10
percent and hence were excluded from the prioritiza-
tion. The remaining interventions assessed, in addition
to decreasing enteric methane production, resulted in
increased milk production and returned a positive ben-
efit-cost ratio. However, the magnitude of the impacts
varied considerably with each system. There were large
differences in the number of interventions that local ex-
perts identified as appropriate for each system. Table
6.1 summarizes the impacts of the individual interven-
tions within each production system.
In the Upland and Mid-country dairy zone, only
one interventions was included in the prioritization
process. The use of total mixed ration (TMR) ranks
high on the productivity criteria and low on the
LONG LIST OFINTERVENTIONS
Abatement potentialGHG mitigation potential compared with baseline
Abatement potentialSelected interventions with abatement potential >10%
Impacts on productivityPotential to contribute to food security targets
Impact on profitabilityReturns to farmers
LIST OFPRIORITIZEDINTERVENTIONS
Figure 6.1: Initial prioritization process of technical interventions

OptiOns fOr lOw emissiOn develOpment in the sri lAnKA dAiry sectOr
23
other two criteria. Despite the benefits of feeding
TMR it still results in an increase in enteric meth-
ane emissions because feeding better quality feed
rations increased dry matter intake as a consequence
of improved digestibility and palatability of the diet.
The financial returns to farmers are low due to the
high costs associated with adopting the interven-
tion. In addition, most of the milk output is sold on
the formal markets, where milk prices are 50 percent
less than the price offered by the informal market.
The interventions (all related to feed) assessed
for the 3 other production zones (Coconut triangle,
Wet lowland, and Dry lowland) gave similar ben-
efits (ranging from moderate to high) in terms of
methane reduction, milk yield increase and financial
returns to farmers.
Table 6.1: Results from the prioritization of single interventions for dairy cattle production systems
intervention
supplementation with fodder trees
and low cost concentrate
supplementation with rice straw
concentrate mixture
Use of Urea molasses
multi-nutrient Blocks
supplementation of forage diet with Gliricidia
blocks
mastitis prevention and control
Heat stress management
UPlANd ANd mid COUNtRy system
Methane reduction ** **Production increase
Economicbenefit
COCONUt tRiANGle system
Methane reduction ** **
Production increase
Economicbenefit
Wet lOWlANd system
Methane reduction ** **Production increase
Economicbenefit
dRy lOWlANd system
Methane reduction Production increase
Economicbenefit
Note: ** Impact on methane emissions less than 10 percent
Assessment criteria:Methane mitigation: Low: >10 <25 Medium: >25 <50 High: >50
Production increase: Low: >10 Medium: >10 <15 High: >15
Economic benefit: Low: <2 Medium: >2 <3 High: >3

OptiOns fOr lOw emissiOn develOpment in the sri lAnKA dAiry sectOr
24
Intervention packagesThe large number of possible intervention ‘packag-
es’ ruled out a comprehensive comparison and prior-
itization of alternative ‘packages’. Expert judgment
was therefore used to define what was deemed
an appropriate common intervention ‘package’ to
compare across the three dairy systems. Results of
an assessment of this package, which comprised
interventions aimed at improving herd health and
nutritional status of the dairy herd, are shown in
Table 6.2.
With the exception of the intensive systems in the
Upland and Mid-country production zone, the results
show that there is a clear benefit from introducing
a package of interventions. In the Dry lowland the
package of intervention has moderate impacts on
methane emissions and milk production production
and high benefits with regard to profitability.
Table 6.2: Prioritization results for a “package” intervention for dairy production systems
Common intervention ‘package’ methane reduction Production increase economic benefit
Upland and mid country system
Coconut triangle system
Wet lowland system
Dry lowland system ** Assessment criteria:Methane mitigation: Low: >10 <25 Medium: >25 <50 High: >50
Production increase: Low: >10 Medium: >10 <15 High: >15
Economic benefit: Low: <2 Medium: >2 <3 High: >3

25
Smallholder dairy systems will continue to be a dom-
inant agricultural production system in Sri Lanka.
Dairy farming is a part and parcel of many such
systems, and is an important livelihood option to
increase household income of dairy farmers. This
study reveals that pathways for enhancing produc-
tivity and achieving emission reductions exist in all
the three systems.
This study didn’t consider changes in systems
i.e. from smallholder to commercial-oriented pro-
duction, however, it is also possible to meet the
increasing demand for dairy products by expanding
milk production in the existing market-oriented
systems however such choices will have to be made
taking into account the implications for livelihoods
and poverty reduction.
The results presented in the preceding sections
indicate that there are significant opportunities for
growth on a low carbon path for the dairy sector
and that economically viable opportunities exist
(in varying degree) within all production systems.
The study also indicates that while there are many
interventions to reduce emissions and improve
productivity, the same intervention can also have
contrasting impacts on emissions, production and
farmer revenues as Table 6.1 illustrates. This rein-
forces the need to tailor interventions to local
realities.
Increasing individual animal productivity aris-
ing from the adoption of better feeding practic-
es, improved health and herd management, also
results in a reduction of the herd. Reduction in ani-
mal numbers, particularly in subsistence production
systems, allows for the provision of adequate feed,
better health management leading to improve-
ments at both animal and herd levels. Methane
emissions will be reduced at both the total herd
and per liter of milk. However, these mitigation
options might be in conflict with the interests of
smallholders who generally tend to keep animals
for other functions such as traction, nutrient value
and risk management. Particularly in extensive sys-
tems, appreciation of these roles is necessary if any
policy geared towards change in the structure of
the systems is to succeed.
The idea of significant opportunities being
ignored by the sector does not make economic
sense. Clearly, there are a number of challenges
that must be addressed if a radical transformation
of the sector is to occur. To achieve the policy
objective of self-sufficiency as a strategic approach
for promoting dairy development for food security,
the following should be considered:
• upgrade the native herd as a fundamental neces-
sity for dairy development, while encouraging
the active involvement of the private sector;
• transform the current subsistence-level dairy
production systems into a viable commercially
oriented activity;
• provide a conducive environment for investment
in the domestic dairy industry, with market forc-
es governing the pricing of domestic milk;
• development of a viable, medium-to-large scale,
commercially oriented private sector engaged in
dairy production, which is crucial for the long-
term sustenance of the domestic dairy industry;
• empowerment of dairy farmers and facilitate
their participation and that of the processors in
the dairy value chain.
Addressing these issues requires innovations and in-
vestments by dairy value chain actors and input and
service providers, if this potential is to be unlocked.
Development of the entire milk value chain will be
important if dairy producers and supply chain ac-
tors are to benefit from increased productivity.
CHAPTER 7
Un-locking the potential of ‘no regrets’ opportunities

26
This chapter sets out to present key highlights and
messages from the analyses. It is not the intention of
the chapter to repeat the detailed analysis of previ-
ous chapters but rather to draw out some key overar-
ching messages and policy conclusions, both from the
perspective of the results process and what is actually
required to implement on the ground.
1. The potential for low-cost abatement is sizableThis study helps illustrate how, the dairy sector in
Sri Lanka could make substantial reductions in emis-
sions with interventions and investments that in
many cases will pay for themselves. The analysis on
the dairy sector demonstrates how milk productivity
can grow significantly (between 15 percent and 45
percent) while reducing emissions by 10 percent and
29 percent.
More importantly, from the study low emissions de-
velopment of the dairy sector can support a range
of other national policy goals, including achieving it
targets on self-sufficiency, economic growth and de-
velopment, improved livelihoods, and environmental
protection. It is this combination of reasons that ex-
plains the strong interest of Sri Lanka in low emis-
sions growth and justifies investment in the sector.
However, achieving these reductions will require am-
bitious action. Translating the actions outlined in this
document into food security and developmental gals
will require bolder efforts to support the transfer
and uptake of technology, reduce costs of technolo-
gies, scale-up private sector investment, and support
development of the dairy value chain and removing
disincentives to growth.
2. Many interventions are already planned under the National Adaptation Plan for Climate Change and should be prioritized.In particular priority areas for livestock include: im-
provement of pasture and fodder management,
diversification of feed resources (promoting feed
conservation and other alternative feeds), promoting
intensive management of livestock, promoting use of
heat tolerant and disease resistant breeds.This Anal-
ysis suggest that these planned interventions should
continue to be a priority for the government. There
are also significant triple wins for the farmers, society
(jobs), the economy (reduced foreign expenditure on
imports, sector growth, GDP) and the environment
(GHG savings).
3. Many interventions will pay for themselvesA significant percentage of the emission savings
come at a negative cost, meaning they will actually
contribute not only to reducing GHG emissions, but
also save money in the long-term. Figure 8.1 shows
that all the total potential for emissions reduction
have positive net benefits (or “negative costs”). This
visual presentation provides a wealth of information
to policymakers and transforms the high-level objec-
tive of emissions abatement into detailed and spe-
cific choices. The curve can be used to compare the
size and cost of opportunities, as well as estimate the
overall size of the emissions reduction opportunity.
All interventions assessed are cost-beneficial (i.e.
measures that not only reduce GHG emissions but
also save money in the long term) accounting for an
abatement potential of 1.4 million tonnes CO2 eq.
The intervention with the highest benefit per ton of
CO2 eq. abated (use of total mixed rations), shown
on the left-hand side of the marginal abatement cost
curve also provides the lowest abatement potential
(0.05 million tonnes CO2 eq.). On the other hand, sup-
plementation (with rice straw and low cost concen-
trate and fodder trees) account for about 80 percent
percent of the overall emissions reduction potential
of the interventions analyzed.
This doesn’t signify that this potential will be real-
ized in the absence of incentives. It is clear that even
win-win interventions still face barriers that require
CHAPTER 8
Key messages and policy conclusions
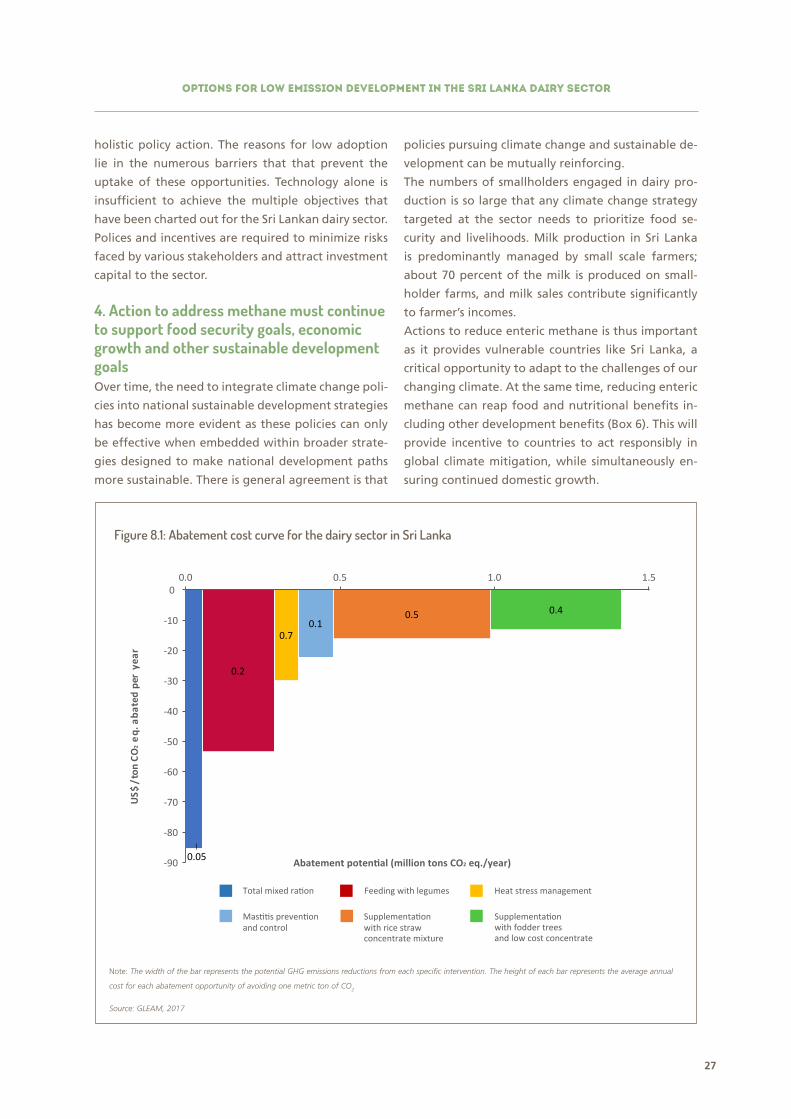
OptiOns fOr lOw emissiOn develOpment in the sri lAnKA dAiry sectOr
27
holistic policy action. The reasons for low adoption
lie in the numerous barriers that that prevent the
uptake of these opportunities. Technology alone is
insufficient to achieve the multiple objectives that
have been charted out for the Sri Lankan dairy sector.
Polices and incentives are required to minimize risks
faced by various stakeholders and attract investment
capital to the sector.
4. Action to address methane must continue to support food security goals, economic growth and other sustainable development goalsOver time, the need to integrate climate change poli-
cies into national sustainable development strategies
has become more evident as these policies can only
be effective when embedded within broader strate-
gies designed to make national development paths
more sustainable. There is general agreement is that
policies pursuing climate change and sustainable de-
velopment can be mutually reinforcing.
The numbers of smallholders engaged in dairy pro-
duction is so large that any climate change strategy
targeted at the sector needs to prioritize food se-
curity and livelihoods. Milk production in Sri Lanka
is predominantly managed by small scale farmers;
about 70 percent of the milk is produced on small-
holder farms, and milk sales contribute significantly
to farmer’s incomes.
Actions to reduce enteric methane is thus important
as it provides vulnerable countries like Sri Lanka, a
critical opportunity to adapt to the challenges of our
changing climate. At the same time, reducing enteric
methane can reap food and nutritional benefits in-
cluding other development benefits (Box 6). This will
provide incentive to countries to act responsibly in
global climate mitigation, while simultaneously en-
suring continued domestic growth.
Figure 8.1: Abatement cost curve for the dairy sector in Sri Lanka
Source: GLEAM, 2017
-70
-90
-20
-10
01.00.5 1.50.0
-60
-50
-40
-30
-80
0.5 0.4
0.2
0.7
0.05
0.1
Supplementation with fodder trees and low cost concentrate
Supplementation with rice straw concentrate mixture
Total mixed ration Feeding with legumes
Mastitis prevention and control
Heat stress management
not/
$SU
.qe
2O
Craey
rep detaba
Abatement potential (million tons CO2 eq./year)
Note: The width of the bar represents the potential GHG emissions reductions from each specific intervention. The height of each bar represents the average annual
cost for each abatement opportunity of avoiding one metric ton of CO2
OptiOns fOr lOw emissiOn develOpment in the sri lAnKA dAiry sectOr
28
Box 6: Reducing enteric methane for development and climate goals simultaneously
The exclusive focus on methane in the climate debate is
short-sighted, if the analysis is confined only to emissions.
The opportunity to mitigate methane is only one reason to
reduce emissions; reducing emissions of methane can pro-
vide significant development benefits, including improved
productivity, food security and livelihoods. This study con-
firms the often cited multiple synergies that can be achieved
by combining measures that address enteric methane with
efforts to improve food and nutrition security.
Methane production through enteric fermentation is
not only of global concern for its contribution to global
warming, but also for its wastage of feed energy, an ineffi-
ciency that limits the production performance of ruminants.
As a result of this process, ruminants lose between 2-12%
of the gross dietary energy in the form of methane, depend-
ing on the quality and quantity of diet. Thus, it is essential to
look for options to reduce CH4 emissions through improving
feed conversion efficiency, which also translates into higher
productivity and improved food security. Increasing produc-
tivity of dairy systems can benefit millions of poor livestock
keepers manifested through higher incomes, improved food
security and nutrition wellbeing.

29I7673EN/1/08.17
ISBN 978-92-5-109881-3
9 7 8 9 2 5 1 0 9 8 8 1 3