options for reforming america's tax code
TRANSCRIPT

OPTIONS FOR REFORMING
AMERICA’S TAX CODE
Options For Reforming
America’s Tax Code
ISBN: 978-1-942768-11-1© 2016 Tax Foundation
1325 G Street, NW, Suite 950Washington, DC 20005
202.464.6200taxfoundation.org

TAX FOUNDATION
iii
Chapter 1: Individual Income Tax 9Introduction 11Individual Income Tax – Rates 12 01. Lower marginal income tax rates across the board by 10 percent 13 02. Lower marginal income tax rates across the board by 20 percent 14 03. Raise marginal income tax rates across the board by 10 percent 15 04. Raise marginal income tax rates across the board by 20 percent 16 05. Lower the top marginal income tax rate to 35 percent 17 06. Lower the top marginal income tax rate to 28 percent 18 07. Lower the top marginal income tax rate to 25 percent 19 08. Raise the top marginal income tax rate to 45 percent 20 09. Add a new bracket of 49 percent for income above $750,000 21 10. Consolidate current brackets into three: 10 percent, 25 percent, and 35 percent 22 11. Lower the bottom bracket rate to 5 percent 23 12. Move to a flat rate of 30 percent 24 13. Move to a flat rate of 20 percent 25
Individual Income Tax – Capital Gains and Dividends 26 14. Eliminate taxes on long-term capital gains and qualified dividends 27 15. Replace lower rates on long-term capital gains and qualified dividends with an exclusion of 40 percent 28 16. Lower the top rate on capital gains and dividends to 15 percent 29 17. Raise the top rate on capital gains and dividends to 30 percent 30 18. Tax capital gains and dividends at ordinary income rates 31 19. Repeal the Net Investment Income Tax 32 20. Tax carried interest as ordinary income 33
Individual Income Tax – Credits 34 21. Double the child tax credit 35 22. Eliminate the child tax credit 36 23. Double the earned income tax credit for childless filers 37 24. Reduce the phaseout rate of the earned income tax credit to 10% 38 25. Index the earned income tax credit to local price indices 39 26. Replace the standard deduction and the personal exemption with an equivalent refundable credit 40 27. Eliminate tax credits for higher education 41
Individual Income Tax – Deductions and Exclusions 42 28. Double the standard deduction 43 29. Increase the personal exemption to $5,000 44 30. Eliminate the home mortgage interest deduction 45 31. Cap the home mortgage interest deduction on debt above $500,000 46 32. Replace the mortgage interest deduction with a 15% mortgage interest credit 47
Table of Contents

OPTIONS FOR REFORMING AMERICA’S TAX CODE
iv
33. Eliminate the charitable contributions deduction 48 34. Eliminate the deduction for state and local taxes 49 35. Eliminate all itemized deductions except the charitable and mortgage interest deductions 50 36. Limit tax savings from itemized deductions to 28% of value 51 37. Eliminate the Pease limitation on itemized deductions 52 38. Cap the total value of itemized deductions at $25,000 53 39. Eliminate the tax exclusion for municipal bond interest 54 40. Eliminate the exclusion of capital gains on home sales 55 41. Eliminate the exclusion of employer-sponsored health insurance 56 42. Eliminate all itemized deductions except the charitable and mortgage interest deductions and lower the top individual income tax rate to 27% 57 43. Eliminate all itemized deductions except the charitable and mortgage interest deductions and lower rates across the board 58
Individual Income Tax – Other 59 44. Eliminate the alternative minimum tax 60 45. Enact a 30 percent minimum tax on households with incomes above $1 million 61 46. Eliminate the personal exemption phaseout 62 47. Eliminate the head of household filing status 63 48. Replace CPI with chained CPI for inflation-adjusted tax parameters 64
Chapter 2: Business Income Taxes 65Introduction 67Business Income Taxes – Rates 68 49. Lower the top corporate rate to 25 percent 69 50. Lower the top corporate rate to 20 percent 70 51. Lower the top corporate rate to 15 percent 71 52. Raise the top corporate rate to 40 percent 72 53. Lower the top rate on pass-through business income to 25 percent 73
Business Income Taxes – Capital Investment and Cost Recovery 74 54. Eliminate Accelerated Depreciation 75 55. Make bonus depreciation permanent 76 56. Allow full expensing of capital investments 77 57. Repeal last-in, first-out (LIFO) inventory accounting 78 58. End section 1031 like-kind exchanges 79 59. Require businesses to amortize advertising expenses over 10 years 80 60. Repeal accelerated depreciation and lower the corporate income tax rate to 31 percent 81 61. Reduce the corporate income tax to 25 percent and allow all businesses to fully expense capital investments 82
Business Income Taxes – Other 83 62. Integrate the corporate and individual tax systems by allowing corporations to deduct dividends paid 84 63. Repeal the domestic production activities deduction (section 199) 85 64. Repeal all business tax expenditures except those pertaining to cost recovery and foreign income 86

TAX FOUNDATION
v
65. Repeal all business tax expenditures except those pertaining to cost recovery and foreign income, and reduce the corporate tax rate to 28 percent 87 66. Eliminate the deductibility of interest payments 88 67. Eliminate the deductibility of interest payments and tax interest income at the same rate as capital gains and dividends 89 68. Eliminate both the deductibility and taxation of interest 90 69. Enact a 5 percent value-added tax 91 70. Replace the corporate income tax with a value-added tax 92
Chapter 3: Estate and Gift Taxes 93Introduction 95 71. Eliminate estate and gift taxes 96 72. Lower the estate and gift tax exempt amount to $2 million 97 73. Raise the estate and gift tax’s top rate to 65 percent and lower the exempt amount 98 74. End stepped-up basis of capital gains at death 99
Chapter 4: Payroll Taxes 101Introduction 103 75. Repeal the Additional Medicare Tax 104 76. Raise the Social Security payroll tax cap to $250,000 105 77. Apply the Social Security payroll tax to wages and self-employment income above $250,000 106 78. Remove the Social Security payroll tax cap 107 79. Require “material participants” in pass-through businesses to pay self-employment taxes 108
Chapter 5: Excise Taxes 109Introduction 111 80. Index the gas tax to inflation 112 81. Raise the gas tax to 28.4 cents per gallon and adjust it to inflation, going forward 113 82. Raise the gas tax to 50 cents per gallon and adjust it to inflation, going forward 114 83. Double the excise tax on large truck tires 115 84. Enact a $20 per ton carbon tax 116 85. Repeal the Medical Device Tax 117 86. Repeal the Cadillac Tax 118

OPTIONS FOR REFORMING AMERICA’S TAX CODE
vi

TAX FOUNDATION
1
Introduction
There is a widespread consensus among Americans across the political spectrum that the U.S. tax system is overly complex, inefficient, uncompetitive, and due for an overhaul. However, Congress has not passed a comprehensive tax reform bill in three decades. As a result, many lawmakers have set their sights on the 2017 legislative session as an opportunity to hammer out a tax reform deal.
Because so many parts of the U.S. tax code are in need of change, any tax reform bill considered by Congress is likely to be hundreds of pages long and contain dozens of distinct provisions. As a result, lawmakers and voters may be unsure of the effects of each separate tax change on federal revenue collections, the tax burden borne by dif-ferent groups of Americans, and the growth of the U.S. economy.
To assist lawmakers in assembling tax reform bills over the coming months, and to help the American public in understanding the tax changes being proposed, we have assembled this book: Options for Reforming America’s Tax Code.
This book describes 86 commonly proposed changes to the U.S. tax code that might be part of a future tax reform bill. Over the past few months, our team of economists has modeled the effects that each option would have on federal revenue, the distri-bution of the tax burden, and the U.S. economy. These figures will give policymakers and voters a full, three-dimensional understanding of the effects of each policy change.
The options we’ve chosen for this book are not necessarily the Tax Foundation’s favored policies. In fact, no policy described in the following pages would be an unequivocally good or an unambiguously bad change to the tax code. Each of the options in this book comes with tradeoffs.
It is becoming increasingly clear that tax reform is a once-in-a-generation opportu-nity. We hope that this book helps policymakers get it right.

OPTIONS FOR REFORMING AMERICA’S TAX CODE
2
Themes of this Book
Every option in this book tells a separate story. However, there are a few themes that run throughout the following pages that are important to keep in mind.
Some tax changes produce more growth than others
Flipping through this book, it is clear that some tax changes produce larger economic effects than others. For instance, compare the following two options:
Option Static 10-Year Revenue
Long-Run Change in GDP
#1 Lower marginal income tax rates across the board by 10 percent -$2,220 billion 1.0%
#57 Allow full expensing of capital investments -$2,166 billion 5.5%
Both of these options would amount to a tax cut of about $2.2 trillion, on a static basis. However, the first option would only grow the U.S. economy by 1.0 percent in the long run, while the second would lead to a 5.5 percent larger economy. Why do these similarly-sized tax cuts have such disparate economic effects?
To understand why some tax changes have a greater effect on the economy than others, it is useful to take a brief detour into the economics of taxation. Broadly speaking, taxes affect the economy because they change people’s behavior – the eco-nomic choices that households and businesses make.
There are two main channels through which tax policy affects people’s decisions. First, tax policy can change people’s incentives to work, affecting the supply of labor. Second, tax policy can change people’s incentives to save and invest, affecting the supply of capital. While a higher supply of labor and capital can lead to a larger econ-omy, a lower supply of labor and capital can lead to a smaller economy.
Importantly, under standard economic theory, taxes only affect behavior when they apply “on the margin” – when they affect a person’s decision about his next hour of labor or her next dollar of investment.
For instance, imagine a policy that cut the bottom tax bracket from 10 percent to 5 percent. Currently, households that fall into the bottom bracket keep 90 cents of every additional dollar they earn working. Under this policy, households in the bottom bracket would keep 95 cents of every additional dollar they earn working. Thus, this policy would give low-income households a stronger incentive to increase their sup-ply of labor, because they would be able to keep more of their additional earnings.
TAX FOUNDATION
3
On the other hand, imagine a policy that gave a fully refundable $2,000 tax credit to every individual. This policy would cut taxes significantly for every single taxpayer. However, it would not have any effect on households’ supply of labor. Households in the 10 percent bracket would still only receive 90 cents of each additional dollar they earn working. Because this policy would not change households’ marginal tax rates, it would not have any macroeconomic effect.
All of the economic results presented in this book are driven by how each option would change the marginal tax rate on labor and the marginal tax rate on investment.
Importantly, there is strong reason to believe that tax policy has a much larger effect on the supply of capital than it does on the supply of labor. While there is evidence that workers decrease their labor supply in response to high marginal tax rates on labor, this effect is fairly small. On the other hand, evidence shows that the supply of capital is highly sensitive to taxes: when marginal tax rates on investment increase, businesses and individuals substantially decrease their investment or move their cap-ital abroad.
As a result, cutting marginal tax rates on investment will lead to much more economic growth than cutting marginal tax rates on labor. This insight is reflected in the exam-ple above: full expensing would decrease marginal taxes on investment and lead to significant economic growth. By contrast, an across-the-board individual income tax rate cut would mostly decrease marginal taxes on labor, and would lead to less eco-nomic growth.
Tax reform is about setting the tax base
A second theme that runs throughout this book is that “How high should the rate be?” is not the most important question facing tax policymakers.
For some background: every tax consists of two primary components, a base and a rate.
The base of a tax refers to the set of economic activities that are subject to tax. For instance, the base of the Social Security payroll tax is every individual’s first $118,500 of wages and self-employment income each year. The base of the federal estate tax is the value of all property exceeding $5.45 million held by an individual at the time of death, minus certain deductions and exclusions.
The rate of a tax refers to the portion of the tax base that is collected by a govern-ment. Some taxes are levied at a single rate, while other taxes are levied at several different rates. Taxes that fall into the second category are sometimes called gradu-ated taxes.

OPTIONS FOR REFORMING AMERICA’S TAX CODE
4
When most policymakers talk about tax reform, they are referring to the approach of “broaden the base and lower the rate.” Currently, the U.S. tax base is relatively nar-row: there are dozens of deductions, exclusions, and other provisions that reduce the amount of economic activity that is subject to taxes. With a broader tax base, law-makers could institute a lower tax rate and still raise the same amount of revenue.
Generally speaking, tax systems with broad bases and low rates are less economically harmful than tax systems with narrow bases and high rates. This is because high mar-ginal tax rates have a larger effect on individual and business decisions about labor and investment.
However, not all measures to broaden the tax base are good tax policy. For instance, broadening the business tax base by lengthening depreciation schedules would cause significant economic harm. Cutting tax rates is a simple endeavor, but defining the tax base is a complex and nuanced task.
Thus, the single most important question for lawmakers seeking to reform the U.S. tax code is, “What should the tax base be?”
Over the past century, there have been two basic approaches to what the U.S. tax base should look like: an income base and a consumption base. Under an income-based tax, individuals pay taxes on their consumption plus their change in wealth. Under a consumption-based tax, individuals pay taxes only on their consumption.
To illustrate the difference between an income-based tax and a consumption-based tax, imagine a small business owner who earns $250,000 in sales, spends $200,000 of it on an investment, and consumes the remaining $50,000.
· Under an income-based tax, the business owner would pay taxes on both the $50,000 of consumption and the $200,000 increase in wealth.
· Under a consumption-based tax, the business owner would only pay taxes on the $50,000 of consumption, and would not pay taxes on the invest-ment until it yields a profit in the future.
The chief advantage of a consumption-based tax is that it avoids the double-taxation of saving and investment. For instance, in the example above, the income-based tax would apply to both the principal of the investment (the $200,000 spent today) and the profits of the investment (the profit that the investment will yield in the future). As a result, this double tax would make the business owner less likely to invest.

TAX FOUNDATION
5
Taken to the extreme, income-based taxes can result in a large number layers of tax on saving and investment. For instance, an investment in a U.S. corporation may be subject to four layers of taxation: once when the income is initially earned, through the individual income tax; a second time when the corporation earns a profit, through the corporate income tax; a third time when the profit is distributed to shareholders, through the individual income tax on dividends; and a fourth time when the individ-ual dies, through the estate tax.
Supporters of income-based taxes argue that income-based taxes are more progres-sive than consumption-based taxes. Because high-income taxpayers are more likely to save and invest than low-income taxpayers, placing several layers of taxes on investment is one way to increase the tax burden of the wealthy. However, it is also possible to make consumption-based taxes progressive, without imposing a higher tax burden on saving and investment.
The U.S. tax system is a hybrid between a pure income tax and a pure consump-tion-based tax. For instance, capital gains are included in the tax base – a feature of an income tax. However, they are taxed at a lower rate – a move toward a consump-tion base. Another example: businesses are unable to deduct the full cost of their capital investments immediately – a feature of an income tax. However, the tax code allows for accelerated depreciation schedules – a move toward a consumption base.
Some of the options in this book would move the U.S. tax system further toward an income tax base, while others would move it further toward a consumption tax base. Lawmakers should give careful consideration to which direction they wish to go in.

OPTIONS FOR REFORMING AMERICA’S TAX CODE
6
How to Use this Book
All of the figures in this book are calculated by the Tax Foundation’s Taxes and Growth model. To estimate the effects of changing the tax code, our model uses the 2008 IRS Public Use File, a set of almost 140,000 anonymized tax returns. The Tax Foundation is one of the few organizations in the United States with a model designed to predict the economic effects of tax changes.
The goal of this book is to give lawmakers and voters a comprehensive picture of how different tax changes would affect the U.S. economy, federal revenue, and the distribution of the tax burden. To that end, each option described in this book is accompanied by several statistics that summarize the projected revenue, economic, and distributional effects of the tax change.
Long-Run Change in GDP: This statistic conveys how much larger or smaller the U.S. economy would be in the long run if a particular tax change were adopted. For instance, if an option results in a 1 percent change in long run GDP, this means that adopting this option would make the U.S. economy 1 percent larger than otherwise. This statistic does not convey any information about how annual GDP growth would change along the adjustment path to the new level as a result of an option.
· How long is the long run? Our model does not predict how long it will take for the full economic effect of tax changes to be felt. However, for most of our dynamic estimates, we assume that it will take 10 years for the U.S. economy to fully adjust as a result of changes in the tax code.
Full-Time Equivalent Jobs: There are roughly 150 million employees in the United States today, but some of them work part-time jobs. Full-time equivalent jobs is a statistic that expresses how many employees there would be if Americans worked the same number of hours, but only in full-time jobs. There are roughly 130 million full-time equivalent employees in the United States today. Many of the options in this book would increase or decrease the capacity of the economy to employ labor, lead-ing to more or fewer full-time equivalent jobs.
Static 10-Year Revenue: Between 2016 and 2025, the federal government is expected to raise roughly $40 trillion in revenue. This statistic conveys how much each option would raise or lower this revenue figure – assuming that the tax change has no macroeconomic effect whatsoever. Note that in some cases, the long run change in revenue might differ from the change in revenue over the first 10 years. Some tax policy changes that unwind historical deferrals or accruals might be front-loaded or back-loaded in their revenue impact.

TAX FOUNDATION
7
Dynamic 10-Year Revenue: This statistic expresses the change in federal revenue that would result from each option, after taking into account all of its economic effects. For instance, if cutting the income tax would lead to more jobs, this in turn would lead to higher payroll tax revenue, making up for some of the revenue lost from the income tax cut. The Tax Foundation believes that our dynamic revenue score is a more accurate reflection of how much federal revenue would actually increase or decrease as a result of a tax change. Note that the long run revenue change, after all adjustments, may be considerably larger than the revenue change over the budget window, because the economic effects take time to build.
Static % Change in After-Tax Income: Most tax changes deliver larger benefits or larger costs to some groups of taxpayers than others. The static distributional table at the bottom of each option shows which taxpayers would pay higher or lower taxes under each option. To produce these tables, we rank each household that pays income tax by adjusted gross income, from lowest to highest, and divide taxpayers into five groups of equal size, known as quintiles. To show how much an option would raise or lower taxes on each group, we calculate the tax change as a percentage of the group’s after-tax income (adjusted gross income minus taxes paid). For instance, the average household in the middle quintile of taxpayers currently earns $33,400 in after-tax income. An option that lowered taxes on members of this quintile by an average of $334 would be reflected as a 1 percent static increase in after-tax income for this group.
Dynamic % Change in After-Tax Income: In addition to benefitting or harming house-holds through higher or lower taxes, the options in this book would also benefit and harm households through their economic effects. The dynamic distributional tables at the bottom of each page show how the after-tax incomes of each group of taxpay-ers would change due to both direct tax changes and indirect economic effects. For instance, a tax change that lowered the taxes of households in the middle quintile by an average of $334 and also grew the economy, increasing their wages by an addi-tional $334, would be reflected as a 2 percent dynamic increase in after-tax income for this group.
Warning: Readers should not not attempt to combine the revenue, economic, or dis-tributional figures from multiple options. For instance, if Option A would raise $100 billion and Option B would raise $200 billion, it is not necessarily the case that imple-menting both Option A and Option B would raise $300 billion. The U.S. tax system contains many components which interact with each other in complex ways.
If you are interested in assembling a tax reform plan of your own, please feel free to contact the Tax Foundation for assistance and model results, at (202) 464-6200. Pri-ority will be given to members of Congress and their staff.

I N D I V I D U A L I N C O M E TA X
CHAPTER 1
Rayburn House Office Building

TAX FOUNDATION
11
IND
IVID
UA
L INCO
ME TA
X
Introduction
The individual income tax is the single most important source of federal revenue, accounting for half of all federal tax collections. As a result, even small changes to the individual income tax can lead to large swings in federal revenue and significant eco-nomic consequences.
The individual income tax is designed to levy a higher burden on households with higher incomes. In 2015, households with more than $200,000 in income earned 29.5 percent of all income but paid 71.8 percent of all federal income taxes. Mean-while, households making less than $25,000 typically owe no income tax at all; many end up receiving additional transfer payments through the income tax code, using refundable credits such as the Earned Income Tax Credit.
The bulk of the income that is subject to the individual income tax comes from wages and salaries. However, the individual income tax also applies to the invest-ment income of households that save, as well as the business income of individuals that participate in pass-through businesses. As discussed throughout this section, the components of the individual income tax that apply to investment and saving are generally more economically harmful than those that apply to labor income.
There is widespread bipartisan agreement that the individual income tax suffers from an overly narrow base. The individual tax code is filled with more than 100 credits, deductions, exclusions, and other provisions that reduce households’ tax payments. These provisions add considerable complexity to the tax filing process and sometimes produce perverse economic effects. However, not all deductions and exclusions are inappropriate; some are needed to measure income correctly and define the tax base.
OPTIONS FOR REFORMING AMERICA’S TAX CODEIN
DIV
IDU
AL
INCO
ME
TAX
12
Individual Income Tax – Rates
The individual income tax on ordinary income is currently levied at seven different rates, ranging from 10 percent to 39.6 percent. Each of these rates is applied to a range of taxable income. These ranges are known as brackets. For example, for a sin-gle filer in 2016, a 10 percent rate applies to the first $9,275 of taxable income, and a 15 percent rate applies to the taxable income earned between $9,275 and $37,650.
A critical feature of tax brackets is that each rate only applies to the taxable income within each bracket, not to income below the lowest end of the bracket. For this reason, a household that falls within the 15 percent bracket, for example, would not usually pay a 15 percent rate on the majority of its income. Instead, some of its income would be taxed at the lower 10 percent rate.
Ordinary income includes most kinds of personal income that taxpayers earn. Because ordinary income is such a large part of the tax base, changes to the rates on ordinary income tend to have large effects on the amount of revenue collected.1
Because the current system of brackets is steeply graduated, a taxpayer’s average rate is often much lower than his or her marginal rate. For example, a household may be in the 25 percent bracket for each additional dollar it earns, but still find that most of its income is taxed under the 10 or 15 percent brackets. Such a system can create high marginal tax rates, which disincentivize work and saving, while still levying low average tax rates, which lead to reduced revenue.
1 Under the current structure of the federal income tax, simply cutting the top ordinary income rate would not actually lead to a much lower tax bill for many high-income households. This is because if the top rate were lowered significantly, many of these households would simply fall into the alternative minimum tax. To reflect the full revenue impact of cutting the top tax rate, all of the options below that cut the top tax rate (#1-2, #5-7, #10, and #12-#13) were modeled alongside the elimination of the alternative minimum tax.
Rate
s
TAX FOUNDATION
13
IND
IVID
UA
L INCO
ME TA
X
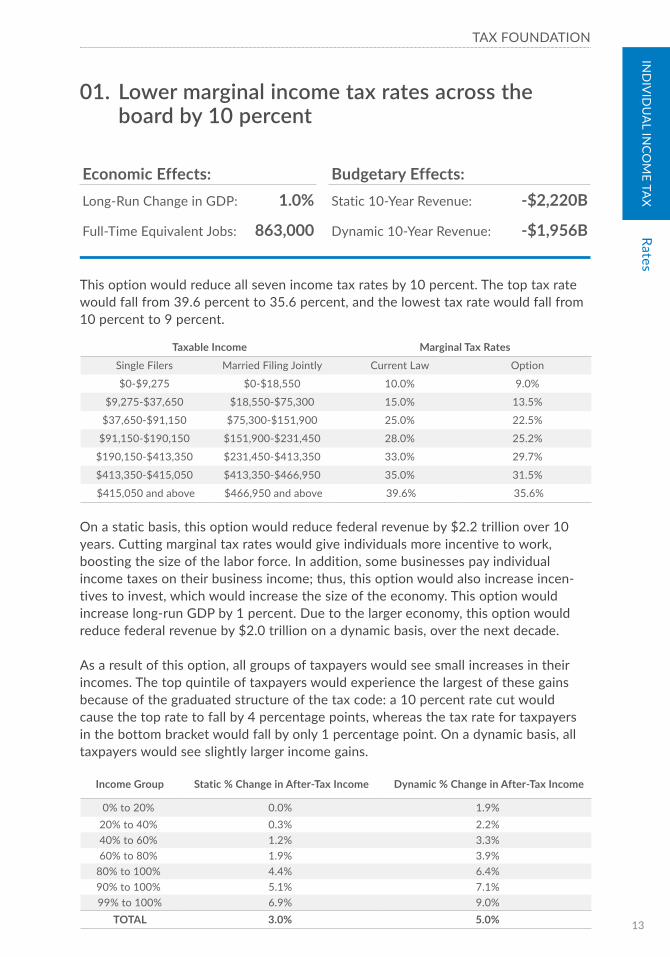
This option would reduce all seven income tax rates by 10 percent. The top tax rate would fall from 39.6 percent to 35.6 percent, and the lowest tax rate would fall from 10 percent to 9 percent.
On a static basis, this option would reduce federal revenue by $2.2 trillion over 10 years. Cutting marginal tax rates would give individuals more incentive to work, boosting the size of the labor force. In addition, some businesses pay individual income taxes on their business income; thus, this option would also increase incen-tives to invest, which would increase the size of the economy. This option would increase long-run GDP by 1 percent. Due to the larger economy, this option would reduce federal revenue by $2.0 trillion on a dynamic basis, over the next decade.
As a result of this option, all groups of taxpayers would see small increases in their incomes. The top quintile of taxpayers would experience the largest of these gains because of the graduated structure of the tax code: a 10 percent rate cut would cause the top rate to fall by 4 percentage points, whereas the tax rate for taxpayers in the bottom bracket would fall by only 1 percentage point. On a dynamic basis, all taxpayers would see slightly larger income gains.
Economic Effects: Budgetary Effects:Long-Run Change in GDP: 1.0% Static 10-Year Revenue: -$2,220B
Full-Time Equivalent Jobs: 863,000 Dynamic 10-Year Revenue: -$1,956B
01. Lower marginal income tax rates across the board by 10 percent
Income Group Static % Change in After-Tax Income Dynamic % Change in After-Tax Income
0% to 20% 0.0% 1.9%20% to 40% 0.3% 2.2%40% to 60% 1.2% 3.3%60% to 80% 1.9% 3.9%
80% to 100% 4.4% 6.4%90% to 100% 5.1% 7.1%99% to 100% 6.9% 9.0%
TOTAL 3.0% 5.0%
Taxable Income Marginal Tax RatesSingle Filers Married Filing Jointly Current Law Option
$0-$9,275 $0-$18,550 10.0% 9.0%
$9,275-$37,650 $18,550-$75,300 15.0% 13.5%
$37,650-$91,150 $75,300-$151,900 25.0% 22.5%
$91,150-$190,150 $151,900-$231,450 28.0% 25.2%
$190,150-$413,350 $231,450-$413,350 33.0% 29.7%
$413,350-$415,050 $413,350-$466,950 35.0% 31.5%
$415,050 and above $466,950 and above 39.6% 35.6%
Rates
OPTIONS FOR REFORMING AMERICA’S TAX CODEIN
DIV
IDU
AL
INCO
ME
TAX
14
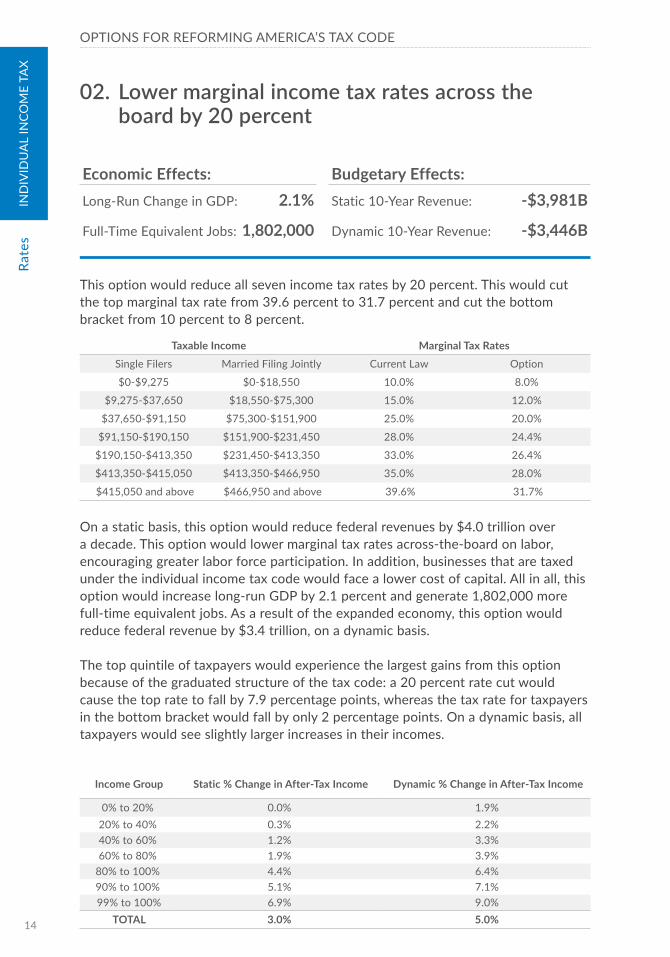
This option would reduce all seven income tax rates by 20 percent. This would cut the top marginal tax rate from 39.6 percent to 31.7 percent and cut the bottom bracket from 10 percent to 8 percent.
On a static basis, this option would reduce federal revenues by $4.0 trillion over a decade. This option would lower marginal tax rates across-the-board on labor, encouraging greater labor force participation. In addition, businesses that are taxed under the individual income tax code would face a lower cost of capital. All in all, this option would increase long-run GDP by 2.1 percent and generate 1,802,000 more full-time equivalent jobs. As a result of the expanded economy, this option would reduce federal revenue by $3.4 trillion, on a dynamic basis.
The top quintile of taxpayers would experience the largest gains from this option because of the graduated structure of the tax code: a 20 percent rate cut would cause the top rate to fall by 7.9 percentage points, whereas the tax rate for taxpayers in the bottom bracket would fall by only 2 percentage points. On a dynamic basis, all taxpayers would see slightly larger increases in their incomes.
Income Group Static % Change in After-Tax Income Dynamic % Change in After-Tax Income
0% to 20% 0.0% 1.9%20% to 40% 0.3% 2.2%40% to 60% 1.2% 3.3%60% to 80% 1.9% 3.9%
80% to 100% 4.4% 6.4%90% to 100% 5.1% 7.1%99% to 100% 6.9% 9.0%
TOTAL 3.0% 5.0%
Economic Effects: Budgetary Effects:Long-Run Change in GDP: 2.1% Static 10-Year Revenue: -$3,981B
Full-Time Equivalent Jobs: 1,802,000 Dynamic 10-Year Revenue: -$3,446B
02. Lower marginal income tax rates across the board by 20 percent
Taxable Income Marginal Tax RatesSingle Filers Married Filing Jointly Current Law Option
$0-$9,275 $0-$18,550 10.0% 8.0%
$9,275-$37,650 $18,550-$75,300 15.0% 12.0%
$37,650-$91,150 $75,300-$151,900 25.0% 20.0%
$91,150-$190,150 $151,900-$231,450 28.0% 24.4%
$190,150-$413,350 $231,450-$413,350 33.0% 26.4%
$413,350-$415,050 $413,350-$466,950 35.0% 28.0%
$415,050 and above $466,950 and above 39.6% 31.7%
Rate
s

TAX FOUNDATION
15
IND
IVID
UA
L INCO
ME TA
X
Lawmakers who want to raise revenue through broad-based tax increases may con-sider raising all marginal tax rates. This option would raise marginal income tax rates by 10 percent across the board. For example, the top tax rate would rise from 39.6 percent to 43.6 percent and the tax rate of the lowest bracket would rise from 10 percent to 11 percent.
This option would raise $1.7 trillion over a decade, on a static basis. Raising marginal tax rates on individuals reduces their incentive to work. In addition, businesses that pay the individual income tax would have less of an incentive to invest, which would reduce investment. As a result of these factors, this option would reduce long-run GDP by 1.4 percent and eliminate 1,139,000 jobs. As a result of the smaller economy, it would raise $1.3 trillion over a decade, on a dynamic basis.
On a static basis, the top quintile of taxpayers would experience the largest losses because of the graduated structure of the tax code: a 10 percent rate hike would cause the top rate to rise by 4 percentage points, whereas the tax rate for taxpayers in the bottom bracket would rises by only 1 percentage point. On a dynamic basis, all taxpayers would see slightly larger reductions in their incomes.
Income Group Static % Change in After-Tax Income Dynamic % Change in After-Tax Income
0% to 20% -0.0% -1.2%20% to 40% -0.2% -1.4%40% to 60% -0.6% -1.9%60% to 80% -1.0% -2.2%
80% to 100% -1.8% -3.0%90% to 100% -2.0% -3.2%99% to 100% -2.7% -4.0%
TOTAL -1.3% -2.5%
Economic Effects: Budgetary Effects:Long-Run Change in GDP: -1.4% Static 10-Year Revenue: $1,696B
Full-Time Equivalent Jobs: -1,139,000 Dynamic 10-Year Revenue: $1,279B
03. Raise marginal income tax rates across the board by 10 percent
Taxable Income Marginal Tax RatesSingle Filers Married Filing Jointly Current Law Option
$0-$9,275 $0-$18,550 10.0% 11.0%
$9,275-$37,650 $18,550-$75,300 15.0% 16.5%
$37,650-$91,150 $75,300-$151,900 25.0% 27.5%
$91,150-$190,150 $151,900-$231,450 28.0% 30.8%
$190,150-$413,350 $231,450-$413,350 33.0% 36.3%
$413,350-$415,050 $413,350-$466,950 35.0% 38.5%
$415,050 and above $466,950 and above 39.6% 43.6%
Rates

OPTIONS FOR REFORMING AMERICA’S TAX CODEIN
DIV
IDU
AL
INCO
ME
TAX
16
This option would raise marginal tax rates across the board by 20 percent. For exam-ple, the top marginal tax rate would rise from 39.6 percent to 47.5 percent and the bottom marginal tax rate would rise from 10 percent to 12 percent.
On a static basis, this option would raise $3.5 trillion over a decade. As with the previous option, this option would increase marginal tax rates on individuals, which would reduce their incentive to work. In addition, businesses that pay the individual income tax would face a higher cost of capital, which would lead to less investment. As a result, this tax increase would reduce long-run GDP by 2.7 percent and elimi-nate 2,252,000 full-time equivalent jobs. The smaller economy would mean that this option would raise $2.6 trillion over a decade, on a dynamic basis.
On a static basis, all taxpayers would see reductions in their after-tax incomes. The top quintile of taxpayers would experience the largest of these losses because of the graduated structure of the tax code: a 20 percent rate hike would cause the top rate to rise by 7.9 percentage points, whereas the lowest tax rate would rise by only 2 percentage points. On a dynamic basis, all taxpayers would see large reductions in their incomes.
Income Group Static % Change in After-Tax Income Dynamic % Change in After-Tax Income
0% to 20% -0.0% -2.4%20% to 40% -0.3% -2.7%40% to 60% -1.2% -3.8%60% to 80% -1.9% -4.3%
80% to 100% -3.7% -6.1%90% to 100% -4.2% -6.5%99% to 100% -5.7% -8.1%
TOTAL -2.7% -5.0%
Economic Effects: Budgetary Effects:Long-Run Change in GDP: -2.7% Static 10-Year Revenue: $3,515B
Full-Time Equivalent Jobs: -2,252,000 Dynamic 10-Year Revenue: $2,649B
04. Raise marginal income tax rates across the board by 20 percent
Taxable Income Marginal Tax RatesSingle Filers Married Filing Jointly Current Law Option
$0-$9,275 $0-$18,550 10.0% 12.0%
$9,275-$37,650 $18,550-$75,300 15.0% 18.0%
$37,650-$91,150 $75,300-$151,900 25.0% 30.0%
$91,150-$190,150 $151,900-$231,450 28.0% 33.6%
$190,150-$413,350 $231,450-$413,350 33.0% 39.6%
$413,350-$415,050 $413,350-$466,950 35.0% 42.0%
$415,050 and above $466,950 and above 39.6% 47.5%
Rate
s
TAX FOUNDATION
17
IND
IVID
UA
L INCO
ME TA
X
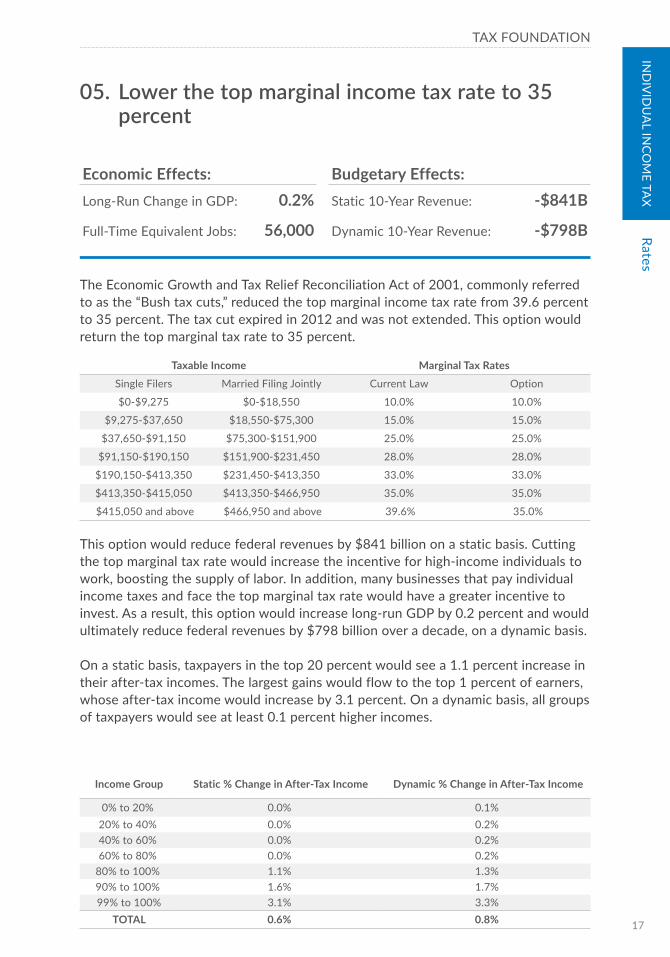
The Economic Growth and Tax Relief Reconciliation Act of 2001, commonly referred to as the “Bush tax cuts,” reduced the top marginal income tax rate from 39.6 percent to 35 percent. The tax cut expired in 2012 and was not extended. This option would return the top marginal tax rate to 35 percent.
This option would reduce federal revenues by $841 billion on a static basis. Cutting the top marginal tax rate would increase the incentive for high-income individuals to work, boosting the supply of labor. In addition, many businesses that pay individual income taxes and face the top marginal tax rate would have a greater incentive to invest. As a result, this option would increase long-run GDP by 0.2 percent and would ultimately reduce federal revenues by $798 billion over a decade, on a dynamic basis.
On a static basis, taxpayers in the top 20 percent would see a 1.1 percent increase in their after-tax incomes. The largest gains would flow to the top 1 percent of earners, whose after-tax income would increase by 3.1 percent. On a dynamic basis, all groups of taxpayers would see at least 0.1 percent higher incomes.
Income Group Static % Change in After-Tax Income Dynamic % Change in After-Tax Income
0% to 20% 0.0% 0.1%20% to 40% 0.0% 0.2%40% to 60% 0.0% 0.2%60% to 80% 0.0% 0.2%
80% to 100% 1.1% 1.3%90% to 100% 1.6% 1.7%99% to 100% 3.1% 3.3%
TOTAL 0.6% 0.8%
Economic Effects: Budgetary Effects:Long-Run Change in GDP: 0.2% Static 10-Year Revenue: -$841B
Full-Time Equivalent Jobs: 56,000 Dynamic 10-Year Revenue: -$798B
05. Lower the top marginal income tax rate to 35 percent
Taxable Income Marginal Tax RatesSingle Filers Married Filing Jointly Current Law Option
$0-$9,275 $0-$18,550 10.0% 10.0%
$9,275-$37,650 $18,550-$75,300 15.0% 15.0%
$37,650-$91,150 $75,300-$151,900 25.0% 25.0%
$91,150-$190,150 $151,900-$231,450 28.0% 28.0%
$190,150-$413,350 $231,450-$413,350 33.0% 33.0%
$413,350-$415,050 $413,350-$466,950 35.0% 35.0%
$415,050 and above $466,950 and above 39.6% 35.0%
Rates

OPTIONS FOR REFORMING AMERICA’S TAX CODEIN
DIV
IDU
AL
INCO
ME
TAX
18
The Tax Reform Act of 1986 made a number of significant changes to the tax code. Among them, it reduced the top marginal tax rate from 50 percent to 28 percent. Since then, the top marginal tax rate has been raised and lowered several times. This option would return the top marginal tax rate to 28 percent by eliminating all tax brackets above the current 28 percent bracket.
This option would reduce federal revenue by $1.9 trillion over a decade, on a static basis. Cutting the top marginal tax rate would increase the incentive for high-income individuals to work, boosting the supply of labor. In addition, many businesses that are subject to the individual income tax code would be presented with greater incen-tives to invest. The lower marginal tax rate would result in an increase in the long-run size of GDP by 1.1 percent. Due to the slightly larger economy, this option would ulti-mately reduce federal revenues by $1.6 trillion over the decade, on a dynamic basis.
On a static basis, only the top 20 percent of taxpayers would see an increase in their after-tax incomes. On a dynamic basis, all groups of taxpayers would see an increase in their after-tax incomes of at least 1.0 percent.
Income Group Static % Change in After-Tax Income Dynamic % Change in After-Tax Income
0% to 20% 0.0% 1.0%20% to 40% 0.0% 1.0%40% to 60% 0.0% 1.1%60% to 80% 0.0% 1.0%
80% to 100% 2.5% 3.6%90% to 100% 3.5% 4.5%99% to 100% 7.5% 8.7%
TOTAL 1.4% 2.4%
Economic Effects: Budgetary Effects:Long-Run Change in GDP: 1.1% Static 10-Year Revenue: -$1,870B
Full-Time Equivalent Jobs: 614,000 Dynamic 10-Year Revenue: -$1,584B
06. Lower the top marginal income tax rate to 28 percent
Taxable Income Marginal Tax RatesSingle Filers Married Filing Jointly Current Law Option
$0-$9,275 $0-$18,550 10.0% 10.0%
$9,275-$37,650 $18,550-$75,300 15.0% 15.0%
$37,650-$91,150 $75,300-$151,900 25.0% 25.0%
$91,150-$190,150 $151,900-$231,450 28.0% 28.0%
$190,150-$413,350 $231,450-$413,350 33.0% 28.0%
$413,350-$415,050 $413,350-$466,950 35.0% 28.0%
$415,050 and above $466,950 and above 39.6% 28.0%
Rate
s

TAX FOUNDATION
19
IND
IVID
UA
L INCO
ME TA
X
The Simpson-Bowles National Commission on Fiscal Responsibility and Reform offered a bipartisan deficit reduction plan in 2010 that would have lowered the top marginal income tax rate to 24 percent. This option is a similar proposal that would lower the top marginal income tax rate from 39.6 percent to 25 percent.
This option would reduce federal revenue by $2.5 trillion over a decade, on a static basis. Cutting the top marginal tax rate would increase the incentive for high-income individuals to work, boosting the supply of labor. In addition, it would give many busi-nesses that pay individual income taxes more incentive to invest. This option would increase long-run GDP by 1.6 percent. Due to the slightly larger economy, this option would ultimately reduce federal revenues by $2 trillion over the decade, on a dynamic basis.
On a static basis, only the top 20 percent of taxpayers would see increases in their after-tax incomes. On a dynamic basis, taxpayers across all income groups would see an increase in after-tax income, due to the growing economy.
Income Group Static % Change in After-Tax Income Dynamic % Change in After-Tax Income
0% to 20% 0.0% 1.4%20% to 40% 0.0% 1.5%40% to 60% 0.0% 1.6%60% to 80% 0.0% 1.5%
80% to 100% 3.4% 5.0%90% to 100% 4.7% 6.3%99% to 100% 9.8% 11.6%
TOTAL 1.9% 3.5%
Economic Effects: Budgetary Effects:Long-Run Change in GDP: 1.6% Static 10-Year Revenue: -$2,510B
Full-Time Equivalent Jobs: 1,010,000 Dynamic 10-Year Revenue: -$2,083B
07. Lower the top marginal income tax rate to 25 percent
Taxable Income Marginal Tax RatesSingle Filers Married Filing Jointly Current Law Option
$0-$9,275 $0-$18,550 10.0% 10.0%
$9,275-$37,650 $18,550-$75,300 15.0% 15.0%
$37,650-$91,150 $75,300-$151,900 25.0% 25.0%
$91,150-$190,150 $151,900-$231,450 28.0% 25.0%
$190,150-$413,350 $231,450-$413,350 33.0% 25.0%
$413,350-$415,050 $413,350-$466,950 35.0% 25.0%
$415,050 and above $466,950 and above 39.6% 25.0%
Rates

OPTIONS FOR REFORMING AMERICA’S TAX CODEIN
DIV
IDU
AL
INCO
ME
TAX
20
Lawmaker who want to raise more revenue and make the tax code more progressive may consider raising the top marginal tax rate. Currently the top marginal tax rate is 39.6 percent on taxable income above $415,000 ($466,950 for taxpayers filing jointly). This option would raise the top marginal tax rate from 39.6 percent to 45 percent.
This option would raise $560 billion over the next decade, on a static basis.. How-ever, the higher top marginal income tax rate would reduce the incentive for individuals to work and reduce investment among businesses that pay taxes through the individual income tax. As a result, this option would reduce long-run GDP by 0.5 percent and lead to 279,000 fewer full-time equivalent jobs. Due to the smaller econ-omy, this option would raise $412 billion, on a dynamic basis, over the next decade.
On a static basis, only the top 20 percent of taxpayers would see reductions in their incomes. The top 1 percent of taxpayers would see a 2.6 percent reduction in their after-tax income. On a dynamic basis, all taxpayers would see smaller after-tax incomes, due to the smaller economy.
Income Group Static % Change in After-Tax Income Dynamic % Change in After-Tax Income
0% to 20% 0.0% -0.5%20% to 40% 0.0% -0.5%40% to 60% 0.0% -0.5%60% to 80% 0.0% -0.5%
80% to 100% -0.8% -1.2%90% to 100% -1.1% -1.5%99% to 100% -2.6% -3.0%
TOTAL -0.4% -0.9%
Economic Effects: Budgetary Effects:Long-Run Change in GDP: -0.5% Static 10-Year Revenue: $560B
Full-Time Equivalent Jobs: -279,000 Dynamic 10-Year Revenue: $412B
08. Raise the top marginal income tax rate to 45 percent
Taxable Income Marginal Tax RatesSingle Filers Married Filing Jointly Current Law Option
$0-$9,275 $0-$18,550 10.0% 10.0%
$9,275-$37,650 $18,550-$75,300 15.0% 15.0%
$37,650-$91,150 $75,300-$151,900 25.0% 25.0%
$91,150-$190,150 $151,900-$231,450 28.0% 28.0%
$190,150-$413,350 $231,450-$413,350 33.0% 33.0%
$413,350-$415,050 $413,350-$466,950 35.0% 35.0%
$415,050 and above $466,950 and above 39.6% 45.0%
Rate
s
TAX FOUNDATION
21
IND
IVID
UA
L INCO
ME TA
X
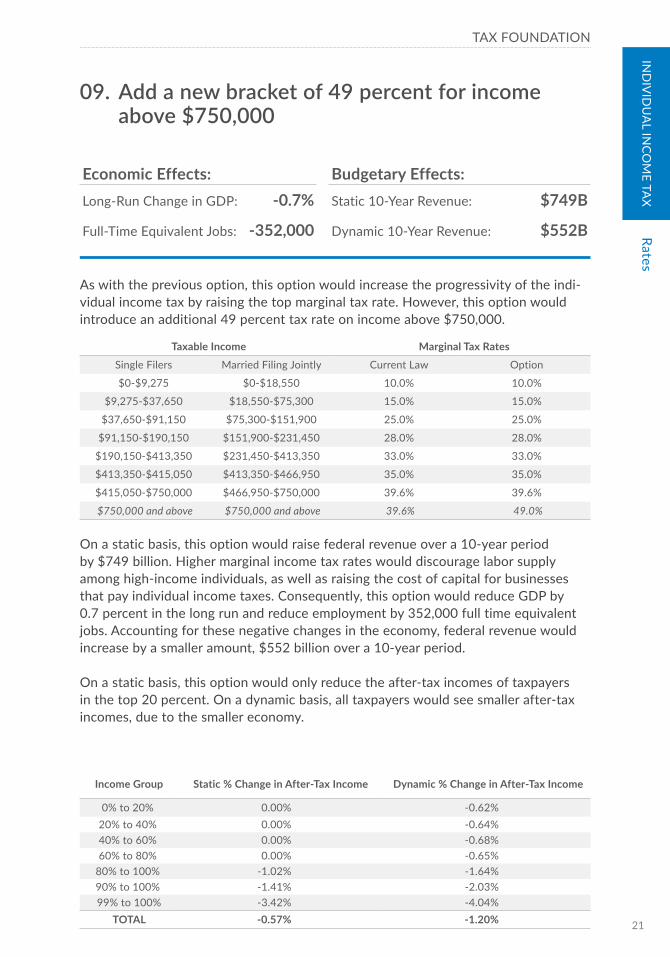
As with the previous option, this option would increase the progressivity of the indi-vidual income tax by raising the top marginal tax rate. However, this option would introduce an additional 49 percent tax rate on income above $750,000.
On a static basis, this option would raise federal revenue over a 10-year period by $749 billion. Higher marginal income tax rates would discourage labor supply among high-income individuals, as well as raising the cost of capital for businesses that pay individual income taxes. Consequently, this option would reduce GDP by 0.7 percent in the long run and reduce employment by 352,000 full time equivalent jobs. Accounting for these negative changes in the economy, federal revenue would increase by a smaller amount, $552 billion over a 10-year period.
On a static basis, this option would only reduce the after-tax incomes of taxpayers in the top 20 percent. On a dynamic basis, all taxpayers would see smaller after-tax incomes, due to the smaller economy.
Income Group Static % Change in After-Tax Income Dynamic % Change in After-Tax Income
0% to 20% 0.00% -0.62%20% to 40% 0.00% -0.64%40% to 60% 0.00% -0.68%60% to 80% 0.00% -0.65%
80% to 100% -1.02% -1.64%90% to 100% -1.41% -2.03%99% to 100% -3.42% -4.04%
TOTAL -0.57% -1.20%
Economic Effects: Budgetary Effects:Long-Run Change in GDP: -0.7% Static 10-Year Revenue: $749B
Full-Time Equivalent Jobs: -352,000 Dynamic 10-Year Revenue: $552B
09. Add a new bracket of 49 percent for income above $750,000
Taxable Income Marginal Tax RatesSingle Filers Married Filing Jointly Current Law Option
$0-$9,275 $0-$18,550 10.0% 10.0%
$9,275-$37,650 $18,550-$75,300 15.0% 15.0%
$37,650-$91,150 $75,300-$151,900 25.0% 25.0%
$91,150-$190,150 $151,900-$231,450 28.0% 28.0%
$190,150-$413,350 $231,450-$413,350 33.0% 33.0%
$413,350-$415,050 $413,350-$466,950 35.0% 35.0%
$415,050-$750,000 $466,950-$750,000 39.6% 39.6%
$750,000 and above $750,000 and above 39.6% 49.0%
Rates

OPTIONS FOR REFORMING AMERICA’S TAX CODEIN
DIV
IDU
AL
INCO
ME
TAX
22
Under this option, income that is currently taxed at 15 percent would be taxed at 10 percent; income currently taxed at 28 and 33 percent would be taxed at 25 percent; and income currently taxed at 39.6 percent would be taxed at 35 percent. This would create a three-bracket income tax.
On a static basis, this change would reduce federal revenue over a 10-year period by $3.1 trillion. Under this option, many taxpayers would face a lower marginal tax rate. This would boost the supply of labor and reduce the cost of capital for businesses that pay the individual income tax. This option would increase long-run GDP by 1.3 percent and create 1.1 million full-time equivalent jobs. After taking into account the effects on the economy, this change would reduce federal revenue by $2.7 trillion over a 10-year period.
On a static basis, this option would have little effect on the lowest 40 percent of taxpayers, because many already fall into the 10 percent income bracket, or use the standard deduction and personal exemption to reduce their taxable income to zero. On a dynamic basis, after-tax income would go up for every group, from 1.2 percent for the lowest quintile to 3.3 percent for the highest quintile.
Income Group Static % Change in After-Tax Income Dynamic % Change in After-Tax Income
0% to 20% 0.0% 1.2%20% to 40% 0.0% 1.2%40% to 60% 1.0% 2.4%60% to 80% 2.3% 3.5%
80% to 100% 3.2% 4.4%90% to 100% 3.5% 4.8%99% to 100% 4.9% 6.2%
TOTAL 2.4% 3.6%
Economic Effects: Budgetary Effects:Long-Run Change in GDP: 1.3% Static 10-Year Revenue: -$3,147B
Full-Time Equivalent Jobs: 1,171,000 Dynamic 10-Year Revenue: -$2,792B
10. Consolidate current brackets into three: 10 percent, 25 percent, and 35 percent
Taxable Income Marginal Tax RatesSingle Filers Married Filing Jointly Current Law Option
$0-$9,275 $0-$18,550 10.0% 10.0%
$9,275-$37,650 $18,550-$75,300 15.0% 10.0%
$37,650-$91,150 $75,300-$151,900 25.0% 25.0%
$91,150-$190,150 $151,900-$231,450 28.0% 25.0%
$190,150-$413,350 $231,450-$413,350 33.0% 25.0%
$413,350-$415,050 $413,350-$466,950 35.0% 35.0%
$415,050-$750,000 $466,950-$750,000 39.6% 35.0%
Rate
s

TAX FOUNDATION
23
IND
IVID
UA
L INCO
ME TA
X
This option would lower the tax rate of the bottom income bracket from 10 percent to 5 percent. Because most taxpayers have some income that falls in the lowest tax bracket, this option would mean a tax cut for most households.
This tax cut would reduce federal government revenue, under a static analysis, by $914 billion, over the next decade.. However, a lower tax rate for the bottom bracket would encourage labor supply among low-income households. Hence, this option would have a small positive effect both on GDP and job creation, with an estimated 177,000 new jobs created in the economy. Taking these effects on the economy into account, federal revenue would fall by a smaller amount, $860 billion.
This change in tax rates would increase post-tax income for all income groups, because most taxpayers have income that is subject to the current 10 percent tax bracket. However, the greatest positive effects would be experienced by the 40th to 80th percentiles of taxpayers, whose post-tax income would go up by 1.3 to 1.7 per-cent on a dynamic basis. Taxpayers at the top would see a smaller benefit, because the tax cut would constitute a smaller share of their income, and because this change would push some high-income individuals into the alternative minimum tax.
Income Group Static % Change in After-Tax Income Dynamic % Change in After-Tax Income
0% to 20% 0.1% 0.2%20% to 40% 0.8% 1.0%40% to 60% 1.5% 1.7%60% to 80% 1.1% 1.3%
80% to 100% 0.4% 0.6%90% to 100% 0.3% 0.4%99% to 100% 0.1% 0.2%
TOTAL 0.7% 0.9%
Economic Effects: Budgetary Effects:Long-Run Change in GDP: 0.2% Static 10-Year Revenue: -$914B
Full-Time Equivalent Jobs: 177,000 Dynamic 10-Year Revenue: -$860B
11. Lower the bottom bracket rate to 5 percent
Taxable Income Marginal Tax RatesSingle Filers Married Filing Jointly Current Law Option
$0-$9,275 $0-$18,550 10.0% 5.0%
$9,275-$37,650 $18,550-$75,300 15.0% 15.0%
$37,650-$91,150 $75,300-$151,900 25.0% 25.0%
$91,150-$190,150 $151,900-$231,450 28.0% 28.0%
$190,150-$413,350 $231,450-$413,350 33.0% 33.0%
$413,350-$415,050 $413,350-$466,950 35.0% 35.0%
$415,050-$750,000 $466,950-$750,000 39.6% 39.6%
Rates
OPTIONS FOR REFORMING AMERICA’S TAX CODEIN
DIV
IDU
AL
INCO
ME
TAX
24
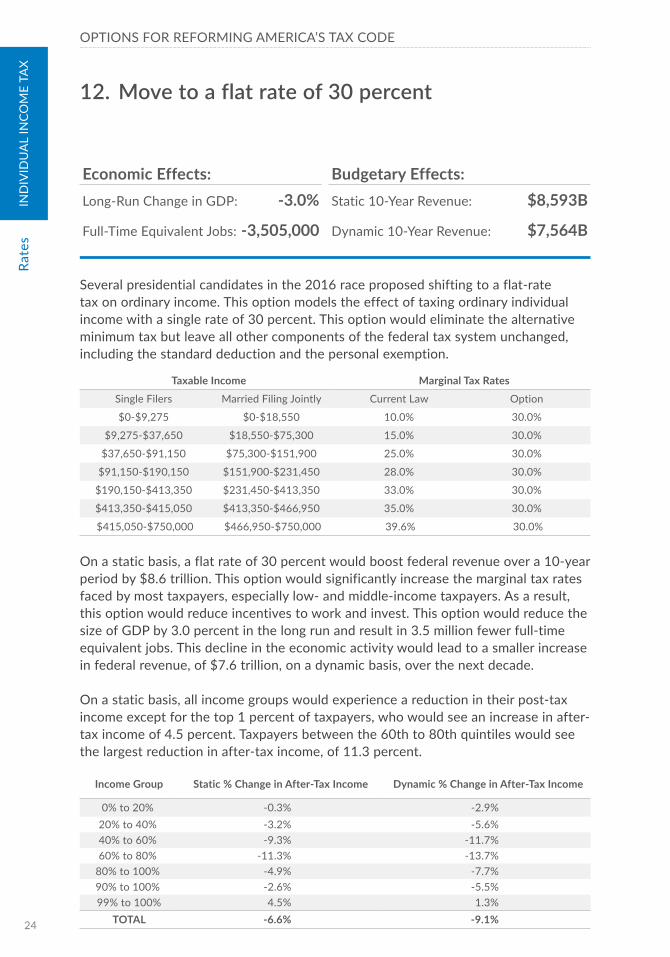
Several presidential candidates in the 2016 race proposed shifting to a flat-rate tax on ordinary income. This option models the effect of taxing ordinary individual income with a single rate of 30 percent. This option would eliminate the alternative minimum tax but leave all other components of the federal tax system unchanged, including the standard deduction and the personal exemption.
On a static basis, a flat rate of 30 percent would boost federal revenue over a 10-year period by $8.6 trillion. This option would significantly increase the marginal tax rates faced by most taxpayers, especially low- and middle-income taxpayers. As a result, this option would reduce incentives to work and invest. This option would reduce the size of GDP by 3.0 percent in the long run and result in 3.5 million fewer full-time equivalent jobs. This decline in the economic activity would lead to a smaller increase in federal revenue, of $7.6 trillion, on a dynamic basis, over the next decade.
On a static basis, all income groups would experience a reduction in their post-tax income except for the top 1 percent of taxpayers, who would see an increase in after-tax income of 4.5 percent. Taxpayers between the 60th to 80th quintiles would see the largest reduction in after-tax income, of 11.3 percent.
Economic Effects: Budgetary Effects:Long-Run Change in GDP: -3.0% Static 10-Year Revenue: $8,593B
Full-Time Equivalent Jobs: -3,505,000 Dynamic 10-Year Revenue: $7,564B
12. Move to a flat rate of 30 percent
Taxable Income Marginal Tax RatesSingle Filers Married Filing Jointly Current Law Option
$0-$9,275 $0-$18,550 10.0% 30.0%
$9,275-$37,650 $18,550-$75,300 15.0% 30.0%
$37,650-$91,150 $75,300-$151,900 25.0% 30.0%
$91,150-$190,150 $151,900-$231,450 28.0% 30.0%
$190,150-$413,350 $231,450-$413,350 33.0% 30.0%
$413,350-$415,050 $413,350-$466,950 35.0% 30.0%
$415,050-$750,000 $466,950-$750,000 39.6% 30.0%
Income Group Static % Change in After-Tax Income Dynamic % Change in After-Tax Income
0% to 20% -0.3% -2.9%20% to 40% -3.2% -5.6%40% to 60% -9.3% -11.7%60% to 80% -11.3% -13.7%
80% to 100% -4.9% -7.7%90% to 100% -2.6% -5.5%99% to 100% 4.5% 1.3%
TOTAL -6.6% -9.1%
Rate
s

TAX FOUNDATION
25
IND
IVID
UA
L INCO
ME TA
X
This option would tax all ordinary individual income at one flat rate with one rate of 20 percent. This option would eliminate the alternative minimum tax but preserve all other elements of the federal tax system.
On a static basis, a flat rate of 20 percent would reduce federal revenue over a 10-year period by $660 billion. This option would significantly increase average tax rates for some taxpayers, especially low- and middle-income taxpayers, but it would reduce average tax rates for the highest-income taxpayers. It would also reduce mar-ginal rates for many taxpayers, increasing incentives to work and invest. This option would increase the size of GDP by 2.2 percent in the long run and result in 1.3 million more full-time equivalent jobs. This increase in economic activity would lead to a smaller decrease in federal revenue, of $99 billion, over a decade.
On a static basis, this option would reduce the after-tax incomes of taxpayers in all quintiles except for those at the top. The top 1 percent of taxpayers would see a 13.7 percent increase in after-tax income. After taking the economic effects of this change into account, many middle-income taxpayers would still see a significant drop in after-tax income.
Income Group Static % Change in After-Tax Income Dynamic % Change in After-Tax Income
0% to 20% -0.2% 1.8%20% to 40% -1.6% 0.2%40% to 60% -4.1% -2.1%60% to 80% -4.3% -2.4%
80% to 100% 3.6% 5.8%90% to 100% 6.2% 8.5%99% to 100% 13.7% 16.1%
TOTAL -0.5% 2.6%
Economic Effects: Budgetary Effects:Long-Run Change in GDP: 2.2% Static 10-Year Revenue: -$660B
Full-Time Equivalent Jobs: 1,299,000 Dynamic 10-Year Revenue: -$99B
13. Move to a flat rate of 20 percent
Taxable Income Marginal Tax RatesSingle Filers Married Filing Jointly Current Law Option
$0-$9,275 $0-$18,550 10.0% 20.0%
$9,275-$37,650 $18,550-$75,300 15.0% 20.0%
$37,650-$91,150 $75,300-$151,900 25.0% 20.0%
$91,150-$190,150 $151,900-$231,450 28.0% 20.0%
$190,150-$413,350 $231,450-$413,350 33.0% 20.0%
$413,350-$415,050 $413,350-$466,950 35.0% 20.0%
$415,050-$750,000 $466,950-$750,000 39.6% 20.0%
Rates

OPTIONS FOR REFORMING AMERICA’S TAX CODEIN
DIV
IDU
AL
INCO
ME
TAX
26
Individual Income Tax – Capital Gains and Dividends
Under the current U.S. tax code, two types of income are taxed on a separate bracket schedule from ordinary income: long-term capital gains and qualified dividends. Long-term capital gains occur when a taxpayer sells an asset held more than a year for a profit. Qualified dividends are payments made by U.S. corporations and some foreign corporations to shareholders who have owned stock for a certain length of time. These two forms of income are taxed under a bracket schedule that has just three rates, at 0, 15, and 20 percent. Additionally, this income can face a 3.8 percent sur-tax called the Net Investment Income Tax, a provision of the Patient Protection and Affordable Care Act of 2010 that brings the top rate up to a combined 23.8 percent.
There are two main reasons that this kind of income is taxed at a lower rate. First, most of the dividends and capital gains that households receive have already been subject to the corporate income tax. The lower rate on capital gains and dividend income helps mitigate the double tax on U.S. corporate income.
Second, before individuals invest their money, typically, they have already paid ordi-nary income taxes on the principal of the investment. Because these ordinary income taxes reduce the amount that individuals have to invest, they also reduce the invest-ment returns. As a result, investment returns are already implicitly subject to one layer of federal taxation.
In other words, capital gains and dividend income are earned in an environment where other taxes have already applied to the income, justifying the lower rate.
Capital gains and dividends are a relatively small share of total individual income. As a result, changes in the rate on capital gains and dividends have a relatively smaller effect on revenue. However, they have a substantial impact on incentives to invest, and therefore, the economy.
Increasing the tax rate on capital gains can discourage households from selling their assets and realizing gains, leading to less federal revenue. Similarly, decreasing the tax rate on capital gains can make households more likely to sell their assets, leading to greater federal revenue. The revenue scores presented in this section do not take into account each option’s effect on households’ realization behavior.
Cap
ital G
ains
and
Div
iden
ds

TAX FOUNDATION
27
IND
IVID
UA
L INCO
ME TA
X
Under the current U.S. tax code, long-term capital gains and qualified dividends are taxed at lower rates than ordinary income (which includes wages, interest, and most other sources of income). The Department of the Treasury and the Joint Committee on Taxation categorize the separate rate schedule for capital gains and dividends as a tax expenditure. However, lower rates on long-term capital gains and qualified divi-dends can offset some of the double taxation of corporate income and savings.
Eliminating taxes on long-term capital gains and qualified dividends would reduce federal revenue substantially: a $1.7 trillion decrease over the next 10 years, on a static basis. However, this option would significantly lower marginal tax rates on savings and investment, decreasing the cost of capital, and increasing GDP by 2.7 percent in the long run. Taking into account these economic effects, this option’s 10-year revenue cost would be around $1 trillion, on a dynamic basis.
Because wealthy households derive relatively more of their income from long-term capital gains and qualified dividends, this option would cause the after-tax incomes of the top quintile of taxpayers to increase by 2.3 percent. The top 1 percent of tax-payers would see a higher increase, of 6.6 percent, in their after-tax incomes. On a dynamic basis, all groups of taxpayers would see least 2.4 percent higher after-tax incomes.
Economic Effects: Budgetary Effects:Long-Run Change in GDP: 2.7% Static 10-Year Revenue: -$1,683B
Full-Time Equivalent Jobs: 525,000 Dynamic 10-Year Revenue: -$979B
14. Eliminate taxes on long-term capital gains and qualified dividends
Income Group Static % Change in After-Tax Income Dynamic % Change in After-Tax Income
0% to 20% 0.0% 2.4%20% to 40% 0.0% 2.5%40% to 60% 0.0% 2.7%60% to 80% 0.0% 2.6%
80% to 100% 2.3% 4.8%90% to 100% 3.1% 5.7%99% to 100% 6.6% 9.3%
TOTAL 1.3% 3.8%
Capital G
ains and Dividends

OPTIONS FOR REFORMING AMERICA’S TAX CODEIN
DIV
IDU
AL
INCO
ME
TAX
28
Under the current U.S. tax code, long-term capital gains and qualified dividends are taxed at lower rates than ordinary income (which includes wages, interest, and most other sources of income). The Department of the Treasury and the Joint Committee on Taxation categorize the separate rate schedule for capital gains and dividends as a tax expenditure. However, lower rates on long-term capital gains and qualified divi-dends can offset some of the double taxation of corporate income and savings.
This option would first eliminate the preferential treatment for long-term capital gains and qualified dividends and tax them as ordinary income, and then exclude 40 percent of long-term capital gains and qualified dividends from taxable incomes. In effect, this option would slightly raise marginal tax rates on capital gains and divi-dends across the board.
Over the next 10 years, this option would increase federal revenue by $625 billion, on a static basis. However, accounting for the macroeconomic effects from the tax change, federal revenue would increase by only $309 billion over the next decade. This option would increase marginal taxes on saving and investment, which would lead to a higher cost of capital, decreasing GDP by 1.1 percent.
Because high-income households derive a larger share of their income from long-term capital gains and qualified dividends, this option would primarily increase taxes on high-income taxpayers, on a static basis. For instance, the top 1 percent of taxpayers would see their incomes fall by 2.3 percent. However, after accounting for the eco-nomic effects of this option, taxpayers in all income groups would see their incomes decrease by at least 1 percent.
Income Group Static % Change in After-Tax Income Dynamic % Change in After-Tax Income
0% to 20% 0.0% -1.0%20% to 40% 0.0% -1.1%40% to 60% 0.0% -1.2%60% to 80% -0.1% -1.1%
80% to 100% -0.8% -1.8%90% to 100% -1.1% -2.1%99% to 100% -2.3% -3.4%
TOTAL -0.5% -1.5%
Economic Effects: Budgetary Effects:Long-Run Change in GDP: -1.1% Static 10-Year Revenue: $625B
Full-Time Equivalent Jobs: -228,000 Dynamic 10-Year Revenue: $309B
15. Replace lower rates on long-term capital gains and qualified dividends with an exclusion of 40 percent
Cap
ital G
ains
and
Div
iden
ds

TAX FOUNDATION
29
IND
IVID
UA
L INCO
ME TA
X
Under the current U.S. tax code, long-term capital gains and qualified dividends are taxed at lower rates than ordinary income (which includes wages, interest, and most other sources of income). The Department of the Treasury and the Joint Committee on Taxation categorize the separate rate schedule for capital gains and dividends as a tax expenditure. However, lower rates on long-term capital gains and qualified divi-dends can offset some of the double taxation of corporate income and savings.
Until recently, the top tax rate on long-term capital gains and qualified dividends was 15 percent. This option would return to a 15 percent top rate on capital gains and dividends. This would reduce federal revenue by $321 billion, on a static basis. However, because this option would also reduce marginal tax rates on saving and investment, it would lead to a 0.5 percent increase in GDP. The economy would see an increase of 98,000 full-time equivalent jobs and the 10-year revenue cost would be decreased to $187 billion.
This option would increase after-tax incomes by 0.2 percent, on average, on a static basis. Because wealthy households derive relatively more of their income from long-term capital gains and qualified dividends, the top 1 percent of taxpayers would see an increase of 1.5 percent in their after-tax income. On a dynamic basis, each quintile would see at least an additional 0.4 percent increase in after-tax incomes, due to a larger economy.
Economic Effects: Budgetary Effects:Long-Run Change in GDP: 0.5% Static 10-Year Revenue: -$321B
Full-Time Equivalent Jobs: 98,000 Dynamic 10-Year Revenue: -$187B
16. Lower the top rate on capital gains and dividends to 15 percent
Income Group Static % Change in After-Tax Income Dynamic % Change in After-Tax Income
0% to 20% 0.0% 0.4%20% to 40% 0.0% 0.5%40% to 60% 0.0% 0.5%60% to 80% 0.0% 0.5%
80% to 100% 0.4% 0.9%90% to 100% 0.6% 1.1%99% to 100% 1.5% 1.9%
TOTAL 0.2% 0.7%
Capital G
ains and Dividends
OPTIONS FOR REFORMING AMERICA’S TAX CODEIN
DIV
IDU
AL
INCO
ME
TAX
30
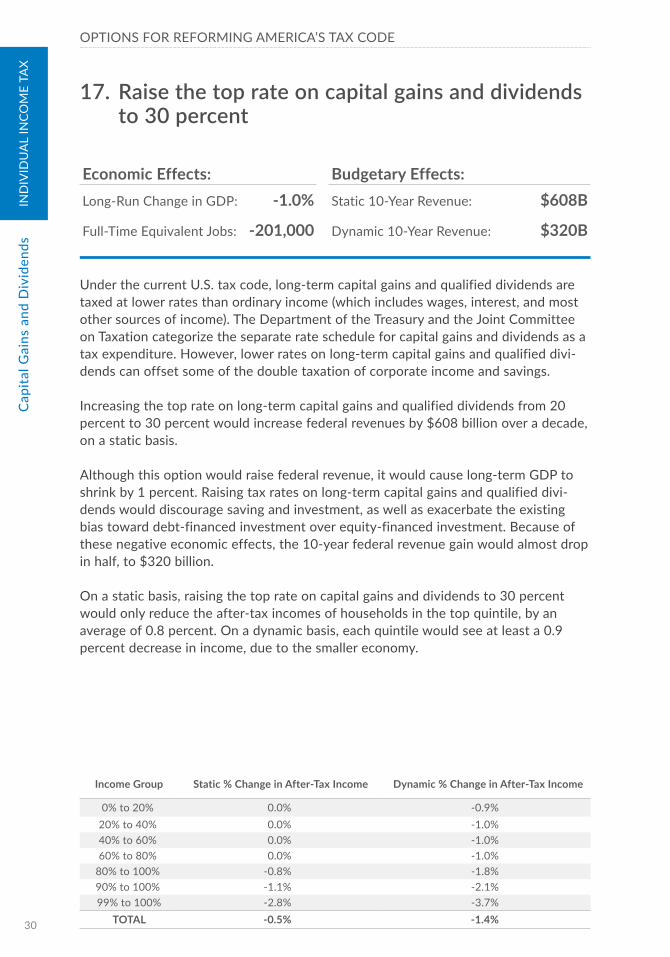
Under the current U.S. tax code, long-term capital gains and qualified dividends are taxed at lower rates than ordinary income (which includes wages, interest, and most other sources of income). The Department of the Treasury and the Joint Committee on Taxation categorize the separate rate schedule for capital gains and dividends as a tax expenditure. However, lower rates on long-term capital gains and qualified divi-dends can offset some of the double taxation of corporate income and savings.
Increasing the top rate on long-term capital gains and qualified dividends from 20 percent to 30 percent would increase federal revenues by $608 billion over a decade, on a static basis.
Although this option would raise federal revenue, it would cause long-term GDP to shrink by 1 percent. Raising tax rates on long-term capital gains and qualified divi-dends would discourage saving and investment, as well as exacerbate the existing bias toward debt-financed investment over equity-financed investment. Because of these negative economic effects, the 10-year federal revenue gain would almost drop in half, to $320 billion.
On a static basis, raising the top rate on capital gains and dividends to 30 percent would only reduce the after-tax incomes of households in the top quintile, by an average of 0.8 percent. On a dynamic basis, each quintile would see at least a 0.9 percent decrease in income, due to the smaller economy.
Income Group Static % Change in After-Tax Income Dynamic % Change in After-Tax Income
0% to 20% 0.0% -0.9%20% to 40% 0.0% -1.0%40% to 60% 0.0% -1.0%60% to 80% 0.0% -1.0%
80% to 100% -0.8% -1.8%90% to 100% -1.1% -2.1%99% to 100% -2.8% -3.7%
TOTAL -0.5% -1.4%
Economic Effects: Budgetary Effects:Long-Run Change in GDP: -1.0% Static 10-Year Revenue: $608B
Full-Time Equivalent Jobs: -201,000 Dynamic 10-Year Revenue: $320B
17. Raise the top rate on capital gains and dividends to 30 percent
Cap
ital G
ains
and
Div
iden
ds

TAX FOUNDATION
31
IND
IVID
UA
L INCO
ME TA
X
Under the current U.S. tax code, long-term capital gains and qualified dividends are taxed at lower rates than ordinary income (which includes wages, interest, and most other sources of income). The Department of the Treasury and the Joint Committee on Taxation categorize the separate rate schedule for capital gains and dividends as a tax expenditure. However, lower rates on long-term capital gains and qualified divi-dends can offset some of the double taxation of corporate income and savings.
This option would subject long-term capital gains and qualified dividends to the same bracket schedule as other income. This would nearly double the top rate on capital gains and dividends, increasing it by almost 19.6 percent.
This tax hike would increase federal revenue by $1.5 trillion over the next 10 years, on a static basis. It would also significantly increase the cost of capital, by raising the marginal tax rate on savings and investment. As a result, the long-run level of GDP would decline by 3.3 percent, leading to 698,000 fewer full-time equivalent jobs. On a dynamic basis, this option would only raise $569 billion over the next decade.
On a static basis, taxpayers in the bottom four quintiles would only see small increases in their tax burden, while the top quintile would see the highest decrease, of 2.0 percent. On a dynamic basis, the GDP loss would result in even lower after-tax incomes for all groups of taxpayers.
Economic Effects: Budgetary Effects:Long-Run Change in GDP: -3.3% Static 10-Year Revenue: $1,521B
Full-Time Equivalent Jobs: -698,000 Dynamic 10-Year Revenue: $569B
18. Tax capital gains and dividends at ordinary income rates
Income Group Static % Change in After-Tax Income Dynamic % Change in After-Tax Income
0% to 20% 0.0% -3.0%20% to 40% 0.0% -3.1%40% to 60% -0.1% -3.4%60% to 80% -0.1% -3.3%
80% to 100% -2.0% -5.0%90% to 100% -2.6% -5.6%99% to 100% -5.6% -8.6%
TOTAL -1.2% -4.2%
Capital G
ains and Dividends

OPTIONS FOR REFORMING AMERICA’S TAX CODEIN
DIV
IDU
AL
INCO
ME
TAX
32
The Net Investment Income Tax was created by the Patient Protection and Affordable Care Act of 2010. It is an additional 3.8 percent income tax on certain net investment income, such as dividends, capital gains, interest, estates and trusts. The Net Invest-ment Income Tax kicks in when modified adjusted gross income rises above $200,000 for singles or $250,000 for couples. Those thresholds are not indexed for inflation, so this tax will affect more taxpayers with each passing year.
Repealing the Net Investment Income Tax would reduce revenue by $628 billion over the next 10 years, assuming this tax change has no effect on the economy. However, this option would decrease marginal tax rates on savings and investment, leading to a 0.7 percent larger economy in the long run. After taking the larger economy into account, federal revenues would decline by $444 billion over the next decade as a result of this option.
Since the taxpayers who have income from investment, dividends, or interest are usu-ally from high-income households, eliminating the Net Investment Income Tax would cause after-tax income for high-income taxpayers to increase. Taxpayers in the top quintile would see an increase of 0.9 percent in their after-tax income. The top 1 per-cent would see an increase of 2.7 percent. On a dynamic basis, all quintiles would see an additional 0.6 percent increase in after-tax income, due to economic growth.
Income Group Static % Change in After-Tax Income Dynamic % Change in After-Tax Income
0% to 20% 0.0% 0.6%20% to 40% 0.0% 0.6%40% to 60% 0.0% 0.7%60% to 80% 0.0% 0.6%
80% to 100% 0.9% 1.5%90% to 100% 1.2% 1.8%99% to 100% 2.7% 3.4%
TOTAL 0.5% 1.1%
Economic Effects: Budgetary Effects:Long-Run Change in GDP: 0.7% Static 10-Year Revenue: -$628B
Full-Time Equivalent Jobs: 133,000 Dynamic 10-Year Revenue: -$444B
19. Repeal the Net Investment Income Tax
Cap
ital G
ains
and
Div
iden
ds

TAX FOUNDATION
33
IND
IVID
UA
L INCO
ME TA
X
Carried interest is a form of compensation of investment managers at private equity firms and hedge funds. Many investment managers are compensated according to a “two and twenty” arrangement: the investment managers are automatically paid 2 percent of all assets invested, and earn an additional 20 percent of whatever addi-tional profits they help to bring in. This 20 percent fee is known as “carried interest.”
The proper tax treatment of carried interest is a subject of debate. Specifically, it is not always clear whether carried interest should be treated as labor income or capital income. Under current U.S. law, carried interest is treated as capital gains income and is taxed at the same lower rates as long-term capital gains. Some observers argue that because carried interest is a form of compensation for managers’ talents and ser-vices, it is no different than any other form of labor income.
Taxing carried interest as ordinary income would raise $15 billion over the next decade, on a static basis. Carried interest represents only a very small portion of all employee compensation. Thus, the economic impacts of this tax change would be small. This option would reduce long-run GDP by 0.01 percent. The 10-year revenue gain would drop to $13 billion, on a dynamic basis.
On both a static and dynamic basis, only taxpayers in the top quintile would see a noticeable reduction in after-tax income. Taxpayers in the top 1 percent would see the largest reduction in after-tax income, of 0.07 percent.
Economic Effects: Budgetary Effects:Long-Run Change in GDP: -0.01% Static 10-Year Revenue: $15B
Full-Time Equivalent Jobs: -2,200 Dynamic 10-Year Revenue: $13B
20. Tax carried interest as ordinary income
Income Group Static % Change in After-Tax Income Dynamic % Change in After-Tax Income
0% to 20% 0.0% 0.0%20% to 40% 0.0% 0.0%40% to 60% 0.0% 0.0%60% to 80% 0.0% 0.0%
80% to 100% -0.02% -0.03%90% to 100% -0.03% -0.04%99% to 100% -0.07% -0.08%
TOTAL 0.0% 0.0%
Capital G
ains and Dividends

OPTIONS FOR REFORMING AMERICA’S TAX CODEIN
DIV
IDU
AL
INCO
ME
TAX
34
Individual Income Tax – Credits
Tax credits are provisions that subtract from a taxpayer’s tax bill directly. For example, if a taxpayer receives a credit of $1,000, the taxpayer’s total taxes owed would be reduced by exactly $1,000.
Many credits, such as those for residential energy, are narrowly targeted provisions designed to favor specific industries or economic activities. However, other credits apply more broadly.
Typically, tax credits cannot reduce a household’s tax bill below zero, but a few spe-cial credits, known as refundable tax credits, can give a taxpayer an income tax bill of less than zero. They are called refundable because they often result in the IRS send-ing out refund checks to taxpayers.
Two of the best-known and largest refundable tax credits are the earned income tax credit and the child tax credit. These credits supplement the incomes of lower-income taxpayers, but can only be claimed by households with some earned income.
Cre
dits

TAX FOUNDATION
35
IND
IVID
UA
L INCO
ME TA
X
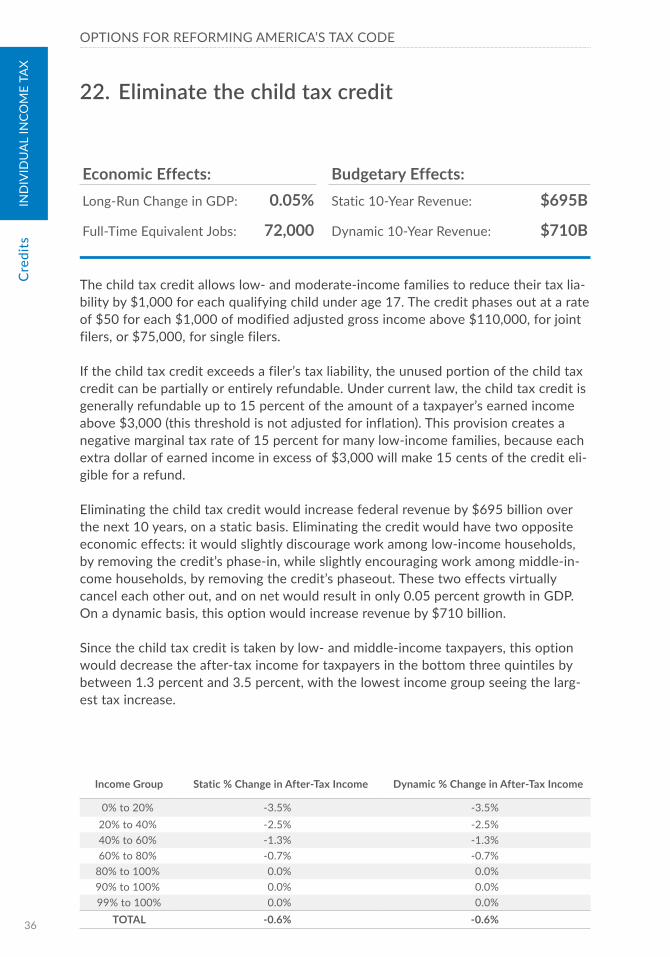
The child tax credit allows low- and moderate-income families to reduce their tax lia-bility by $1,000 for each qualifying child under age 17. The credit phases out at a rate of $50 for each $1,000 of modified adjusted gross income above $110,000, for joint filers, or $75,000, for single filers.
If the child tax credit exceeds a filer’s tax liability, the unused portion of the child tax credit can be partially or entirely refundable. Under current law, the child tax credit is generally refundable up to 15 percent of the amount of a taxpayer’s earned income above $3,000. This provision creates a negative marginal tax rate of 15 percent for many low-income families, because each extra dollar of earned income in excess of $3,000 will make 15 cents of the credit refundable.
Doubling the size of the child tax credit for each qualifying child, to $2,000, would reduce federal revenue by $640 billion over the next decade, on a static basis. The larger child tax credit would take longer to phase in, slightly reducing marginal tax rates for some low-income families with children. However, it would also take lon-ger to phase out, increasing marginal tax rates on some middle-income families. As a result, this option would have only a small effect on long-term GDP. On a dynamic basis, the 10-year revenue cost would be $626 billion.
Because the child tax credit is claimed by low- and middle-income families, doubling the child tax credit would lead to significantly higher after-tax incomes for taxpayers in the bottom half of the income distribution. Taxpayers in the second lowest quintile would see the largest increase, of 2.1 percent.
Economic Effects: Budgetary Effects:Long-Run Change in GDP: 0.1% Static 10-Year Revenue: -$640B
Full-Time Equivalent Jobs: 40,000 Dynamic 10-Year Revenue: -$626B
21. Double the child tax credit
Income Group Static % Change in After-Tax Income Dynamic % Change in After-Tax Income
0% to 20% 0.5% 0.6%20% to 40% 2.1% 2.1%40% to 60% 1.4% 1.4%60% to 80% 0.8% 0.8%
80% to 100% 0.1% 0.1%90% to 100% 0.0% 0.1%99% to 100% 0.0% 0.0%
TOTAL 0.6% 0.6%
Credits
OPTIONS FOR REFORMING AMERICA’S TAX CODEIN
DIV
IDU
AL
INCO
ME
TAX
36
The child tax credit allows low- and moderate-income families to reduce their tax lia-bility by $1,000 for each qualifying child under age 17. The credit phases out at a rate of $50 for each $1,000 of modified adjusted gross income above $110,000, for joint filers, or $75,000, for single filers.
If the child tax credit exceeds a filer’s tax liability, the unused portion of the child tax credit can be partially or entirely refundable. Under current law, the child tax credit is generally refundable up to 15 percent of the amount of a taxpayer’s earned income above $3,000 (this threshold is not adjusted for inflation). This provision creates a negative marginal tax rate of 15 percent for many low-income families, because each extra dollar of earned income in excess of $3,000 will make 15 cents of the credit eli-gible for a refund.
Eliminating the child tax credit would increase federal revenue by $695 billion over the next 10 years, on a static basis. Eliminating the credit would have two opposite economic effects: it would slightly discourage work among low-income households, by removing the credit’s phase-in, while slightly encouraging work among middle-in-come households, by removing the credit’s phaseout. These two effects virtually cancel each other out, and on net would result in only 0.05 percent growth in GDP. On a dynamic basis, this option would increase revenue by $710 billion.
Since the child tax credit is taken by low- and middle-income taxpayers, this option would decrease the after-tax income for taxpayers in the bottom three quintiles by between 1.3 percent and 3.5 percent, with the lowest income group seeing the larg-est tax increase.
Income Group Static % Change in After-Tax Income Dynamic % Change in After-Tax Income
0% to 20% -3.5% -3.5%20% to 40% -2.5% -2.5%40% to 60% -1.3% -1.3%60% to 80% -0.7% -0.7%
80% to 100% 0.0% 0.0%90% to 100% 0.0% 0.0%99% to 100% 0.0% 0.0%
TOTAL -0.6% -0.6%
Economic Effects: Budgetary Effects:Long-Run Change in GDP: 0.05% Static 10-Year Revenue: $695B
Full-Time Equivalent Jobs: 72,000 Dynamic 10-Year Revenue: $710B
22. Eliminate the child tax credit
Cre
dits
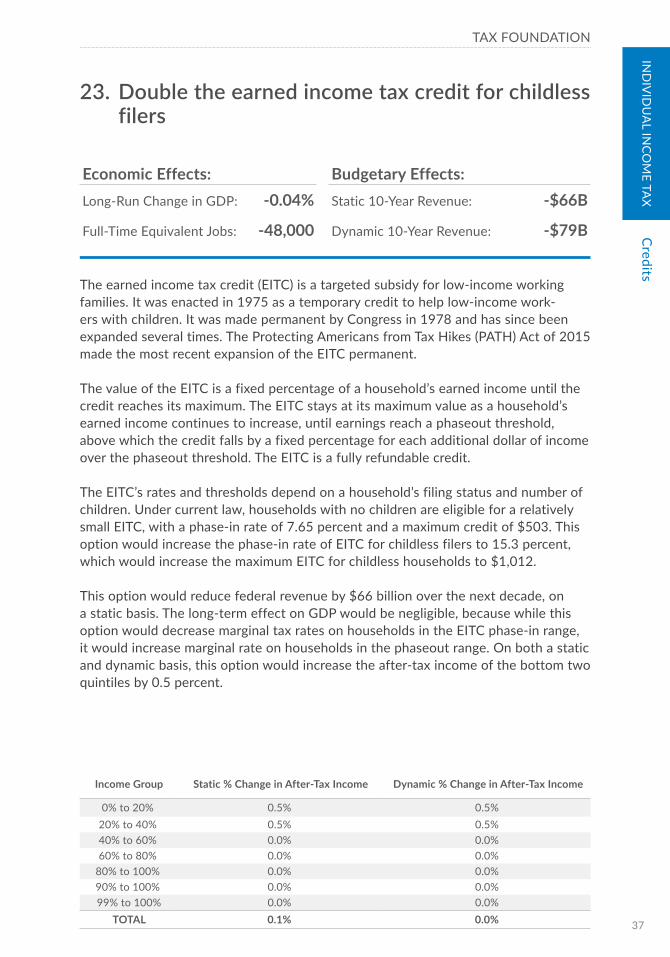
TAX FOUNDATION
37
IND
IVID
UA
L INCO
ME TA
X
The earned income tax credit (EITC) is a targeted subsidy for low-income working families. It was enacted in 1975 as a temporary credit to help low-income work-ers with children. It was made permanent by Congress in 1978 and has since been expanded several times. The Protecting Americans from Tax Hikes (PATH) Act of 2015 made the most recent expansion of the EITC permanent.
The value of the EITC is a fixed percentage of a household’s earned income until the credit reaches its maximum. The EITC stays at its maximum value as a household’s earned income continues to increase, until earnings reach a phaseout threshold, above which the credit falls by a fixed percentage for each additional dollar of income over the phaseout threshold. The EITC is a fully refundable credit.
The EITC’s rates and thresholds depend on a household’s filing status and number of children. Under current law, households with no children are eligible for a relatively small EITC, with a phase-in rate of 7.65 percent and a maximum credit of $503. This option would increase the phase-in rate of EITC for childless filers to 15.3 percent, which would increase the maximum EITC for childless households to $1,012.
This option would reduce federal revenue by $66 billion over the next decade, on a static basis. The long-term effect on GDP would be negligible, because while this option would decrease marginal tax rates on households in the EITC phase-in range, it would increase marginal rate on households in the phaseout range. On both a static and dynamic basis, this option would increase the after-tax income of the bottom two quintiles by 0.5 percent.
Income Group Static % Change in After-Tax Income Dynamic % Change in After-Tax Income
0% to 20% 0.5% 0.5%20% to 40% 0.5% 0.5%40% to 60% 0.0% 0.0%60% to 80% 0.0% 0.0%
80% to 100% 0.0% 0.0%90% to 100% 0.0% 0.0%99% to 100% 0.0% 0.0%
TOTAL 0.1% 0.0%
Economic Effects: Budgetary Effects:Long-Run Change in GDP: -0.04% Static 10-Year Revenue: -$66B
Full-Time Equivalent Jobs: -48,000 Dynamic 10-Year Revenue: -$79B
23. Double the earned income tax credit for childless filers
Credits
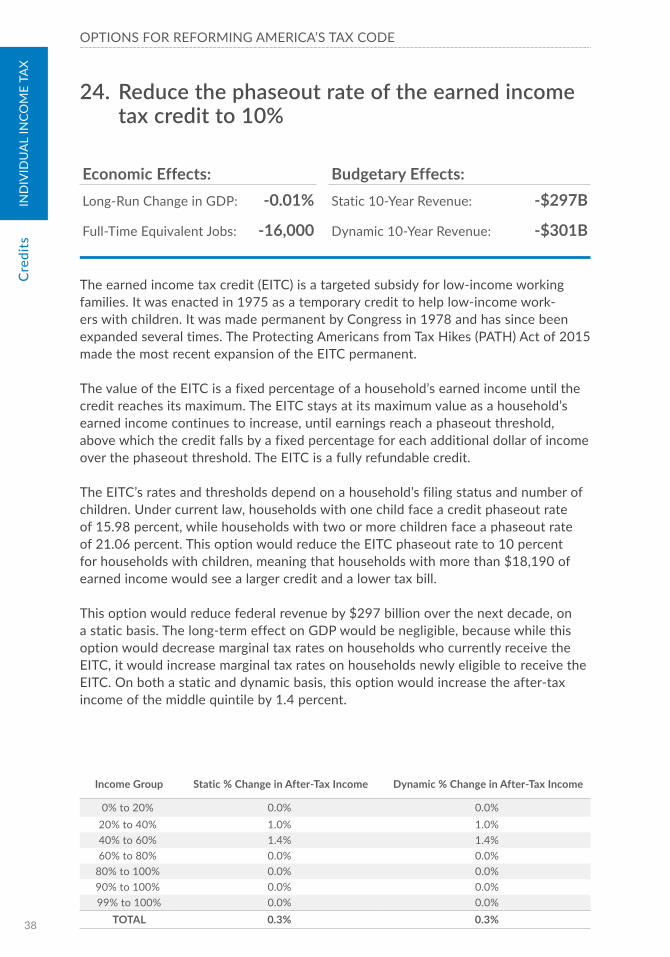
OPTIONS FOR REFORMING AMERICA’S TAX CODEIN
DIV
IDU
AL
INCO
ME
TAX
38
The earned income tax credit (EITC) is a targeted subsidy for low-income working families. It was enacted in 1975 as a temporary credit to help low-income work-ers with children. It was made permanent by Congress in 1978 and has since been expanded several times. The Protecting Americans from Tax Hikes (PATH) Act of 2015 made the most recent expansion of the EITC permanent.
The value of the EITC is a fixed percentage of a household’s earned income until the credit reaches its maximum. The EITC stays at its maximum value as a household’s earned income continues to increase, until earnings reach a phaseout threshold, above which the credit falls by a fixed percentage for each additional dollar of income over the phaseout threshold. The EITC is a fully refundable credit.
The EITC’s rates and thresholds depend on a household’s filing status and number of children. Under current law, households with one child face a credit phaseout rate of 15.98 percent, while households with two or more children face a phaseout rate of 21.06 percent. This option would reduce the EITC phaseout rate to 10 percent for households with children, meaning that households with more than $18,190 of earned income would see a larger credit and a lower tax bill.
This option would reduce federal revenue by $297 billion over the next decade, on a static basis. The long-term effect on GDP would be negligible, because while this option would decrease marginal tax rates on households who currently receive the EITC, it would increase marginal tax rates on households newly eligible to receive the EITC. On both a static and dynamic basis, this option would increase the after-tax income of the middle quintile by 1.4 percent.
Economic Effects: Budgetary Effects:Long-Run Change in GDP: -0.01% Static 10-Year Revenue: -$297B
Full-Time Equivalent Jobs: -16,000 Dynamic 10-Year Revenue: -$301B
24. Reduce the phaseout rate of the earned income tax credit to 10%
Income Group Static % Change in After-Tax Income Dynamic % Change in After-Tax Income
0% to 20% 0.0% 0.0%20% to 40% 1.0% 1.0%40% to 60% 1.4% 1.4%60% to 80% 0.0% 0.0%
80% to 100% 0.0% 0.0%90% to 100% 0.0% 0.0%99% to 100% 0.0% 0.0%
TOTAL 0.3% 0.3%
Cre
dits

TAX FOUNDATION
39
IND
IVID
UA
L INCO
ME TA
X
The earned income tax credit (EITC) is a targeted subsidy for low-income working families. Currently, the EITC is distributed without regard to regional differences in prices and purchasing power. In some cases, however, regional price differences are strikingly large and can have a serious effect on the real value of social welfare pro-grams such as the EITC. For example, an EITC of $1,000 in a high-price state such as Connecticut is worth only $922 after adjusting for regional prices. On the other hand, using the same adjustment, a $1,000 EITC in Kansas would be worth 19 percent more, or $1,101.
This option would index the earned income tax credit to local price indices to take into account regional purchasing power. Taxpayers from states with higher than average price levels, compared to the nation at large, would a get higher EITC than current law allows, and taxpayers from states with lower than average price levels would get a lower ETIC.
This option would raise federal revenue by $9 billion over the next 10 years, on a static basis. This option would only slightly change the amount of the refundable portion of EITC across states, without significantly impacting marginal rates for individual taxpayers. These small changes to marginal rates cancel each other out, resulting in no measurable change in GDP growth. As a result of this option, low-in-come taxpayers would see a slight net decrease in after-tax income.
Income Group Static % Change in After-Tax Income Dynamic % Change in After-Tax Income
0% to 20% -0.2% -0.2%20% to 40% -0.1% -0.1%40% to 60% 0.0% 0.0%60% to 80% 0.0% 0.0%
80% to 100% 0.0% 0.0%90% to 100% 0.0% 0.0%99% to 100% 0.0% 0.0%
TOTAL 0.0% 0.0%
Economic Effects: Budgetary Effects:Long-Run Change in GDP: 0.0% Static 10-Year Revenue: $9B
Full-Time Equivalent Jobs: 0 Dynamic 10-Year Revenue: $9B
25. Index the earned income tax credit to local price indices
Credits
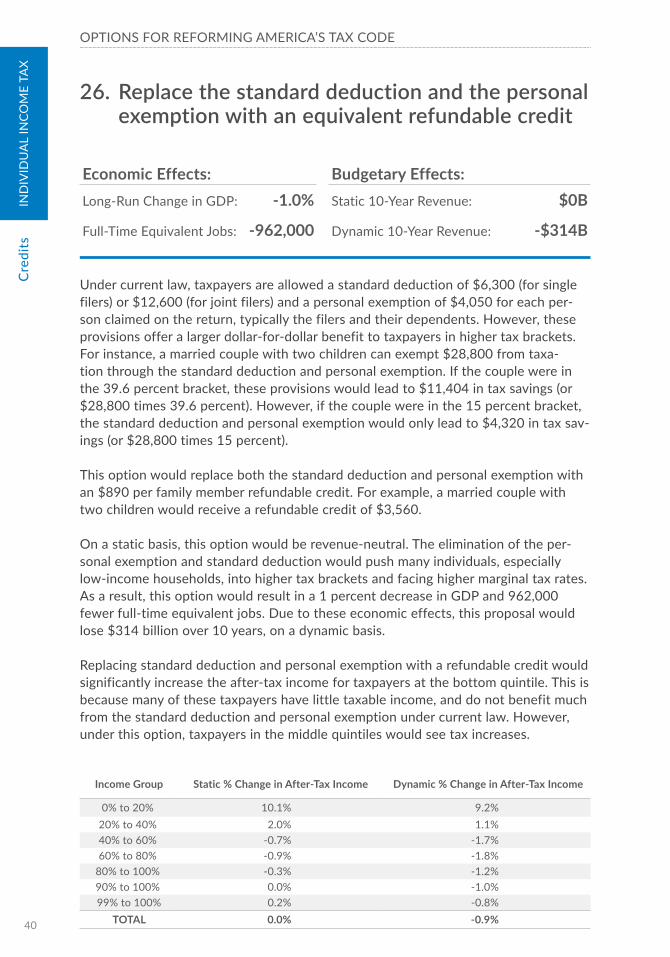
OPTIONS FOR REFORMING AMERICA’S TAX CODEIN
DIV
IDU
AL
INCO
ME
TAX
40
Under current law, taxpayers are allowed a standard deduction of $6,300 (for single filers) or $12,600 (for joint filers) and a personal exemption of $4,050 for each per-son claimed on the return, typically the filers and their dependents. However, these provisions offer a larger dollar-for-dollar benefit to taxpayers in higher tax brackets. For instance, a married couple with two children can exempt $28,800 from taxa-tion through the standard deduction and personal exemption. If the couple were in the 39.6 percent bracket, these provisions would lead to $11,404 in tax savings (or $28,800 times 39.6 percent). However, if the couple were in the 15 percent bracket, the standard deduction and personal exemption would only lead to $4,320 in tax sav-ings (or $28,800 times 15 percent).
This option would replace both the standard deduction and personal exemption with an $890 per family member refundable credit. For example, a married couple with two children would receive a refundable credit of $3,560.
On a static basis, this option would be revenue-neutral. The elimination of the per-sonal exemption and standard deduction would push many individuals, especially low-income households, into higher tax brackets and facing higher marginal tax rates. As a result, this option would result in a 1 percent decrease in GDP and 962,000 fewer full-time equivalent jobs. Due to these economic effects, this proposal would lose $314 billion over 10 years, on a dynamic basis.
Replacing standard deduction and personal exemption with a refundable credit would significantly increase the after-tax income for taxpayers at the bottom quintile. This is because many of these taxpayers have little taxable income, and do not benefit much from the standard deduction and personal exemption under current law. However, under this option, taxpayers in the middle quintiles would see tax increases.
Economic Effects: Budgetary Effects:Long-Run Change in GDP: -1.0% Static 10-Year Revenue: $0B
Full-Time Equivalent Jobs: -962,000 Dynamic 10-Year Revenue: -$314B
26. Replace the standard deduction and the personal exemption with an equivalent refundable credit
Income Group Static % Change in After-Tax Income Dynamic % Change in After-Tax Income
0% to 20% 10.1% 9.2%20% to 40% 2.0% 1.1%40% to 60% -0.7% -1.7%60% to 80% -0.9% -1.8%
80% to 100% -0.3% -1.2%90% to 100% 0.0% -1.0%99% to 100% 0.2% -0.8%
TOTAL 0.0% -0.9%
Cre
dits

TAX FOUNDATION
41
IND
IVID
UA
L INCO
ME TA
X
Two federal tax credits, the American Opportunity Tax Credit (AOTC) and the Life-time Learning Credit (LLC), provide federal assistance to middle-income families and students who pay for postsecondary education. The AOTC was enacted in 2009 and provides a credit of up to $2,500 per student for the first $4,000 of education expen-ditures ($1,000 of which is refundable). The LLC provides an income tax credit of up to $2,000 per taxpayer for the first $10,000 of expenditures on undergraduate, grad-uate, or professional degree courses (none of which is refundable). Both tax credits phase out for upper-middle income taxpayers.
This option would eliminate both the AOTC and LLC. The option would increase federal revenue by $245 billion over the next 10 years, on a static basis. Eliminat-ing education tax credits would not have a significant impact on taxpayers’ marginal tax rates. As such, this option would have little impact on incentives to work and the long-run size of the economy. However, to the extent that postsecondary edu-cation increases human capital, these provisions may have an economic impact not accounted in the figures above.
Since the AOTC is refundable, its repeal would have a large impact on taxpayers at the bottom of the income distribution. Taxpayers in the bottom quintile would see a 0.8 percent reduction in their after-tax income as a result of this option, while taxpay-ers in the top quintile would see their incomes reduced by 0.2 percent.
Income Group Static % Change in After-Tax Income Dynamic % Change in After-Tax Income
0% to 20% -0.8% -0.8%20% to 40% -0.7% -0.7%40% to 60% -0.5% -0.5%60% to 80% -0.3% -0.3%
80% to 100% -0.2% -0.2%90% to 100% 0.0% 0.0%99% to 100% 0.0% 0.0%
TOTAL -0.2% -0.2%
Economic Effects: Budgetary Effects:Long-Run Change in GDP: 0.0% Static 10-Year Revenue: $245B
Full-Time Equivalent Jobs: 0 Dynamic 10-Year Revenue: $245B
27. Eliminate tax credits for higher education
Credits

OPTIONS FOR REFORMING AMERICA’S TAX CODEIN
DIV
IDU
AL
INCO
ME
TAX
42
Individual Income Tax – Deductions and Exclusions
Deductions are provisions that reduce a taxpayer’s taxable income. The current tax code offers two ways for taxpayers to take deductions. Some taxpayers opt to take the standard deduction, a single deduction at a fixed amount ($6,300 for single filers, $12,600 for married filers). Other taxpayers choose to itemize deductions, listing their deductible expenditures on Schedule A.
The largest itemized deductions are for state and local taxes paid, mortgage interest paid, and charitable contributions. Itemizing deductions is popular among high-er-income taxpayers, because these households often have significant deductible expenses in these categories. In contrast, for lower-income taxpayers, the standard deduction is often the more appealing option, because these households have fewer expenses that can be deducted.
Deductions are worthy of scrutiny because, collectively, they narrow the U.S. tax base substantially. In addition, deductions of any size are more valuable to taxpayers fac-ing higher marginal rates, because they reduce taxable income; a taxpayer in the top bracket saves 39.6 cents for every dollar of deduction taken, while a taxpayer in the 25 percent bracket saves only 25 cents for each dollar of deductions.
In addition to deductions, the individual income tax code contains several large exclu-sions. An exclusion refers to any income that taxpayers are not required to report or pay taxes on. The biggest exclusion in the income tax code is the exclusion of employer-provided health insurance, which makes up a significant share of labor com-pensation but is not taxed.
Ded
uctio
ns a
nd E
xclu
sion
s

TAX FOUNDATION
43
IND
IVID
UA
L INCO
ME TA
X
The standard deduction was introduced in 1944 as an alternative to itemized deduc-tions. It was enacted to make filling out a tax return simpler for taxpayers and to simplify the audit process for tax collection authorities. Under current law, the stan-dard deduction is $6,300 for individuals, $12,600 for married couples filing jointly, and $9,300 for heads of household. Today, about two-thirds of all taxpayers claim the standard deduction instead of itemized deductions. This option would double the standard deduction amounts for all filing statuses.
This option would reduce federal revenue by $1.3 trillion over the next decade, on a static basis. Because this option would bump some taxpayers into lower brackets, it would decrease marginal tax rates on labor and business income. As a result, this option would have a small, but meaningful, positive impact on the economy, increas-ing the long-run size of GDP by 0.5 percent and creating 463,000 more full-time equivalent jobs. This would lead to a revenue loss of $1.2 trillion, on a dynamic basis, over the next decade.
On a static basis, taxpayers in the 40 to 60 percent income group would experience the largest increase in their after-tax income, of 2.4 percent. Taxpayers in the bot-tom quintile would see a smaller increase because many of those taxpayers have little taxable income left to deduct. Taxpayers in the top quintile would only see their after-tax income increase by 0.47 percent, because the expanded standard deduction would still be relatively small compared to their income levels, and many would con-tinue to itemize.
Income Group Static % Change in After-Tax Income Dynamic % Change in After-Tax Income
0% to 20% 0.15% 0.57%20% to 40% 1.44% 1.88%40% to 60% 2.40% 2.86%60% to 80% 1.59% 2.02%
80% to 100% 0.47% 0.90%90% to 100% 0.24% 0.68%99% to 100% 0.04% 0.50%
TOTAL 1.01% 1.45%
Economic Effects: Budgetary Effects:Long-Run Change in GDP: 0.5% Static 10-Year Revenue: -$1,306B
Full-Time Equivalent Jobs: 463,000 Dynamic 10-Year Revenue: -$1,169B
28. Double the standard deduction
Filing Status Current Law Deduction Amount OptionSingle $6,300 $12,600
Married Filing Jointly $12,600 $25,200
Head of Household $9,300 $18,600
Deductions and Exclusions

OPTIONS FOR REFORMING AMERICA’S TAX CODEIN
DIV
IDU
AL
INCO
ME
TAX
44
A personal exemption has been allowed against the federal income tax since 1913. Originally, the personal exemption amount was high relative to prevailing income levels and served to exclude the majority of the population from income tax liability. This changed in the 1940s, when Congress lowered the personal exemption amount sizably.
Under current law, the personal exemption is $4,050 per household member. Spe-cifically, taxpayers can claim a personal exemption for themselves and each of their qualifying dependents. As such, larger households see a greater benefit from the per-sonal exemption.
Increasing the personal exemption to $5,000 would reduce federal revenue by $828 billion over the next decade, on a static basis. Because this option would move some households into lower tax brackets, it would reduce marginal tax rates and increase GDP by 0.3 percent in the long run.
On a static basis, this option would have a small positive effect on all taxpayers’ after-tax incomes except for those at the very top. The middle-income groups would experience the strongest positive effects of the change, with their after-tax incomes going up by 0.7 to 1.1 percent on a static basis. Taxpayers in the top 1 percent would not benefit from this option because the benefit of the personal exemption phase-sout for taxpayers with income above $259,400 ($311,300 for married joint filers). On a dynamic basis, all income groups would benefit, due to the larger economy.
Economic Effects: Budgetary Effects:Long-Run Change in GDP: 0.3% Static 10-Year Revenue: -$828B
Full-Time Equivalent Jobs: 271,000 Dynamic 10-Year Revenue: -$749B
29. Increase the personal exemption to $5,000
Income Group Static % Change in After-Tax Income Dynamic % Change in After-Tax Income
0% to 20% 0.00% 0.24%20% to 40% 0.71% 0.95%40% to 60% 1.14% 1.40%60% to 80% 0.95% 1.21%
80% to 100% 0.44% 0.68%90% to 100% 0.26% 0.52%99% to 100% 0.00% 0.27%
TOTAL 0.64% 0.89%
Ded
uctio
ns a
nd E
xclu
sion
s

TAX FOUNDATION
45
IND
IVID
UA
L INCO
ME TA
X
The mortgage interest deduction is an itemized deduction for interest paid on home mortgages. It is one of the best-known tax deductions and one of the largest ones. Like any deduction, it reduces households’ taxable incomes and, consequently, their total taxes paid.
The mortgage interest deduction is frequently considered for elimination by tax reformers. Eliminating it would increase federal revenue, raising $1.7 trillion on a static basis over the next decade.
Repealing the mortgage interest deduction would have two modest, but not trivial, effects on GDP. First, eliminating the deduction would raise taxes on a specific type of capital: debt-financed, owner-occupied housing. Raising taxes on capital is ordi-narily quite harmful to economic growth, and this option would place a double tax on some interest payments. On the other hand, debt-financed owner-occupied housing is currently treated much more favorably than other kinds of capital. Repealing the mortgage interest deduction would reduce some of that differential. Second, repeal-ing the deduction would also raise taxes indirectly on labor, by raising households’ taxable incomes and pushing them into higher tax brackets. On net, the behavioral responses from these two changes would result in a reduction in the long-term level of GDP of 0.3 percent. Due to the slightly smaller economy, this option would raise slightly less on a dynamic basis over the next decade: $1.6 trillion.
This change would come at virtually no personal cost to lower-income Americans, most of whom do not itemize deductions. On a static basis, eliminating the mortgage interest deduction would have no effect on the lowest quintile and only a 0.1 percent effect on the after-tax incomes of those in the second-lowest quintile. This is because taxpayers in those two quintiles tend to take the standard deduction rather than itemizing.
Income Group Static % Change in After-Tax Income Dynamic % Change in After-Tax Income
0% to 20% 0.0% -0.3%20% to 40% -0.1% -0.4%40% to 60% -0.6% -0.9%60% to 80% -1.1% -1.4%
80% to 100% -1.8% -2.1%90% to 100% -1.8% -2.1%99% to 100% -1.2% -1.5%
TOTAL -1.3% -1.6%
Economic Effects: Budgetary Effects:Long-Run Change in GDP: -0.3% Static 10-Year Revenue: $1,713B
Full-Time Equivalent Jobs: -313,000 Dynamic 10-Year Revenue: $1,606B
30. Eliminate the home mortgage interest deduction
Deductions and Exclusions

OPTIONS FOR REFORMING AMERICA’S TAX CODEIN
DIV
IDU
AL
INCO
ME
TAX
46
The mortgage interest deduction is one of the largest tax deductions. It allows hou-seholds to deduct interest paid on their home mortgages from their taxable incomes, which reduces their total tax bill.
The mortgage interest deduction mainly benefits high-income taxpayers. Under cur-rent law, it can be taken on interest paid on up to $1 million worth of principal of home mortgage debt. This effectively creates a maximum value on the amount of mortgage interest that a taxpayer can legally deduct. One way to increase revenue, then, would be to lower this cap toward a value closer to that of the average mid-dle-class home. This option would reduce this cap to $500,000 of home mortgage debt.
This option would raise $325 billion over 10 years, on a static basis, and $308 bil-lion over 10 years, on a dynamic basis. Implementing this provision would slightly reduce GDP. First, it would raise taxes on a narrow category of capital accumulation, and would result in the double taxation of some interest, but it would not materially affect the vast majority of U.S. capital formation. Second, it would also raise taxes indirectly on labor, by raising people’s taxable incomes and pushing them into higher tax brackets. On net, these two behavioral responses would result in a reduction in the long-term level of GDP of 0.1 percent.
Under this provision, most of the deduction’s value would be preserved for most taxpayers, and most households’ tax situation would be unchanged. Almost all of the additional revenue would come from taxpayers in the top two income quintiles.
Economic Effects: Budgetary Effects:Long-Run Change in GDP: -0.1% Static 10-Year Revenue: $325B
Full-Time Equivalent Jobs: -41,000 Dynamic 10-Year Revenue: $308B
31. Cap the home mortgage interest deduction on debt above $500,000
Income Group Static % Change in After-Tax Income Dynamic % Change in After-Tax Income
0% to 20% 0.0% -0.1%20% to 40% 0.0% -0.1%40% to 60% 0.0% -0.1%60% to 80% -0.1% -0.1%
80% to 100% -0.4% -0.5%90% to 100% -0.5% -0.6%99% to 100% -0.6% -0.7%
TOTAL -0.3% -0.3%
Ded
uctio
ns a
nd E
xclu
sion
s

TAX FOUNDATION
47
IND
IVID
UA
L INCO
ME TA
X
The mortgage interest deduction allows households to reduce their taxable income – and, consequently, their taxes paid – by deducting interest paid on home mortgages. The mortgage interest deduction disproportionately benefits high-income taxpayers, in part because deductions are worth more for taxpayers in higher tax brackets. For example, a household in the 25 percent bracket sees 25 cents in tax savings for every dollar of mortgage interest it deducts. A taxpayer in the 33 percent bracket, though, reduces its tax liability by 33 cents for each dollar of deduction taken.
One way to equalize the benefits of the mortgage interest deduction would be to turn it into a credit. A credit for 15 percent of the value of interest paid would be effectively equivalent to a deduction taken against the 15 percent tax bracket. In addition, under this option, households that take the standard deduction would still be able to claim the credit.
Converting the mortgage interest deduction to a 15 percent credit would raise $249 billion over 10 years, on a static basis, and $146 billion over 10 years on a dynamic basis. Implementing this provision would reduce the size of the economy, because it would raise taxes on some housing capital and push some households into higher tax brackets. This would result in a reduction of 0.3 percent in the long-term level of GDP.
As a result of this option, low- and middle-income taxpayers would pay lower taxes, while high-income taxpayers would pay higher taxes. For example, the middle quintile would see their after-tax incomes increase by 0.6 percent on a static basis, because the mortgage interest credit would allow them to preserve a tax benefit for their mortgage interest while at the same time taking the standard deduction.
Income Group Static % Change in After-Tax Income Dynamic % Change in After-Tax Income
0% to 20% 0.0% -0.3%20% to 40% 0.2% -0.1%40% to 60% 0.6% 0.2%60% to 80% 0.4% 0.1%
80% to 100% -0.6% -1.0%90% to 100% -0.8% -1.1%99% to 100% -0.6% -0.9%
TOTAL -0.2% -0.5%
Economic Effects: Budgetary Effects:Long-Run Change in GDP: -0.3% Static 10-Year Revenue: $249B
Full-Time Equivalent Jobs: -313,000 Dynamic 10-Year Revenue: $146B
32. Replace the mortgage interest deduction with a 15% mortgage interest credit
Deductions and Exclusions

OPTIONS FOR REFORMING AMERICA’S TAX CODEIN
DIV
IDU
AL
INCO
ME
TAX
48
The charitable contributions deduction is an itemized deduction for donations to cer-tain nonprofit enterprises. It is one of the best-known tax deductions, and one of the largest ones. Like any deduction, it reduces households’ taxable incomes, and conse-quently, their total taxes paid.
Eliminating this deduction would raise taxable incomes and increase federal revenues, raising $692 billion over 10 years, on a static basis, and $665 billion on a dynamic basis. The provision would reduce GDP by 0.1 percent, by pushing some taxpayers into higher tax brackets by increasing their taxable incomes. The chief question about such a policy change would be the extent to which it would reduce donations to nonprofit enterprises as taxpayers shift their spending into other priorities. Nonprofit enterprises include universities, hospitals, places of worship, charities, and some political organizations.
Most of the revenues from this option would come from the highest income quintiles. While people in lower income quintiles also donate to nonprofit enterprises, they are less likely to itemize on their tax returns, and thus less likely to take an itemized deduction for their charitable donations. Under this option, the lowest four income quintiles would see tax increases of no more than 0.3 percent, while the highest quin-tile would see a tax increase of 0.8 percent.
Economic Effects: Budgetary Effects:Long-Run Change in GDP: -0.1% Static 10-Year Revenue: $692B
Full-Time Equivalent Jobs: -79,000 Dynamic 10-Year Revenue: $665B
33. Eliminate the charitable contributions deduction
Income Group Static % Change in After-Tax Income Dynamic % Change in After-Tax Income
0% to 20% 0.0% -0.1%20% to 40% 0.0% -0.1%40% to 60% -0.1% -0.2%60% to 80% -0.3% -0.4%
80% to 100% -0.8% -0.9%90% to 100% -0.9% -1.0%99% to 100% -1.3% -1.4%
TOTAL -0.5% -0.6%
Ded
uctio
ns a
nd E
xclu
sion
s
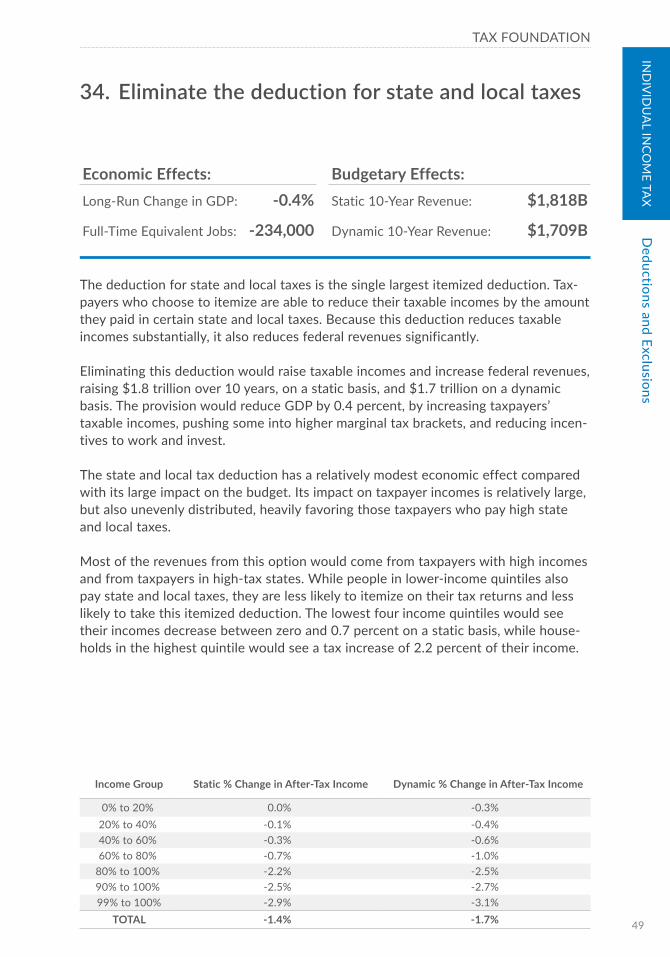
TAX FOUNDATION
49
IND
IVID
UA
L INCO
ME TA
X
The deduction for state and local taxes is the single largest itemized deduction. Tax-payers who choose to itemize are able to reduce their taxable incomes by the amount they paid in certain state and local taxes. Because this deduction reduces taxable incomes substantially, it also reduces federal revenues significantly.
Eliminating this deduction would raise taxable incomes and increase federal revenues, raising $1.8 trillion over 10 years, on a static basis, and $1.7 trillion on a dynamic basis. The provision would reduce GDP by 0.4 percent, by increasing taxpayers’ taxable incomes, pushing some into higher marginal tax brackets, and reducing incen-tives to work and invest.
The state and local tax deduction has a relatively modest economic effect compared with its large impact on the budget. Its impact on taxpayer incomes is relatively large, but also unevenly distributed, heavily favoring those taxpayers who pay high state and local taxes.
Most of the revenues from this option would come from taxpayers with high incomes and from taxpayers in high-tax states. While people in lower-income quintiles also pay state and local taxes, they are less likely to itemize on their tax returns and less likely to take this itemized deduction. The lowest four income quintiles would see their incomes decrease between zero and 0.7 percent on a static basis, while house-holds in the highest quintile would see a tax increase of 2.2 percent of their income.
Income Group Static % Change in After-Tax Income Dynamic % Change in After-Tax Income
0% to 20% 0.0% -0.3%20% to 40% -0.1% -0.4%40% to 60% -0.3% -0.6%60% to 80% -0.7% -1.0%
80% to 100% -2.2% -2.5%90% to 100% -2.5% -2.7%99% to 100% -2.9% -3.1%
TOTAL -1.4% -1.7%
Economic Effects: Budgetary Effects:Long-Run Change in GDP: -0.4% Static 10-Year Revenue: $1,818B
Full-Time Equivalent Jobs: -234,000 Dynamic 10-Year Revenue: $1,709B
34. Eliminate the deduction for state and local taxes
Deductions and Exclusions

OPTIONS FOR REFORMING AMERICA’S TAX CODEIN
DIV
IDU
AL
INCO
ME
TAX
50
Itemized deductions are expenses that taxpayers can claim on Schedule A to reduce their taxable income. Itemized deductions can be taken for a variety of expenses: any-thing from casualty and theft losses to tax preparation fees. Lawmakers who want to broaden the tax base may consider eliminating a wide range of itemized deductions, but may find it politically difficult to eliminate some. For example, the charitable con-tributions and the deduction for mortgage interest are among the two most popular provisions in the tax code.
A plan that left the charitable and mortgage interest deductions in place, but elim-inated all other itemized deductions, would raise substantial revenue by increasing taxpayers’ taxable incomes. These increased revenues would total $2.4 trillion over 10 years, on a static basis, and $2.3 trillion on a dynamic basis. About three-quar-ters of the increased revenues from this option would come from the elimination of a single itemized deduction, for state and local taxes. However, the other item-ized deductions still account for hundreds of billions of dollars in revenue over 10 years. The provision would also reduce GDP by 0.4 percent, by increasing taxpay-ers’ incomes and pushing some into higher marginal tax brackets, reducing their incentives to work and invest. On a dynamic basis, this GDP loss would result in a reduction in after-tax incomes for all taxpayers.
Most of the revenue from this option would come from taxpayers with high incomes, because those taxpayers are most likely to itemize on their tax returns. Lower-income taxpayers often opt for the standard deduction instead. Under this option, the lowest four income quintiles would see tax increases between zero and 1.0 percent of their income, on a static basis, while the highest quintile would see a tax increase of 2.7 percent.
Economic Effects: Budgetary Effects:Long-Run Change in GDP: -0.4% Static 10-Year Revenue: $2,376B
Full-Time Equivalent Jobs: -290,000 Dynamic 10-Year Revenue: $2,268B
35. Eliminate all itemized deductions except the charitable and mortgage interest deductions
Income Group Static % Change in After-Tax Income Dynamic % Change in After-Tax Income
0% to 20% 0.0% -0.3%20% to 40% -0.1% -0.4%40% to 60% -0.5% -0.9%60% to 80% -1.0% -1.3%
80% to 100% -2.7% -3.0%90% to 100% -3.1% -3.4%99% to 100% -3.6% -3.9%
TOTAL -1.8% -2.1%
Ded
uctio
ns a
nd E
xclu
sion
s

TAX FOUNDATION
51
IND
IVID
UA
L INCO
ME TA
X
Tax deductions reduce households’ taxable incomes. Accordingly, the tax saving that a deduction generates depends on the rate at which a household is taxed. For example, if a household is in the 10 percent bracket, a deduction that lowers the household’s taxable income by a dollar produces a 10 cent tax saving. If the household is in the 39.6 percent tax bracket, the same deduction produces a 39.6-cent tax saving.
This option would limit the tax savings from itemized deductions to no more than 28 percent. For instance, under this proposal, if a person in the 39.6 percent tax bracket earns one additional dollar of income and claims one additional dollar in itemized deductions, that person’s tax bill would increase by 11.6 cents, although the person’s taxable income would not change.
This option would increase federal revenue by $301 billion over 10 years, on a static basis. However, the limitation would subject some households to higher marginal tax rates and would reduce their willingness to work and invest. As a result, GDP would decline by 0.3 percent and employment would fall by 152,000 full-time equivalent jobs. Because of those negative effects, the dynamic 10-year revenue estimate of $217 billion is nearly one-third lower than the static estimate.
Under a static distributional analysis, the 28 percent limitation would only impact those in the top three tax brackets, reducing after-tax incomes an average of 0.4 per-cent for the top fifth of tax filers and 1.3 percent for the top 1 percent. On a dynamic basis, after-tax incomes would decrease by at least 0.3 percent for all income groups.
Income Group Static % Change in After-Tax Income Dynamic % Change in After-Tax Income
0% to 20% 0.0% -0.3%20% to 40% 0.0% -0.3%40% to 60% 0.0% -0.3%60% to 80% 0.0% -0.3%
80% to 100% -0.4% -0.7%90% to 100% -0.6% -0.8%99% to 100% -1.3% -1.6%
TOTAL -0.2% -0.5%
Economic Effects: Budgetary Effects:Long-Run Change in GDP: -0.3% Static 10-Year Revenue: $301B
Full-Time Equivalent Jobs: -152,000 Dynamic 10-Year Revenue: $217B
36. Limit tax savings from itemized deductions to 28% of value
Deductions and Exclusions

OPTIONS FOR REFORMING AMERICA’S TAX CODEIN
DIV
IDU
AL
INCO
ME
TAX
52
The Pease limitation on itemized deductions, named after the late U.S. Congressman Donald Pease, reduces the value of a taxpayer’s itemized deductions by 3 percent of every dollar of taxable income above a certain threshold ($259,400 for single tax-payers and $311,300 for married filers in 2016.) While this provision is often called a limitation on itemized deductions, it really resembles a surtax on income generally, due to its structure. The Pease limitation is triggered by households’ income, rather than by the amount of itemized deductions they claim. It is therefore, in truth, equiv-alent to an income tax.
Repealing the Pease limitation would reduce federal revenue by $265 billion over 10 years, on a static basis. As with most income tax reductions, eliminating the Pease limitation would increase incentives to work, save, and invest. These incentives would result in a 0.3 percent higher GDP over the long run, which would lessen the revenue impact: on a dynamic basis, eliminating the provision would only reduce revenues by $170 billion over 10 years.
For many high-income taxpayers, the Pease limitation is equivalent to a marginal tax increase of 1.188 percent, or 3 percent of the 39.6 percent top marginal rate. For taxpayers in the top income percentile, repealing the Pease limitation would increase their after-tax income by about this percentage. However, repealing the Pease limita-tion would not affect most other taxpayers at all.
Economic Effects: Budgetary Effects:Long-Run Change in GDP: 0.3% Static 10-Year Revenue: -$265B
Full-Time Equivalent Jobs: 187,000 Dynamic 10-Year Revenue: -$170B
37. Eliminate the Pease limitation on itemized deductions
Income Group Static % Change in After-Tax Income Dynamic % Change in After-Tax Income
0% to 20% 0.0% 0.3%20% to 40% 0.0% 0.3%40% to 60% 0.0% 0.3%60% to 80% 0.0% 0.3%
80% to 100% 0.4% 0.7%90% to 100% 0.5% 0.8%99% to 100% 1.1% 1.5%
TOTAL 0.2% 0.5%
Ded
uctio
ns a
nd E
xclu
sion
s
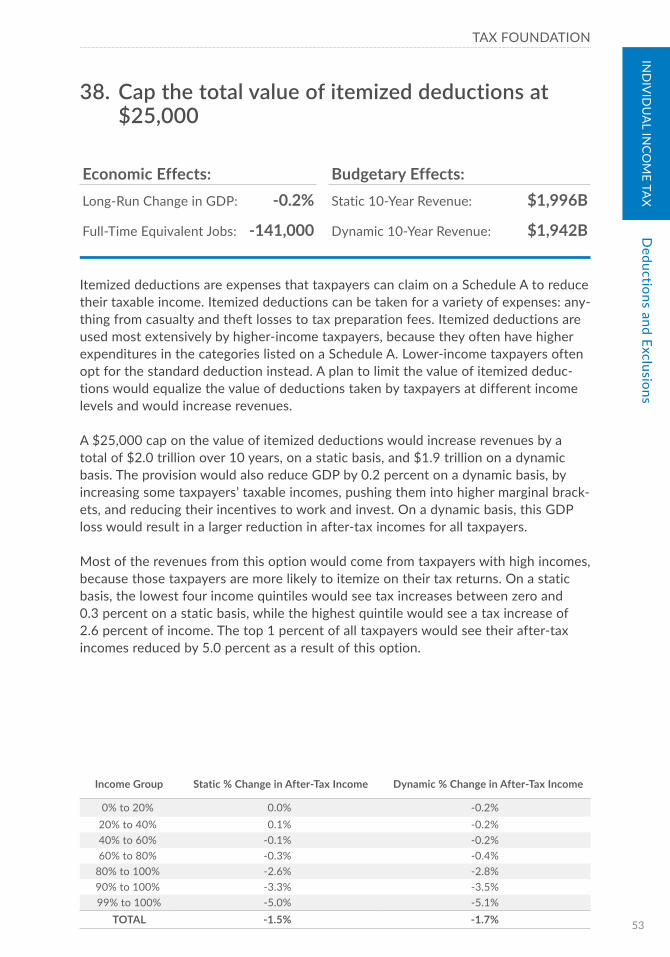
TAX FOUNDATION
53
IND
IVID
UA
L INCO
ME TA
X
Itemized deductions are expenses that taxpayers can claim on a Schedule A to reduce their taxable income. Itemized deductions can be taken for a variety of expenses: any-thing from casualty and theft losses to tax preparation fees. Itemized deductions are used most extensively by higher-income taxpayers, because they often have higher expenditures in the categories listed on a Schedule A. Lower-income taxpayers often opt for the standard deduction instead. A plan to limit the value of itemized deduc-tions would equalize the value of deductions taken by taxpayers at different income levels and would increase revenues.
A $25,000 cap on the value of itemized deductions would increase revenues by a total of $2.0 trillion over 10 years, on a static basis, and $1.9 trillion on a dynamic basis. The provision would also reduce GDP by 0.2 percent on a dynamic basis, by increasing some taxpayers’ taxable incomes, pushing them into higher marginal brack-ets, and reducing their incentives to work and invest. On a dynamic basis, this GDP loss would result in a larger reduction in after-tax incomes for all taxpayers.
Most of the revenues from this option would come from taxpayers with high incomes, because those taxpayers are more likely to itemize on their tax returns. On a static basis, the lowest four income quintiles would see tax increases between zero and 0.3 percent on a static basis, while the highest quintile would see a tax increase of 2.6 percent of income. The top 1 percent of all taxpayers would see their after-tax incomes reduced by 5.0 percent as a result of this option.
Income Group Static % Change in After-Tax Income Dynamic % Change in After-Tax Income
0% to 20% 0.0% -0.2%20% to 40% 0.1% -0.2%40% to 60% -0.1% -0.2%60% to 80% -0.3% -0.4%
80% to 100% -2.6% -2.8%90% to 100% -3.3% -3.5%99% to 100% -5.0% -5.1%
TOTAL -1.5% -1.7%
Economic Effects: Budgetary Effects:Long-Run Change in GDP: -0.2% Static 10-Year Revenue: $1,996B
Full-Time Equivalent Jobs: -141,000 Dynamic 10-Year Revenue: $1,942B
38. Cap the total value of itemized deductions at $25,000
Deductions and Exclusions

OPTIONS FOR REFORMING AMERICA’S TAX CODEIN
DIV
IDU
AL
INCO
ME
TAX
54
The exemption for municipal bond interest has been a feature of the individual income tax since its inception in 1913. However, there are two limited cases in which municipal bond interest is taxable: under the alternative minimum tax, and for certain individuals with taxable Social Security benefits.
The exemption for municipal bond interest provides a small tax benefit to some people in high tax brackets and to some corporations. However, most of the tax advantage to lenders is offset, because municipal bonds typically pay less interest than taxable bonds. As a result, municipal and taxable bonds usually have similar after-tax returns at the margin. The issuers of municipal bonds, who are primarily state and local governments (but also certain nonprofits), capture the majority of the tax benefit in the form of lower borrowing costs. This is an indirect, hidden, but very real tax subsidy to state and local governments.
Eliminating the exemption for municipal bond interest prospectively would lift federal revenue by $263 billion over the budget window, on a static basis. The dynamic rev-enue estimate is slightly less, $241 billion, because taking away the exemption would push some taxpayers into higher brackets, raising their marginal tax rates, and lower-ing GDP by 0.1 percent.
In a static distributional analysis, the loss of the exemption would only affect people with above-average incomes. The after-tax incomes of the bottom fifth of tax filers would be unchanged, while those of the top fifth would decline by 0.6 percent. The dynamic distributional figures below do not account for changes in state and local government taxing and spending that would result from this option.
Economic Effects: Budgetary Effects:Long-Run Change in GDP: -0.1% Static 10-Year Revenue: $263B
Full-Time Equivalent Jobs: -20,000 Dynamic 10-Year Revenue: $241B
39. Eliminate the tax exclusion for municipal bond interest
Income Group Static % Change in After-Tax Income Dynamic % Change in After-Tax Income
0% to 20% 0.0% 0.0%20% to 40% 0.0% -0.1%40% to 60% 0.0% -0.1%60% to 80% -0.1% -0.2%
80% to 100% -0.6% -0.6%90% to 100% -0.7% -0.8%99% to 100% -1.2% -1.2%
TOTAL -0.3% -0.4%
Ded
uctio
ns a
nd E
xclu
sion
s
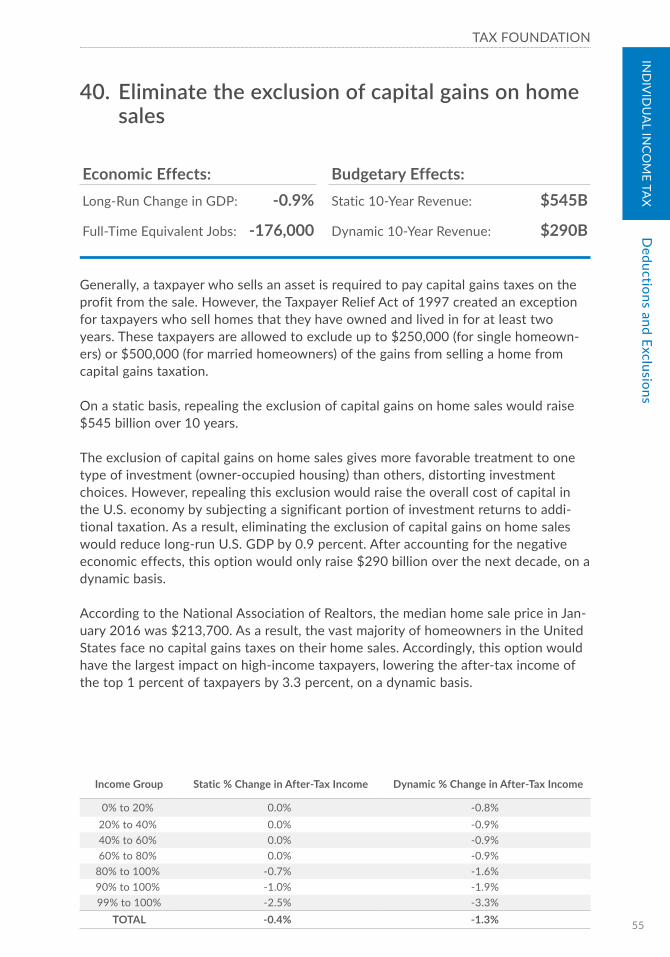
TAX FOUNDATION
55
IND
IVID
UA
L INCO
ME TA
X
Generally, a taxpayer who sells an asset is required to pay capital gains taxes on the profit from the sale. However, the Taxpayer Relief Act of 1997 created an exception for taxpayers who sell homes that they have owned and lived in for at least two years. These taxpayers are allowed to exclude up to $250,000 (for single homeown-ers) or $500,000 (for married homeowners) of the gains from selling a home from capital gains taxation.
On a static basis, repealing the exclusion of capital gains on home sales would raise $545 billion over 10 years.
The exclusion of capital gains on home sales gives more favorable treatment to one type of investment (owner-occupied housing) than others, distorting investment choices. However, repealing this exclusion would raise the overall cost of capital in the U.S. economy by subjecting a significant portion of investment returns to addi-tional taxation. As a result, eliminating the exclusion of capital gains on home sales would reduce long-run U.S. GDP by 0.9 percent. After accounting for the negative economic effects, this option would only raise $290 billion over the next decade, on a dynamic basis.
According to the National Association of Realtors, the median home sale price in Jan-uary 2016 was $213,700. As a result, the vast majority of homeowners in the United States face no capital gains taxes on their home sales. Accordingly, this option would have the largest impact on high-income taxpayers, lowering the after-tax income of the top 1 percent of taxpayers by 3.3 percent, on a dynamic basis.
Economic Effects: Budgetary Effects:Long-Run Change in GDP: -0.9% Static 10-Year Revenue: $545B
Full-Time Equivalent Jobs: -176,000 Dynamic 10-Year Revenue: $290B
40. Eliminate the exclusion of capital gains on home sales
Income Group Static % Change in After-Tax Income Dynamic % Change in After-Tax Income
0% to 20% 0.0% -0.8%20% to 40% 0.0% -0.9%40% to 60% 0.0% -0.9%60% to 80% 0.0% -0.9%
80% to 100% -0.7% -1.6%90% to 100% -1.0% -1.9%99% to 100% -2.5% -3.3%
TOTAL -0.4% -1.3%
Deductions and Exclusions
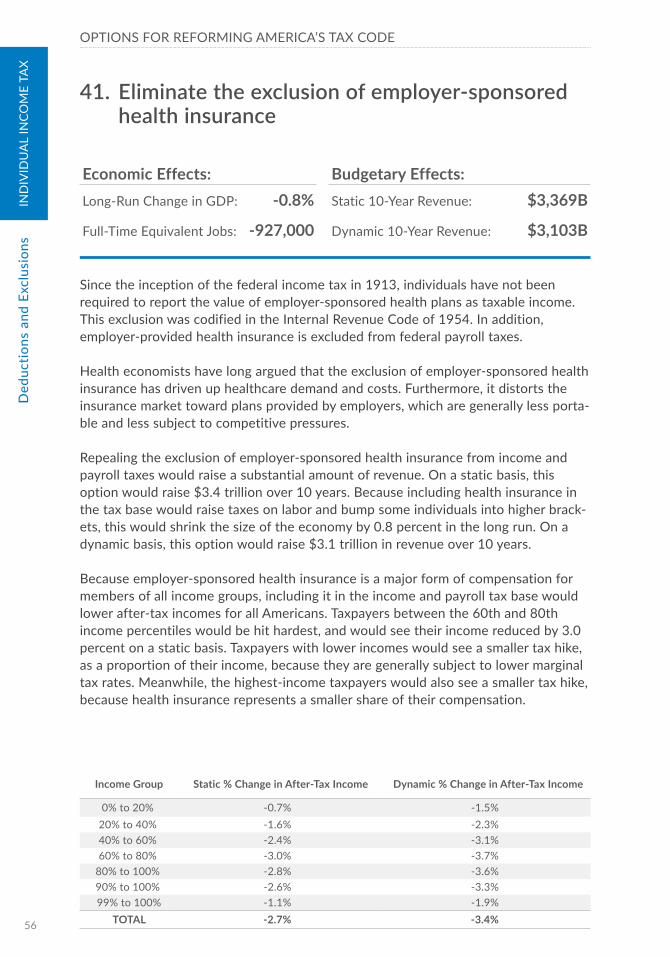
OPTIONS FOR REFORMING AMERICA’S TAX CODEIN
DIV
IDU
AL
INCO
ME
TAX
56
Since the inception of the federal income tax in 1913, individuals have not been required to report the value of employer-sponsored health plans as taxable income. This exclusion was codified in the Internal Revenue Code of 1954. In addition, employer-provided health insurance is excluded from federal payroll taxes.
Health economists have long argued that the exclusion of employer-sponsored health insurance has driven up healthcare demand and costs. Furthermore, it distorts the insurance market toward plans provided by employers, which are generally less porta-ble and less subject to competitive pressures.
Repealing the exclusion of employer-sponsored health insurance from income and payroll taxes would raise a substantial amount of revenue. On a static basis, this option would raise $3.4 trillion over 10 years. Because including health insurance in the tax base would raise taxes on labor and bump some individuals into higher brack-ets, this would shrink the size of the economy by 0.8 percent in the long run. On a dynamic basis, this option would raise $3.1 trillion in revenue over 10 years.
Because employer-sponsored health insurance is a major form of compensation for members of all income groups, including it in the income and payroll tax base would lower after-tax incomes for all Americans. Taxpayers between the 60th and 80th income percentiles would be hit hardest, and would see their income reduced by 3.0 percent on a static basis. Taxpayers with lower incomes would see a smaller tax hike, as a proportion of their income, because they are generally subject to lower marginal tax rates. Meanwhile, the highest-income taxpayers would also see a smaller tax hike, because health insurance represents a smaller share of their compensation.
Income Group Static % Change in After-Tax Income Dynamic % Change in After-Tax Income
0% to 20% -0.7% -1.5%20% to 40% -1.6% -2.3%40% to 60% -2.4% -3.1%60% to 80% -3.0% -3.7%
80% to 100% -2.8% -3.6%90% to 100% -2.6% -3.3%99% to 100% -1.1% -1.9%
TOTAL -2.7% -3.4%
Economic Effects: Budgetary Effects:Long-Run Change in GDP: -0.8% Static 10-Year Revenue: $3,369B
Full-Time Equivalent Jobs: -927,000 Dynamic 10-Year Revenue: $3,103B
41. Eliminate the exclusion of employer-sponsored health insurance
Ded
uctio
ns a
nd E
xclu
sion
s

TAX FOUNDATION
57
IND
IVID
UA
L INCO
ME TA
X
Lawmakers hoping for a comprehensive reform of the individual income tax code may seek to follow the template of “broaden the base, lower the rate”: eliminating deductions, credits, and exclusions in order to pay for a lower individual tax rate. This option would eliminate all itemized deductions except for the charitable and mort-gage interest deductions and lower four the top individual income tax rates to 27 percent. It would also eliminate the individual alternative minimum tax.
This combination of tax changes would be roughly revenue-neutral: over the next decade, it would neither decrease nor increase overall federal revenue collections. While eliminating itemized deductions and the alternative minimum tax would have a slight negative economic effect, this would be outweighed by the positive economic effects of cutting the top individual rate, which would decrease marginal taxes on labor and business income.
This option would result in a 1.0 percent larger economy in the long run. On a dynamic basis, this GDP increase would result in higher after-tax incomes for most taxpayers, and allow $255 billion additional revenue to be collected over the 10-year window.
This combination of tax changes would generally raise taxes on upper-middle-income filers, who are likely to take itemized deductions but would benefit relatively less from the top rate cut. It would reduce taxes for high-income filers. Lower-income taxpayers, who often opt for the standard deduction instead of itemized deductions, would be largely unaffected.
Income Group Static % Change in After-Tax Income Dynamic % Change in After-Tax Income
0% to 20% 0.0% 0.9%20% to 40% -0.1% 0.8%40% to 60% -0.5% 0.4%60% to 80% -1.0% -0.1%
80% to 100% -0.5% 1.4%90% to 100% 1.4% 2.3%99% to 100% 5.6% 6.6%
TOTAL 0.0% 0.9%
Economic Effects: Budgetary Effects:Long-Run Change in GDP: 1.0% Static 10-Year Revenue: -$14B
Full-Time Equivalent Jobs: 496,000 Dynamic 10-Year Revenue: $255B
42. Eliminate all itemized deductions except the charitable and mortgage interest deductions and lower the top individual income tax rate to 27%
Deductions and Exclusions

OPTIONS FOR REFORMING AMERICA’S TAX CODEIN
DIV
IDU
AL
INCO
ME
TAX
58
Lawmakers hoping for a comprehensive reform of the individual income tax code may seek to follow the template of “broaden the base, lower the rate”: eliminating deductions, credits, and exclusions in order to pay for a lower individual tax rate. This option would eliminate all itemized deductions except for the charitable and mort-gage interest deductions and lower each rate by 10 percent. It would also eliminate the individual alternative minimum tax.
This combination of tax changes would be roughly revenue-neutral: over the next decade, it would neither decrease nor increase overall federal revenue collections. While eliminating itemized deductions and the alternative minimum tax would have a slight negative economic effect, this would be outweighed by the positive economic effects of the across-the-board rate cut, which would decrease marginal taxes on labor and business income.
This option would result in a 0.6 percent larger economy in the long run. On a dynamic basis, this GDP increase would result in higher after-tax incomes for most taxpayers, and allow $67 billion additional revenue to be collected over the 10-year window.
This combination of tax changes would lower taxes slightly for all groups of taxpay-ers. On average, the tax cut would only amount to 0.1 percent of after-tax income. On a dynamic basis, however, this option would boost incomes across the board by at least 0.6 percent, due to increased economic growth.
Economic Effects: Budgetary Effects:Long-Run Change in GDP: 0.6% Static 10-Year Revenue: -$117B
Full-Time Equivalent Jobs: 577,000 Dynamic 10-Year Revenue: $67B
43. Eliminate all itemized deductions except the charitable and mortgage interest deductions and lower rates across the board
Income Group Static % Change in After-Tax Income Dynamic % Change in After-Tax Income
0% to 20% 0.0% 0.6%20% to 40% 0.1% 0.6%40% to 60% 0.2% 0.8%60% to 80% 0.1% 0.6%
80% to 100% 0.1% 0.7%90% to 100% 0.2% 0.8%99% to 100% 0.6% 1.2%
TOTAL 0.1% 0.7%
Ded
uctio
ns a
nd E
xclu
sion
s
TAX FOUNDATION
59
IND
IVID
UA
L INCO
ME TA
X
Individual Income Tax – Other
Aside from rates, credits, and deductions, there are a handful of other features of the individual income tax that might plausibly be changed. Among these are the alterna-tive minimum tax, filing statuses, and bracket indexing.
The alternative minimum tax requires certain taxpayers to recalculate their tax lia-bility under a separate, complicated set of rules. Typically, this happens when a taxpayer’s average tax rate under the income tax system is low, due to deductions. In recent years, some policymakers have proposed additional minimum tax measures.
Filing statuses categorize taxpayers according to their family arrangements. Taxpayers in different filing statuses are subject to different brackets and tax rules. There are currently five filing statuses listed on form 1040: single, married filing jointly, married filing separately, head of household, and qualifying widow(er).
Bracket indexing refers to how the federal tax bracket thresholds change over time. Under the current tax code, tax brackets are linked to the consumer price index, a measure of inflation. This feature of the code prevents taxpayers from being pushed into higher tax brackets over time due to inflation.
Other
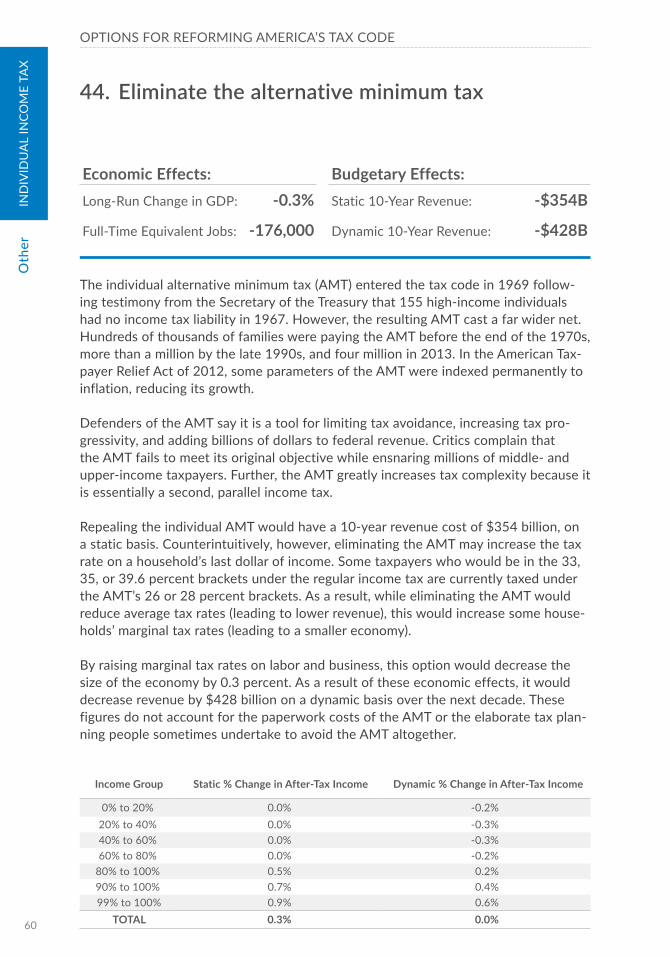
OPTIONS FOR REFORMING AMERICA’S TAX CODEIN
DIV
IDU
AL
INCO
ME
TAX
60
The individual alternative minimum tax (AMT) entered the tax code in 1969 follow-ing testimony from the Secretary of the Treasury that 155 high-income individuals had no income tax liability in 1967. However, the resulting AMT cast a far wider net. Hundreds of thousands of families were paying the AMT before the end of the 1970s, more than a million by the late 1990s, and four million in 2013. In the American Tax-payer Relief Act of 2012, some parameters of the AMT were indexed permanently to inflation, reducing its growth.
Defenders of the AMT say it is a tool for limiting tax avoidance, increasing tax pro-gressivity, and adding billions of dollars to federal revenue. Critics complain that the AMT fails to meet its original objective while ensnaring millions of middle- and upper-income taxpayers. Further, the AMT greatly increases tax complexity because it is essentially a second, parallel income tax.
Repealing the individual AMT would have a 10-year revenue cost of $354 billion, on a static basis. Counterintuitively, however, eliminating the AMT may increase the tax rate on a household’s last dollar of income. Some taxpayers who would be in the 33, 35, or 39.6 percent brackets under the regular income tax are currently taxed under the AMT’s 26 or 28 percent brackets. As a result, while eliminating the AMT would reduce average tax rates (leading to lower revenue), this would increase some house-holds’ marginal tax rates (leading to a smaller economy).
By raising marginal tax rates on labor and business, this option would decrease the size of the economy by 0.3 percent. As a result of these economic effects, it would decrease revenue by $428 billion on a dynamic basis over the next decade. These figures do not account for the paperwork costs of the AMT or the elaborate tax plan-ning people sometimes undertake to avoid the AMT altogether.
Income Group Static % Change in After-Tax Income Dynamic % Change in After-Tax Income
0% to 20% 0.0% -0.2%20% to 40% 0.0% -0.3%40% to 60% 0.0% -0.3%60% to 80% 0.0% -0.2%
80% to 100% 0.5% 0.2%90% to 100% 0.7% 0.4%99% to 100% 0.9% 0.6%
TOTAL 0.3% 0.0%
Economic Effects: Budgetary Effects:Long-Run Change in GDP: -0.3% Static 10-Year Revenue: -$354B
Full-Time Equivalent Jobs: -176,000 Dynamic 10-Year Revenue: -$428B
44. Eliminate the alternative minimum tax
Oth
er

TAX FOUNDATION
61
IND
IVID
UA
L INCO
ME TA
X
This option is often referred to as the Buffett Rule. It is named after billionaire War-ren Buffett, who said in 2011 that he paid a lower tax rate than his secretary. This proposal would, in effect, place a 30 percent minimum tax on top of the current tax system. The 30 percent minimum tax would phase in between $1 million and $2 mil-lion of income, and would apply to long-term capital gains and dividends.
Proponents of the Buffett tax claim that it would increase tax fairness and raise rev-enue. Opponents note that tax rates for individuals like Mr. Buffett may appear low because much of their income consists of long-term capital gains and qualified div-idends, which are subject to a lower individual income tax rate. However, as noted previously, most capital gain and dividend income is already taxed at the corporate level at a 35 percent rate, meaning that high-income individuals face a higher total tax rate than is reflected on their individual returns.
Under a static analysis, the Buffett tax would bolster tax collections by $309 billion during the budget window. However, this option would increase marginal tax rates on capital gains and dividends, leading to less investment (although taxpayers who fell under the Buffett tax would face slightly lower marginal tax rates on their labor income). As a result of these effects, the tax would decrease GDP by 0.4 percent in the long run and cost 71,000 full-time equivalent jobs. On a dynamic basis, this provi-sion would raise only $201 billion over the next decade.
On a static basis, this option would have no effect on the bottom four quintiles but would decrease the after-tax incomes of the top 1 percent by 1.4 percent. Under a dynamic analysis, this option would decrease after-tax incomes by at least 0.4 per-cent for all groups of taxpayers.
Income Group Static % Change in After-Tax Income Dynamic % Change in After-Tax Income
0% to 20% 0.0% -0.4%20% to 40% 0.0% -0.4%40% to 60% 0.0% -0.4%60% to 80% 0.0% -0.4%
80% to 100% -0.4% -0.8%90% to 100% -0.6% -0.9%99% to 100% -1.4% -1.8%
TOTAL -0.2% -0.6%
Economic Effects: Budgetary Effects:Long-Run Change in GDP: -0.4% Static 10-Year Revenue: $309B
Full-Time Equivalent Jobs: -71,000 Dynamic 10-Year Revenue: $201B
45. Enact a 30 percent minimum tax on households with incomes above $1 million
Other

OPTIONS FOR REFORMING AMERICA’S TAX CODEIN
DIV
IDU
AL
INCO
ME
TAX
62
The Omnibus Budget Reconciliation Act of 1990 created the personal exemption phaseout, a provision that reduced the personal exemption for taxpayers whose adjusted gross income exceeds a certain threshold. The phaseout was repealed from 2010 to 2012, but was enacted again in 2013. In 2016, single taxpayers with income above $259,400 and joint taxpayers with income above $311,300 will be subject to the personal exemption phaseout.
Under the personal exemption phaseout, each additional dollar of income leads to a slightly smaller personal exemption. As a result, this tax provision is equivalent to a surtax on upper-middle income households. Repealing it would decrease marginal tax rates on these households, improving incentives to work and invest, and leading to a 0.1 percent larger economy.
This option would reduce federal revenue by $51 billion over 10 years, on a static basis, and $14 billion on a dynamic basis. On a static basis, it would only benefit tax-payers with incomes above $259,400. However, due to the larger economy, its repeal would ultimately increase the after-tax incomes of all groups of taxpayers by at least 0.12 percent.
Economic Effects: Budgetary Effects:Long-Run Change in GDP: 0.1% Static 10-Year Revenue: -$51B
Full-Time Equivalent Jobs: 87,000 Dynamic 10-Year Revenue: -$14B
46. Eliminate the personal exemption phaseout
Income Group Static % Change in After-Tax Income Dynamic % Change in After-Tax Income
0% to 20% 0.00% 0.12%20% to 40% 0.00% 0.14%40% to 60% 0.00% 0.14%60% to 80% 0.00% 0.13%
80% to 100% 0.07% 0.19%90% to 100% 0.10% 0.22%99% to 100% 0.22% 0.35%
TOTAL 0.04% 0.17%
Oth
er
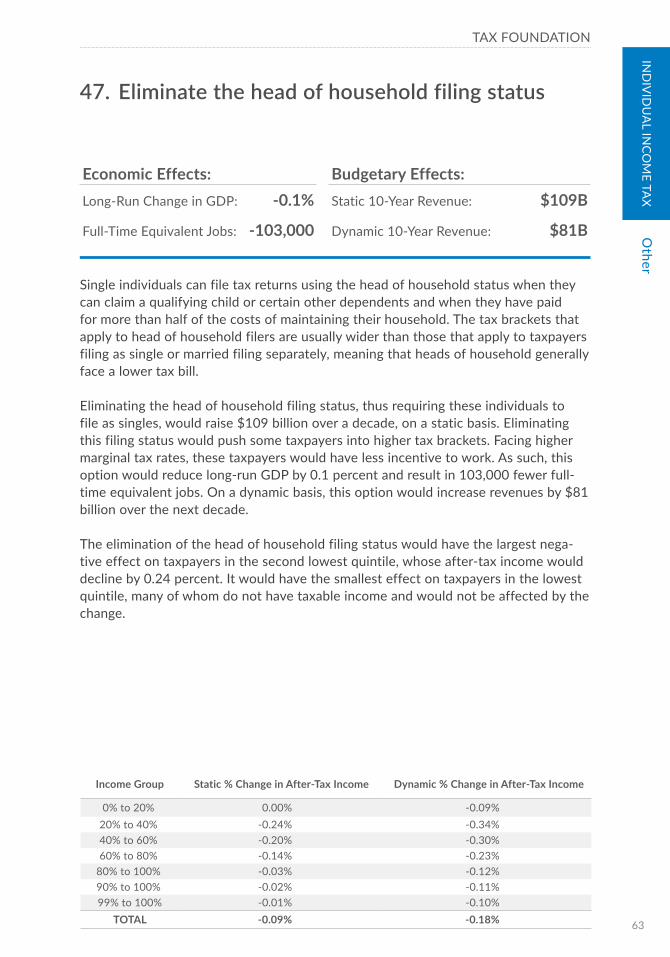
TAX FOUNDATION
63
IND
IVID
UA
L INCO
ME TA
X
Single individuals can file tax returns using the head of household status when they can claim a qualifying child or certain other dependents and when they have paid for more than half of the costs of maintaining their household. The tax brackets that apply to head of household filers are usually wider than those that apply to taxpayers filing as single or married filing separately, meaning that heads of household generally face a lower tax bill.
Eliminating the head of household filing status, thus requiring these individuals to file as singles, would raise $109 billion over a decade, on a static basis. Eliminating this filing status would push some taxpayers into higher tax brackets. Facing higher marginal tax rates, these taxpayers would have less incentive to work. As such, this option would reduce long-run GDP by 0.1 percent and result in 103,000 fewer full-time equivalent jobs. On a dynamic basis, this option would increase revenues by $81 billion over the next decade.
The elimination of the head of household filing status would have the largest nega-tive effect on taxpayers in the second lowest quintile, whose after-tax income would decline by 0.24 percent. It would have the smallest effect on taxpayers in the lowest quintile, many of whom do not have taxable income and would not be affected by the change.
Economic Effects: Budgetary Effects:Long-Run Change in GDP: -0.1% Static 10-Year Revenue: $109B
Full-Time Equivalent Jobs: -103,000 Dynamic 10-Year Revenue: $81B
47. Eliminate the head of household filing status
Income Group Static % Change in After-Tax Income Dynamic % Change in After-Tax Income
0% to 20% 0.00% -0.09%20% to 40% -0.24% -0.34%40% to 60% -0.20% -0.30%60% to 80% -0.14% -0.23%
80% to 100% -0.03% -0.12%90% to 100% -0.02% -0.11%99% to 100% -0.01% -0.10%
TOTAL -0.09% -0.18%
Other
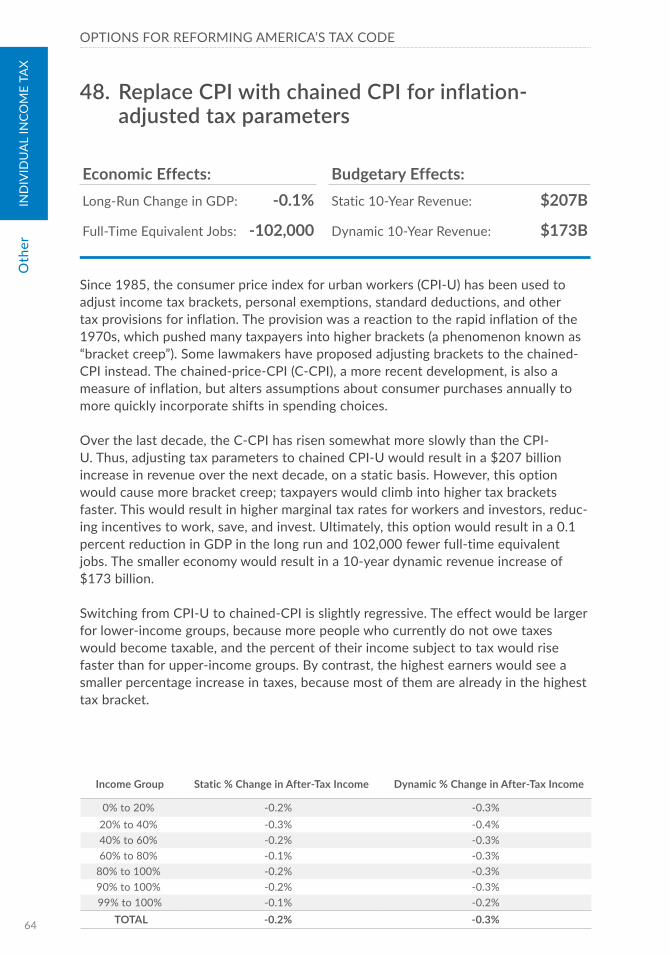
OPTIONS FOR REFORMING AMERICA’S TAX CODEIN
DIV
IDU
AL
INCO
ME
TAX
64
Since 1985, the consumer price index for urban workers (CPI-U) has been used to adjust income tax brackets, personal exemptions, standard deductions, and other tax provisions for inflation. The provision was a reaction to the rapid inflation of the 1970s, which pushed many taxpayers into higher brackets (a phenomenon known as “bracket creep”). Some lawmakers have proposed adjusting brackets to the chained-CPI instead. The chained-price-CPI (C-CPI), a more recent development, is also a measure of inflation, but alters assumptions about consumer purchases annually to more quickly incorporate shifts in spending choices.
Over the last decade, the C-CPI has risen somewhat more slowly than the CPI-U. Thus, adjusting tax parameters to chained CPI-U would result in a $207 billion increase in revenue over the next decade, on a static basis. However, this option would cause more bracket creep; taxpayers would climb into higher tax brackets faster. This would result in higher marginal tax rates for workers and investors, reduc-ing incentives to work, save, and invest. Ultimately, this option would result in a 0.1 percent reduction in GDP in the long run and 102,000 fewer full-time equivalent jobs. The smaller economy would result in a 10-year dynamic revenue increase of $173 billion.
Switching from CPI-U to chained-CPI is slightly regressive. The effect would be larger for lower-income groups, because more people who currently do not owe taxes would become taxable, and the percent of their income subject to tax would rise faster than for upper-income groups. By contrast, the highest earners would see a smaller percentage increase in taxes, because most of them are already in the highest tax bracket.
Economic Effects: Budgetary Effects:Long-Run Change in GDP: -0.1% Static 10-Year Revenue: $207B
Full-Time Equivalent Jobs: -102,000 Dynamic 10-Year Revenue: $173B
48. Replace CPI with chained CPI for inflation-adjusted tax parameters
Income Group Static % Change in After-Tax Income Dynamic % Change in After-Tax Income
0% to 20% -0.2% -0.3%20% to 40% -0.3% -0.4%40% to 60% -0.2% -0.3%60% to 80% -0.1% -0.3%
80% to 100% -0.2% -0.3%90% to 100% -0.2% -0.3%99% to 100% -0.1% -0.2%
TOTAL -0.2% -0.3%
Oth
er
B U S I N E S S I N C O M E TA X E S
CHAPTER 2
Dirksen Senate Office Building

TAX FOUNDATION
67
BUSIN
ESS TAXES
Introduction
The business income tax code in the United States is in bad shape. U.S. corporations face some of the highest marginal rates in the world, and have responded by shifting their business, their income, and their residences overseas. Meanwhile, non-corporate businesses face very high tax rates, as well: over 50 percent, in some states.
Beyond the rates that businesses pay, the U.S. tax code is structured in a way that discourages additional business investment. By requiring businesses to deduct the cost of their capital expenditures over long periods of time, the U.S. tax code disin-centivizes investment, a central driver of economic growth.
There are many paths to reforming the business tax system, ranging from modest (eliminate particular credits and deductions) to radical (replace the corporate tax with a value-added tax). This section includes a wide range of proposals that would change the way that businesses in the United States are taxed.
While some of the most pressing concerns with the U.S. business tax system involve the treatment of overseas income, this section does not include any proposals to change the taxation of multi-national businesses, due to the difficulty of modeling the economic and revenue effects of such proposals.
OPTIONS FOR REFORMING AMERICA’S TAX CODEBU
SIN
ESS
TAXE
S
68
Business Income Taxes – Rates
It is well-known that the U.S. federal corporate tax rate, 35 percent, is one of the highest in the world. Only two other countries, Chad and the United Arab Emirates, tax corporations at a higher rate than the United States. Every year, the United States corporate rate rises further relative to the rest of the world: between 2003 and 2015, the average worldwide corporate tax rate declined from 30 percent to 22.8 percent, while the U.S. rate stayed the same.
There is evidence that the high U.S. corporate tax rate leads corporations to shift both their profits and their real economic activity overseas. In this way, the U.S. cor-porate tax is a relatively inefficient source of revenue.
Economists generally believe that corporate taxes are more economically harmful than other taxes because they discourage business investment, a central determinant of the long-run size of the economy. The Tax Foundation’s economic model supports this claim: reducing the U.S. corporate tax could lead to a significantly larger economy over the long-term.
Of course, many businesses in the United States are taxed through the individual tax code, rather than the corporate tax code. This section also includes an option to tax income earned by pass-through businesses at a preferential rate.
Rate
s
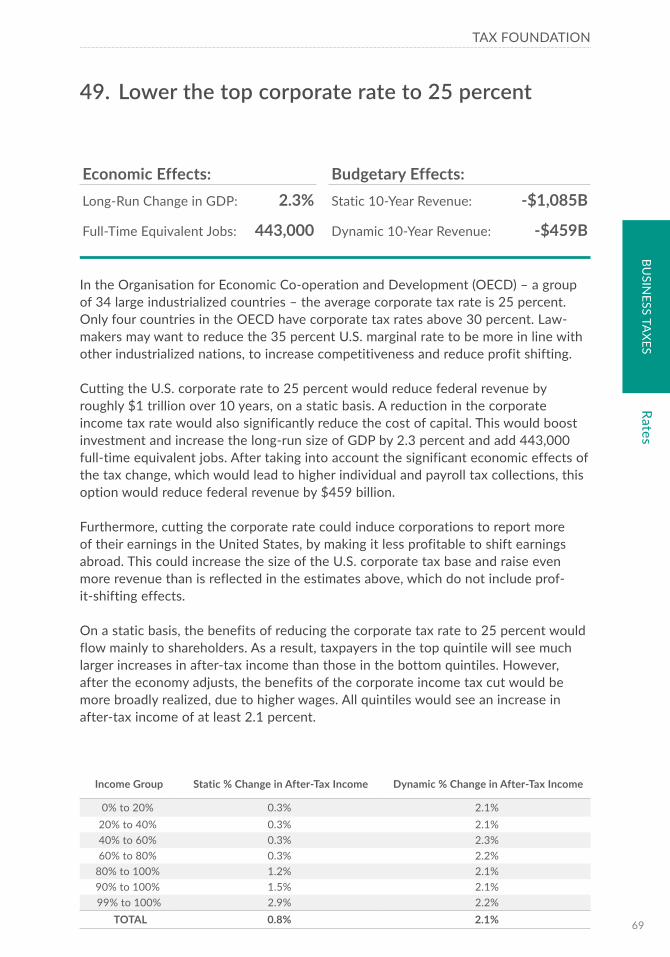
TAX FOUNDATION
69
BUSIN
ESS TAXES
In the Organisation for Economic Co-operation and Development (OECD) – a group of 34 large industrialized countries – the average corporate tax rate is 25 percent. Only four countries in the OECD have corporate tax rates above 30 percent. Law-makers may want to reduce the 35 percent U.S. marginal rate to be more in line with other industrialized nations, to increase competitiveness and reduce profit shifting.
Cutting the U.S. corporate rate to 25 percent would reduce federal revenue by roughly $1 trillion over 10 years, on a static basis. A reduction in the corporate income tax rate would also significantly reduce the cost of capital. This would boost investment and increase the long-run size of GDP by 2.3 percent and add 443,000 full-time equivalent jobs. After taking into account the significant economic effects of the tax change, which would lead to higher individual and payroll tax collections, this option would reduce federal revenue by $459 billion.
Furthermore, cutting the corporate rate could induce corporations to report more of their earnings in the United States, by making it less profitable to shift earnings abroad. This could increase the size of the U.S. corporate tax base and raise even more revenue than is reflected in the estimates above, which do not include prof-it-shifting effects.
On a static basis, the benefits of reducing the corporate tax rate to 25 percent would flow mainly to shareholders. As a result, taxpayers in the top quintile will see much larger increases in after-tax income than those in the bottom quintiles. However, after the economy adjusts, the benefits of the corporate income tax cut would be more broadly realized, due to higher wages. All quintiles would see an increase in after-tax income of at least 2.1 percent.
Income Group Static % Change in After-Tax Income Dynamic % Change in After-Tax Income
0% to 20% 0.3% 2.1%20% to 40% 0.3% 2.1%40% to 60% 0.3% 2.3%60% to 80% 0.3% 2.2%
80% to 100% 1.2% 2.1%90% to 100% 1.5% 2.1%99% to 100% 2.9% 2.2%
TOTAL 0.8% 2.1%
Economic Effects: Budgetary Effects:Long-Run Change in GDP: 2.3% Static 10-Year Revenue: -$1,085B
Full-Time Equivalent Jobs: 443,000 Dynamic 10-Year Revenue: -$459B
49. Lower the top corporate rate to 25 percent
Rates

OPTIONS FOR REFORMING AMERICA’S TAX CODEBU
SIN
ESS
TAXE
S
70
Until 2008, the top corporate tax rate in the United Kingdom was 30 percent. Then, the U.K. government enacted a series of corporate rate cuts that ultimately lowered the top corporate rate to 20 percent in 2015.
Cutting the U.S. corporate rate to 20 percent would reduce federal revenue by roughly $1.6 trillion over 10 years, on a static basis. A reduction in the corporate income tax rate would also significantly reduce the cost of capital. This would boost investment and increase the long-run size of GDP by 3.3 percent and add 641,000 full-time equivalent jobs. After taking into account the significant economic effects of the tax change, which would lead to higher individual and payroll tax collections, this option would reduce federal revenue by $718 billion, on a dynamic basis, over the next decade.
Furthermore, cutting the corporate rate could induce corporations to report more of their earnings in the United States, by making it less profitable to shift earnings abroad. This could increase the size of the U.S. corporate tax base and raise even more revenue than is reflected in the estimates above, which do not include prof-it-shifting effects.
On a static basis, the benefits of reducing the corporate tax rate to 20 percent would flow mainly to shareholders. As a result, taxpayers in the top quintile will see much larger increases in after-tax income than those in the bottom quintiles. However, after the economy adjusts, the benefits of the corporate income tax cut would be more broadly realized. All quintiles would see an increase in after-tax income of at least 3 percent.
Economic Effects: Budgetary Effects:Long-Run Change in GDP: 3.3% Static 10-Year Revenue: -$1,628B
Full-Time Equivalent Jobs: 641,000 Dynamic 10-Year Revenue: -$718B
50. Lower the top corporate rate to 20 percent
Income Group Static % Change in After-Tax Income Dynamic % Change in After-Tax Income
0% to 20% 0.5% 3.0%20% to 40% 0.4% 3.1%40% to 60% 0.5% 3.3%60% to 80% 0.5% 3.1%
80% to 100% 1.8% 3.1%90% to 100% 2.3% 3.1%99% to 100% 4.3% 3.2%
TOTAL 1.2% 3.1%
Rate
s

TAX FOUNDATION
71
BUSIN
ESS TAXES
Between 2000 and 2012, Canada cut its federal general corporate tax rate from 28 percent to 15 percent. Over the same time, Canada’s corporate tax revenue barely declined as a share of its economy.
Cutting the U.S. corporate rate to 15 percent would reduce federal revenue by almost $2.2 trillion over 10 years, on a static basis. A reduction in the corporate income tax rate would also significantly reduce the cost of capital. This would boost investment and increase the long-run size of GDP by 4.3 percent and add 824,000 full-time equivalent jobs. After taking into account the significant economic effects of the tax change, which would lead to higher individual and payroll tax collections, this option would reduce federal revenue by $995 billion, on a dynamic basis, over the next decade.
Furthermore, cutting the corporate rate could induce corporations to report more of their earnings in the United States, by making it less profitable to shift earnings abroad. This could increase the size of the U.S. corporate tax base and raise even more revenue than is reflected in the estimates above, which do not include prof-it-shifting effects.
On a static basis, the benefits of reducing the corporate tax rate to 15 percent would flow mainly to shareholders. As a result, taxpayers in the top quintile will see much larger increases in after-tax income than those in the bottom quintiles. However, after the economy adjusts, the benefits of the corporate income tax cut would be more broadly realized. All quintiles would see an increase in after-tax income of at least 3.9 percent.
Income Group Static % Change in After-Tax Income Dynamic % Change in After-Tax Income
0% to 20% 0.7% 3.9%20% to 40% 0.6% 3.9%40% to 60% 0.6% 4.3%60% to 80% 0.6% 4.1%
80% to 100% 2.5% 4.0%90% to 100% 3.1% 4.0%99% to 100% 5.7% 4.1%
TOTAL 1.6% 4.0%
Economic Effects: Budgetary Effects:Long-Run Change in GDP: 4.3% Static 10-Year Revenue: -$2,170B
Full-Time Equivalent Jobs: 824,000 Dynamic 10-Year Revenue: -$995B
51. Lower the top corporate rate to 15 percent
Rates
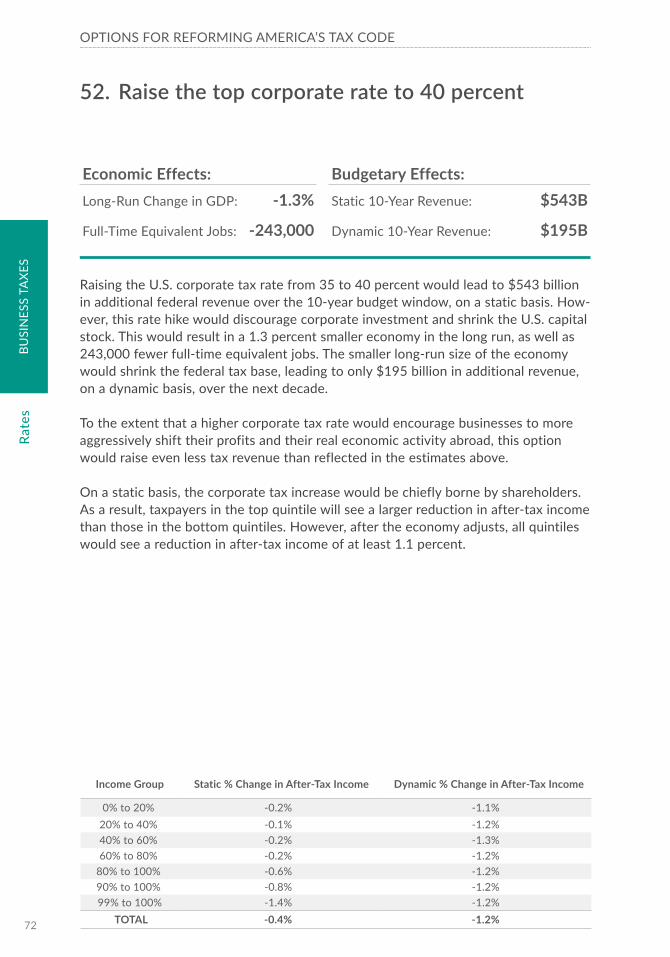
OPTIONS FOR REFORMING AMERICA’S TAX CODEBU
SIN
ESS
TAXE
S
72
Raising the U.S. corporate tax rate from 35 to 40 percent would lead to $543 billion in additional federal revenue over the 10-year budget window, on a static basis. How-ever, this rate hike would discourage corporate investment and shrink the U.S. capital stock. This would result in a 1.3 percent smaller economy in the long run, as well as 243,000 fewer full-time equivalent jobs. The smaller long-run size of the economy would shrink the federal tax base, leading to only $195 billion in additional revenue, on a dynamic basis, over the next decade.
To the extent that a higher corporate tax rate would encourage businesses to more aggressively shift their profits and their real economic activity abroad, this option would raise even less tax revenue than reflected in the estimates above.
On a static basis, the corporate tax increase would be chiefly borne by shareholders. As a result, taxpayers in the top quintile will see a larger reduction in after-tax income than those in the bottom quintiles. However, after the economy adjusts, all quintiles would see a reduction in after-tax income of at least 1.1 percent.
Economic Effects: Budgetary Effects:Long-Run Change in GDP: -1.3% Static 10-Year Revenue: $543B
Full-Time Equivalent Jobs: -243,000 Dynamic 10-Year Revenue: $195B
52. Raise the top corporate rate to 40 percent
Income Group Static % Change in After-Tax Income Dynamic % Change in After-Tax Income
0% to 20% -0.2% -1.1%20% to 40% -0.1% -1.2%40% to 60% -0.2% -1.3%60% to 80% -0.2% -1.2%
80% to 100% -0.6% -1.2%90% to 100% -0.8% -1.2%99% to 100% -1.4% -1.2%
TOTAL -0.4% -1.2%
Rate
s

TAX FOUNDATION
73
BUSIN
ESS TAXES
Businesses such as sole proprietorships, partnerships, and S corporations are known as pass-through businesses, because their earnings are not generally subject to enti-ty-level taxes, but are immediately passed through to the owners’ individual income tax returns and taxed there. This option would cap the top marginal tax rate on pass-through business income at 25 percent.
Lowering the top rate on pass-through business would encourage investment and entrepreneurship. However, it would also give pass-through income significantly better tax treatment than other types of income. For instance, under this option, a high-earning architect would be taxed at a top rate of 39.6 percent as an employee of a firm but at a top rate of 25 percent as an independent contractor. This differential would create an incentive to categorize income as pass-through income, which could lead to a larger-than-expected federal revenue loss.
On a static basis, capping the pass-through rate would have an estimated 10-year revenue cost of $775 billion. It would reduce the marginal tax rate on pass-through businesses, boosting investment. GDP would increase by 1.1 percent and employ-ment would grow by 257,000 full-time equivalent jobs. The positive economic feedback from those changes would cut the 10-year dynamic revenue cost to $489 billion. However, because this provision would likely encourage tax avoidance, the 10-year revenue loss could be higher.
On a static basis, this option would only benefit taxpayers in the top quintile. How-ever, after accounting for the larger economy, taxpayers at all levels of income would see higher after-tax incomes of at least 1 percent.
Income Group Static % Change in After-Tax Income Dynamic % Change in After-Tax Income
0% to 20% 0.0% 1.0%20% to 40% 0.0% 1.0%40% to 60% 0.0% 1.0%60% to 80% 0.0% 1.0%
80% to 100% 1.1% 2.0%90% to 100% 1.5% 2.5%99% to 100% 3.4% 4.4%
TOTAL 0.6% 1.6%
Economic Effects: Budgetary Effects:Long-Run Change in GDP: 1.1% Static 10-Year Revenue: -$775B
Full-Time Equivalent Jobs: 257,000 Dynamic 10-Year Revenue: -$489B
53. Lower the top rate on pass-through business income to 25 percent
Rates
OPTIONS FOR REFORMING AMERICA’S TAX CODEBU
SIN
ESS
TAXE
S
74
Business Income Taxes – Capital Investment and Cost Recovery
When a business makes a capital investment – such as equipment, machinery, build-ings, or inventory – the U.S. tax code does not allow it to deduct the cost of the investment immediately. Instead, businesses are required to spread out the deduc-tion over long periods of time, according to a set of more than a dozen depreciation schedules. The rules governing how businesses deduct present costs in the future, collectively known as cost recovery, are some of the most complex elements of the U.S. tax code.
There is a strong case that requiring businesses to deduct the cost of capital invest-ments in the future makes them less likely to invest. Under standard economic theory, businesses value money in the present more than money in the future; therefore, the longer a business must wait before it can deduct the full cost of an investment, the less likely it is to undertake the investment in the first place.
Because investment is one of the main drivers of economic growth and relatively sensitive to tax policy, even small changes to the tax treatment of investment create large economic effects. Lengthening depreciation schedules decreases overall invest-ment and leads to a smaller economy. On the other hand, accelerating depreciation schedules – or simply allowing businesses to deduct the full cost of investment imme-diately – is one of the most cost-effective policy tools for encouraging investment and economic growth.
Cap
ital I
nves
tmen
t an
d C
ost
Reco
very

TAX FOUNDATION
75
BUSIN
ESS TAXES
This option would abolish accelerated depreciation, which has been a feature of the income tax system since the 1950s. The current tax code allows businesses to deduct the cost of their investments according to the Modified Accelerated Cost Recovery System (MACRS), in which businesses receive larger depreciation deductions in the early years of an asset’s life (declining-balance method). Under this option, businesses would be required to take depreciation deductions in equal increments (straight-line method), according to the Alternative Depreciation System (ADS).
Because businesses do not value deductions received in the future as much as deductions received in the present, tax rules that require businesses to deduct the nominal cost of their investments over long periods of time produce a tax bias against investment. While the lengthy depreciation schedules of MACRS already discourage capital formation, the much slower depreciation schedules of ADS would substantially worsen this particular anti-investment bias.
On a static basis, moving to ADS would increase federal tax collections by $926 billion over a decade. However, this would significantly increase the cost of capi-tal, reducing investment, decreasing long-run GDP by 1.8 percent, and resulting in 350,000 fewer full-time equivalent jobs. When these negative growth effects are factored in, the estimated federal revenue gain would drop by almost 60 percent, to $390 billion on a dynamic basis, over the next decade. It is worth noting that the rev-enue gain from this option is front-loaded. This provision raises much more in its first decade than it does in subsequent decades.
In a static distributional analysis, this option would primarily impact high-income tax-payers who are shareholders, reducing the income of the top quintile by 1.2 percent. However, on a dynamic basis, the smaller economy would reduce after-tax incomes of all taxpayers by at least 1.7 percent.
Economic Effects: Budgetary Effects:Long-Run Change in GDP: -1.8% Static 10-Year Revenue: $926B
Full-Time Equivalent Jobs: -350,000 Dynamic 10-Year Revenue: $390B
54. Eliminate Accelerated Depreciation
Income Group Static % Change in After-Tax Income Dynamic % Change in After-Tax Income
0% to 20% -0.3% -1.7%20% to 40% -0.2% -1.7%40% to 60% -0.3% -1.8%60% to 80% -0.3% -1.7%
80% to 100% -1.2% -1.8%90% to 100% -1.5% -1.9%99% to 100% -2.8% -2.2%
TOTAL -0.8% -1.8%
Capital Investm
ent and Cost Recovery

OPTIONS FOR REFORMING AMERICA’S TAX CODEBU
SIN
ESS
TAXE
S
76
Bonus depreciation was introduced in 2002 as a temporary means to spur business investment. When it was introduced, it allowed businesses to immediately deduct, or expense, 30 percent of the cost of qualifying investments in equipment and soft-ware. Since its introduction, it has been extended and expanded. Under current law, businesses can now deduct or expense 50 percent of certain investment costs against taxable income. Bonus depreciation is scheduled to phase-down and expire by 2020. This option would permanently extend 50 percent bonus depreciation.
This option would reduce revenue by $266 billion over the next decade, on a static basis. Since bonus depreciation is front-loaded, most of the budgetary cost would fall in the first few years after the extension of this provision. In later years, this option would cost less.
Bonus depreciation would speed up cost recovery and allow businesses to write off more of the present-value cost of their investments. As a result, this would reduce the cost of capital and boost investment. The higher level of investment would increase GDP in the long run by 0.45 percent and create 222,000 more full-time equivalent jobs. Due to the larger economy, this provision would cost slightly less ($249 billion over 10 years) on a dynamic basis.
On a static basis, permanently extending bonus depreciation would boost the after-tax incomes of top-income earners, the largest increase going to the top 1 percent. On a dynamic basis, taxpayers at all income levels would see an increase in after-tax income of at least 0.4 percent due to the higher wages and profits resulting from the larger economy.
Income Group Static % Change in After-Tax Income Dynamic % Change in After-Tax Income
0% to 20% 0.1% 0.4%20% to 40% 0.1% 0.4%40% to 60% 0.1% 0.5%60% to 80% 0.1% 0.4%
80% to 100% 0.4% 0.5%90% to 100% 0.5% 0.5%99% to 100% 0.9% 0.5%
TOTAL 0.2% 0.4%
Economic Effects: Budgetary Effects:Long-Run Change in GDP: 0.45% Static 10-Year Revenue: -$266B
Full-Time Equivalent Jobs: 222,000 Dynamic 10-Year Revenue: -$249B
55. Make bonus depreciation permanent
Cap
ital I
nves
tmen
t an
d C
ost
Reco
very
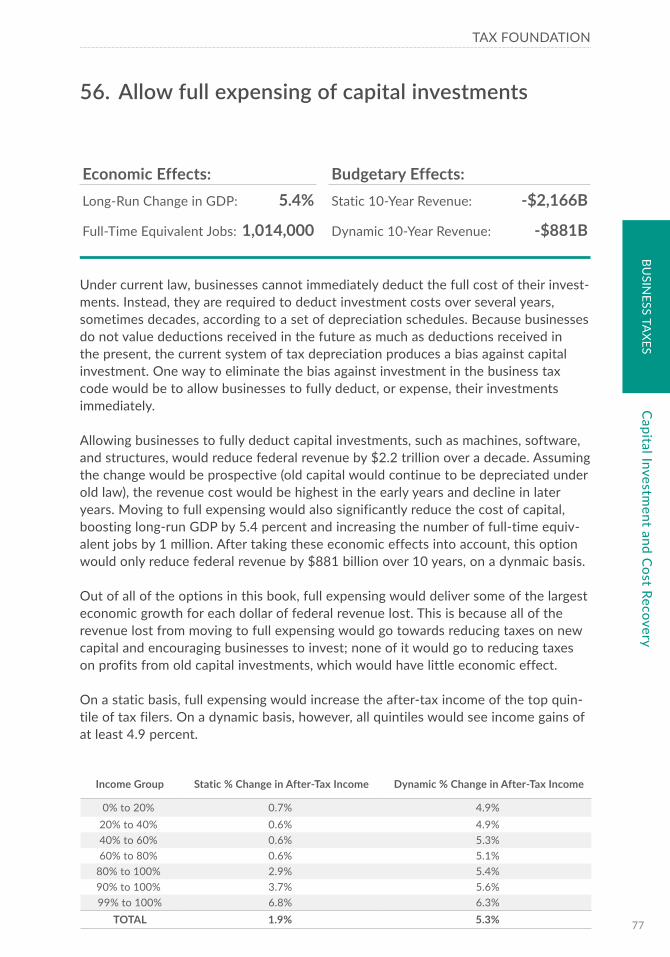
TAX FOUNDATION
77
BUSIN
ESS TAXES
Under current law, businesses cannot immediately deduct the full cost of their invest-ments. Instead, they are required to deduct investment costs over several years, sometimes decades, according to a set of depreciation schedules. Because businesses do not value deductions received in the future as much as deductions received in the present, the current system of tax depreciation produces a bias against capital investment. One way to eliminate the bias against investment in the business tax code would be to allow businesses to fully deduct, or expense, their investments immediately.
Allowing businesses to fully deduct capital investments, such as machines, software, and structures, would reduce federal revenue by $2.2 trillion over a decade. Assuming the change would be prospective (old capital would continue to be depreciated under old law), the revenue cost would be highest in the early years and decline in later years. Moving to full expensing would also significantly reduce the cost of capital, boosting long-run GDP by 5.4 percent and increasing the number of full-time equiv-alent jobs by 1 million. After taking these economic effects into account, this option would only reduce federal revenue by $881 billion over 10 years, on a dynmaic basis.
Out of all of the options in this book, full expensing would deliver some of the largest economic growth for each dollar of federal revenue lost. This is because all of the revenue lost from moving to full expensing would go towards reducing taxes on new capital and encouraging businesses to invest; none of it would go to reducing taxes on profits from old capital investments, which would have little economic effect.
On a static basis, full expensing would increase the after-tax income of the top quin-tile of tax filers. On a dynamic basis, however, all quintiles would see income gains of at least 4.9 percent.
Economic Effects: Budgetary Effects:Long-Run Change in GDP: 5.4% Static 10-Year Revenue: -$2,166B
Full-Time Equivalent Jobs: 1,014,000 Dynamic 10-Year Revenue: -$881B
56. Allow full expensing of capital investments
Income Group Static % Change in After-Tax Income Dynamic % Change in After-Tax Income
0% to 20% 0.7% 4.9%20% to 40% 0.6% 4.9%40% to 60% 0.6% 5.3%60% to 80% 0.6% 5.1%
80% to 100% 2.9% 5.4%90% to 100% 3.7% 5.6%99% to 100% 6.8% 6.3%
TOTAL 1.9% 5.3%
Capital Investm
ent and Cost Recovery
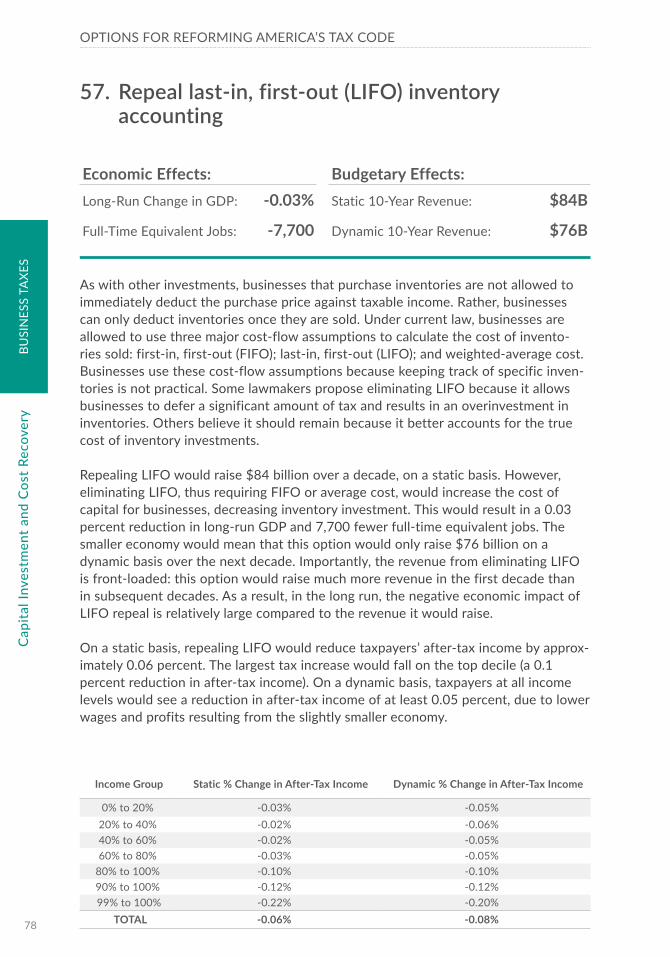
OPTIONS FOR REFORMING AMERICA’S TAX CODEBU
SIN
ESS
TAXE
S
78
As with other investments, businesses that purchase inventories are not allowed to immediately deduct the purchase price against taxable income. Rather, businesses can only deduct inventories once they are sold. Under current law, businesses are allowed to use three major cost-flow assumptions to calculate the cost of invento-ries sold: first-in, first-out (FIFO); last-in, first-out (LIFO); and weighted-average cost. Businesses use these cost-flow assumptions because keeping track of specific inven-tories is not practical. Some lawmakers propose eliminating LIFO because it allows businesses to defer a significant amount of tax and results in an overinvestment in inventories. Others believe it should remain because it better accounts for the true cost of inventory investments.
Repealing LIFO would raise $84 billion over a decade, on a static basis. However, eliminating LIFO, thus requiring FIFO or average cost, would increase the cost of capital for businesses, decreasing inventory investment. This would result in a 0.03 percent reduction in long-run GDP and 7,700 fewer full-time equivalent jobs. The smaller economy would mean that this option would only raise $76 billion on a dynamic basis over the next decade. Importantly, the revenue from eliminating LIFO is front-loaded: this option would raise much more revenue in the first decade than in subsequent decades. As a result, in the long run, the negative economic impact of LIFO repeal is relatively large compared to the revenue it would raise.
On a static basis, repealing LIFO would reduce taxpayers’ after-tax income by approx-imately 0.06 percent. The largest tax increase would fall on the top decile (a 0.1 percent reduction in after-tax income). On a dynamic basis, taxpayers at all income levels would see a reduction in after-tax income of at least 0.05 percent, due to lower wages and profits resulting from the slightly smaller economy.
Income Group Static % Change in After-Tax Income Dynamic % Change in After-Tax Income
0% to 20% -0.03% -0.05%20% to 40% -0.02% -0.06%40% to 60% -0.02% -0.05%60% to 80% -0.03% -0.05%
80% to 100% -0.10% -0.10%90% to 100% -0.12% -0.12%99% to 100% -0.22% -0.20%
TOTAL -0.06% -0.08%
Economic Effects: Budgetary Effects:Long-Run Change in GDP: -0.03% Static 10-Year Revenue: $84B
Full-Time Equivalent Jobs: -7,700 Dynamic 10-Year Revenue: $76B
57. Repeal last-in, first-out (LIFO) inventory accounting
Cap
ital I
nves
tmen
t an
d C
ost
Reco
very
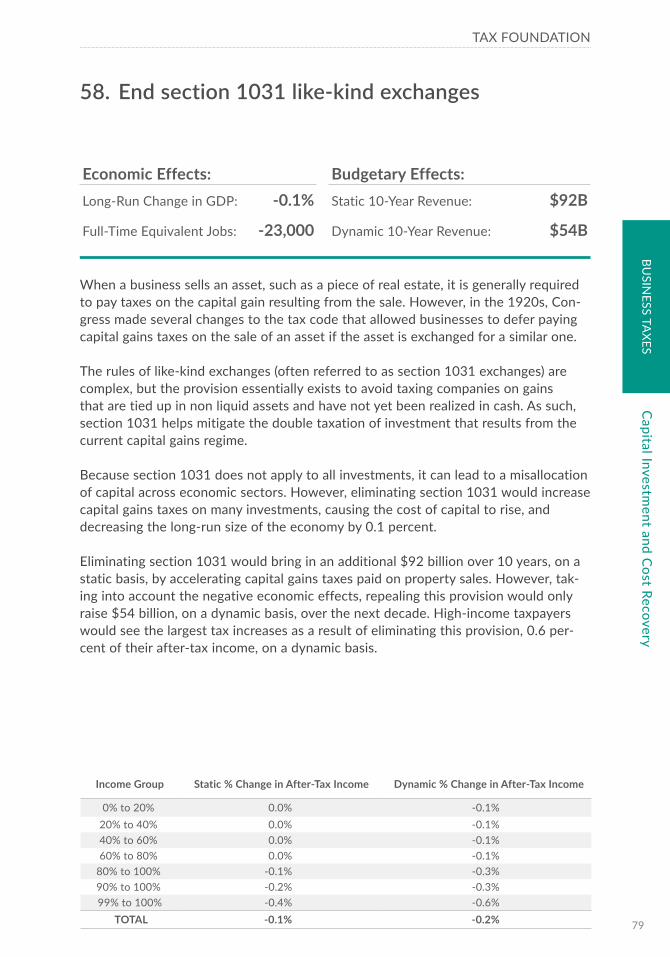
TAX FOUNDATION
79
BUSIN
ESS TAXES
When a business sells an asset, such as a piece of real estate, it is generally required to pay taxes on the capital gain resulting from the sale. However, in the 1920s, Con-gress made several changes to the tax code that allowed businesses to defer paying capital gains taxes on the sale of an asset if the asset is exchanged for a similar one.
The rules of like-kind exchanges (often referred to as section 1031 exchanges) are complex, but the provision essentially exists to avoid taxing companies on gains that are tied up in non liquid assets and have not yet been realized in cash. As such, section 1031 helps mitigate the double taxation of investment that results from the current capital gains regime.
Because section 1031 does not apply to all investments, it can lead to a misallocation of capital across economic sectors. However, eliminating section 1031 would increase capital gains taxes on many investments, causing the cost of capital to rise, and decreasing the long-run size of the economy by 0.1 percent.
Eliminating section 1031 would bring in an additional $92 billion over 10 years, on a static basis, by accelerating capital gains taxes paid on property sales. However, tak-ing into account the negative economic effects, repealing this provision would only raise $54 billion, on a dynamic basis, over the next decade. High-income taxpayers would see the largest tax increases as a result of eliminating this provision, 0.6 per-cent of their after-tax income, on a dynamic basis.
Economic Effects: Budgetary Effects:Long-Run Change in GDP: -0.1% Static 10-Year Revenue: $92B
Full-Time Equivalent Jobs: -23,000 Dynamic 10-Year Revenue: $54B
58. End section 1031 like-kind exchanges
Income Group Static % Change in After-Tax Income Dynamic % Change in After-Tax Income
0% to 20% 0.0% -0.1%20% to 40% 0.0% -0.1%40% to 60% 0.0% -0.1%60% to 80% 0.0% -0.1%
80% to 100% -0.1% -0.3%90% to 100% -0.2% -0.3%99% to 100% -0.4% -0.6%
TOTAL -0.1% -0.2%
Capital Investm
ent and Cost Recovery
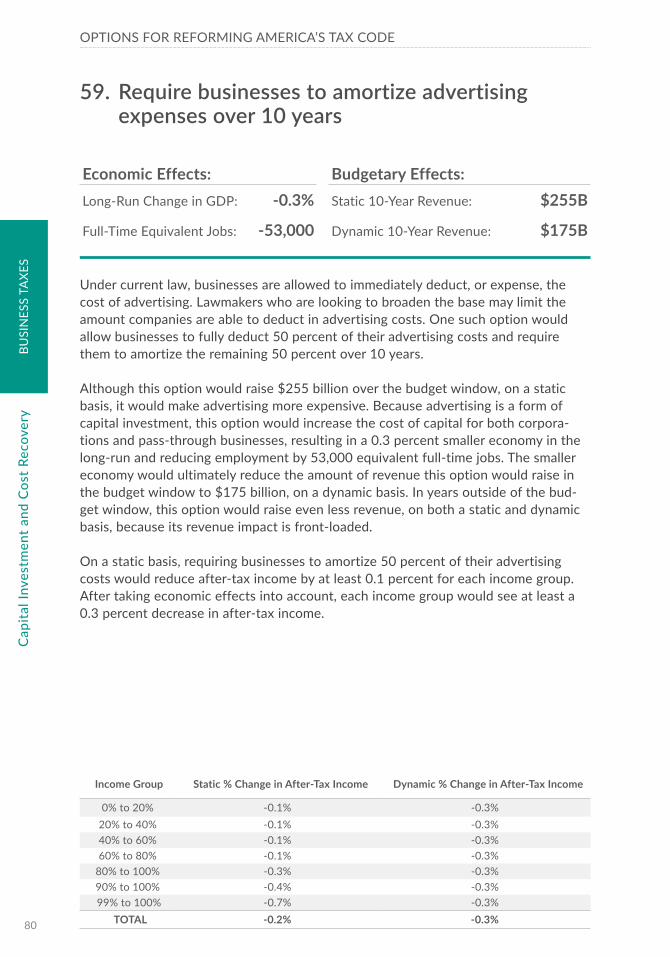
OPTIONS FOR REFORMING AMERICA’S TAX CODEBU
SIN
ESS
TAXE
S
80
Under current law, businesses are allowed to immediately deduct, or expense, the cost of advertising. Lawmakers who are looking to broaden the base may limit the amount companies are able to deduct in advertising costs. One such option would allow businesses to fully deduct 50 percent of their advertising costs and require them to amortize the remaining 50 percent over 10 years.
Although this option would raise $255 billion over the budget window, on a static basis, it would make advertising more expensive. Because advertising is a form of capital investment, this option would increase the cost of capital for both corpora-tions and pass-through businesses, resulting in a 0.3 percent smaller economy in the long-run and reducing employment by 53,000 equivalent full-time jobs. The smaller economy would ultimately reduce the amount of revenue this option would raise in the budget window to $175 billion, on a dynamic basis. In years outside of the bud-get window, this option would raise even less revenue, on both a static and dynamic basis, because its revenue impact is front-loaded.
On a static basis, requiring businesses to amortize 50 percent of their advertising costs would reduce after-tax income by at least 0.1 percent for each income group. After taking economic effects into account, each income group would see at least a 0.3 percent decrease in after-tax income.
Income Group Static % Change in After-Tax Income Dynamic % Change in After-Tax Income
0% to 20% -0.1% -0.3%20% to 40% -0.1% -0.3%40% to 60% -0.1% -0.3%60% to 80% -0.1% -0.3%
80% to 100% -0.3% -0.3%90% to 100% -0.4% -0.3%99% to 100% -0.7% -0.3%
TOTAL -0.2% -0.3%
Economic Effects: Budgetary Effects:Long-Run Change in GDP: -0.3% Static 10-Year Revenue: $255B
Full-Time Equivalent Jobs: -53,000 Dynamic 10-Year Revenue: $175B
59. Require businesses to amortize advertising expenses over 10 years
Cap
ital I
nves
tmen
t an
d C
ost
Reco
very

TAX FOUNDATION
81
BUSIN
ESS TAXES
In the past, some lawmakers have proposed broadening the corporate tax base by eliminating accelerated depreciation, or MACRS. Some see accelerated deprecia-tion as a tax expenditure that should be eliminated. Others, however, view it has an important provision that moves the tax code closer to full expensing of capital investments.
This option would eliminate accelerated depreciation and reduce the corporate income tax rate to 31 percent. Over the long run, this option is roughly revenue-neu-tral. However, the transition to accelerated depreciation would raise $410 billion over the budget window, on a static basis.
All in all, this option would reduce the long-run size of the U.S. economy by 0.7 per-cent. Cutting the overall corporate rate would reduce the cost of capital, but some of the benefits would go to owners of old capital investments, rather than incentivizing new investment. On the other hand, repealing accelerated depreciation would fall squarely on new investment, discouraging businesses from increasing their capital stock. On a dynamic basis, this option would raise $198 billion over the next decade.
On a static basis, this option would reduce taxpayers’ after-tax incomes by 0.2 per-cent, with a greater tax increase for those at the top. On a dynamic basis, all groups of taxpayers would see reductions in after-tax incomes of at least 0.7 percent, due to the smaller economy.
Income Group Static % Change in After-Tax Income Dynamic % Change in After-Tax Income
0% to 20% -0.1% -0.7%20% to 40% -0.1% -0.7%40% to 60% -0.1% -0.7%60% to 80% -0.1% -0.7%
80% to 100% -0.4% -0.8%90% to 100% -0.5% -0.9%99% to 100% -0.9% -1.1%
0% to 20% -0.2% -0.8%
Economic Effects: Budgetary Effects:Long-Run Change in GDP: -0.7% Static 10-Year Revenue: $410B
Full-Time Equivalent Jobs: -136,000 Dynamic 10-Year Revenue: $198B
60. Repeal accelerated depreciation and lower the corporate income tax rate to 31 percent
Capital Investm
ent and Cost Recovery

OPTIONS FOR REFORMING AMERICA’S TAX CODEBU
SIN
ESS
TAXE
S
82
Although a reduction in the corporate rate would reduce the cost of capital for cor-porations, it would still leave a significant bias against investment in the tax code. Businesses are currently required to deduct investment costs over several years, sometimes decades, according to a set of depreciation schedules. Because businesses do not value deductions received in the future as much as deductions received in the present, the current system of tax depreciation discourages businesses from investing.
As such, lawmakers may consider pairing a reduction in the corporate income tax with a move to full expensing. This option would reduce the corporate income tax rate to 25 percent and allow all businesses (corporations and pass-throughs) to deduct the full cost of their investments immediately.
This option would significantly reduce the cost of capital, boosting long-run GDP by 6.6 percent and resulting in 1.2 million full-time equivalent jobs. It would also reduce federal revenue by $2.8 trillion over the next decade, on a static basis. However, after accounting for the larger economy, this option would reduce federal revenue by $1.2 trillion over the next decade, on a dynamic basis. Since the move to full expensing speeds up the realization of deductions, this option would reduce revenue by much more in the first decade than subsequent decades.
On a static basis, this option would cut taxes across the board. Taxpayers in the top quintile would see a larger immediate increase in after-tax income than other quin-tiles. On a long-run dynamic basis, all groups of taxpayers would see an increase in after-tax income of at least 5.9 percent.
Economic Effects: Budgetary Effects:Long-Run Change in GDP: 6.6% Static 10-Year Revenue: -$2,819B
Full-Time Equivalent Jobs: 1,242,000 Dynamic 10-Year Revenue: -$1,212B
61. Reduce the corporate income tax to 25 percent and allow all businesses to fully expense capital investments
Income Group Static % Change in After-Tax Income Dynamic % Change in After-Tax Income
0% to 20% 0.7% 5.9%20% to 40% 0.6% 6.0%40% to 60% 0.6% 6.5%60% to 80% 0.6% 6.2%
80% to 100% 2.9% 6.5%90% to 100% 3.7% 6.7%99% to 100% 6.9% 7.5%
TOTAL 1.9% 6.4%
Cap
ital I
nves
tmen
t an
d C
ost
Reco
very

TAX FOUNDATION
83
BUSIN
ESS TAXES
Business Income Taxes – Other
Over the past few years, the need for comprehensive business tax reform has become apparent. However, there are many different paths and strategies for making the U.S. business tax system simpler, fairer, and more competitive.
One path towards business tax reform is corporate integration: equalizing the taxa-tion of business income across business forms and methods of financing. Corporate integration would eliminate the double tax on corporations and remove the bias and may actually reduce federal revenue in the long run.
Another paradigm for business tax reform is the classic approach of “broaden the base and lower the rate”: eliminating business tax expenditures in order to pay for lower business tax rates. There are dozens of miscellaneous credits and deductions that businesses are able to claim; eliminating these provisions could help pay for lower rates.
In recent years, some policymakers have proposed flipping the treatment of interest in the tax code: taxing businesses on the interest they pay and exempting them from taxes on the interest they receive. Many of these proposals significantly increase fed-eral revenue, with only a small effect on business investment.
One dramatic strategy for business tax reform is replacing the corporate income tax with a value-added tax. Because a value-added tax is a form of consumption tax and does not tax businesses on the cost of investment, it would be more economically efficient than the current corporate income tax. However, critics of a value-added tax point to the tax’s lack of transparency.
Other
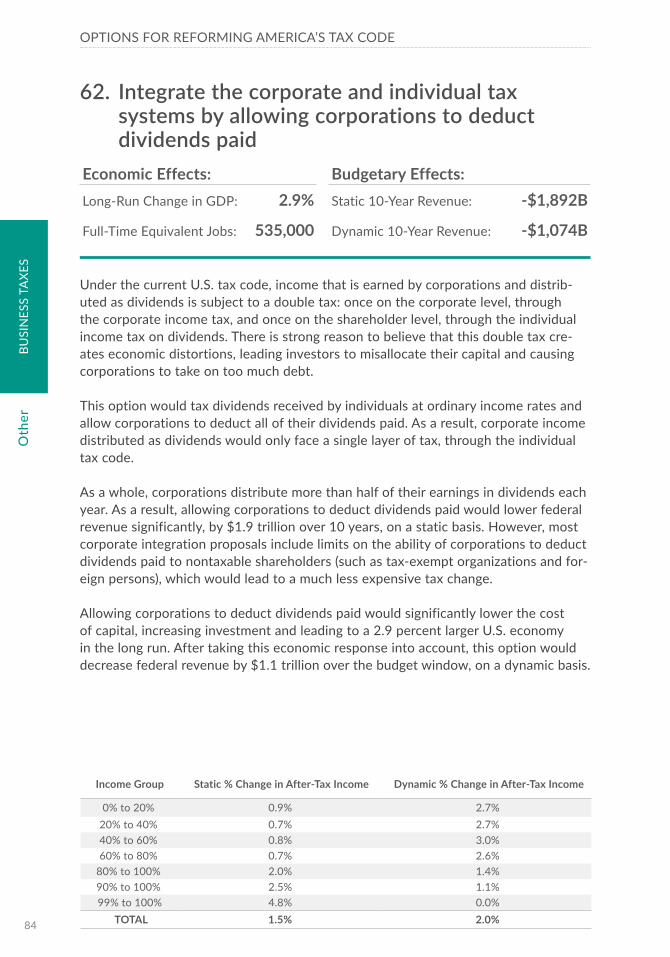
OPTIONS FOR REFORMING AMERICA’S TAX CODEBU
SIN
ESS
TAXE
S
84
Under the current U.S. tax code, income that is earned by corporations and distrib-uted as dividends is subject to a double tax: once on the corporate level, through the corporate income tax, and once on the shareholder level, through the individual income tax on dividends. There is strong reason to believe that this double tax cre-ates economic distortions, leading investors to misallocate their capital and causing corporations to take on too much debt.
This option would tax dividends received by individuals at ordinary income rates and allow corporations to deduct all of their dividends paid. As a result, corporate income distributed as dividends would only face a single layer of tax, through the individual tax code.
As a whole, corporations distribute more than half of their earnings in dividends each year. As a result, allowing corporations to deduct dividends paid would lower federal revenue significantly, by $1.9 trillion over 10 years, on a static basis. However, most corporate integration proposals include limits on the ability of corporations to deduct dividends paid to nontaxable shareholders (such as tax-exempt organizations and for-eign persons), which would lead to a much less expensive tax change.
Allowing corporations to deduct dividends paid would significantly lower the cost of capital, increasing investment and leading to a 2.9 percent larger U.S. economy in the long run. After taking this economic response into account, this option would decrease federal revenue by $1.1 trillion over the budget window, on a dynamic basis.
Economic Effects: Budgetary Effects:Long-Run Change in GDP: 2.9% Static 10-Year Revenue: -$1,892B
Full-Time Equivalent Jobs: 535,000 Dynamic 10-Year Revenue: -$1,074B
62. Integrate the corporate and individual tax systems by allowing corporations to deduct dividends paid
Income Group Static % Change in After-Tax Income Dynamic % Change in After-Tax Income
0% to 20% 0.9% 2.7%20% to 40% 0.7% 2.7%40% to 60% 0.8% 3.0%60% to 80% 0.7% 2.6%
80% to 100% 2.0% 1.4%90% to 100% 2.5% 1.1%99% to 100% 4.8% 0.0%
TOTAL 1.5% 2.0%
Oth
er

TAX FOUNDATION
85
BUSIN
ESS TAXES
The domestic production activities deduction, or section 199, was passed in the American Jobs Creation Act of 2004. The deduction replaced a form of exclusion for foregin sales, which the World Trade Organization declared illegal. The domestic pro-duction activities deduction allows both corporations and pass-through businesses to deduct 9 percent of qualifying manufacturing income from their taxable income. Oil and natural gas companies may take this deduction, but are limited to a deduction equal to 6 percent of their qualifying income. The definition of qualifying income is broad; most industries benefit from this deduction in some way, with the largest ben-efits going to manufacturing.
The domestic production activities deduction is one of the larger business tax expen-ditures in the current tax code. Repealing it would raise approximately $203 billion over 10 years, on a static basis, by broadening the business tax base. Because this option would increase the marginal tax rate on investment, it would reduce GDP by 0.3 percent. On a dynamic basis, repealing section 199 would raise $135 billion over the next decade.
This option would reduce after-tax income by approximately 0.15 percent, with the bulk of the tax increase falling on high-income taxpayers. On a dynamic basis, tax-payers at all income levels would see a reduction in after-tax income of at least 0.2 percent due to the slightly smaller economy.
Income Group Static % Change in After-Tax Income Dynamic % Change in After-Tax Income
0% to 20% -0.06% -0.2%20% to 40% -0.05% -0.2%40% to 60% -0.06% -0.3%60% to 80% -0.06% -0.2%
80% to 100% -0.23% -0.2%90% to 100% -0.29% -0.2%99% to 100% -0.53% -0.2%
TOTAL -0.15% -0.2%
Economic Effects: Budgetary Effects:Long-Run Change in GDP: -0.3% Static 10-Year Revenue: $203B
Full-Time Equivalent Jobs: -45,000 Dynamic 10-Year Revenue: $135B
63. Repeal the domestic production activities deduction (section 199)
Other
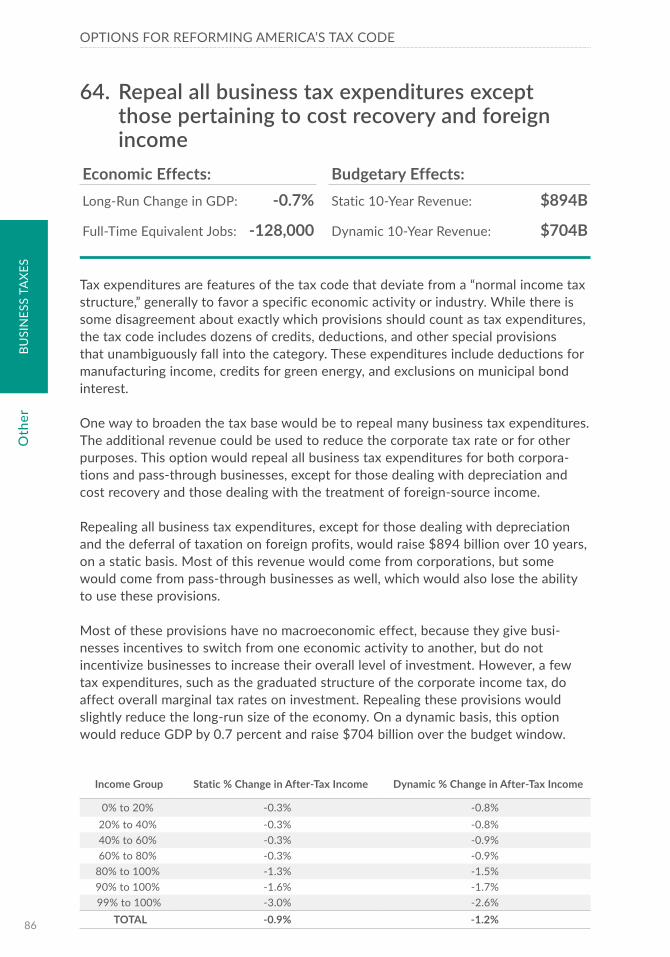
OPTIONS FOR REFORMING AMERICA’S TAX CODEBU
SIN
ESS
TAXE
S
86
Tax expenditures are features of the tax code that deviate from a “normal income tax structure,” generally to favor a specific economic activity or industry. While there is some disagreement about exactly which provisions should count as tax expenditures, the tax code includes dozens of credits, deductions, and other special provisions that unambiguously fall into the category. These expenditures include deductions for manufacturing income, credits for green energy, and exclusions on municipal bond interest.
One way to broaden the tax base would be to repeal many business tax expenditures. The additional revenue could be used to reduce the corporate tax rate or for other purposes. This option would repeal all business tax expenditures for both corpora-tions and pass-through businesses, except for those dealing with depreciation and cost recovery and those dealing with the treatment of foreign-source income.
Repealing all business tax expenditures, except for those dealing with depreciation and the deferral of taxation on foreign profits, would raise $894 billion over 10 years, on a static basis. Most of this revenue would come from corporations, but some would come from pass-through businesses as well, which would also lose the ability to use these provisions.
Most of these provisions have no macroeconomic effect, because they give busi-nesses incentives to switch from one economic activity to another, but do not incentivize businesses to increase their overall level of investment. However, a few tax expenditures, such as the graduated structure of the corporate income tax, do affect overall marginal tax rates on investment. Repealing these provisions would slightly reduce the long-run size of the economy. On a dynamic basis, this option would reduce GDP by 0.7 percent and raise $704 billion over the budget window.
Economic Effects: Budgetary Effects:Long-Run Change in GDP: -0.7% Static 10-Year Revenue: $894B
Full-Time Equivalent Jobs: -128,000 Dynamic 10-Year Revenue: $704B
64. Repeal all business tax expenditures except those pertaining to cost recovery and foreign income
Income Group Static % Change in After-Tax Income Dynamic % Change in After-Tax Income
0% to 20% -0.3% -0.8%20% to 40% -0.3% -0.8%40% to 60% -0.3% -0.9%60% to 80% -0.3% -0.9%
80% to 100% -1.3% -1.5%90% to 100% -1.6% -1.7%99% to 100% -3.0% -2.6%
TOTAL -0.9% -1.2%
Oth
er

TAX FOUNDATION
87
BUSIN
ESS TAXES
The federal income tax contains a number of provisions known as tax expenditures. Tax expenditures are provisions of the tax code that deviate from a “normal income tax structure,” generally to favor a specific economic activity or industry. While there is some disagreement about exactly which provisions should count as tax expenditures, the tax code includes dozens of credits, deductions, and other special provisions that unambiguously fall into the category. These expenditures include deductions for manufacturing income, credits for investment in green energy, and exclusions on municipal bond interest.
Eliminating all business tax expenditures (except those pertaining to cost recovery and foreign income) would raise enough revenue to lower the corporate income tax rate to 28 percent on a revenue-neutral basis. Since many of these provisions pro-vide narrow benefits to certain industries, eliminating them would have little overall economic effect. On the other hand, a corporate rate reduction would decrease the marginal tax burden on all investment, leading to a larger capital stock. Altogether, this would increase the size of the economy by 1.1 percent in the long run. As a result of the larger economy, this option would end up increasing revenue by $307 billion over 10 years, on a dymanic basis.
Because of these economic effects, taxpayers at all income levels would see 1.0 per-cent higher after-tax incomes. Importantly, this option would increase tax burdens on owners of pass-through businesses, such as S corporations, partnerships, and sole proprietorships. These businesses would face higher tax burdens, due to the elimina-tion of tax expenditures, but would not see a compensating rate reduction.
Income Group Static % Change in After-Tax Income Dynamic % Change in After-Tax Income
0% to 20% 0.00% 1.0%20% to 40% 0.00% 1.0%40% to 60% 0.00% 1.1%60% to 80% 0.00% 1.1%
80% to 100% 0.00% 1.0%90% to 100% 0.00% 1.0%99% to 100% 0.01% 1.1%
0% to 20% 0.00% 1.0%
Economic Effects: Budgetary Effects:Long-Run Change in GDP: 1.1% Static 10-Year Revenue: -$3B
Full-Time Equivalent Jobs: 219,000 Dynamic 10-Year Revenue: $307B
65. Repeal all business tax expenditures except those pertaining to cost recovery and foreign income, and reduce the corporate tax rate to 28 percent
Other

OPTIONS FOR REFORMING AMERICA’S TAX CODEBU
SIN
ESS
TAXE
S
88
Under current law, businesses that pay interest on their loans are allowed to deduct the amount of interest paid from their taxable income, as a business expense. On the flip side, businesses and individuals earning interest income are required to pay taxes on the interest they receive.
This option would eliminate the deductibility of interest payments at the business level on all new loans (all interest paid on old loans would continue to be deductible). This would lead to a double tax on interest payments; under this option, interest would be subject to a 35 percent corporate tax rate and a 39.6 percent to pass-through tax rate when paid and a 39.6 percent top rate when received.
This option would significantly broaden the business tax base and bring in a large amount of federal revenue: $1.2 trillion over 10 years, on a static basis. Because this provision would bump some individuals into higher tax brackets and increase the cost of capital, it would decrease the size of the economy by 1.7 percent.
After accounting for the economic effects of this option, federal revenue would increase by $1.46 trillion, on a dynamic basis, over the next decade. Because this option is prospective (it only applies to new loans), it would end up raising more reve-nue in later decades.
This option would reduce after-tax income by 1.1 percent, on a static basis. The top 1 percent of taxpayers would be hit hardest, with a tax hike of 4.2 percent of their income. After considering the negative economic feedback of this tax change, each income group would see its incomes fall by at least an additional 0.2 percent.
Economic Effects: Budgetary Effects:Long-Run Change in GDP: -1.7% Static 10-Year Revenue: $1,489B
Full-Time Equivalent Jobs: -332,000 Dynamic 10-Year Revenue: $1,200B
66. Eliminate the deductibility of interest payments
Income Group Static % Change in After-Tax Income Dynamic % Change in After-Tax Income
0% to 20% 0.0% -1.6%20% to 40% -0.1% -1.7%40% to 60% -0.1% -1.9%60% to 80% -0.2% -1.8%
80% to 100% -1.8% -3.4%90% to 100% -2.4% -4.0%99% to 100% -4.2% -5.8%
TOTAL -1.1% -2.7%
Oth
er

TAX FOUNDATION
89
BUSIN
ESS TAXES
Under current law, businesses that pay interest on their loans are allowed to deduct the amount of interest paid from their taxable income, as a business expense. On the flip side, businesses and individuals earning interest income are required to pay taxes on the interest they receive.
This option would eliminate the deductibility of interest payments at the business level on all new loans (all interest paid on old loans would continue to be deductible). To partially mitigate the resulting double tax on interest, this option would also tax individual interest income under the same rate schedule as long-term capital gains and qualified dividends, at rates of 0, 15, and 20 percent. As a result, this option would effectively equalize the tax treatment of interest and dividends.
Eliminating the deductibility of interest payments would raise a large amount of fed-eral revenue. However, taxing interest income at the same rate as capital gains and qualified dividends would slightly reduce revenue. Combing these two proposals would increase federal revenue by $1.1 trillion over the 10-year budget window, on a static basis. This option would reduce GDP by 1.0 percent and result in 152,000 fewer full-time equivalent jobs. Since this option is prospective (it only applies to new loans), it would end up raising more revenue in later decades.
This option would reduce after-tax income by 0.8 percent, on a static basis. The top 1 percent of taxpayers would be hit hardest, with a tax hike of 3.6 percent of their income. After considering the negative economic feedback of this tax change, each income group would see its incomes fall by at least 0.1 percent more.
Income Group Static % Change in Post-Tax Income Dynamic % Change in Post-Tax Income
0% to 20% 0.0% -0.9%20% to 40% 0.0% -1.0%40% to 60% 0.0% -1.0%60% to 80% 0.0% -0.9%
80% to 100% -1.4% -2.3%90% to 100% -2.0% -2.9%99% to 100% -3.6% -4.5%
TOTAL -0.8% -1.7%
Economic Effects: Budgetary Effects:Long-Run Change in GDP: -1.0% Static 10-Year Revenue: $1,112B
Full-Time Equivalent Jobs: -152,000 Dynamic 10-Year Revenue: $971B
67. Eliminate the deductibility of interest payments and tax interest income at the same rate as capital gains and dividends
Other
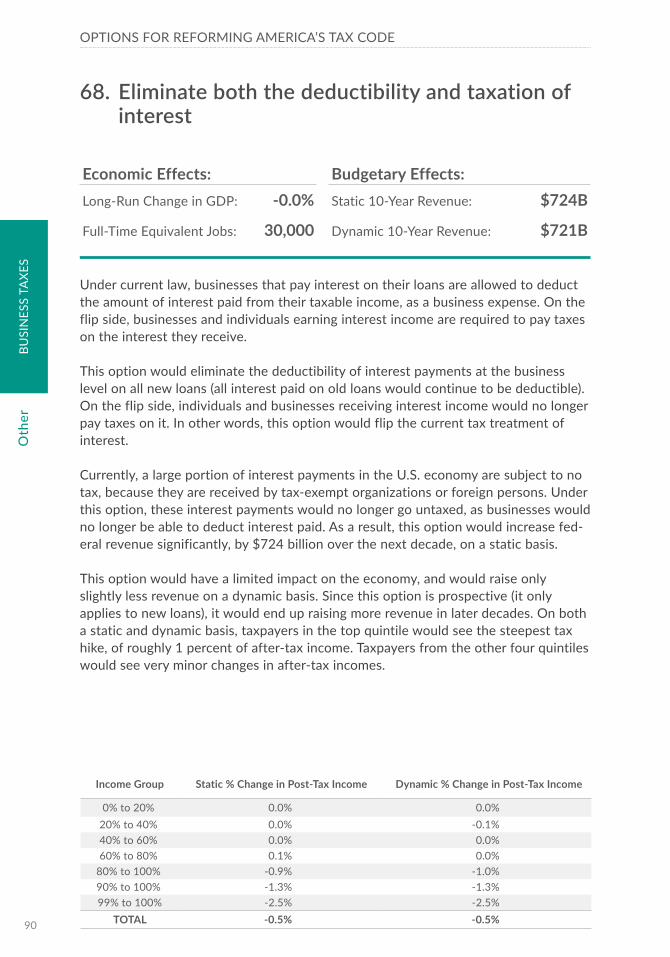
OPTIONS FOR REFORMING AMERICA’S TAX CODEBU
SIN
ESS
TAXE
S
90
Under current law, businesses that pay interest on their loans are allowed to deduct the amount of interest paid from their taxable income, as a business expense. On the flip side, businesses and individuals earning interest income are required to pay taxes on the interest they receive.
This option would eliminate the deductibility of interest payments at the business level on all new loans (all interest paid on old loans would continue to be deductible). On the flip side, individuals and businesses receiving interest income would no longer pay taxes on it. In other words, this option would flip the current tax treatment of interest.
Currently, a large portion of interest payments in the U.S. economy are subject to no tax, because they are received by tax-exempt organizations or foreign persons. Under this option, these interest payments would no longer go untaxed, as businesses would no longer be able to deduct interest paid. As a result, this option would increase fed-eral revenue significantly, by $724 billion over the next decade, on a static basis.
This option would have a limited impact on the economy, and would raise only slightly less revenue on a dynamic basis. Since this option is prospective (it only applies to new loans), it would end up raising more revenue in later decades. On both a static and dynamic basis, taxpayers in the top quintile would see the steepest tax hike, of roughly 1 percent of after-tax income. Taxpayers from the other four quintiles would see very minor changes in after-tax incomes.
Economic Effects: Budgetary Effects:Long-Run Change in GDP: -0.0% Static 10-Year Revenue: $724B
Full-Time Equivalent Jobs: 30,000 Dynamic 10-Year Revenue: $721B
68. Eliminate both the deductibility and taxation of interest
Income Group Static % Change in Post-Tax Income Dynamic % Change in Post-Tax Income
0% to 20% 0.0% 0.0%20% to 40% 0.0% -0.1%40% to 60% 0.0% 0.0%60% to 80% 0.1% 0.0%
80% to 100% -0.9% -1.0%90% to 100% -1.3% -1.3%99% to 100% -2.5% -2.5%
TOTAL -0.5% -0.5%
Oth
er

TAX FOUNDATION
91
BUSIN
ESS TAXES
The United States is one of the few countries in the world that does not have a val-ue-added tax (VAT). A value-added tax is similar to a sales tax, in that it is levied on the business level and is designed to tax all consumption. Typically, VATs are adminis-tered through a credit-invoice system, in which companies at every step of the supply chain charge VAT to their customers and receive a credit for VAT paid on business inputs. Value-added taxes are usually border-adjusted, meaning they tax imports, but exempt exports.
Because the value-added tax is a very broad-based tax and hits most income in the economy, even a low-rate tax could raise a significant amount of revenue. A 5 percent value-added tax would raise $6.2 trillion over a decade, on a static basis. However, some value-added tax proposals exempt certain sectors of the economy, such as non-profits and healthcare. A value-added tax with large exemptions would raise much less revenue.
A value-added tax would primarily increase marginal tax rates on labor. As a result, it would have an impact on incentives to work, reducing GDP by 1.5 percent in the long run and result in 1.1 million fewer full-time equivalent jobs. Accounting for the smaller economy in the long run, this option would raise $5.7 trillion over a decade, on a dynamic basis.
On a static basis, enacting a value-added tax would be slightly regressive. Taxpayers in the bottom quintile would see a reduction in after-tax income of 3.7 percent. Tax-payers in the top 1 percent would see a reduction of 3.0 percent. On a dynamic basis, after-tax incomes would fall even more, due to the smaller economy.
Income Group Static % Change in Post-Tax Income Dynamic % Change in Post-Tax Income
0% to 20% -3.7% -4.7%20% to 40% -3.5% -4.4%40% to 60% -3.6% -4.6%60% to 80% -3.5% -4.5%
80% to 100% -3.2% -4.2%90% to 100% -3.2% -4.1%99% to 100% -3.0% -4.1%
TOTAL -3.4% -4.3%
Economic Effects: Budgetary Effects:Long-Run Change in GDP: -1.5% Static 10-Year Revenue: $6,176B
Full-Time Equivalent Jobs: -1,095,000 Dynamic 10-Year Revenue: $5,781B
69. Enact a 5 percent value-added tax
Other
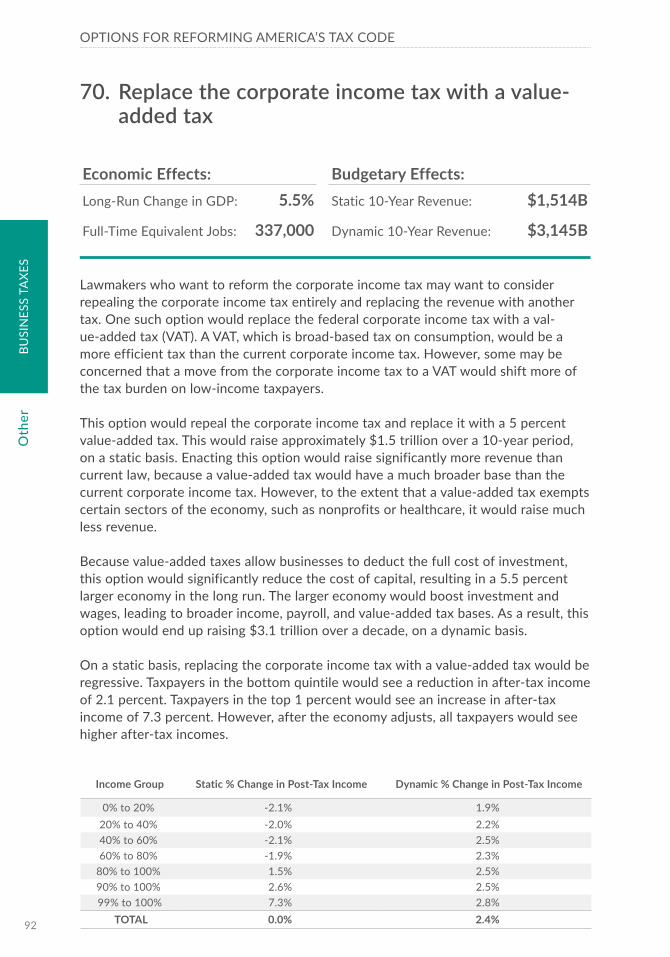
OPTIONS FOR REFORMING AMERICA’S TAX CODEBU
SIN
ESS
TAXE
S
92
Lawmakers who want to reform the corporate income tax may want to consider repealing the corporate income tax entirely and replacing the revenue with another tax. One such option would replace the federal corporate income tax with a val-ue-added tax (VAT). A VAT, which is broad-based tax on consumption, would be a more efficient tax than the current corporate income tax. However, some may be concerned that a move from the corporate income tax to a VAT would shift more of the tax burden on low-income taxpayers.
This option would repeal the corporate income tax and replace it with a 5 percent value-added tax. This would raise approximately $1.5 trillion over a 10-year period, on a static basis. Enacting this option would raise significantly more revenue than current law, because a value-added tax would have a much broader base than the current corporate income tax. However, to the extent that a value-added tax exempts certain sectors of the economy, such as nonprofits or healthcare, it would raise much less revenue.
Because value-added taxes allow businesses to deduct the full cost of investment, this option would significantly reduce the cost of capital, resulting in a 5.5 percent larger economy in the long run. The larger economy would boost investment and wages, leading to broader income, payroll, and value-added tax bases. As a result, this option would end up raising $3.1 trillion over a decade, on a dynamic basis.
On a static basis, replacing the corporate income tax with a value-added tax would be regressive. Taxpayers in the bottom quintile would see a reduction in after-tax income of 2.1 percent. Taxpayers in the top 1 percent would see an increase in after-tax income of 7.3 percent. However, after the economy adjusts, all taxpayers would see higher after-tax incomes.
Economic Effects: Budgetary Effects:Long-Run Change in GDP: 5.5% Static 10-Year Revenue: $1,514B
Full-Time Equivalent Jobs: 337,000 Dynamic 10-Year Revenue: $3,145B
70. Replace the corporate income tax with a value-added tax
Income Group Static % Change in Post-Tax Income Dynamic % Change in Post-Tax Income
0% to 20% -2.1% 1.9%20% to 40% -2.0% 2.2%40% to 60% -2.1% 2.5%60% to 80% -1.9% 2.3%
80% to 100% 1.5% 2.5%90% to 100% 2.6% 2.5%99% to 100% 7.3% 2.8%
TOTAL 0.0% 2.4%
Oth
er

ESTATE AND GIFT TAXES
CHAPTER 3
Longworth House Office Building

TAX FOUNDATION
95
ESTATE AN
D G
IFT TAXES
Introduction
Estate and gift taxes are the smallest major source of federal revenue, raising roughly $20 billion a year. Nevertheless, they are a subject of fierce debate: in a March 2016 Gallup poll, 54 percent of respondents supported eliminating the federal estate tax, compared to 19 percent who favored retaining it.
From an economic point of view, there is reason to believe that the estate tax may be one of the most harmful components of the federal tax system, per dollar of reve-nue raised. This is because the estate tax is the only federal tax that falls entirely on investment income, a central determinant of the size of the economy.
In fact, the estate tax often represents a third or fourth layer of taxation on invest-ment. An individual’s income can be taxed when it is earned and invested; when it yields a profit on the business level; when it is returned to the individual via dividend or realization as a capital gain; and upon the individual’s death.
To the extent that the presence of an estate tax encourages individuals to consume their wealth immediately, rather than investing it for future generations, estate taxes tend to discourage investment and long-run economic growth. Nevertheless, many supporters of the estate tax point to its role in increasing the progressivity of the tax code and reducing wealth inequality.
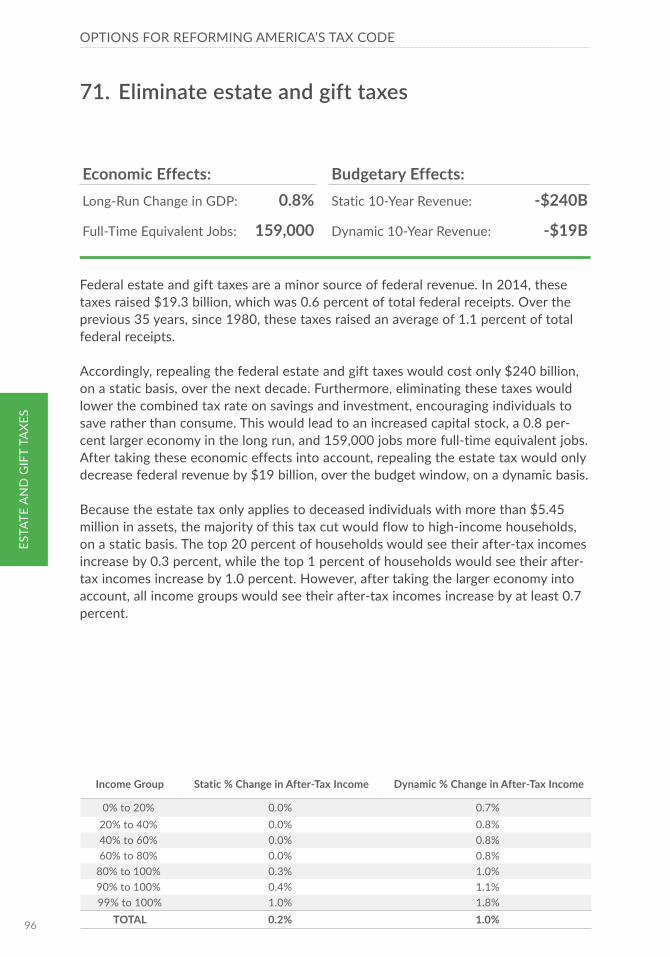
OPTIONS FOR REFORMING AMERICA’S TAX CODEES
TATE
AN
D G
IFT
TAXE
S
96
Federal estate and gift taxes are a minor source of federal revenue. In 2014, these taxes raised $19.3 billion, which was 0.6 percent of total federal receipts. Over the previous 35 years, since 1980, these taxes raised an average of 1.1 percent of total federal receipts.
Accordingly, repealing the federal estate and gift taxes would cost only $240 billion, on a static basis, over the next decade. Furthermore, eliminating these taxes would lower the combined tax rate on savings and investment, encouraging individuals to save rather than consume. This would lead to an increased capital stock, a 0.8 per-cent larger economy in the long run, and 159,000 jobs more full-time equivalent jobs. After taking these economic effects into account, repealing the estate tax would only decrease federal revenue by $19 billion, over the budget window, on a dynamic basis.
Because the estate tax only applies to deceased individuals with more than $5.45 million in assets, the majority of this tax cut would flow to high-income households, on a static basis. The top 20 percent of households would see their after-tax incomes increase by 0.3 percent, while the top 1 percent of households would see their after-tax incomes increase by 1.0 percent. However, after taking the larger economy into account, all income groups would see their after-tax incomes increase by at least 0.7 percent.
Economic Effects: Budgetary Effects:Long-Run Change in GDP: 0.8% Static 10-Year Revenue: -$240B
Full-Time Equivalent Jobs: 159,000 Dynamic 10-Year Revenue: -$19B
71. Eliminate estate and gift taxes
Income Group Static % Change in After-Tax Income Dynamic % Change in After-Tax Income
0% to 20% 0.0% 0.7%20% to 40% 0.0% 0.8%40% to 60% 0.0% 0.8%60% to 80% 0.0% 0.8%
80% to 100% 0.3% 1.0%90% to 100% 0.4% 1.1%99% to 100% 1.0% 1.8%
TOTAL 0.2% 1.0%

TAX FOUNDATION
97
ESTATE AN
D G
IFT TAXES
Under current law, the unified estate and gift tax credit creates exempt amounts of $5.45 million for individuals and $10.9 million for couples. Estates worth less than this amount are not liable for the estate tax, while estates worth more than this amount are only subject to estate taxes on each dollar above the threshold. As a result, few estates are currently subject to the federal estate tax: the Joint Committee on Taxation reports that only 0.18 percent of deaths in 2013 triggered the federal estate tax.
One way to increase the number of estates liable for the estate tax would be to lower the exempt amount. This option would decrease the exempt amount to $2 million, which is what it was from 2006 to 2008.
This option would increase federal revenue by $154 billion over the 10-year budget window, on a static basis. However, this would depress saving and investment and reduce the capital stock. As a result, GDP would decline by 0.3 percent. Because of the negative economic feedback, the 10-year dynamic federal revenue gain would drop by almost half, to $82 billion.
This option would bring more estates under the estate tax, but would only increase taxes for high-income households. The top 20 percent of households would see their after-tax incomes decrease by 0.2 percent, while the top 1 percent of households would see their after-tax incomes decrease by 0.6 percent. On a dynamic basis, all income groups would see their after-tax incomes decrease by at least 0.2 percent.
Income Group Static % Change in After-Tax Income Dynamic % Change in After-Tax Income
0% to 20% 0.0% -0.2%20% to 40% 0.0% -0.3%40% to 60% 0.0% -0.3%60% to 80% 0.0% -0.3%
80% to 100% -0.2% -0.4%90% to 100% -0.2% -0.5%99% to 100% -0.6% -0.9%
TOTAL -0.1% -0.4%
Economic Effects: Budgetary Effects:Long-Run Change in GDP: -0.3% Static 10-Year Revenue: $154B
Full-Time Equivalent Jobs: -48,000 Dynamic 10-Year Revenue: $82B
72. Lower the estate and gift tax exempt amount to $2 million
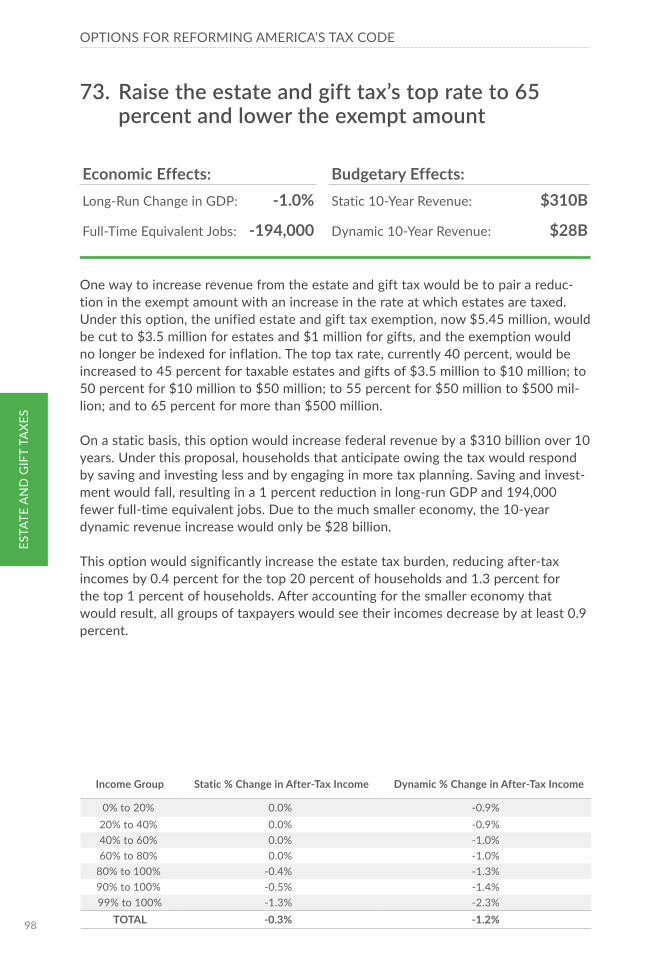
OPTIONS FOR REFORMING AMERICA’S TAX CODEES
TATE
AN
D G
IFT
TAXE
S
98
One way to increase revenue from the estate and gift tax would be to pair a reduc-tion in the exempt amount with an increase in the rate at which estates are taxed. Under this option, the unified estate and gift tax exemption, now $5.45 million, would be cut to $3.5 million for estates and $1 million for gifts, and the exemption would no longer be indexed for inflation. The top tax rate, currently 40 percent, would be increased to 45 percent for taxable estates and gifts of $3.5 million to $10 million; to 50 percent for $10 million to $50 million; to 55 percent for $50 million to $500 mil-lion; and to 65 percent for more than $500 million.
On a static basis, this option would increase federal revenue by a $310 billion over 10 years. Under this proposal, households that anticipate owing the tax would respond by saving and investing less and by engaging in more tax planning. Saving and invest-ment would fall, resulting in a 1 percent reduction in long-run GDP and 194,000 fewer full-time equivalent jobs. Due to the much smaller economy, the 10-year dynamic revenue increase would only be $28 billion.
This option would significantly increase the estate tax burden, reducing after-tax incomes by 0.4 percent for the top 20 percent of households and 1.3 percent for the top 1 percent of households. After accounting for the smaller economy that would result, all groups of taxpayers would see their incomes decrease by at least 0.9 percent.
Economic Effects: Budgetary Effects:Long-Run Change in GDP: -1.0% Static 10-Year Revenue: $310B
Full-Time Equivalent Jobs: -194,000 Dynamic 10-Year Revenue: $28B
73. Raise the estate and gift tax’s top rate to 65 percent and lower the exempt amount
Income Group Static % Change in After-Tax Income Dynamic % Change in After-Tax Income
0% to 20% 0.0% -0.9%20% to 40% 0.0% -0.9%40% to 60% 0.0% -1.0%60% to 80% 0.0% -1.0%
80% to 100% -0.4% -1.3%90% to 100% -0.5% -1.4%99% to 100% -1.3% -2.3%
TOTAL -0.3% -1.2%

TAX FOUNDATION
99
ESTATE AN
D G
IFT TAXES
Under the U.S. tax code, when a person dies and leaves property to an heir, the cost basis of the bequeathed asset is “stepped up” to its fair market value at the time of death. For example, suppose a person buys a portfolio of stocks for $100,000, which grows in value to $200,000 by the time the person dies. If the person bequeaths the stocks to an heir, the basis of the stock “steps up” from $100,000 to $200,000, meaning that the heir is only liable for capital gains taxes on the gains above $200,000, not the gains above $100,000.
Stepped-up basis ensures that when an asset is passed to an heir, the value of the asset is not subject to both the estate tax and the capital gains tax. Stepped-up basis is also a bow to administrative feasibility, in that heirs often lack the records needed to determine the original cost basis of inherited assets. However, stepped-up basis also diverges from the tax system’s normal treatment of capital gains and is some-times criticized for benefiting high-income taxpayers.
On a static basis, eliminating stepped-up basis would raise $471 billion over 10 years. However, this would increase the cost of capital and reduce saving and investment. In the long run, this option would lead to a 0.9 percent lower GDP and 169,000 fewer full-time equivalent jobs. After accounting for these economic changes, the federal government would collect $227 billion in additional revenue over 10 years, on a dynamic basis.
The elimination of stepped-up basis would primarily affect the top 20 percent of tax-payers, on a static basis, because these households have the largest unrealized capital gains. Under a dynamic analysis, the weaker economy would hurt all income groups, with decreases in after-tax income ranging from -0.8 percent in the bottom quintile to -1.4 percent in the top quintile.
Income Group Static % Change in After-Tax Income Dynamic % Change in After-Tax Income
0% to 20% 0.0% -0.8%20% to 40% 0.0% -0.8%40% to 60% 0.0% -0.9%60% to 80% 0.0% -0.8%
80% to 100% -0.6% -1.4%90% to 100% -0.9% -1.7%99% to 100% -1.8% -2.7%
TOTAL -0.4% -1.2%
Economic Effects: Budgetary Effects:Long-Run Change in GDP: -0.9% Static 10-Year Revenue: $471B
Full-Time Equivalent Jobs: -169,000 Dynamic 10-Year Revenue: $227B
74. End stepped-up basis of capital gains at death

TAX FOUNDATION
101
PAYROLL TAXESCHAPTER 4
Hart Senate Office Building


TAX FOUNDATION
103
PAYROLL TA
XES
Introduction
Payroll taxes are the second largest source of federal revenue, after the individual income tax. In 2016, payroll taxes are expected to bring in $1.1 trillion, or 33 percent of all federal revenue. Many American households pay much more in federal payroll taxes than they do in income taxes.
Many economists consider payroll taxes to be among the least harmful ways of rais-ing revenue. This is because payroll taxes only apply to labor income, rather than to investment income. Because the supply of labor is less responsive to taxation than the supply of capital, taxes on labor generally lead to less economic harm than taxes on investment.
There are two primary payroll taxes in the United States: the Social Security payroll tax (at a rate of 12.4 percent) and the Medicare payroll tax (at a rate of 2.9 percent). While the Medicare payroll tax applies to all labor earnings, the Social Security pay-roll tax only applies to an individual’s first $118,500 of wages and self-employment income. This cap on the Social Security payroll tax is indexed to wage inflation.
Over the past few years, policymakers have given increased attention to the payroll taxes paid by high-income Americans. The Affordable Care Act introduced a new 0.9 percent Medicare surtax on the wages and self-employment earnings of high-income households. In addition, the Obama administration has long advocated broaden-ing the payroll tax base to include some additional distributions from pass-through businesses.

OPTIONS FOR REFORMING AMERICA’S TAX CODEPA
YRO
LL T
AXE
S
104
In 2010, as part of the Affordable Care Act, Congress passed a 0.9 percent payroll tax on high-income Americans. Unlike other payroll taxes, the Additional Medicare Tax is levied on the household level, not the individual level. Joint filers are required to pay the tax on labor income above $250,000, while single filers are taxed on labor income above $200,000.
In 2013, 2.8 million households were subject to the Additional Medicare Tax. Most of the households subject to the tax had adjusted gross incomes between $200,000 and $500,000. All in all, the tax raised $6.27 billion in 2013, which went towards funding the Affordable Care Act.
Repealing the Additional Medicare Tax would reduce federal revenue by $87 billion over 10 years, on a static basis. However, it would also encourage additional work among high-income households, which would generate 73,000 full-time equivalent jobs and grow the economy by 0.1 percent over the long run. Taking these economic effects into account, repealing the tax would only reduce federal revenue by $63 bil-lion over 10 years, on a dynamic basis.
This option would lead to lower taxes for high-income Americans, and would increase the after-tax incomes of the top 1 percent of taxpayers by 0.3 percent, on a static basis. However, when accounting for the positive economic effects of repealing the Additional Medicare Tax, income groups across the board would see their incomes rise.
Economic Effects: Budgetary Effects:Long-Run Change in GDP: 0.1% Static 10-Year Revenue: -$87B
Full-Time Equivalent Jobs: 73,000 Dynamic 10-Year Revenue: -$63B
75. Repeal the Additional Medicare Tax
Income Group Static % Change in After-Tax Income Dynamic % Change in After-Tax Income
0% to 20% 0.0% 0.1%20% to 40% 0.0% 0.1%40% to 60% 0.0% 0.1%60% to 80% 0.0% 0.1%
80% to 100% 0.1% 0.2%90% to 100% 0.2% 0.2%99% to 100% 0.3% 0.4%
TOTAL 0.1% 0.1%

TAX FOUNDATION
105
PAYROLL TA
XES
When the Social Security payroll tax was enacted, in 1937, it only applied to an indi-vidual’s first $3,000 of labor earnings. Over the next few decades, this cap was raised several times by Congress, until it was finally indexed to wage inflation in 1977. The cap applies to payroll subject to the retirement and disability portions of the payroll tax (OASDI) but not to the Medicare portion.
Over the last 40 years, the share of all wages and salaries falling under the Social Security payroll tax cap has declined. In 1983, 90.0 percent of labor earnings were subject to Social Security payroll taxes. By 2013, this figure had fallen to 82.7 per-cent, or $5.9 trillion out of the $7.1 trillion in wages and salaries reported to the Social Security Administration.
This option would raise the Social Security payroll tax cap to $250,000 (on both the employer and employee side) and make corresponding changes to the self-employ-ment tax. On a static basis, this change would raise $807 billion in additional federal revenue over 10 years. However, it would also discourage work among high-income individuals, which would shrink the long-run size of the economy and lead to 605,000 fewer full-time equivalent. After taking these economic effects into account, this option would lead to $717 billion in additional revenue, on a dynamic basis.
As expected, this change would primarily affect Americans with incomes above $118,500, causing the after-tax incomes of the top 20 percent of taxpayers to decline by 0.9 percent. However, after taking the negative economic effects of the change into account, members of all income groups would see their after-tax incomes fall.
Income Group Static % Change in After-Tax Income Dynamic % Change in After-Tax Income
0% to 20% 0.0% -0.6%20% to 40% 0.0% -0.7%40% to 60% 0.0% -0.7%60% to 80% 0.0% -0.7%
80% to 100% -0.9% -1.5%90% to 100% -1.2% -1.9%99% to 100% -1.4% -2.1%
TOTAL -0.5% -1.2%
Economic Effects: Budgetary Effects:Long-Run Change in GDP: -0.6% Static 10-Year Revenue: $807B
Full-Time Equivalent Jobs: -605,000 Dynamic 10-Year Revenue: $717B
76. Raise the Social Security payroll tax cap to $250,000

OPTIONS FOR REFORMING AMERICA’S TAX CODEPA
YRO
LL T
AXE
S
106
While the most straightforward way to expand the Social Security Old Age, Survivors, and Disability Insurance (OASDI) payroll tax base is to raise the cap on taxable wages, some policymakers have proposed a different policy option: applying the Social Secu-rity payroll tax to income above $250,000.
Under this option, individuals would be subject to the Social Security OASDI payroll tax and self-employment tax on their first $118,500 of labor income, as well as all of their labor income above $250,000, but not any labor income in between these thresholds. In effect, this option would create a “donut hole” in the Social Security payroll tax.
Applying the Social Security OASDI payroll tax to income above $250,000 would raise $720 billion over 10 years, on a static basis. However, this would discourage work among high-income individuals, leading to a 0.5 percent smaller economy and 514,000 fewer full-time equivalent jobs in the long run. Taking these economic effects into account, this change would raise $635 billion over 10 years, on a dynamic basis.
While there are roughly 10 million workers with labor earnings above $118,500, there are only about 2 million workers with labor earnings above $250,000. As a result, this option would raise its revenue from an even smaller number of high-in-come Americans than the previous option. On a static basis, it would reduce the after-tax incomes of the top 1 percent of taxpayers by 2.8 percent.
Economic Effects: Budgetary Effects:Long-Run Change in GDP: -0.5% Static 10-Year Revenue: $720B
Full-Time Equivalent Jobs: -514,000 Dynamic 10-Year Revenue: $635B
77. Apply the Social Security payroll tax to wages and self-employment income above $250,000
Income Group Static % Change in After-Tax Income Dynamic % Change in After-Tax Income
0% to 20% 0.0% -0.5%20% to 40% 0.0% -0.5%40% to 60% 0.0% -0.6%60% to 80% 0.0% -0.5%
80% to 100% -0.9% -1.4%90% to 100% -1.2% -1.7%99% to 100% -2.8% -3.4%
TOTAL -0.5% -1.0%

TAX FOUNDATION
107
PAYROLL TA
XES
Removing the cap on the Social Security Old Age, Survivors, and Disability (OASDI) payroll tax (on both the employer and employee side) would raise a substantial amount of revenue: $1,5 trillion over 10 years, on a static basis. Such a significant tax increase would also have negative economic consequences: by discouraging work among high-income taxpayers, this option would lower long-run GDP by 1.2 percent and lead to 1.1 million fewer full-time equivalent jobs. Taking these economic effects into account, this provision would still raise $1,347 billion in additional revenue over 10 years, on a dynamic basis.
The bulk of the burden of this option would fall on high-income taxpayers, on a static basis: the top 20 percent of taxpayers would see their after-tax incomes decrease by 1.7 percent, while the after-tax incomes of the top 1 percent of taxpayers would decrease by 4.2 percent. However, on a dynamic basis, all groups of Americans would see their incomes decrease by at least 1.2 percent.
Two caveats apply to these figures, as well as to the estimates for the previous two options. First, it is likely that raising or eliminating the payroll tax cap would encour-age high-income Americans to recategorize their labor income to avoid payroll taxes; the Tax Foundation’s estimates do not take this behavioral response into account. Second, the revenue estimates shown above assume that Social Security benefits for high-income Americans would be held constant, even as their taxable earnings rise. Under current law, such a rise in taxable earnings would normally result in a larger benefit.
Income Group Static % Change in After-Tax Income Dynamic % Change in After-Tax Income
0% to 20% 0.0% -1.2%20% to 40% 0.0% -1.2%40% to 60% 0.0% -1.3%60% to 80% 0.0% -1.2%
80% to 100% -1.7% -2.9%90% to 100% -2.4% -3.6%99% to 100% -4.2% -5.5%
TOTAL -1.0% -2.2%
Economic Effects: Budgetary Effects:Long-Run Change in GDP: -1.2% Static 10-Year Revenue: $1,528B
Full-Time Equivalent Jobs: -1,121,000 Dynamic 10-Year Revenue: $1,347B
78. Remove the Social Security payroll tax cap
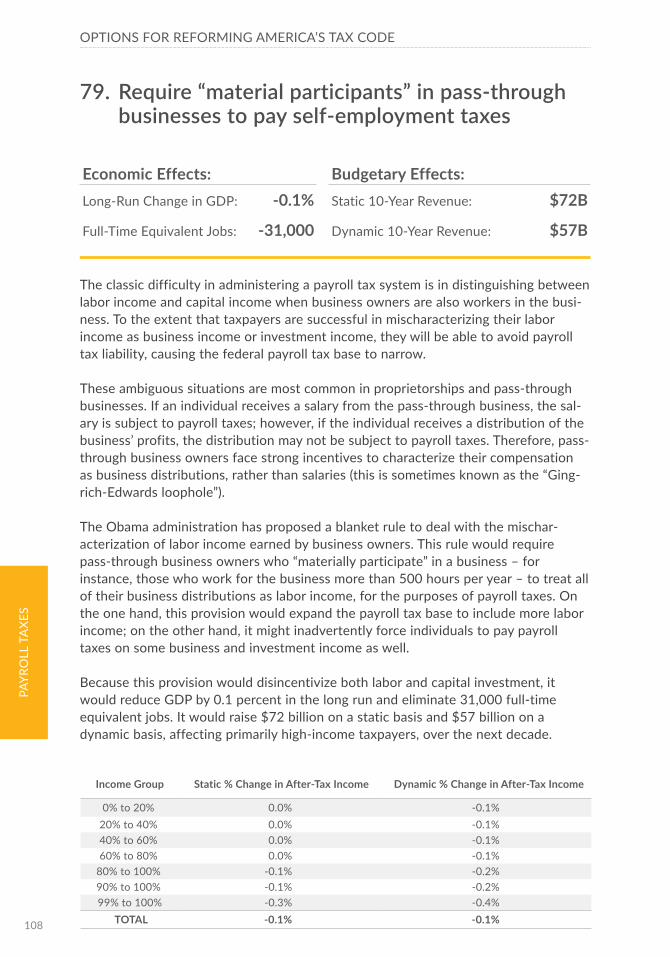
OPTIONS FOR REFORMING AMERICA’S TAX CODEPA
YRO
LL T
AXE
S
108
The classic difficulty in administering a payroll tax system is in distinguishing between labor income and capital income when business owners are also workers in the busi-ness. To the extent that taxpayers are successful in mischaracterizing their labor income as business income or investment income, they will be able to avoid payroll tax liability, causing the federal payroll tax base to narrow.
These ambiguous situations are most common in proprietorships and pass-through businesses. If an individual receives a salary from the pass-through business, the sal-ary is subject to payroll taxes; however, if the individual receives a distribution of the business’ profits, the distribution may not be subject to payroll taxes. Therefore, pass-through business owners face strong incentives to characterize their compensation as business distributions, rather than salaries (this is sometimes known as the “Ging-rich-Edwards loophole”).
The Obama administration has proposed a blanket rule to deal with the mischar-acterization of labor income earned by business owners. This rule would require pass-through business owners who “materially participate” in a business – for instance, those who work for the business more than 500 hours per year – to treat all of their business distributions as labor income, for the purposes of payroll taxes. On the one hand, this provision would expand the payroll tax base to include more labor income; on the other hand, it might inadvertently force individuals to pay payroll taxes on some business and investment income as well.
Because this provision would disincentivize both labor and capital investment, it would reduce GDP by 0.1 percent in the long run and eliminate 31,000 full-time equivalent jobs. It would raise $72 billion on a static basis and $57 billion on a dynamic basis, affecting primarily high-income taxpayers, over the next decade.
Economic Effects: Budgetary Effects:Long-Run Change in GDP: -0.1% Static 10-Year Revenue: $72B
Full-Time Equivalent Jobs: -31,000 Dynamic 10-Year Revenue: $57B
79. Require “material participants” in pass-through businesses to pay self-employment taxes
Income Group Static % Change in After-Tax Income Dynamic % Change in After-Tax Income
0% to 20% 0.0% -0.1%20% to 40% 0.0% -0.1%40% to 60% 0.0% -0.1%60% to 80% 0.0% -0.1%
80% to 100% -0.1% -0.2%90% to 100% -0.1% -0.2%99% to 100% -0.3% -0.4%
TOTAL -0.1% -0.1%
EXCISE TAXESCHAPTER 5
Cannon House Office Building

TAX FOUNDATION
111
EXCISE TA
XES
Introduction
One hundred years ago, almost half of all federal revenue came from excise taxes, such as taxes on liquor and tobacco (and a tax on a new invention called the tele-phone, enacted to help fund the Spanish American War). Today, excise taxes account for only 3 percent of federal revenue. In 2013, the excise tax that raised the most revenue was the gasoline tax ($25 billion.) A variety of different taxes on tobacco ($14 billion) airports ($12 billion) and alcohol ($10 billion) also raise substantial reve-nue. (And the telephone tax is still with us.)
Many excise taxes are dedicated to funding specific federal programs. For instance, taxes on gasoline, diesel, tires, and trucks are dedicated to the federal Highway Trust Fund for transportation projects.
The Affordable Care Act included several new excise taxes, to help fund the cost of the bill. Some of these provisions, such as taxes on tanning salons and health insur-ance providers, have already gone into effect. Others, such as the Cadillac Tax (on high-premium health insurance plans) and the medical device tax, are set to take effect in the next few years.
Selective, narrowly-based excise taxes distort production and consumption patterns. Indeed, policymakers sometimes look to excise taxes as policy instruments for influ-encing individual decision-making. For instance, tobacco taxes are often seen as a way to discourage smoking. However, the more successful excise taxes are at dis-couraging an economic activity, the less revenue they will raise, and vice versa.
Many economists believe that narrowly-based excise taxes are an inefficient source of revenue, because they distort individual decision-making. However, the more broadly an excise tax applies throughout the economy, the more it looks like a con-sumption tax, and the less economic harm it causes.
The major justification for selective excise taxes is to deal with market failures in which the activity in question imposes costs on other parties that are not reflected in the price of the product. While theoretically treatable, such situations are hard to recognize and difficult to measure, and it is difficult to design a precise tax correction for the perceived pricing error.
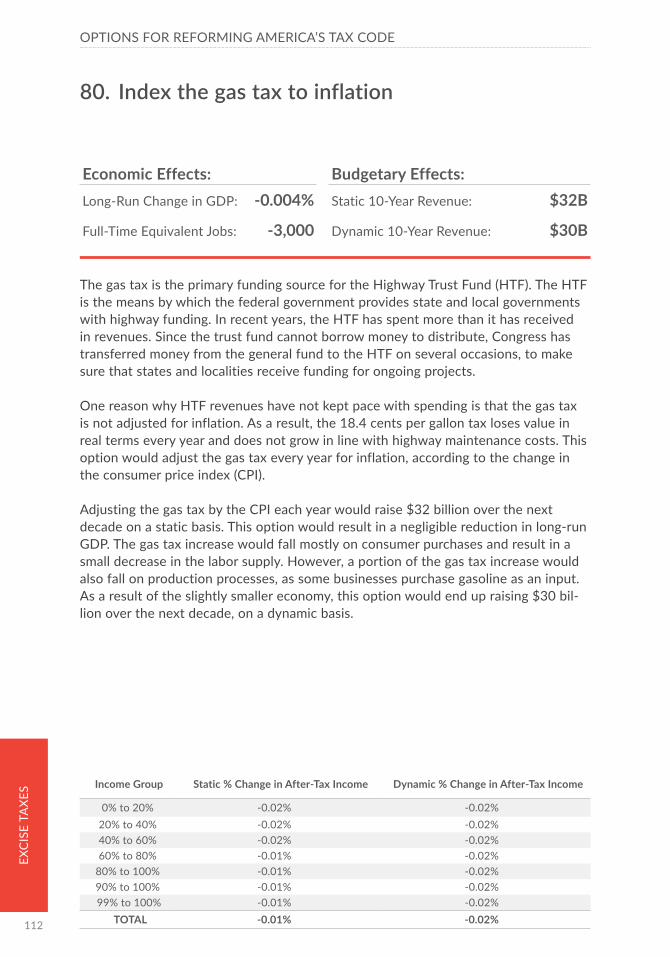
OPTIONS FOR REFORMING AMERICA’S TAX CODEEX
CIS
E TA
XES
112
The gas tax is the primary funding source for the Highway Trust Fund (HTF). The HTF is the means by which the federal government provides state and local governments with highway funding. In recent years, the HTF has spent more than it has received in revenues. Since the trust fund cannot borrow money to distribute, Congress has transferred money from the general fund to the HTF on several occasions, to make sure that states and localities receive funding for ongoing projects.
One reason why HTF revenues have not kept pace with spending is that the gas tax is not adjusted for inflation. As a result, the 18.4 cents per gallon tax loses value in real terms every year and does not grow in line with highway maintenance costs. This option would adjust the gas tax every year for inflation, according to the change in the consumer price index (CPI).
Adjusting the gas tax by the CPI each year would raise $32 billion over the next decade on a static basis. This option would result in a negligible reduction in long-run GDP. The gas tax increase would fall mostly on consumer purchases and result in a small decrease in the labor supply. However, a portion of the gas tax increase would also fall on production processes, as some businesses purchase gasoline as an input. As a result of the slightly smaller economy, this option would end up raising $30 bil-lion over the next decade, on a dynamic basis.
Economic Effects: Budgetary Effects:Long-Run Change in GDP: -0.004% Static 10-Year Revenue: $32B
Full-Time Equivalent Jobs: -3,000 Dynamic 10-Year Revenue: $30B
80. Index the gas tax to inflation
Income Group Static % Change in After-Tax Income Dynamic % Change in After-Tax Income
0% to 20% -0.02% -0.02%20% to 40% -0.02% -0.02%40% to 60% -0.02% -0.02%60% to 80% -0.01% -0.02%
80% to 100% -0.01% -0.02%90% to 100% -0.01% -0.02%99% to 100% -0.01% -0.02%
TOTAL -0.01% -0.02%

TAX FOUNDATION
113
EXCISE TA
XES
Adjusting the gas tax to inflation would be one step towards bringing the Highway Trust Fund’s (HTF) revenues in line with its outlays. However, the current revenues from the gas tax are insufficient to meet the HTF obligations. In order to fund these obligations, Congress would need to reduce the level of spending or increase the trust fund’s revenues.
This option would raise the gas tax by 10 cents a gallon, to 28.4 cents, and adjust it for inflation going forward, using the Consumer Price Index (CPI). This would raise $170 billion over the next decade, on a static basis.
This option would result in a negligible reduction in long-run GDP, of 0.1 percent. The gas tax increase would fall mostly on consumer purchases and result in a small decrease in the labor supply. However, a portion of the gas tax increase would also fall on production processes, as some businesses purchase gasoline as an input. Along with the smaller economy, 45,000 full-time equivalent would be lost, in the long run. As a result of the slightly smaller economy, this option would end up raising $123 bil-lion over the next decade, on a dynamic basis.
Taxpayers in the bottom four quintiles would see a 0.08 to 0.09 percent reduction in after-tax income, while the after-tax income of taxpayers in the top quintile would fall by 0.07 percent. On a dynamic basis, all income groups would see an even larger reduction in after-tax income, due to the smaller economy.
Income Group Static % Change in After-Tax Income Dynamic % Change in After-Tax Income
0% to 20% -0.08% -0.23%20% to 40% -0.09% -0.24%40% to 60% -0.09% -0.24%60% to 80% -0.08% -0.24%
80% to 100% -0.07% -0.23%90% to 100% -0.07% -0.22%99% to 100% -0.07% -0.21%
TOTAL -0.08% -0.21%
Economic Effects: Budgetary Effects:Long-Run Change in GDP: -0.1% Static 10-Year Revenue: $170B
Full-Time Equivalent Jobs: -45,000 Dynamic 10-Year Revenue: $123B
81. Raise the gas tax to 28.4 cents per gallon and adjust it to inflation, going forward

OPTIONS FOR REFORMING AMERICA’S TAX CODEEX
CIS
E TA
XES
114
In addition to offsetting the outlays of the Highway Trust Fund (HTF), the gas tax also puts a price on driving on the road. The costs of driving include not only the direct costs of road repairs, but also indirect social costs, such as congestion, noise, and pol-lution. If lawmakers believe that the gas tax should be raised in order to offset all of the costs of driving on the road, direct and social, they may consider raising the tax to $0.50 a gallon.
Raising the gas tax to $0.50 a gallon would generate $306 billion over the next decade, on a static basis. It would also reduce GDP by 0.2 percent in the long run. The higher gas tax would decrease the labor supply, reducing full-time equivalent jobs by 81,000. However, a portion of the gas tax increase would also fall on produc-ers, as some businesses purchase gasoline as an input, which would result in a trivial increase in the cost of capital. As a result of the smaller economy, this option would end up raising $220 billion over the next decade, on a dynamic basis.
A gas tax is a broad-based tax that falls mostly on consumers. As a result, a gas tax increase would affect taxpayers in all income groups and would be slightly regressive. Taxpayers in the bottom four quintiles would see a 0.14 to 0.15 percent reduction in after-tax income, while the after-tax income of taxpayers in the top quintile would fall by slightly less. On a dynamic basis, households at all income levels would see an even larger reduction in after-tax income, due to the smaller economy.
Economic Effects: Budgetary Effects:Long-Run Change in GDP: -0.2% Static 10-Year Revenue: $306B
Full-Time Equivalent Jobs: -81,000 Dynamic 10-Year Revenue: $220B
82. Raise the gas tax to 50 cents per gallon and adjust it to inflation, going forward
Income Group Static % Change in After-Tax Income Dynamic % Change in After-Tax Income
0% to 20% -0.14% -0.41%20% to 40% -0.15% -0.42%40% to 60% -0.15% -0.42%60% to 80% -0.14% -0.39%
80% to 100% -0.12% -0.38%90% to 100% -0.12% -0.38%99% to 100% -0.11% -0.40%
TOTAL -0.13% -0.39%
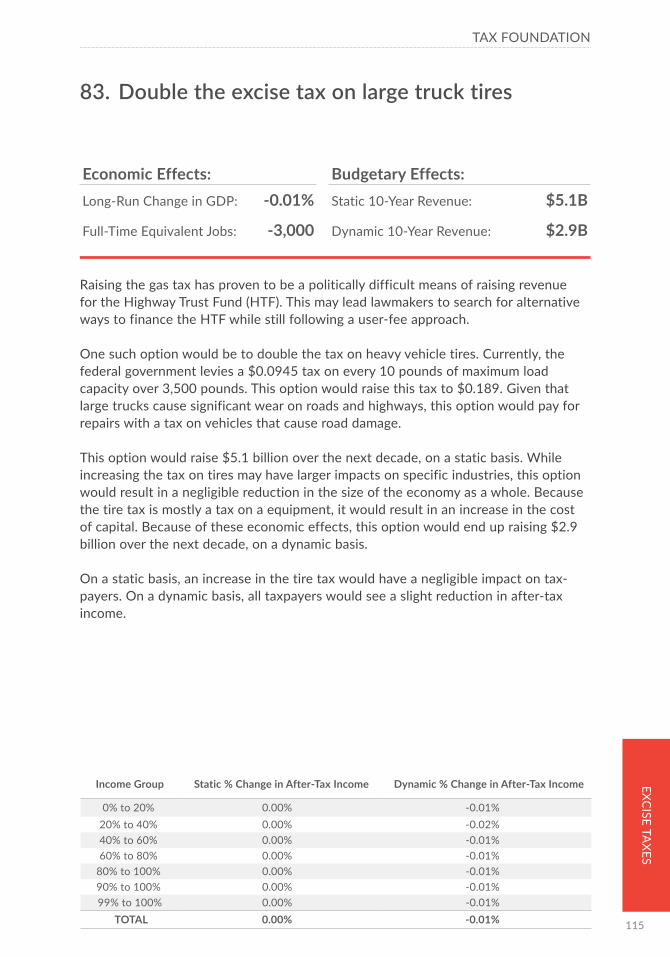
TAX FOUNDATION
115
EXCISE TA
XES
Raising the gas tax has proven to be a politically difficult means of raising revenue for the Highway Trust Fund (HTF). This may lead lawmakers to search for alternative ways to finance the HTF while still following a user-fee approach.
One such option would be to double the tax on heavy vehicle tires. Currently, the federal government levies a $0.0945 tax on every 10 pounds of maximum load capacity over 3,500 pounds. This option would raise this tax to $0.189. Given that large trucks cause significant wear on roads and highways, this option would pay for repairs with a tax on vehicles that cause road damage.
This option would raise $5.1 billion over the next decade, on a static basis. While increasing the tax on tires may have larger impacts on specific industries, this option would result in a negligible reduction in the size of the economy as a whole. Because the tire tax is mostly a tax on a equipment, it would result in an increase in the cost of capital. Because of these economic effects, this option would end up raising $2.9 billion over the next decade, on a dynamic basis.
On a static basis, an increase in the tire tax would have a negligible impact on tax-payers. On a dynamic basis, all taxpayers would see a slight reduction in after-tax income.
Income Group Static % Change in After-Tax Income Dynamic % Change in After-Tax Income
0% to 20% 0.00% -0.01%20% to 40% 0.00% -0.02%40% to 60% 0.00% -0.01%60% to 80% 0.00% -0.01%
80% to 100% 0.00% -0.01%90% to 100% 0.00% -0.01%99% to 100% 0.00% -0.01%
TOTAL 0.00% -0.01%
Economic Effects: Budgetary Effects:Long-Run Change in GDP: -0.01% Static 10-Year Revenue: $5.1B
Full-Time Equivalent Jobs: -3,000 Dynamic 10-Year Revenue: $2.9B
83. Double the excise tax on large truck tires

OPTIONS FOR REFORMING AMERICA’S TAX CODEEX
CIS
E TA
XES
116
Due to concerns about carbon emissions and global climate change, some lawmakers have proposed enacting a carbon tax. A carbon tax is a tax levied on the manufacture of certain carbon-based fuels. The level of the tax would vary based on how much carbon is emitted by each fuel when burned.
In economic theory, a carbon tax is often thought of as a “Pigouvian tax”: a tax designed to make businesses and individuals shoulder the social costs they create that are not reflected in the price of the product. For instance, a producer and a con-sumer generally agree on a price based on the cost of production and the consumer’s willingness to pay. However, the price may not take into account the social costs of production if the manufacturing process creates air pollution, harming unrelated par-ties. Lawmakers may wish to levy Pigouvian taxes on economic activities that create especially high social costs.
This option would levy a tax of $20 per metric ton of carbon produced through the use of fossil fuels, such as oil and coal; this amount would increase by 5 percent each year. A tax of this size would raise $1.3 trillion over the next decade, on a static basis.
A carbon tax would have a small but meaningful impact on the economy. It would result in a 0.8 percent smaller GDP in the long run and 425,000 fewer full-time equivalent jobs. While a carbon tax would hit taxpayers in all income groups, it would lead to a slightly larger tax increase on low-income households. Taxpayers in the bot-tom four quintiles would see a 0.7 to 0.8 percent reduction in after-tax income, while the after-tax income of taxpayers in the top quintile would fall by 0.6 percent. On a dynamic basis, households in all income groups would see their after-tax income fall by at least 2.0 percent, due to the smaller economy.
Economic Effects: Budgetary Effects:Long-Run Change in GDP: -0.8% Static 10-Year Revenue: $1,327B
Full-Time Equivalent Jobs: -425,000 Dynamic 10-Year Revenue: $857B
84. Enact a $20 per ton carbon tax
Income Group Static % Change in After-Tax Income Dynamic % Change in After-Tax Income
0% to 20% -0.8% -2.2%20% to 40% -0.7% -2.1%40% to 60% -0.8% -2.2%60% to 80% -0.7% -2.1%
80% to 100% -0.7% -2.0%90% to 100% -0.6% -2.0%99% to 100% -0.6% -2.1%
TOTAL -0.7% -2.1%

TAX FOUNDATION
117
EXCISE TA
XES
The medical device tax is a 2.3 percent excise tax on the total sales of medical devices, levied on medical device manufacturers. The tax does not apply to certain devices purchased directly by the general public, such as eyeglasses and hearing aids.
Passed as part of the Patient Protection and Affordable Care Act, the medical device tax went into effect in January 2013. However, near the end of 2015, Congress placed a two-year moratorium on the tax, suspending it between January 2016 and December 2017.
This option would repeal the medical device tax permanently. Over the budget win-dow, this would reduce federal revenue by $21 billion, or roughly $2.6 billion for each of the eight years during which the tax is currently scheduled to be in effect, on a static basis. This change would increase after-tax incomes by 0.01 percent for all income groups.
Because the medical device tax falls on the labor and capital used to create medical devices, and the labor and capital income of those who purchase them, repealing it would grow the capital stock and increase the long-run size of the U.S. economy by 0.02 percent. This would reduce the revenue loss of this option to $15 billion over 10 years, on a dynamic basis.
Economic Effects: Budgetary Effects:Long-Run Change in GDP: 0.02% Static 10-Year Revenue: -$21B
Full-Time Equivalent Jobs: 12,000 Dynamic 10-Year Revenue: -$15B
85. Repeal the Medical Device Tax
Income Group Static % Change in After-Tax Income Dynamic % Change in After-Tax Income
0% to 20% 0.01% 0.04%20% to 40% 0.01% 0.03%40% to 60% 0.01% 0.04%60% to 80% 0.01% 0.03%
80% to 100% 0.01% 0.03%90% to 100% 0.01% 0.03%99% to 100% 0.01% 0.03%
TOTAL 0.01% 0.03%

OPTIONS FOR REFORMING AMERICA’S TAX CODEEX
CIS
E TA
XES
118
The Cadillac Tax is an excise tax on employers who offer high-premium healthcare plans. When the tax goes into effect, employers will be required to pay a 40 percent tax on the “excess benefit” of each healthcare plan – the portion of the premium that exceeds $10,200 for individuals and $27,500 for families. These thresholds are set to rise with overall inflation, rather than healthcare inflation, so more and more health-care plans will be subject to the Cadillac Tax over time.
The Cadillac Tax was passed as part of the Patient Protection and Affordable Care Act and was originally set to take effect in 2018. However, at the end of 2015, Congress delayed the start date of the tax to 2020.
This option would repeal the Cadillac Tax permanently. Over the budget window, this would reduce federal revenue by $31 billion, on a static basis, or about $5 billion for each of the six years during which the tax is currently scheduled to be in effect. Repealing the Cadillac Tax would lower the cost of labor, increasing the labor supply and growing GDP by 0.03 percent. After taking these economic changes into account, repeal of the Cadillac Tax would reduce federal revenue by $26 billion over the bud-get window, on a dynamic basis.
Repealing the Cadillac Tax would benefit middle-income taxpayers more than any other income group, increasing their after-tax incomes by 0.07 to 0.08 percent on a static basis and 0.11 to 0.13 percent on a dynamic basis.
Income Group Static % Change in After-Tax Income Dynamic % Change in After-Tax Income
0% to 20% 0.04% 0.09%20% to 40% 0.07% 0.12%40% to 60% 0.08% 0.13%60% to 80% 0.07% 0.11%
80% to 100% 0.05% 0.10%90% to 100% 0.05% 0.09%99% to 100% 0.02% 0.07%
TOTAL 0.05% 0.10%
Economic Effects: Budgetary Effects:Long-Run Change in GDP: 0.03% Static 10-Year Revenue: -$31B
Full-Time Equivalent Jobs: 18,000 Dynamic 10-Year Revenue: -$26B
86. Repeal the Cadillac Tax

About the Tax Foundation
The Tax Foundation is the nation’s leading independent tax policy research organization. Since 1937, our research, analysis, and experts have informed smarter tax policy at the federal, state, and local levels. Our Center for Federal Tax Policy’s research and outreach highlight our tax code’s strengths and weaknesses and show how tax policy impacts taxpayers, the government, and the economy at large.
Center for Federal Tax Policy Publications
Scott A. Hodge Rachel L. Shuster President Editor
Kyle Pomerleau Dan Carvajal Director of Federal Projects Designer
Stephen J. Entin Senior Fellow
Michael Schuyler, PhD Senior Fellow
Huaqun Li, PhD Economist
W. Gavin Ekins, PhD Research Economist
Alan Cole Economist
Scott Greenberg Analyst
Alex J. Durante Taxes and Growth Fellow
Kadri Kallas-Zelek, PhD Taxes and Growth Fellow


There is a widespread consensus among Americans across the political spectrum that the U.S. tax system is overly complex, inefficient, uncompetitive, and due for an overhaul. As a result, many U.S. policymakers have expressed a desire for comprehensive tax reform in the near future.
To assist lawmakers in assembling tax reform bills over the coming months, and to help the American public in understanding the tax changes being proposed, we’ve assembled this book: a collection of 86 commonly proposed changed to the U.S. tax code that might be part of a future tax reform bill. Over the past few months, our team of economists have modeled the effects of each option on federal revenue, the distribution of the tax burden, and the U.S. economy.
It is becoming increasingly clear that tax reform is a once-in-a-generation opportunity. We hope that this book helps policymakers get it right.
The Tax Foundation is the nation’s leading independent tax policy research organization. Since 1937, our research, analysis, and experts have informed smarter tax policy at the federal, state, and local levels. We are a 501(c)(3) non-profit organization.
©2016 Tax Foundation
Tax Foundation1325 G Street NW, Suite 950Washington, DC 20005202.464.6200
taxfoundation.org