oracle enterprise manager “test drive†hands on lab
TRANSCRIPT
O
Oracle Enterprise Manager Cloud Control 12c
Oracle Enterprise Manager “Test Drive” Hands On Lab Session ID 33300

Page 1 of 32
ORACLE ENTERPRISE MANAGER Cloud Control 12c Test Drive Hands-on Lab
Safe Harbor statement:
All information provided outlines our general product direction. It's intended for
information purposes only, and may not be incorporated into any contract. It is not a
commitment to deliver any material, code or functionality, and should not be relied
upon in making a purchasing decision. The development, release, and timing of any
features or functionality described for Oracle's products remains at the sole discretion
of Oracle.

Page 2 of 32
ORACLE ENTERPRISE MANAGER Cloud Control 12c Overview and Framework Labb
Section I ‐ Enterprise Manager Overview and
Framework
A. Enterprise Manager Cloud Control Console
B. Incident Manager
C. Self Update

Page 3 of 32
ORACLE ENTERPRISE MANAGER Cloud Control 12c Overview and Framework Labb
A. Console Lab (Estimated Time: 8 minutes)
The objective is to provide an overview of the UI and use some of the general navigation features.
1. Select Home
You can personalize Enterprise Manager with your choice of a home page. The home page is displayed whenever you log in. When you log in to Oracle Enterprise Manager for the first time, the Select Enterprise Manager Home screen is displayed. You can select a home page from here, or you can select a home page later.
1.1 Launch browser and click on the Enterprise Manager 12.1 bookmark or go to http://em12.oracle.com:7000/em
1.2 Login using username and password oracle[1‐4] / oracle12
Note ‐ Exact login will be provided by the lab instructors e.g. oracle1 /oracle12 or oracle2 /oracle12
Page 4 of 32
ORACLE ENTERPRISE MANAGER Cloud Control 12c Overview and Framework Labb
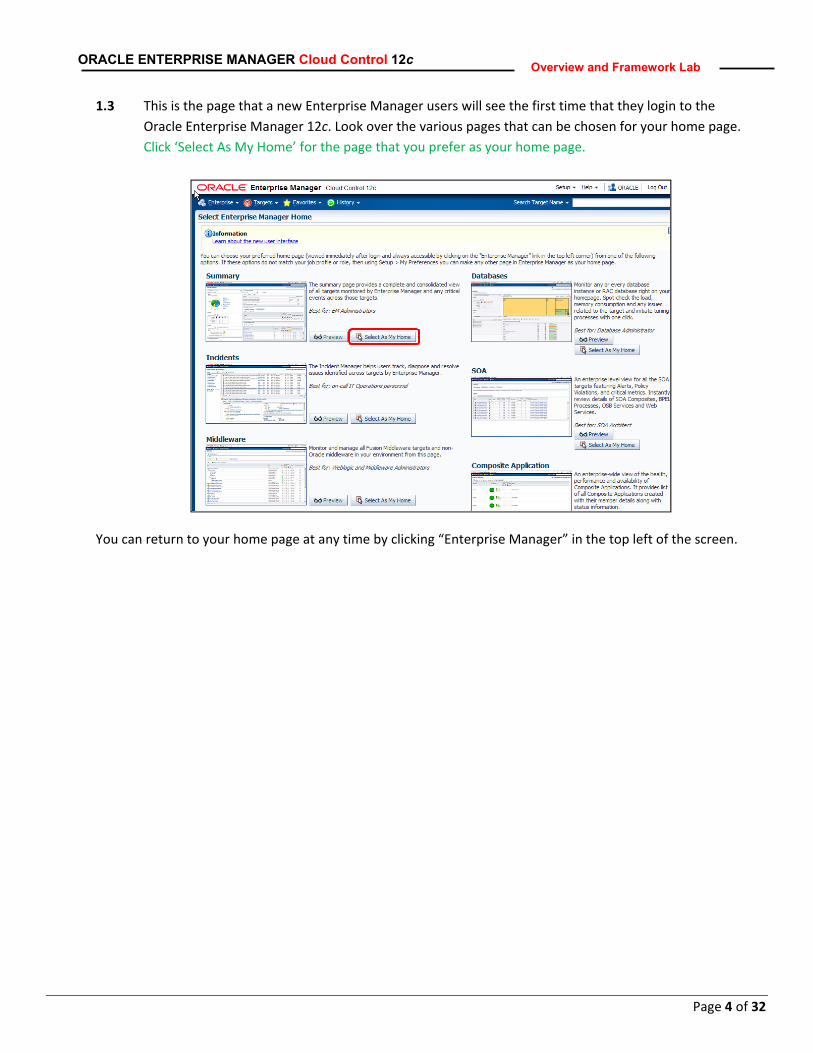
1.3 This is the page that a new Enterprise Manager users will see the first time that they login to the Oracle Enterprise Manager 12c. Look over the various pages that can be chosen for your home page. Click ‘Select As My Home’ for the page that you prefer as your home page.
You can return to your home page at any time by clicking “Enterprise Manager” in the top left of the screen.

Page 5 of 32
ORACLE ENTERPRISE MANAGER Cloud Control 12c Overview and Framework Labb
2. Familiarize Yourself with Menu‐Based Navigation
Menus are the primary way of navigating Enterprise Manager. Take a couple of minutes to look over the global menus that are located at the top of the screen: Enterprise, Targets, Favorites, History, Setup and Help. Get a sense of the items that are available, and how the menu items are organized.
The global menus are always available, and can be used to quickly navigate to key areas in Enterprise Manager.
2.1 In the History menu, select ‘em12.oracle.com’
This will take you to the home page for this Host target.
Note ‐The History menu provides quick access to the 10 targets that you’ve most recently visited.
Page 6 of 32
ORACLE ENTERPRISE MANAGER Cloud Control 12c Overview and Framework Labb
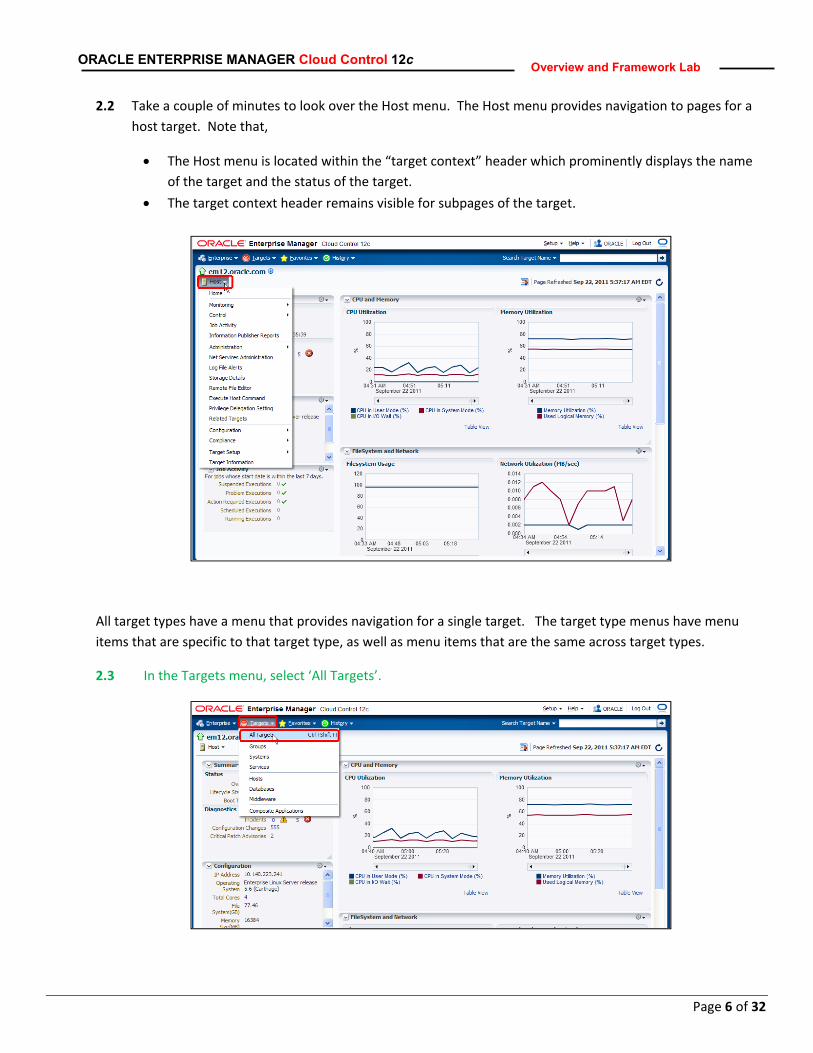
2.2 Take a couple of minutes to look over the Host menu. The Host menu provides navigation to pages for a host target. Note that,
• The Host menu is located within the “target context” header which prominently displays the name of the target and the status of the target.
• The target context header remains visible for subpages of the target.
All target types have a menu that provides navigation for a single target. The target type menus have menu items that are specific to that target type, as well as menu items that are the same across target types.
2.3 In the Targets menu, select ‘All Targets’.

Page 7 of 32
ORACLE ENTERPRISE MANAGER Cloud Control 12c Overview and Framework Labb
In the table on the right side you can view the list of targets.
2.4 You can use the context menu (right‐click menu) from the All Targets page to go directly to a subpage for target.
Right‐click on a target and look at the target type menu that is displayed.
From the right‐mouse menu for a target, select Monitoring ‐> All Metrics.

Page 8 of 32
ORACLE ENTERPRISE MANAGER Cloud Control 12c Overview and Framework Labb
3. Finding Targets
You can find targets in various ways.
3.1 Using the Search Target Name control in the upper right corner of the screen, search for AdminServer.
The search results are shown on the All Targets page. Note that the Refine Search panel on the left shows several subcategories with target counts. Tip : You can also navigate directly to the All Targets page from the Target menu.
3.2 Using the Refine Search panel on the left, click Oracle WebLogic Server.
Now your search results contain all of the Oracle WebLogic Server targets named AdminServer
Page 9 of 32
ORACLE ENTERPRISE MANAGER Cloud Control 12c Overview and Framework Labb
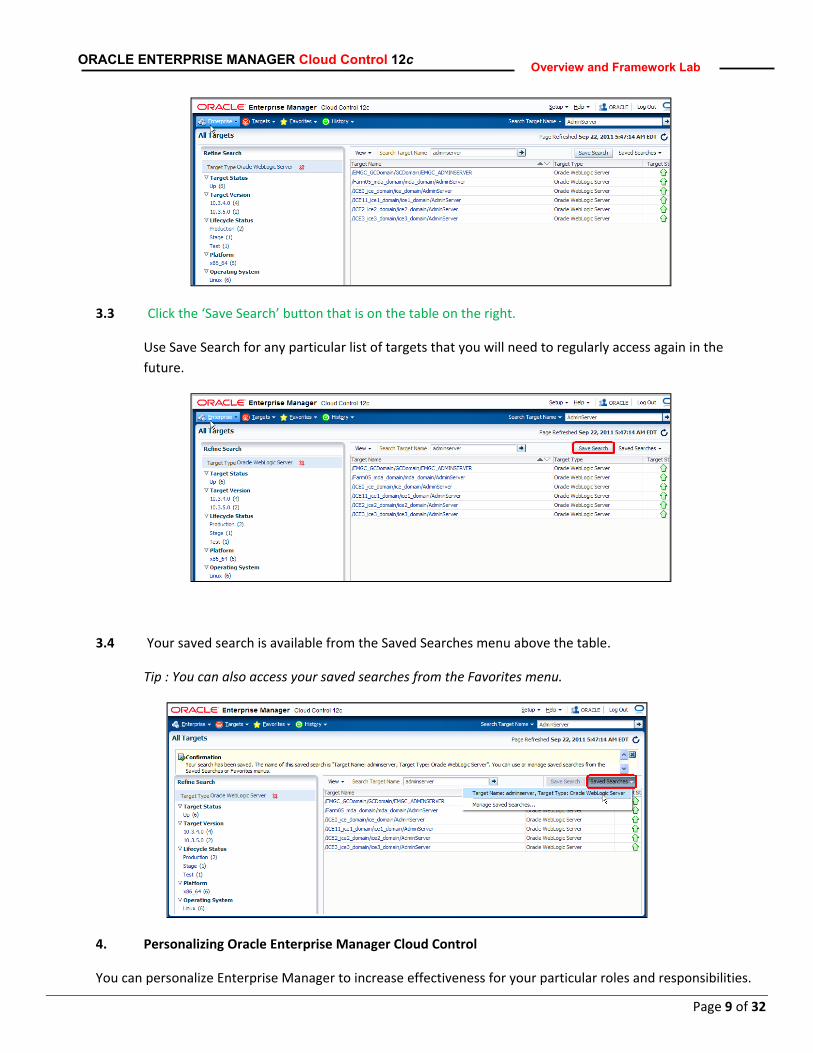
3.3 Click the ‘Save Search’ button that is on the table on the right.
Use Save Search for any particular list of targets that you will need to regularly access again in the future.
3.4 Your saved search is available from the Saved Searches menu above the table.
Tip : You can also access your saved searches from the Favorites menu.
4. Personalizing Oracle Enterprise Manager Cloud Control
You can personalize Enterprise Manager to increase effectiveness for your particular roles and responsibilities.

Page 10 of 32
ORACLE ENTERPRISE MANAGER Cloud Control 12c Overview and Framework Labb
4.1 In the History menu, select em12.oracle.com. This will take you to the home page for this Host target.
4.2 On the right side, you’ll see the two sections CPU and Memory and File System and Network.
Drag the File System and Network section up to move it before the CPU and Memory section.
4.3 Click the Personalize Page icon button that is located at the top right of the page, to the left of Page Refresh information.

Page 11 of 32
ORACLE ENTERPRISE MANAGER Cloud Control 12c Overview and Framework Labb
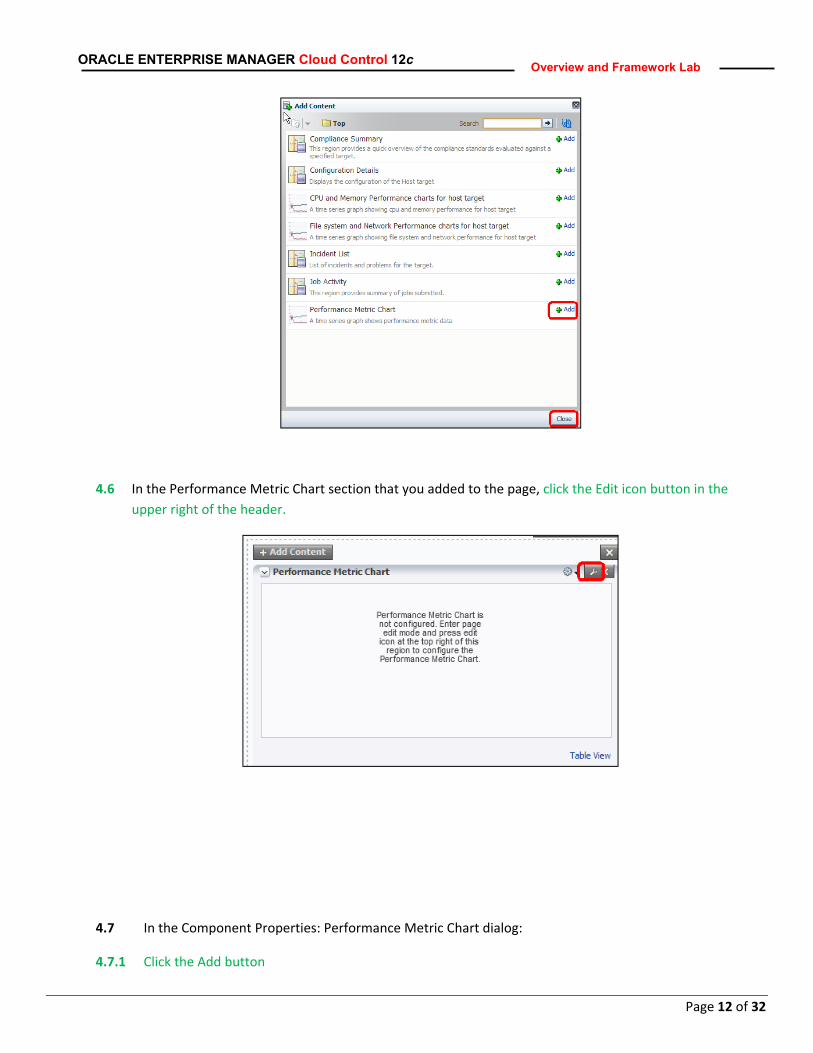
4.4 Click either of the ‘Add Content’ buttons.
4.5 In the Add Content dialog, click the ‘Add’ button for ‘Performance Metric Chart’ followed by a click on ‘Close’ button.
Page 12 of 32
ORACLE ENTERPRISE MANAGER Cloud Control 12c Overview and Framework Labb
4.6 In the Performance Metric Chart section that you added to the page, click the Edit icon button in the upper right of the header.
4.7 In the Component Properties: Performance Metric Chart dialog:
4.7.1 Click the Add button

Page 13 of 32
ORACLE ENTERPRISE MANAGER Cloud Control 12c Overview and Framework Labb
4.7.2 In the Add dialog, in the Metric Palette, expand Network Interfaces Summary
Select the following 2 metrics • All Network Interfaces Read Rate • All Network Interfaces Write Rate Click OK to close the Add dialog.

Page 14 of 32
ORACLE ENTERPRISE MANAGER Cloud Control 12c Overview and Framework Labb
4.7.3 In the Title edit box, enter Network Interfaces and Click OK
4.8 At the top of the page, in the header bar that have Editing Page: …, click the Close button that is on the right side.
The personalization you made to this host home page applies to all host home pages
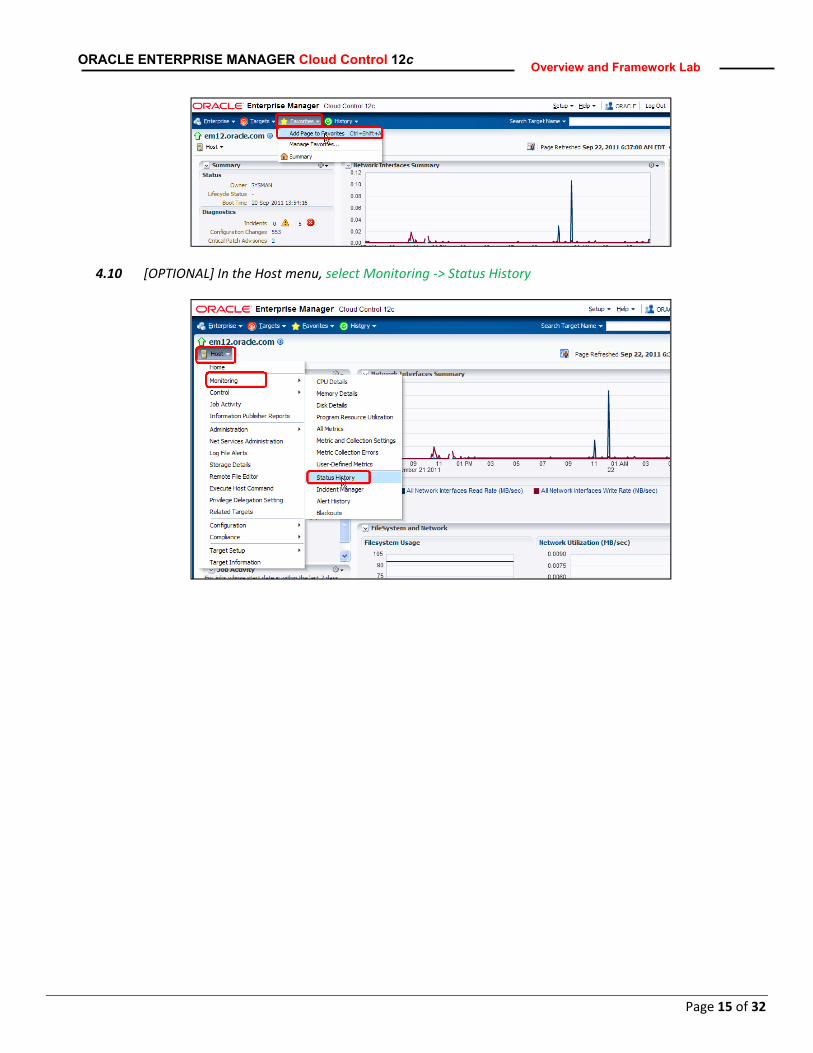
4.9 [OPTIONAL] In the Favorites menu, select Add Page to Favorites.
Page 15 of 32
ORACLE ENTERPRISE MANAGER Cloud Control 12c Overview and Framework Labb
4.10 [OPTIONAL] In the Host menu, select Monitoring ‐> Status History
Page 16 of 32
ORACLE ENTERPRISE MANAGER Cloud Control 12c Overview and Framework Labb
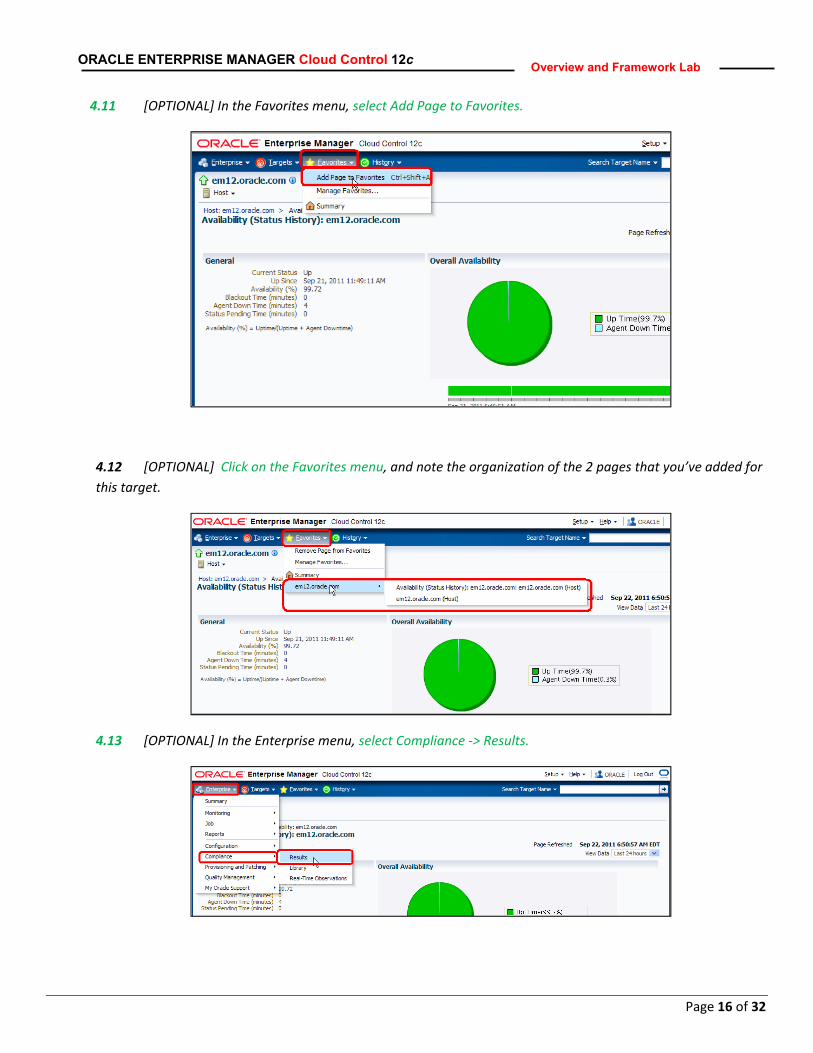
4.11 [OPTIONAL] In the Favorites menu, select Add Page to Favorites.
4.12 [OPTIONAL] Click on the Favorites menu, and note the organization of the 2 pages that you’ve added for this target.
4.13 [OPTIONAL] In the Enterprise menu, select Compliance ‐> Results.

Page 17 of 32
ORACLE ENTERPRISE MANAGER Cloud Control 12c Overview and Framework Labb
4.14 [OPTIONAL] In the Setup menu, select My Preferences ‐> Set Current Page as My Home.
You can set any page as your home page. Your home page is shown whenever you log in to Enterprise Manager. You can also quickly navigate to your home page by selecting the home item from the Favorites menu, or by clicking Enterprise Manager in the upper left banner.
4.15 Click on ‘Logout’ button. For rest of the labs, you’ll login as ‘oracle’ user.

Page 18 of 32
ORACLE ENTERPRISE MANAGER Cloud Control 12c Overview and Framework Labb
B. Incident Management (Estimated Time: 8 minutes)
Incident Management is a new functional area in Oracle Enterprise Manager that builds upon our existing monitoring capabilities. The main goal of incident management is to enable you to monitor and resolve service disruptions quickly by business priority. Instead of managing numerous discrete events, this feature enables you to create and manage a fewer set of incidents. An incident object can be created for important events (e.g. an incident for a target down event) or an incident can be created containing a group of related events that pertain to the same issue (e.g. create one incident for high load on a host server when CPU utilization and memory utilization events occur). Oracle Enterprise Manager also provides features to assign, track, diagnose and resolve the incidents. 1. Accessing the Incident Manager console
The Incident Manager console provides a centralized way to manage incidents and problems detected in your Enterprise Manager environment. Problems represent the root cause of incidents caused by Oracle software errors and they can also be managed in Incident Manager. In this scenario, you’re an administrator responsible for the incidents and problems on the targets in the group “PROD‐GROUP”. For this exercise you will be reviewing some incidents and problems raised on the targets in PROD‐GROUP.
1.1. Login using username and password oracle / oracle12
1.2. Navigate to menu options Enterprise Monitoring Incident Manager
1.3. You’ll be taken to ‘PROD‐GROUP Incidents’ view

Page 19 of 32
ORACLE ENTERPRISE MANAGER Cloud Control 12c Overview and Framework Labb
Incident Manager allows you to see all the incidents and problems in your managed environment. In order for you to focus on the subset of incidents and problems for the specific targets you own, you can create Views that filter the set of incidents/problems. The ‘PROD‐GROUP Incidents” view has been pre‐created in this lab environment to show you only the subset of incidents on the group PROD‐GROUP. In the left pane you’ll notice the standard views which are out‐of‐box views that enable you to focus on some typical subsets of incidents and problems. Also below the standard views you’ll notice option to create custom views like the one pre‐created here. Once you’ve selected the view “PROD‐GROUP Incidents”, the list of incidents in this view will be shown on the right.
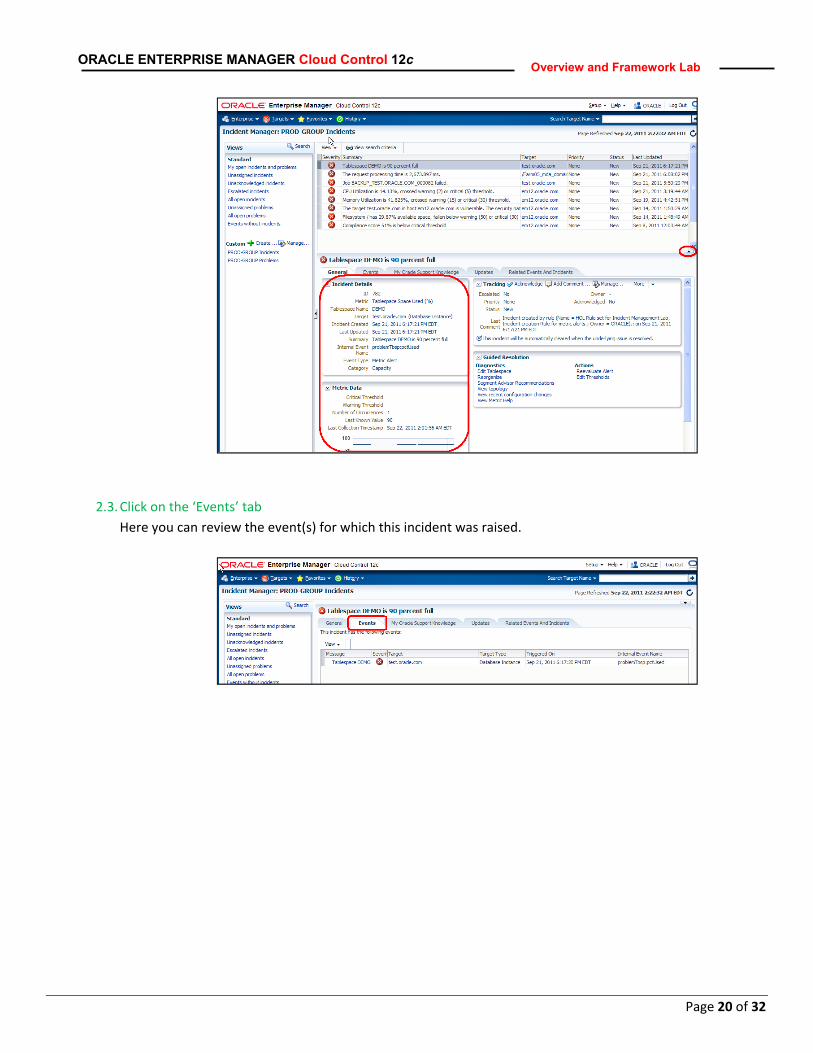
2. Reviewing and working on Incidents 2.1. You’ll first work on the tablespace full incident. Click on the ‘Tablespace DEMO is 90 percent full’ incident.
2.2. Review the general details in the lower pane. Collapse the upper pane by clicking the ( ) icon.
Page 20 of 32
ORACLE ENTERPRISE MANAGER Cloud Control 12c Overview and Framework Labb
2.3. Click on the ‘Events’ tab Here you can review the event(s) for which this incident was raised.

Page 21 of 32
ORACLE ENTERPRISE MANAGER Cloud Control 12c Overview and Framework Labb
2.4. Click on the General tab and review and update the Incident ‘Tracking’ section. You’ll now take ownership of this incident and set its tracking status to let your co‐administrators know that you’ll be working on it.
2.4.1. Click on the ‘Acknowledge’ link to quickly acknowledge and take ownership of the incident. Next you’ll set the rest of the values here.
2.4.2. In the ‘Tracking’ section, click on ‘Manage’ button
2.4.3. Change the following settings and click OK.
Status : Work in Progress Priority : High Comments Add a comment like “I’m looking into this”.
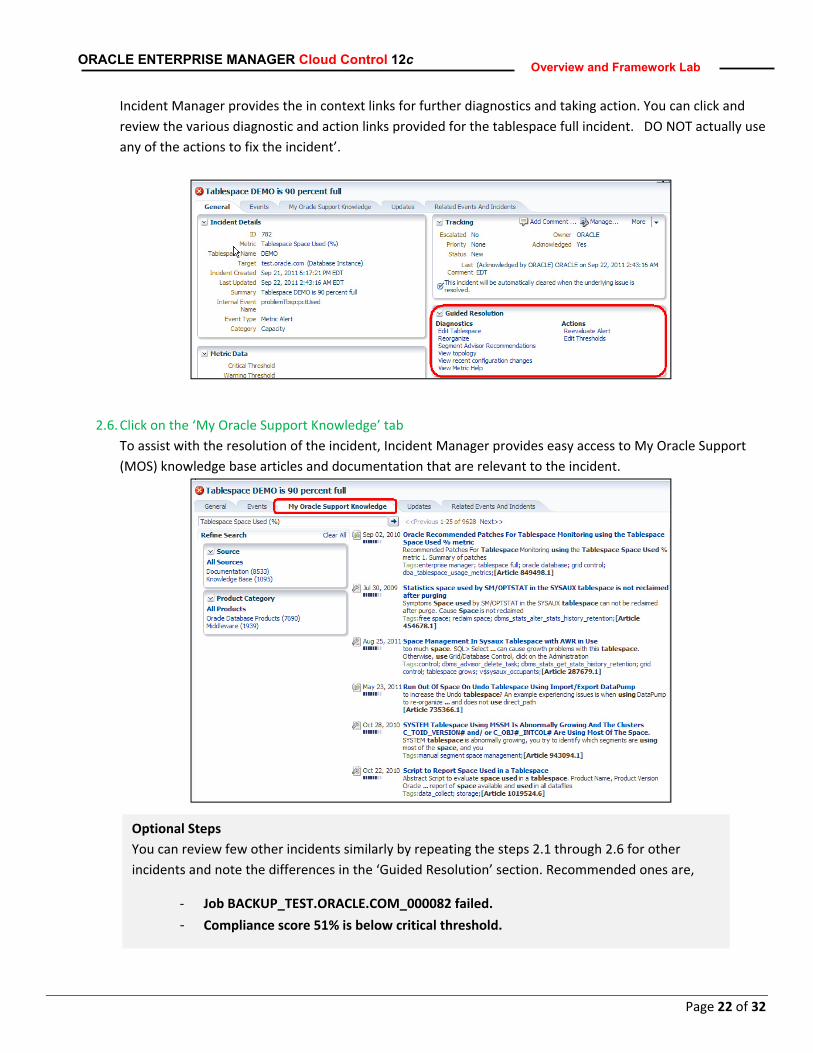
2.5. Review the ‘Guided Resolution’ section
Page 22 of 32
ORACLE ENTERPRISE MANAGER Cloud Control 12c Overview and Framework Labb
Incident Manager provides the in context links for further diagnostics and taking action. You can click and review the various diagnostic and action links provided for the tablespace full incident. DO NOT actually use any of the actions to fix the incident’.
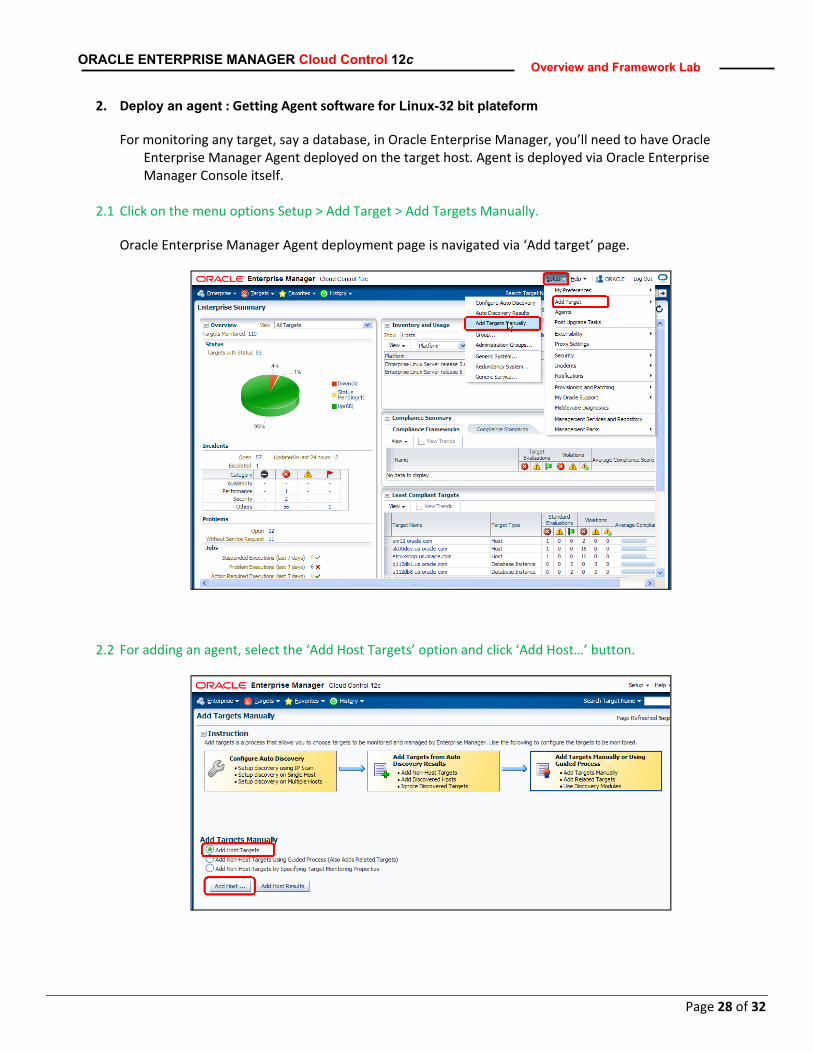
2.6. Click on the ‘My Oracle Support Knowledge’ tab To assist with the resolution of the incident, Incident Manager provides easy access to My Oracle Support (MOS) knowledge base articles and documentation that are relevant to the incident.
Optional Steps You can review few other incidents similarly by repeating the steps 2.1 through 2.6 for other incidents and note the differences in the ‘Guided Resolution’ section. Recommended ones are,
‐ Job BACKUP_TEST.ORACLE.COM_000082 failed.
‐ Compliance score 51% is below critical threshold.

Page 23 of 32
ORACLE ENTERPRISE MANAGER Cloud Control 12c Overview and Framework Labb
3. Reviewing Problems Problems represent the root cause of critical errors in Oracle code. When a critical software error is encountered, a diagnostic incident is automatically created and a Problem object is also created in Incident Manager. To resolve this Problem (i.e. fix the root cause of error in code), users are expected to reach out to Oracle Support by creating an Oracle Service Request (SR) through Support Workbench. In this lab, an ORA‐600 incident was detected on the database and a problem object for it(ORA‐600 error) was created in Incident Manager . A Support SR was also created using Support Workbench. This lab will allow you to examine how you can view details of the Problem, easily access Support Workbench, and also access the associated SR all within Incident Manager.
3.1. In Incident Manager, locate and click on the view ‘PROD‐GROUP Problems’
3.2. If you don’t see the problem list, you might need to restore pane by clicking on the ( ) icon ,
3.3. Click on the problem ‘Problem: ORA 600 [4136]’ for test.oracle.com
3.4. Right click SR # and open in new tab

Page 24 of 32
ORACLE ENTERPRISE MANAGER Cloud Control 12c Overview and Framework Labb
Locate and drilldown to the Oracle service request that is opened for the Problem. Note : it might take up to a minute to load the My Oracle Support view in this lab environment.
3.5. Review the Service request
This is a demo SR, therefore you’ll not see much meaningful information here. In an actual deployment, the SR would show you the latest updates from Oracle Support to help you resolve the problem.

Page 25 of 32
ORACLE ENTERPRISE MANAGER Cloud Control 12c Overview and Framework Labb
3.6. Close the SR tab. Click on the link under ‘Diagnostics’ section. Note: In case you get the login page, select the Preferred Credentials’ for sysdba.
3.7. In Support Workbench, you can do a quick review of the incidents in the problem

Page 26 of 32
ORACLE ENTERPRISE MANAGER Cloud Control 12c Overview and Framework Labb
C. Self Update Lab (Estimated Time – 10 minutes)
In the prior releases, you had to download agent software or other Oracle Enterprise Manager updates from OTN, e‐Delivery, My Oracle Support (MOS) notes, and numerous other sources. In this lab you will review the new Self Update Console in Oracle Enterprise Manager, which is a centralized delivery mechanism for all the Oracle Enterprise Manager updates, and familiarize yourself with the different types of self‐updateable entities. Subsequently you’ll go through the process of getting agent software in Oracle Enterprise Manager console to monitor a database on a new platform.
Business Problem/Use Case You want to manage your database on a 32-bit Linux machine, but you don’t have an agent for it. Hence you need to download and deploy agent for this 32-bit Linux platform.
1. Accessing the Self Update console in Oracle Enterprise Manager
Oracle periodically provides new functionality and updates for existing features in Oracle Enterprise Manager. The Self Update home allows administrators to receive notifications and view, download, and apply such updates. While these updates are retrieved automatically, a manual check can be made at any time.
1.1 Click on the menu options Setup > Extensibility > Self Update

Page 27 of 32
ORACLE ENTERPRISE MANAGER Cloud Control 12c Overview and Framework Labb
1.2 On ‘Self Update’ Page, review different types of self‐updateable entities and try to find the answers to the following.
• Last time when information was refreshed from My Oracle Support (MOS) site.
• Which entity type has most number of updates downloaded?
1.3 Click on the ‘Plug‐in’ Type to view all plug‐ins that have been downloaded or applied.
Page 28 of 32
ORACLE ENTERPRISE MANAGER Cloud Control 12c Overview and Framework Labb
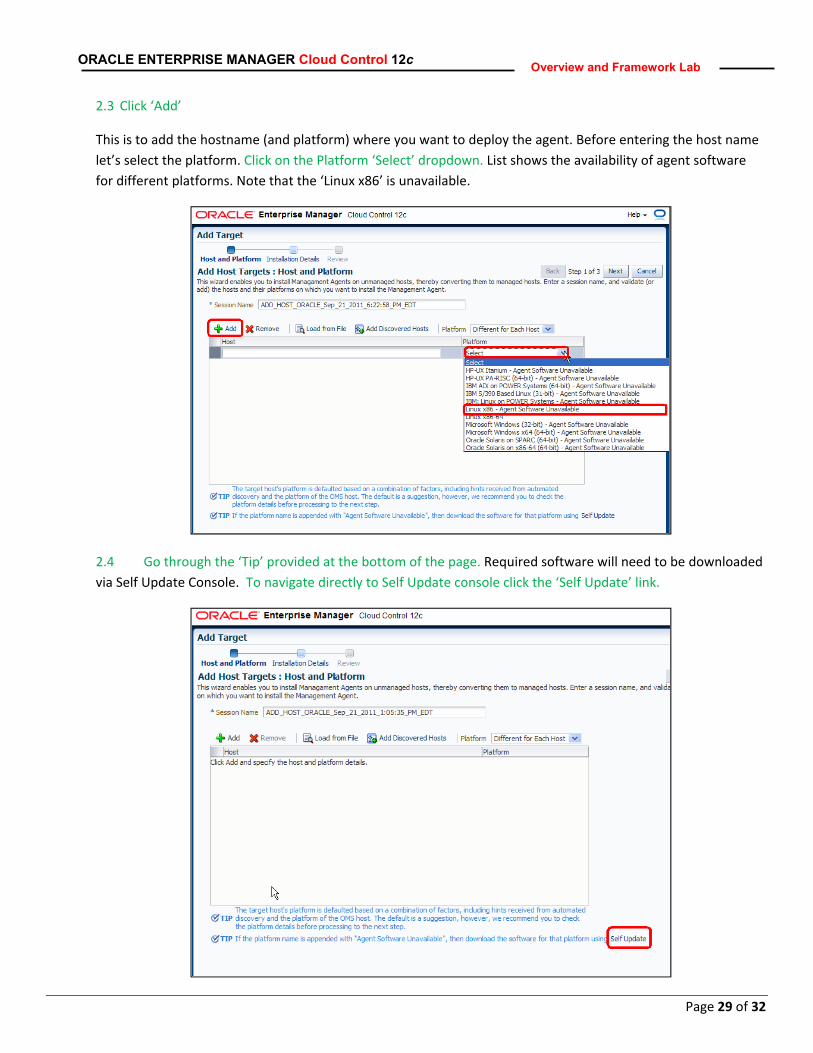
2. Deploy an agent : Getting Agent software for Linux-32 bit plateform
For monitoring any target, say a database, in Oracle Enterprise Manager, you’ll need to have Oracle Enterprise Manager Agent deployed on the target host. Agent is deployed via Oracle Enterprise Manager Console itself.
2.1 Click on the menu options Setup > Add Target > Add Targets Manually.
Oracle Enterprise Manager Agent deployment page is navigated via ‘Add target’ page.
2.2 For adding an agent, select the ‘Add Host Targets’ option and click ‘Add Host…’ button.
Page 29 of 32
ORACLE ENTERPRISE MANAGER Cloud Control 12c Overview and Framework Labb
2.3 Click ‘Add’
This is to add the hostname (and platform) where you want to deploy the agent. Before entering the host name let’s select the platform. Click on the Platform ‘Select’ dropdown. List shows the availability of agent software for different platforms. Note that the ‘Linux x86’ is unavailable.
2.4 Go through the ‘Tip’ provided at the bottom of the page. Required software will need to be downloaded via Self Update Console. To navigate directly to Self Update console click the ‘Self Update’ link.

Page 30 of 32
ORACLE ENTERPRISE MANAGER Cloud Control 12c Overview and Framework Labb
2.5 This is the same page you reviewed at the beginning on this exercise. For getting the agent software, click on the ‘Agent Software’ folder.
2.6 In this environment Agent software for Linux x86 is already downloaded by the administrator (sysman).
Can you find out the date when software was downloaded?
Next, store the software to Enterprise Manager Software Library using the apply operation. Select the Agent Software update for Linux x86, and click ‘Apply’.
Review the information about ‘Apply’ operation and click OK.

Page 31 of 32
ORACLE ENTERPRISE MANAGER Cloud Control 12c Overview and Framework Labb
This will internally submit a job for storing agent software in software library. Note the link to directly navigate to job details page to view the job status. Click the ‘OK’ to return to Agent
2.7 Within few minutes you will notice the software status is changed to ‘Applied’.
If needed click the Refresh icon on top right corner periodically till status is not changed. Select the ‘Linux x86’ software row.
Select the Agent Software update for Linux x86. In the ‘Past Activities’ table, notice the operation history confirming the successful operation.
2.8 Next, go back to the agent deployment page to check if agent software is available or not.
You can directly navigate to the required page by clicking ‘Agent Software’ button.
2.9 To view the agent platforms, click on the ‘Add’ button and select the platform dropdown.

Page 32 of 32
ORACLE ENTERPRISE MANAGER Cloud Control 12c Overview and Framework Labb
You’ll notice that ‘Linux x86’ agent software is shown as available now.
Next step will be to provide the hostname where you want to deploy agent. In this lab, we’ll NOT perform the agent deployment.

Page 1 of 21
ORACLE ENTERPRISE MANAGER Cloud Control 12c Deployment Lifecycle Management
Section II – Deployment Lifecycle Management
A. Inventory Reporting
B. Configuration Browser
C. Configuration Topology
D. System Configuration Comparison [OPTIONAL]
E. Configuration Search [OPTIONAL]
Page 2 of 21
ORACLE ENTERPRISE MANAGER Cloud Control 12c Deployment Lifecycle Management
A – Inventory and Usage Details
Business Case You have been asked to provide a list of all production 11.2.0.1 database instances including their installation
host and oracle home location.
1. Using Inventory and Usage Details
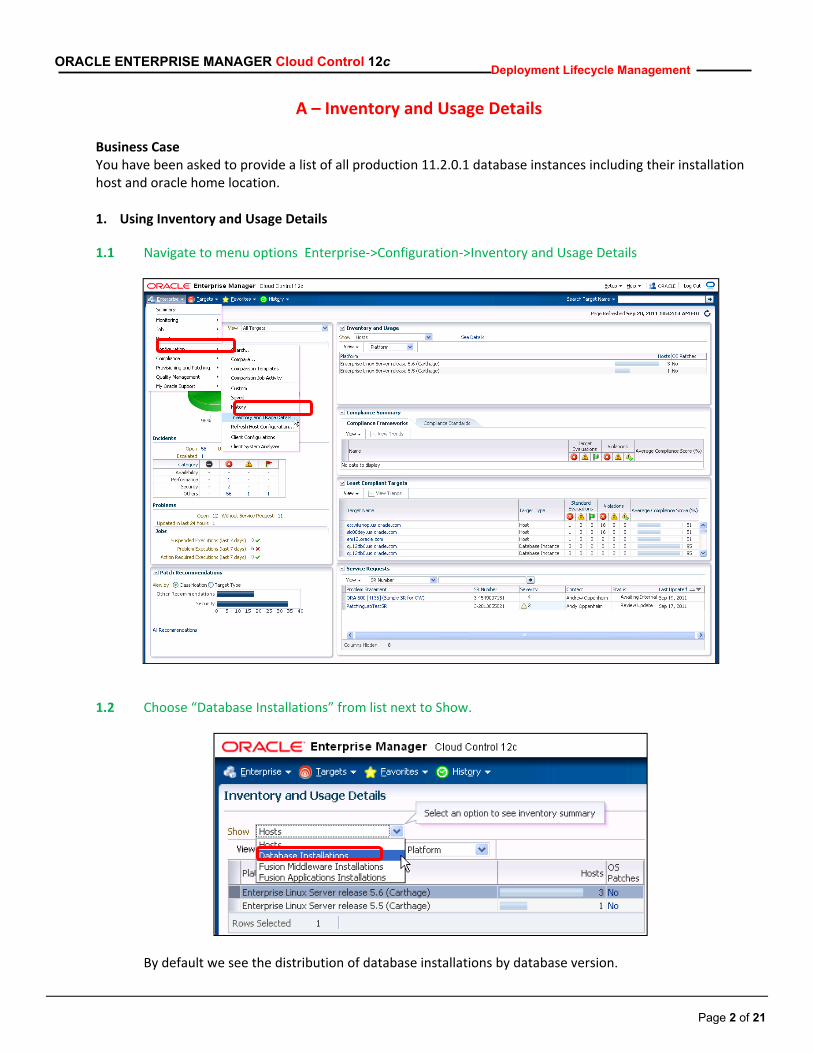
1.1 Navigate to menu options Enterprise‐>Configuration‐>Inventory and Usage Details
1.2 Choose “Database Installations” from list next to Show.
By default we see the distribution of database installations by database version.

Page 3 of 21
ORACLE ENTERPRISE MANAGER Cloud Control 12c Deployment Lifecycle Management
1.3 Change the roll up from Version to Lifecycle to see the distribution of database installations by lifecycle environment.
1.4 Click on the bar in the installations column next to Production to focus on Production databases.
Clicking on the bar brings you to a focused view of production databases allowing compounding roll up dimensions.
1.5 Click the ‘8’ in the targets column in the Production row to see the production database instance target.
Here is the list of databases you are interested in. Notice you can Export this information to a spreadsheet to allow for saving or emailing.

Page 4 of 21
ORACLE ENTERPRISE MANAGER Cloud Control 12c Deployment Lifecycle Management
1.6 Select q112db1.us.oracle.com database to go to its homepage.
Page 5 of 21
ORACLE ENTERPRISE MANAGER Cloud Control 12c Deployment Lifecycle Management
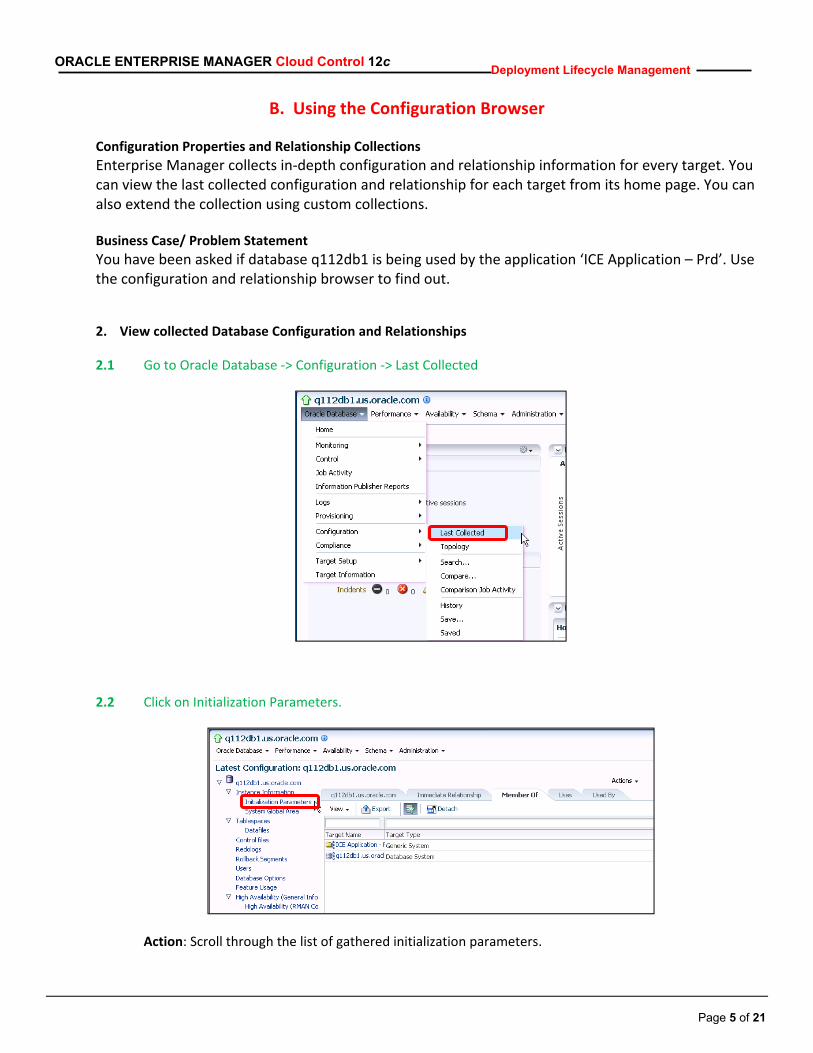
B. Using the Configuration Browser Configuration Properties and Relationship Collections
Enterprise Manager collects in‐depth configuration and relationship information for every target. You can view the last collected configuration and relationship for each target from its home page. You can also extend the collection using custom collections. Business Case/ Problem Statement
You have been asked if database q112db1 is being used by the application ‘ICE Application – Prd’. Use the configuration and relationship browser to find out.
2. View collected Database Configuration and Relationships
2.1 Go to Oracle Database ‐> Configuration ‐> Last Collected
2.2 Click on Initialization Parameters.
Action: Scroll through the list of gathered initialization parameters.

Page 6 of 21
ORACLE ENTERPRISE MANAGER Cloud Control 12c Deployment Lifecycle Management
2.3 Click on Feature Usage.
Action: Scroll through the list of gathered features and their usage information.
2.4 Click on the name q112db1.us.oracle.com to see the target properties.
Every target has target properties which are usually high level important information like version, Oracle
Home as well as user definable properties like lifecycle, Cost Center, etc.

Page 7 of 21
ORACLE ENTERPRISE MANAGER Cloud Control 12c Deployment Lifecycle Management
2.5 Click ‘Member Of’ tab.
The tabs ‘Immediate Relationship’, ‘Member Of’, ‘Uses’ and ‘Used By’ all show automatically detected and manually added relationships to this target. These can be used for important analysis including Impact and Root cause analysis.
2.6 Click ‘ICE Application – Prd’ to go to its homepage.
So, the answer is YES, this database is being used by the ‘ICE Application – Prd’.

Page 8 of 21
ORACLE ENTERPRISE MANAGER Cloud Control 12c Deployment Lifecycle Management
C. Using the Configuration Topology Viewer Configuration Topology Viewer
Enterprise Manager graphically displays targets and their relationships to one another in the topology viewer. Using the topology viewer you can perform Impact and Root cause analysis as well as take action on any displayed target by accessing its target specific menu. Business Case/ Problem Statement
Use the topology viewer to view the important components of the ‘ICE Application –Prd’ including how they are related. 3. Use the Configuration Topology Viewer
3.1 Go to Generic System ‐> Configuration ‐> Topology
Page 9 of 21
ORACLE ENTERPRISE MANAGER Cloud Control 12c Deployment Lifecycle Management
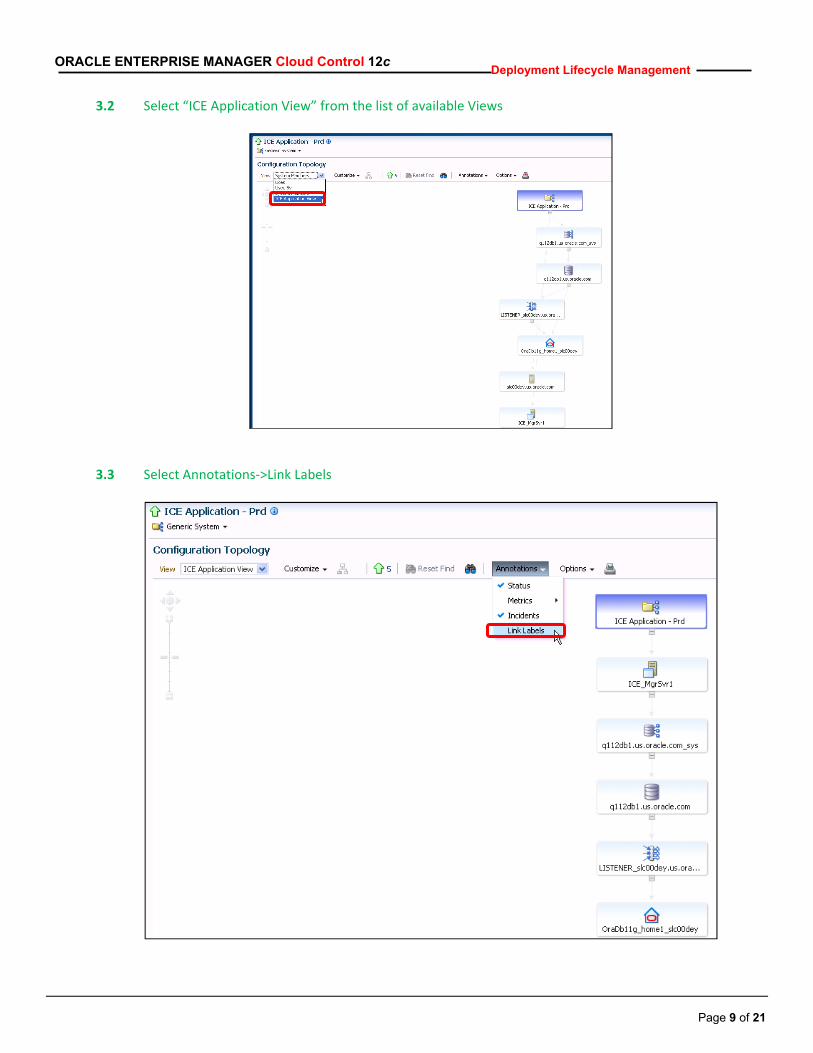
3.2 Select “ICE Application View” from the list of available Views
3.3 Select Annotations‐>Link Labels
Page 10 of 21
ORACLE ENTERPRISE MANAGER Cloud Control 12c Deployment Lifecycle Management
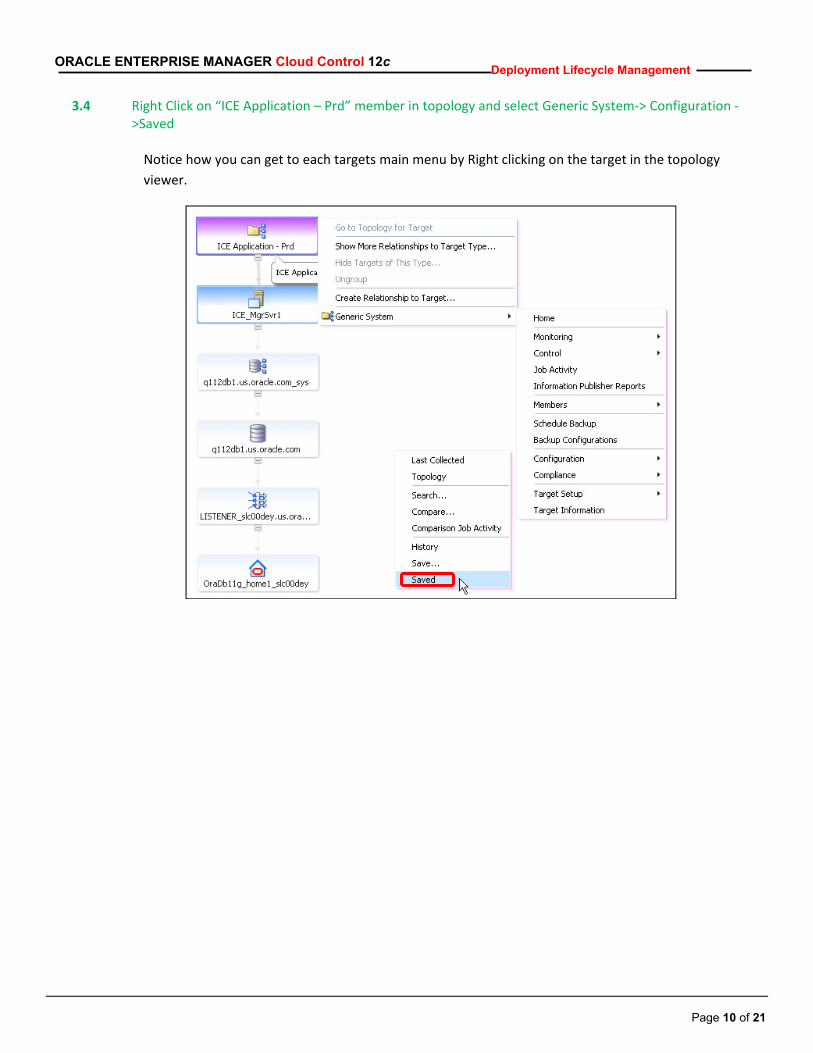
3.4 Right Click on “ICE Application – Prd” member in topology and select Generic System‐> Configuration ‐>Saved
Notice how you can get to each targets main menu by Right clicking on the target in the topology viewer.

Page 11 of 21
ORACLE ENTERPRISE MANAGER Cloud Control 12c Deployment Lifecycle Management
D. Gold Image Configuration Comparison [OPTIONAL] Configuration Comparison
Enterprise Manager has sophisticated configuration comparison capabilities including the ability to control the comparison results using templates. These templates can be configured to ignore known differences among many other features. Users can save a snapshot of a target or entire application stack as a baseline or gold standard for later use in comparison. Business Case/ Problem Statement
The ICE Application in production is behaving differently. Use the configuration comparison feature to compare the saved Gold Image of the ICE Application to see if there are any important difference between it and the current ICE application configuration. 4. Gold Standard Configuration Comparison
4.1 Select the saved snapshot of this application called Gold Image and click Compare
A Gold Image Snapshot has already taken of the ICE Application for use in comparison.
4.2 Click Next

Page 12 of 21
ORACLE ENTERPRISE MANAGER Cloud Control 12c Deployment Lifecycle Management
4.3 Click Add Configurations
4.4 Click Search
4.5 Select “ICE Application – Prd” and click OK.
Here you are choosing to compare last collected configuration of the ICE Application.

Page 13 of 21
ORACLE ENTERPRISE MANAGER Cloud Control 12c Deployment Lifecycle Management
4.6 Click Next.
4.7 Select “ICE Application Template” from Comparison Template list.
4.8 Click Next.
The comparison template was created by a user specifically for this ICE Application. It ignores unimportant differences.
4.9 Click Next.
The mapping screen shows which targets will be compared during this comparison job. This will be done automatically by Enterprise Manager, or can be manipulated by the user manually or by using a comparison template.

Page 14 of 21
ORACLE ENTERPRISE MANAGER Cloud Control 12c Deployment Lifecycle Management
4.10 Click Submit. Users can schedule the comparison to run on a regular basis and be notified of differences via email.
4.11 Click Refresh Results until Comparison results show Different, which can take up to 2 minutes.
4.12 Click Different
The results are in fact different meaning something important has changed in 1 or more of the component targets of the ICE Application. Let’s find out what changed.

Page 15 of 21
ORACLE ENTERPRISE MANAGER Cloud Control 12c Deployment Lifecycle Management
4.13 Open Generic System to see the targets.
4.14 Select Different next to Oracle WebLogic Server.
There is a least 1 important difference in the WebLogic Server configuration.
4.15 Select Server Information category ( Note difference in Login Timeout )
Here we can see that the login timeout for the managed server has changed from 5000 to 500, definitely something that could affect the application.

Page 16 of 21
ORACLE ENTERPRISE MANAGER Cloud Control 12c Deployment Lifecycle Management
4.16 Select System Compare Results to return to main compare
4.17 Reopen Generic System and Database System, then click on Different next to Database Instance
We can also see there is a difference in the database instance being used by the ICE Application. Let’s look at what changed.
4.18 Select Initialization Parameters.
Page 17 of 21
ORACLE ENTERPRISE MANAGER Cloud Control 12c Deployment Lifecycle Management
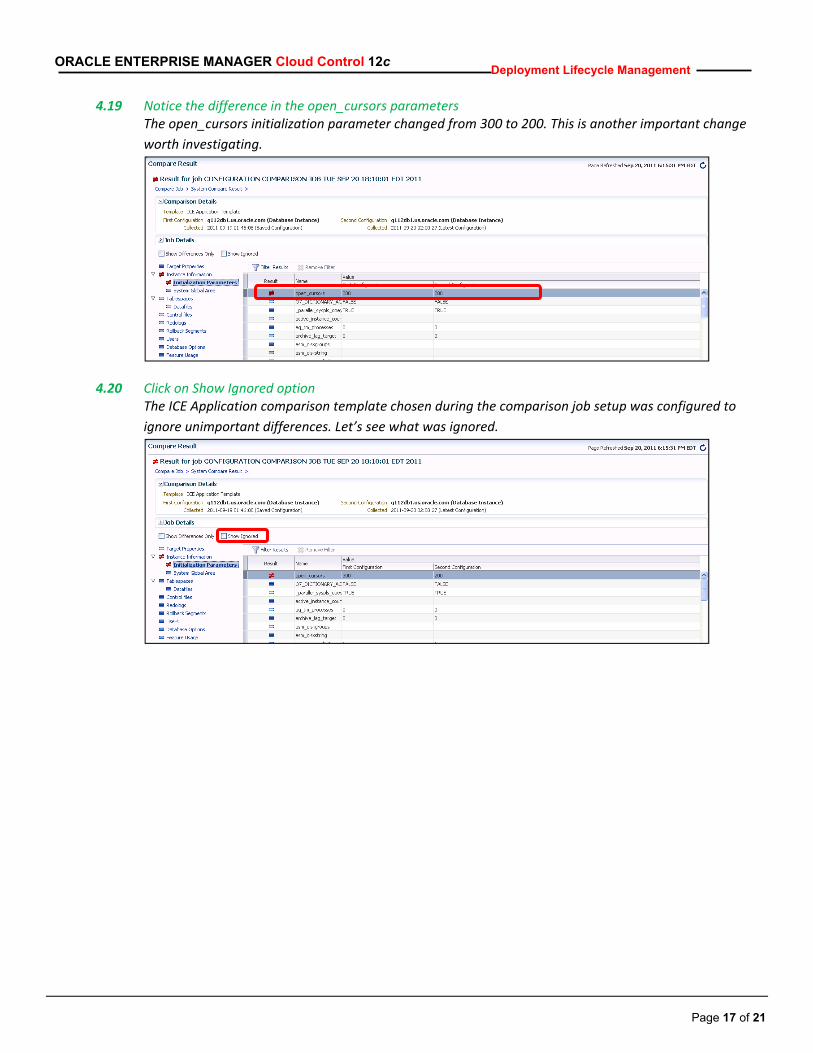
4.19 Notice the difference in the open_cursors parameters The open_cursors initialization parameter changed from 300 to 200. This is another important change worth investigating.
4.20 Click on Show Ignored option The ICE Application comparison template chosen during the comparison job setup was configured to ignore unimportant differences. Let’s see what was ignored.

Page 18 of 21
ORACLE ENTERPRISE MANAGER Cloud Control 12c Deployment Lifecycle Management
4.21 Notice all of the Initialization parameters being ignored which are not important to this comparison. Here we can see all of the initialization parameters that are being ignored because they are essentially noise and would not affect the ICE application. Users can change what is ignored by changing the comparison template.

Page 19 of 21
ORACLE ENTERPRISE MANAGER Cloud Control 12c Deployment Lifecycle Management
E. Configuration Search [OPTIONAL] Configuration Search
Enterprise Manager has easy to searching capabilities that allows users to graphically build search specifications using both configuration and relationship. Business Case/ Problem Statement
You have been asked to create a quick report on all Production 11.2.0.2 Databases using Partitioning feature that have Patch 12573945 installed.
Another user has already created a Search Specification for this, however, it has been requested that the Host on
which the databases are running be displayed in the search results. 5. Use and modify a Custom Search
5.1 Go to Enterprise ‐> Configuration ‐> Search…
5.2 Select “11.2.0.2 Databases using Partitioning with Patch 12573945” and click Run

Page 20 of 21
ORACLE ENTERPRISE MANAGER Cloud Control 12c Deployment Lifecycle Management
5.3 Click “Add Properties” next to Database Instance. Now we will add the “Host” property to the list of displayed columns in the report.
5.4 Open Instance Information and select “Host” and click OK.

Page 21 of 21
ORACLE ENTERPRISE MANAGER Cloud Control 12c Deployment Lifecycle Management
5.5 Click Search
5.6 Scroll to right to see additional column showing the host name.
Here we can see the additional column in the report. Also notice that you can Export to Excel or print this report.
5.7 Click “Back” to return to Search Menu.
Page 1 of 34
ORACLE ENTERPRISE MANAGER Cloud Control 12c Database Management
Section III – Database Management
Objective:
The objective of this lab to provide exercises designed to showcase the new database performance management capabilities in Oracle Enterprise Manager Cloud Control 12c.
Functional Coverage:
In this lab you will go through new features in the following functional areas:
1. ASH Analytics 2. Database Subset (abridged version) 3. Real Time ADDM

Page 2 of 34
ORACLE ENTERPRISE MANAGER Cloud Control 12c Database Management
A. ASH Analytics Estimated Time to Complete Use Case: 15 minutes Business Case
Oracle Enterprise Manager 12c introduces ASH Analytics, a new tool to explore the ASH data that allows the administrator to rollup, drilldown, and slice or dice performance data across various performance dimensions. With the ability to create filters on various dimensions, identifying performance issues has never been easier.
The built‐in Treemap view allows administrators to explore performance data using predefined performance dimension hierarchies.
2. Understanding the ASH Analytics page
1.1 You should already be logged on to Enterprise Manager. If you are not, please follow the instructions detailed in earlier steps of this workbook.
1.2 Navigate to Databases: From the menu, Targets ‐> Databases

Page 3 of 34
ORACLE ENTERPRISE MANAGER Cloud Control 12c Database Management
1.3 Select Database Name: test.oracle.com
1.4 Open the ASH Analytics Page. From the Database Home Page, select Performance ‐> ASH Analytics

Page 4 of 34
ORACLE ENTERPRISE MANAGER Cloud Control 12c Database Management
1.5 Shown below is the ASH Analytics Home Page. Notice the following:
1.5.1 Click on Day or Week period to view different levels across days
2.5.2 Select the Hour Time Period for investigation: Use the slider at the top of the chart to select a time period which has a high workload (Note: Once you have selected the window for investigation, click on the Full Screen button for better viewing

Page 5 of 34
ORACLE ENTERPRISE MANAGER Cloud Control 12c Database Management
2.6 Review the different Wait Classes:
2.6.1 In the 2nd chart from the top, students will observe the detailed view of the time window that has been selected.
2.6.2 By default the wait class dimension is selected. Observe the different wait classes for the window selected (blue for USER_IO, green for CPU etc.)

Page 6 of 34
ORACLE ENTERPRISE MANAGER Cloud Control 12c Database Management
2.7 Become familiar with the different dimensions: For example, change the dimension from Wait Class to SQL ID. From the drop down, choose Top Dimensions ‐> SQL ID. Observe the change in the chart.
The use of different performance dimensions allows the user to get a perspective of what is currently running and how the system resources are being utilized.
Page 7 of 34
ORACLE ENTERPRISE MANAGER Cloud Control 12c Database Management
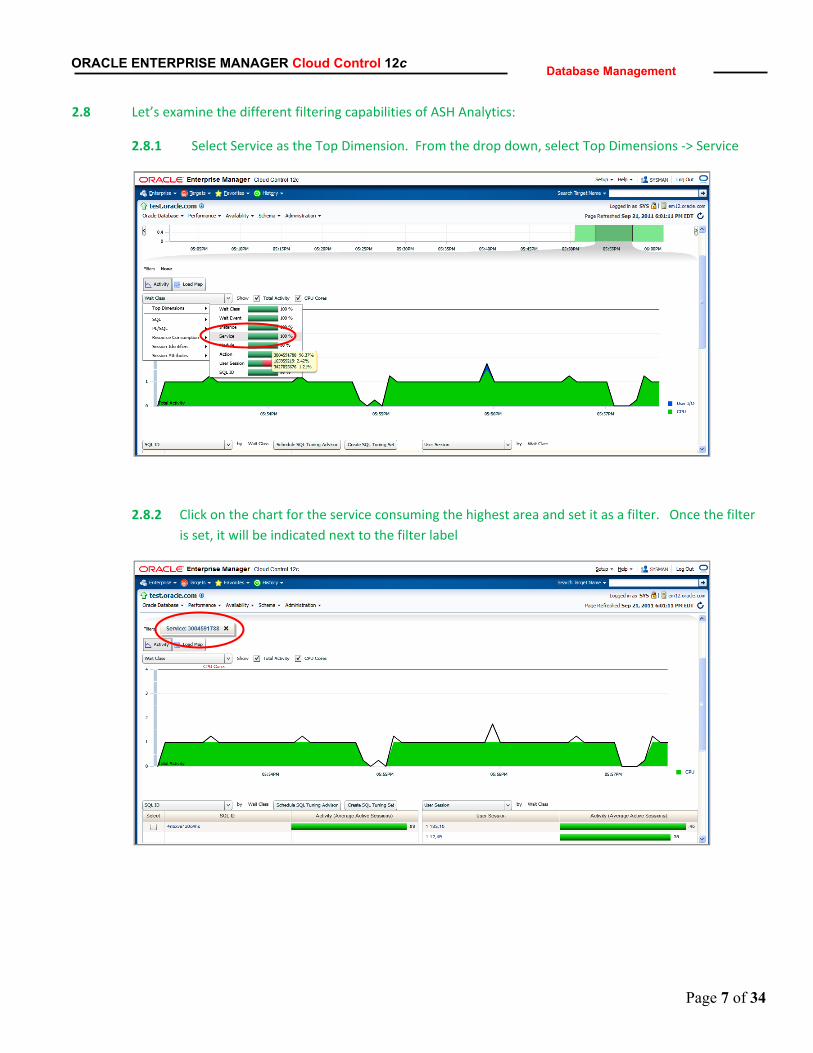
2.8 Let’s examine the different filtering capabilities of ASH Analytics:
2.8.1 Select Service as the Top Dimension. From the drop down, select Top Dimensions ‐> Service
2.8.2 Click on the chart for the service consuming the highest area and set it as a filter. Once the filter is set, it will be indicated next to the filter label
Page 8 of 34
ORACLE ENTERPRISE MANAGER Cloud Control 12c Database Management
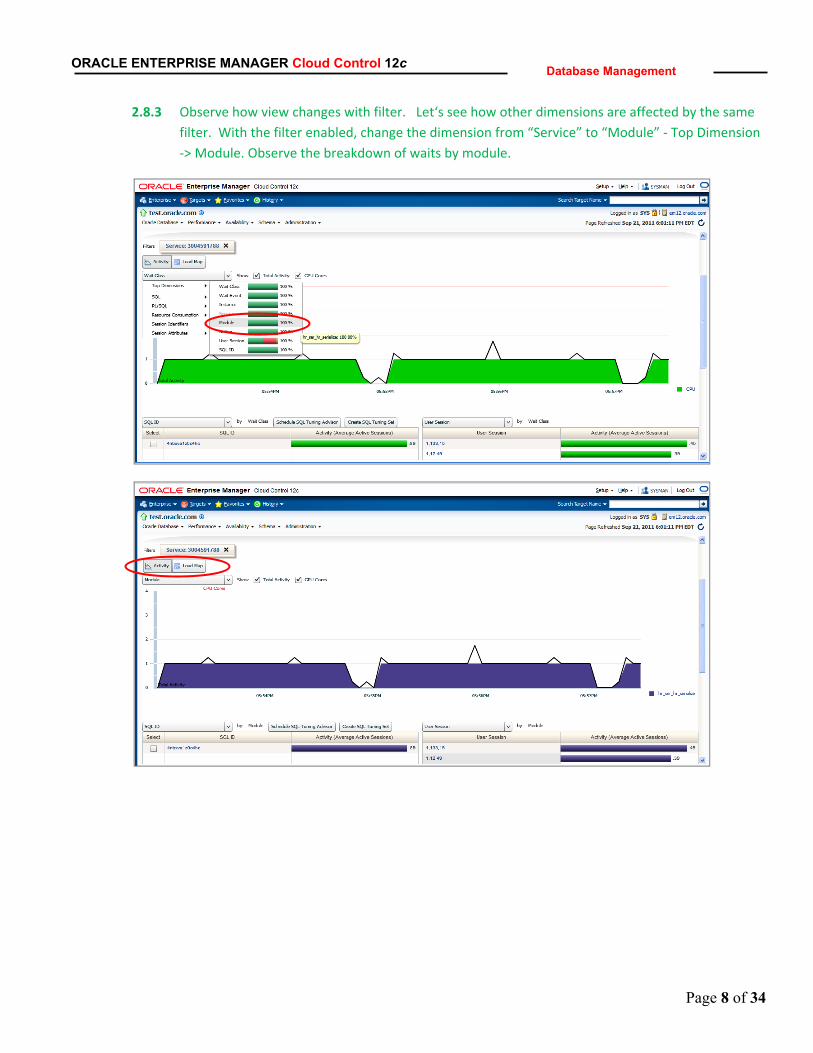
2.8.3 Observe how view changes with filter. Let‘s see how other dimensions are affected by the same filter. With the filter enabled, change the dimension from “Service” to “Module” ‐ Top Dimension ‐> Module. Observe the breakdown of waits by module.

Page 9 of 34
ORACLE ENTERPRISE MANAGER Cloud Control 12c Database Management
2.9 In the chart below you can see the following by default: SQL ID by default, Session by default. Drilling down into the SQL ID is NOT included in this lab, although the sql details page is accessible by clicking on the sql_id (please do not click the sql_id)

Page 10 of 34
ORACLE ENTERPRISE MANAGER Cloud Control 12c Database Management
2.9 Remove all filters: Remove all filters and select the view by Wait Class – Top Dimension ‐> Wait Class
Page 11 of 34
ORACLE ENTERPRISE MANAGER Cloud Control 12c Database Management
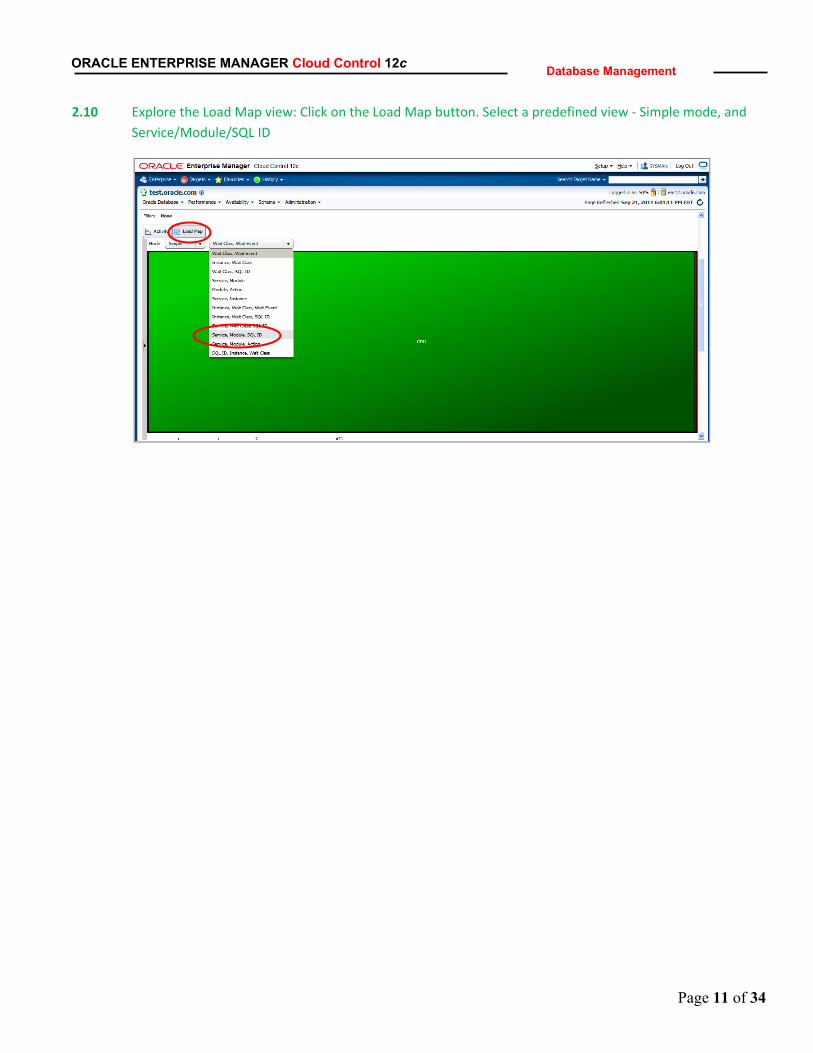
2.10 Explore the Load Map view: Click on the Load Map button. Select a predefined view ‐ Simple mode, and Service/Module/SQL ID
Page 12 of 34
ORACLE ENTERPRISE MANAGER Cloud Control 12c Database Management
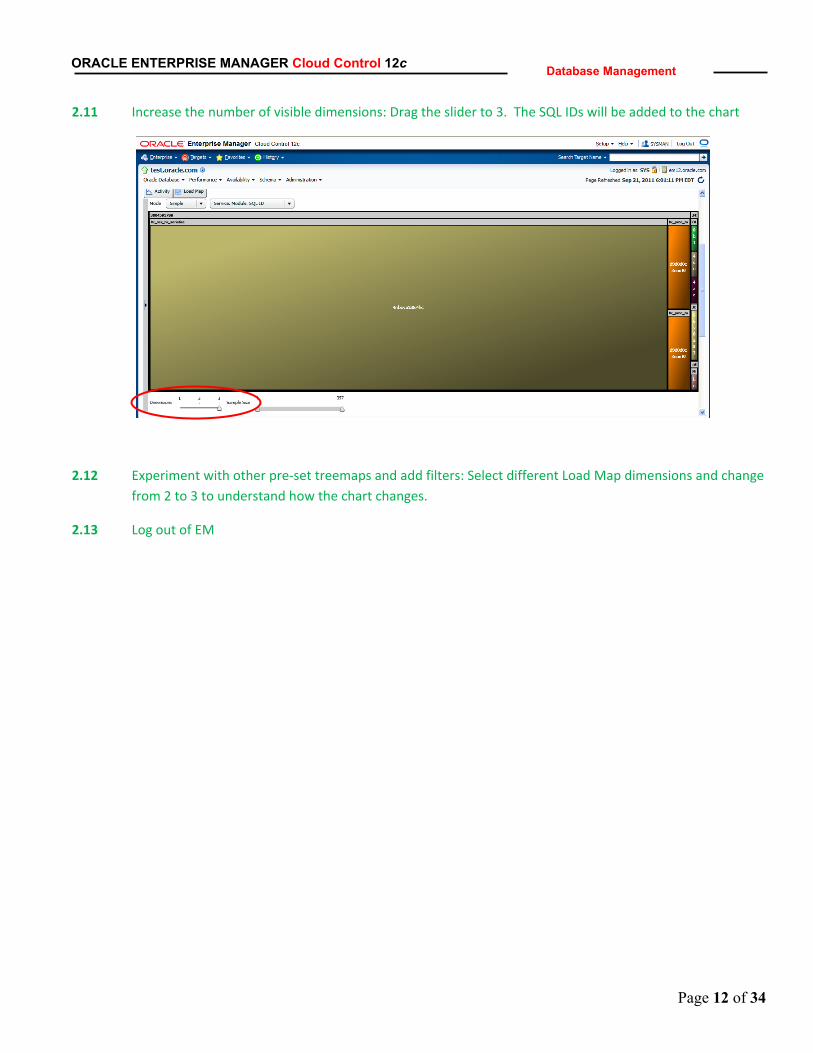
2.11 Increase the number of visible dimensions: Drag the slider to 3. The SQL IDs will be added to the chart
2.12 Experiment with other pre‐set treemaps and add filters: Select different Load Map dimensions and change from 2 to 3 to understand how the chart changes.
2.13 Log out of EM

Page 13 of 34
ORACLE ENTERPRISE MANAGER Cloud Control 12c Database Management
B. Review Subset Definition and Execute Subset Based on Application Data Model
Estimated Time to Complete Use Case: 15 minutes
Business Case
Having discovered the application relationships, the application administrator now needs to create a smaller sized representation of this database so that the enterprise provide realistic‐production data available to application developers for accurate application testing while reduce their storage costs by not having to provision a entire production environment for each developer.
Steps already completed.
Test Data Management Package
This Use Case requires a target database be prepared with the prepared with the packages and functions needed to perform test data management operations. Oracle Enterprise Manager Cloud Control 12c has several test data management capabilities, such as application data models, data subsetting and data masking. To be able to take advantage of these capabilities, each database involved in the test data management process must have the necessary library functions deployed onto the database.
Creation of Application Data Model
When a new application has been provided to the application users, it can be a daunting task to construct the application relationships that make up the application. Fortunately, the process of creating the application data model has been greatly simplified for application schema where the application relationships are enforced through database constraint. In this use case, you will construct the application relationships for the HR and OE sample schema. This application data model will be the basis for performing the rest of the test data management operations.
Creation of a Data Subset Definition
Having discovered the application relationships, the application administrator now needs to create a smaller sized representation of this database so that the enterprise provide realistic‐production data available to application developers for accurate application testing while reduce their storage costs by not having to provision a entire production environment for each developer.

Page 14 of 34
ORACLE ENTERPRISE MANAGER Cloud Control 12c Database Management
2. Execute Subset
2.1 The purpose of this lab is to execute a data subsetting operation based on “Department ID” in the Employees table. Prior to executing the operation, let’s see how many records are in this table.
2.1.1 From the test database homepage, click SQL ‐> Run SQL

Page 15 of 34
ORACLE ENTERPRISE MANAGER Cloud Control 12c Database Management
2.2.2 In the SQL Text box, enter “select count(*) from hr.employees;” Leave Host Credentials as the default. Select ” Named Credentials” and “DB_TEST_SYS” as the Database Credentials. Click on “Run”.
Once the SQL has run, click on the “Show All Details” to view the result. You should see 107 records.
2.2.3 Now, let’s run another script. Cut and paste, or type, the following script into the SQL text box: “select department_id, count(*) from hr.employees group by department_id;” Keep the same Credentials, and click “Run”

Page 16 of 34
ORACLE ENTERPRISE MANAGER Cloud Control 12c Database Management
2.2.4 Scroll to the bottom of the Results area, and click “Complete Execution Results” to see all of the records.
2.2.5 In particular, note the following record counts:
Department id 90 = 3 records Department id 80 = 34 records We will return to these same SQL statements at the end of the lab to show how Data Subsetting affected the record counts.
2.3 So, let’s begin with the Subsetting operation. Navigate to Data Subsetting: From the Menu, Enterprise ‐> Quality Management ‐> Data Subset Definitions

Page 17 of 34
ORACLE ENTERPRISE MANAGER Cloud Control 12c Database Management
2.4 Note that there is already a subset definition created for this lab. It is called “OW_Subset_Definition”
2.5 Let’s look at the definition of this Subset. Highlight the newly created subset definition and click Edit
2.6 From the Applications tab, notice that the two schemas, HR and OE, are included in the definition.

Page 18 of 34
ORACLE ENTERPRISE MANAGER Cloud Control 12c Database Management
2.7 On the Tables Rules Tab, notice that there is a rule that captures a variable “Department_id”. We will provide the arguments for that variable when we execute the Subset. Also notice the tables and columns that this Subset refers to.
2.8 The Rule Parameters Tab is closely related to the Table Rules tab. Notice that we’ve provided a default
value for the variable that we defined in the previous tab.

Page 19 of 34
ORACLE ENTERPRISE MANAGER Cloud Control 12c Database Management
2.9 Click on the Space Estimates Tab. Click on View ‐> Expand All. Notice that the Employees table contains the table rule that we have specified.
2.10 Click the back arrow on your browser to return to the Data Subset Definition page. If you have hit the
“Return” button by mistake, and receive and error – simply log off and log back into EM. Navigate to the Data Subset Home Page.
Page 20 of 34
ORACLE ENTERPRISE MANAGER Cloud Control 12c Database Management
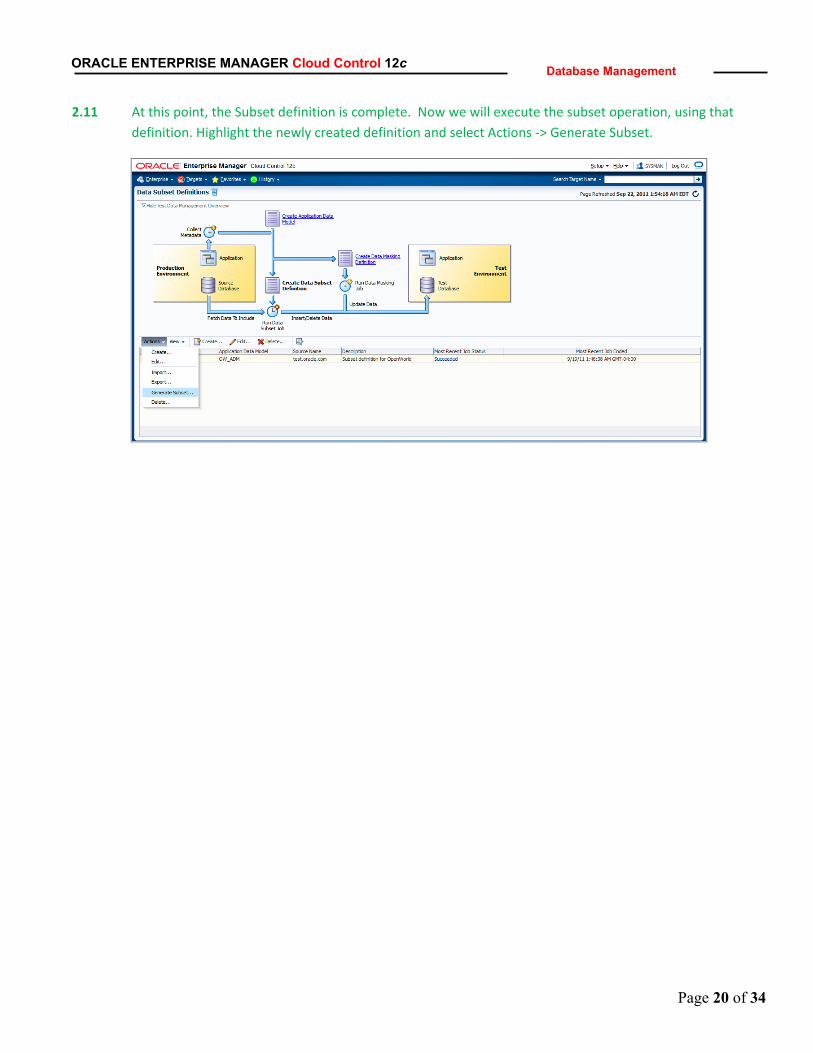
2.11 At this point, the Subset definition is complete. Now we will execute the subset operation, using that definition. Highlight the newly created definition and select Actions ‐> Generate Subset.

Page 21 of 34
ORACLE ENTERPRISE MANAGER Cloud Control 12c Database Management
2.12 On the dialog box:
2.12.1 Select “Deleting Data from a Target Database”
2.12.2 Search and select: test.oracle.com
2.12.3 Select Named Credentials: DB‐TEST_SYS
2.12.4 Leave the default value of 80 for Rule Parameters
2.12.5 Click Continue.

Page 22 of 34
ORACLE ENTERPRISE MANAGER Cloud Control 12c Database Management
2.13 Select DATA_PUMP_DIR as the export File Directory. Check the box to confirm that “The selected target is not a production database”. Click Continue

Page 23 of 34
ORACLE ENTERPRISE MANAGER Cloud Control 12c Database Management
2.14 Set the Host Credentials to “Named = HOST‐ORACLE”. Click submit

Page 24 of 34
ORACLE ENTERPRISE MANAGER Cloud Control 12c Database Management
2.15 Monitor job. You can access the job by click on the “Most Recent Job Status”.
Page 25 of 34
ORACLE ENTERPRISE MANAGER Cloud Control 12c Database Management
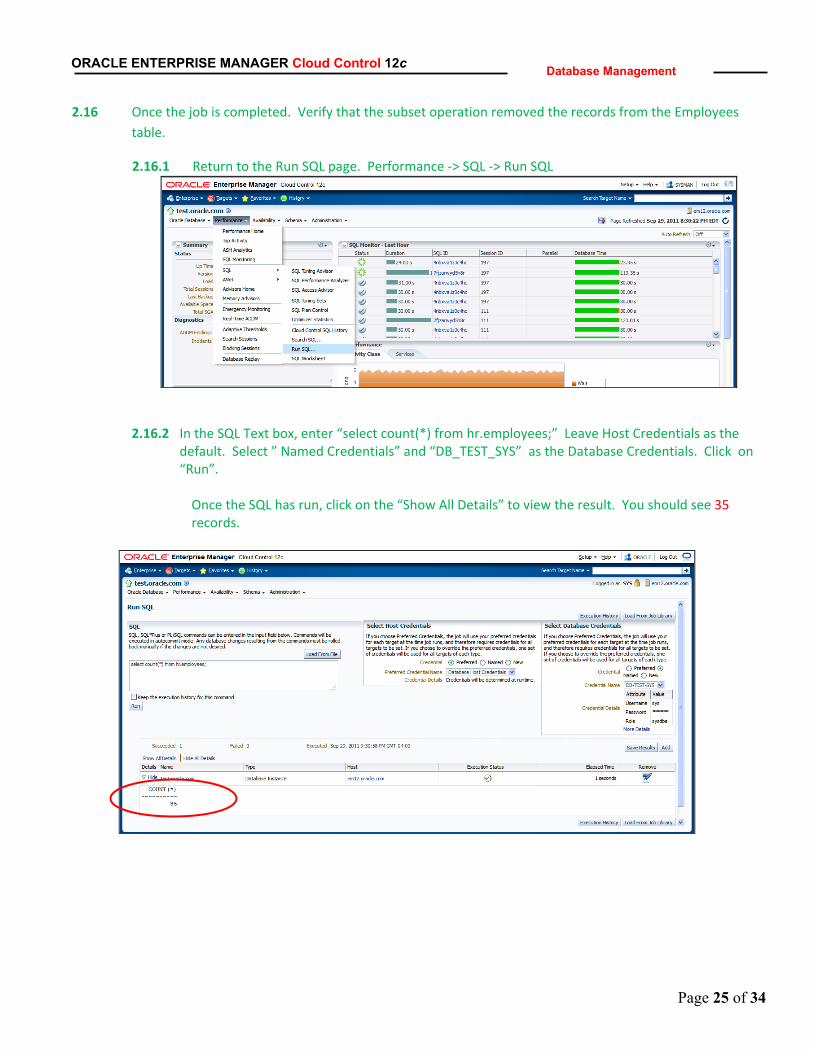
2.16 Once the job is completed. Verify that the subset operation removed the records from the Employees table.
2.16.1 Return to the Run SQL page. Performance ‐> SQL ‐> Run SQL
2.16.2 In the SQL Text box, enter “select count(*) from hr.employees;” Leave Host Credentials as the
default. Select ” Named Credentials” and “DB_TEST_SYS” as the Database Credentials. Click on “Run”.
Once the SQL has run, click on the “Show All Details” to view the result. You should see 35 records.
Page 26 of 34
ORACLE ENTERPRISE MANAGER Cloud Control 12c Database Management
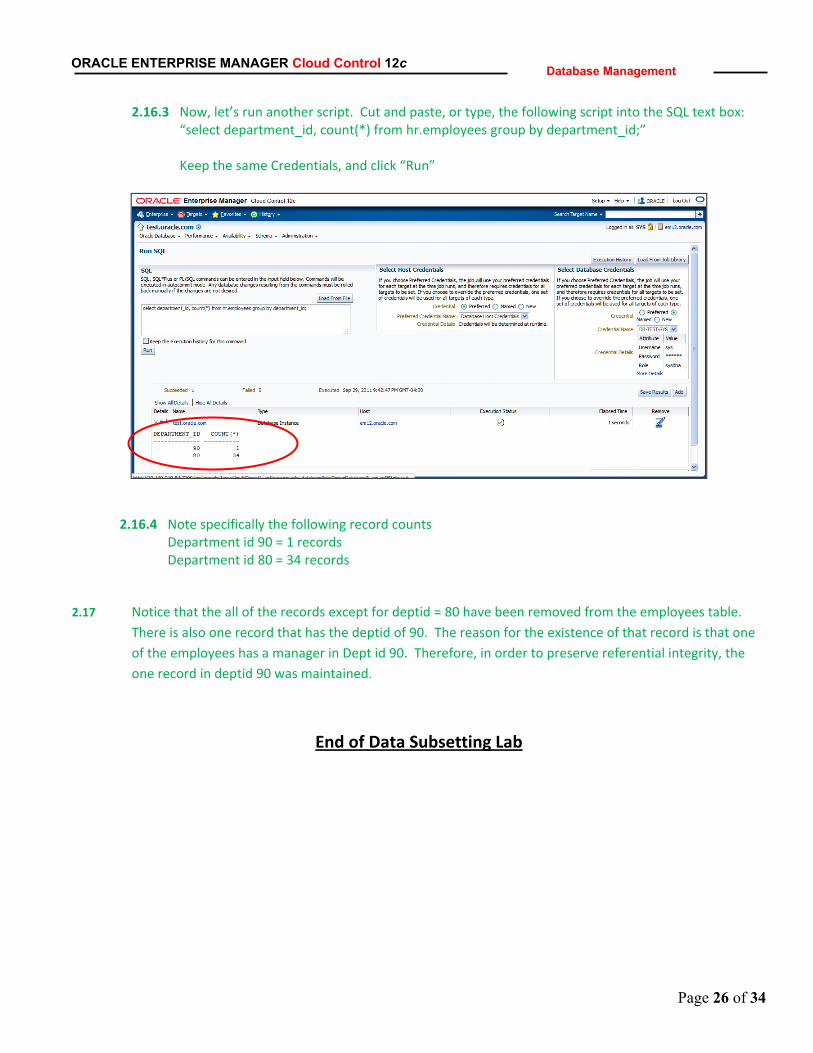
2.16.3 Now, let’s run another script. Cut and paste, or type, the following script into the SQL text box: “select department_id, count(*) from hr.employees group by department_id;” Keep the same Credentials, and click “Run”
2.16.4 Note specifically the following record counts
Department id 90 = 1 records Department id 80 = 34 records
2.17 Notice that the all of the records except for deptid = 80 have been removed from the employees table.
There is also one record that has the deptid of 90. The reason for the existence of that record is that one of the employees has a manager in Dept id 90. Therefore, in order to preserve referential integrity, the one record in deptid 90 was maintained.
End of Data Subsetting Lab

Page 27 of 34
ORACLE ENTERPRISE MANAGER Cloud Control 12c Database Management
C. Real-time ADDM Environment Details:
The target database is running a load on the sample schema provided via the Examples (or companion) software accompanying the Oracle database software. There are other schemas created to simulate specific performance scenarios.
Estimated Time to Complete Use Case: 10 minutes
Business Case This Use Case is intended to give an idea of the basic functionality of the Real‐Time ADDM. Real‐Time ADDM is an innovative way to analyze problems in extremely slow or hung databases. Real‐Time ADDM runs through a set of predefined criteria to analyze the current performance and helps the DBA to resolve deadlocks, hangs, shared pool contentions and many other exception situations which force the administrator to bounce their databases today.
4. Understanding Real‐Time ADDM
4.1 You should already be logged on to Enterprise Manager. If you are not, please follow the instructions
detailed in earlier steps of this workbook.
4.2 This exercise requires users to launch a job that causes a hung job. In order to do that, go to the Job Activity Page from any page. Select Enterprise ‐> Job ‐> Library
Page 28 of 34
ORACLE ENTERPRISE MANAGER Cloud Control 12c Database Management
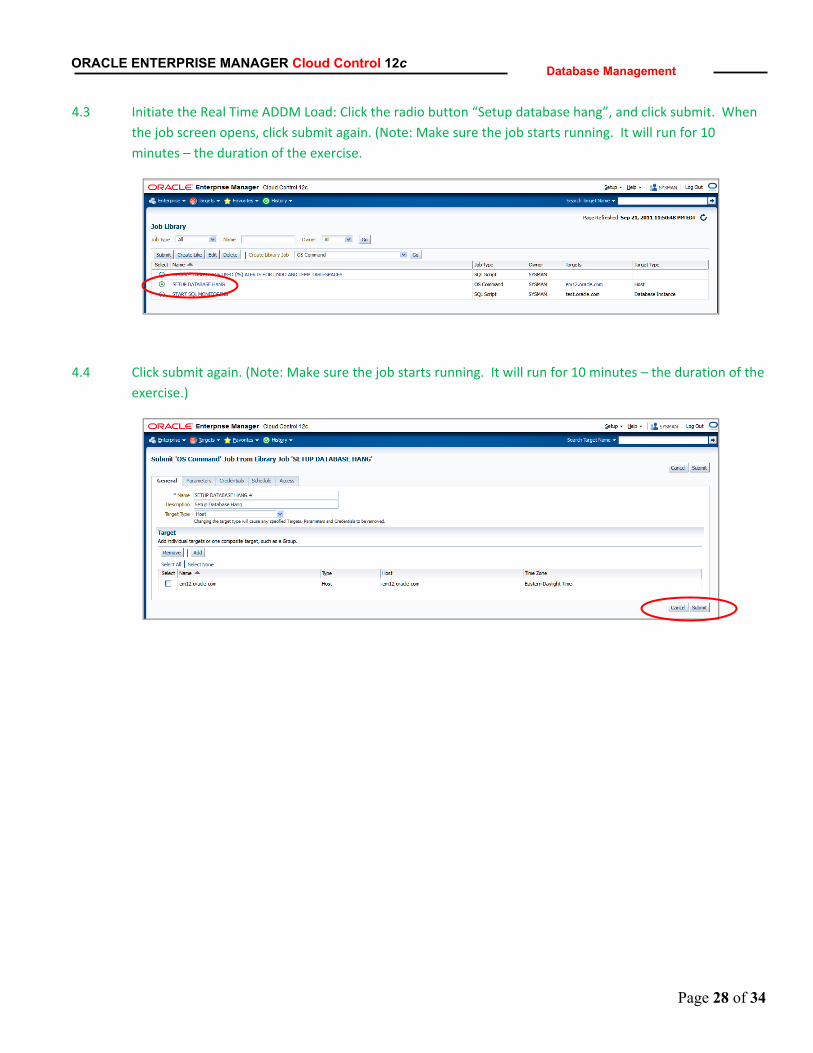
4.3 Initiate the Real Time ADDM Load: Click the radio button “Setup database hang”, and click submit. When the job screen opens, click submit again. (Note: Make sure the job starts running. It will run for 10 minutes – the duration of the exercise.
4.4 Click submit again. (Note: Make sure the job starts running. It will run for 10 minutes – the duration of the exercise.)

Page 29 of 34
ORACLE ENTERPRISE MANAGER Cloud Control 12c Database Management
4.5 Navigate to Databases: From any page, use the menu item History ‐> test database to navigate directly to the test database
4.6 Given that the job that we just launched put the database in a hung state, you might receive messages
that it is having difficulty connecting to the database. This is expected.

Page 30 of 34
ORACLE ENTERPRISE MANAGER Cloud Control 12c Database Management
4.7 From the test Database Home Page, select Performance ‐> Real‐Time ADDM.

Page 31 of 34
ORACLE ENTERPRISE MANAGER Cloud Control 12c Database Management
4.8 You might be prompted for credentials, if so, choose “Named Credentials = DB‐TEST_SYS”. Click Submit.
4.9 When the Real‐TIme ADDM page opens, you will see two sections ‐ he graphical section on top, and the Details section on the bottom.

Page 32 of 34
ORACLE ENTERPRISE MANAGER Cloud Control 12c Database Management
4.10 On the Details section, click on the Start button. Observe the Status column: (Note that when the analysis is in progress, the status is denoted as “IN PROGRESS”. When completed, the status becomes “FINISHED”).
For this exercise, however, the status will not become “Finished” until we kill the offending job.
4.11 Click on the Findings TAB. Here you will see the offending process id that needs to be killed in a VNC or Putty session. Make note of the process id. In this particular example, there are two offending process ids.
Page 33 of 34
ORACLE ENTERPRISE MANAGER Cloud Control 12c Database Management
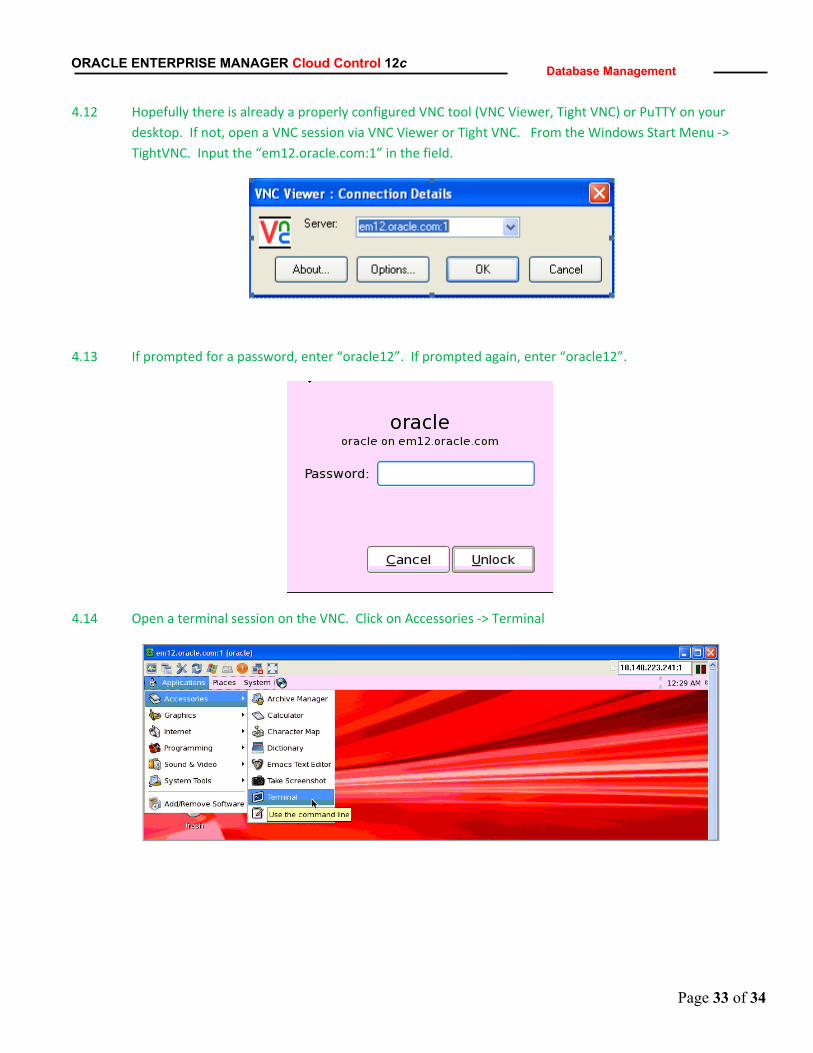
4.12 Hopefully there is already a properly configured VNC tool (VNC Viewer, Tight VNC) or PuTTY on your desktop. If not, open a VNC session via VNC Viewer or Tight VNC. From the Windows Start Menu ‐> TightVNC. Input the “em12.oracle.com:1” in the field.
4.13 If prompted for a password, enter “oracle12”. If prompted again, enter “oracle12”.
4.14 Open a terminal session on the VNC. Click on Accessories ‐> Terminal
Page 34 of 34
ORACLE ENTERPRISE MANAGER Cloud Control 12c Database Management
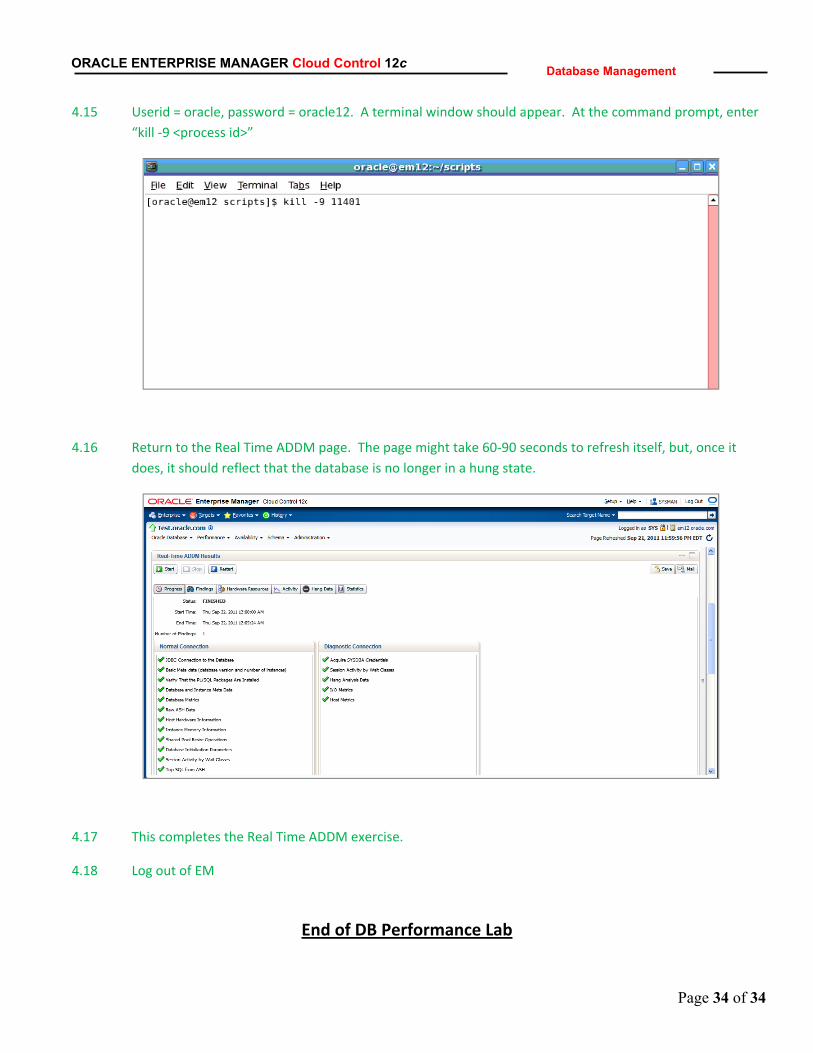
4.15 Userid = oracle, password = oracle12. A terminal window should appear. At the command prompt, enter “kill ‐9 <process id>”
4.16 Return to the Real Time ADDM page. The page might take 60‐90 seconds to refresh itself, but, once it does, it should reflect that the database is no longer in a hung state.
4.17 This completes the Real Time ADDM exercise.
4.18 Log out of EM
End of DB Performance Lab

Page 1 of 21
ORACLE ENTERPRISE MANAGER 12c Middleware Management
Section III – Middleware Management
Objective:
The objective of this lab to provide exercises designed to showcase the new middleware management capabilities in Oracle Enterprise Manager 12c.
Functional Coverage:
In this lab you will go through new features in the following functional areas:
1. Composite Application Management
2. Cross‐tier root cause analysis using JVM Diagnostics (JVMD)
3. Middleware Diagnostic Advisor

Page 2 of 21
ORACLE ENTERPRISE MANAGER 12c Middleware Management
A. Composite Application Management Estimated Time to Complete Use Case: 8 minutes Business Problem/Use Case In complex datacenter environments administrators need a single window view of top level metrics/information
related to critical SLA of business services, application performance which expose the business services, critical
business metrics exposed by applications, and performance of application stack components. This allows
administrators to save times as they may have to visit several performance pages and consoles to get high level
perspective of their environment. Some business applications such as CRM expose critical business metrics e.g.
Number of Orders. In such cases dashboards become even more important as they allow administrators to bridge
the gap between business metrics and system metrics. Also, requirements of every business, datacenter are
different. In such scenario obviously Administrator would require an ability to customize dashboard and select
appropriate performance metrics from various source.
In this particular case a datacenter has Java EE and SOA composite applications deployed which exposes some
business services in the form of Web Services. These Java EE and SOA applications are deployed on a stack of
components including WebLogic and Database. Organization has agreed to SLAs on the services which are exposed
by the Web Services. Administrator wants to create a dashboard where he can choose the Web Services, define and
monitor SLAs on it, monitor key metrics on application stack components such as WebLogic, database and hosts.
Using Oracle Enterprise Manager an Administrator creates a Composite Application to group JEE and SOA composite
applications, identifies the key business services and define SLAs on it. While creating the Composite Application the
administrator also creates a dashboard which he customizes for his specific use.

Page 3 of 21
ORACLE ENTERPRISE MANAGER 12c Middleware Management
1. Composite Application Management
1.1 Logout and login again using sysman / oracle12

Page 4 of 21
ORACLE ENTERPRISE MANAGER 12c Middleware Management
1.2 In this case, we want to create a new Composite Application from multiple applications running across a domain and monitor the associated services. Navigate to the Middleware Targets: Targets ‐> Composite Application

Page 5 of 21
ORACLE ENTERPRISE MANAGER 12c Middleware Management
1.3 We can see a single Composite Application has already been created, which we will be taking a look at in a subsequent exercise. We are now going to create our own though from scratch. We can start the Composite Application creation wizard by clicking the “Create” button on the page.

Page 6 of 21
ORACLE ENTERPRISE MANAGER 12c Middleware Management
1.4 We will now go through the four step process to create the Composite Application. The first step allows you to select the Application Deployments and/or SOA Composites that you would like to include in the Composite Application. In this case, please start by typing in the Composite Application name (use “Composite_Application_<your_name>” or a different unique name for your Composite Application) and choose US Pacific Standard Time (PST) from the time zone selection.

Page 7 of 21
ORACLE ENTERPRISE MANAGER 12c Middleware Management
1.5 You can now add applications and SOA composites, please click the add button and enter “mda_domain” into the Target Name filter and click the Search button. You should now highlight all of the Application Deployments and click “Select”. Once completed, the pop‐up will close and you will see your selected Application Deployments listed, you can now click “Next” to go to the next step.
Page 8 of 21
ORACLE ENTERPRISE MANAGER 12c Middleware Management
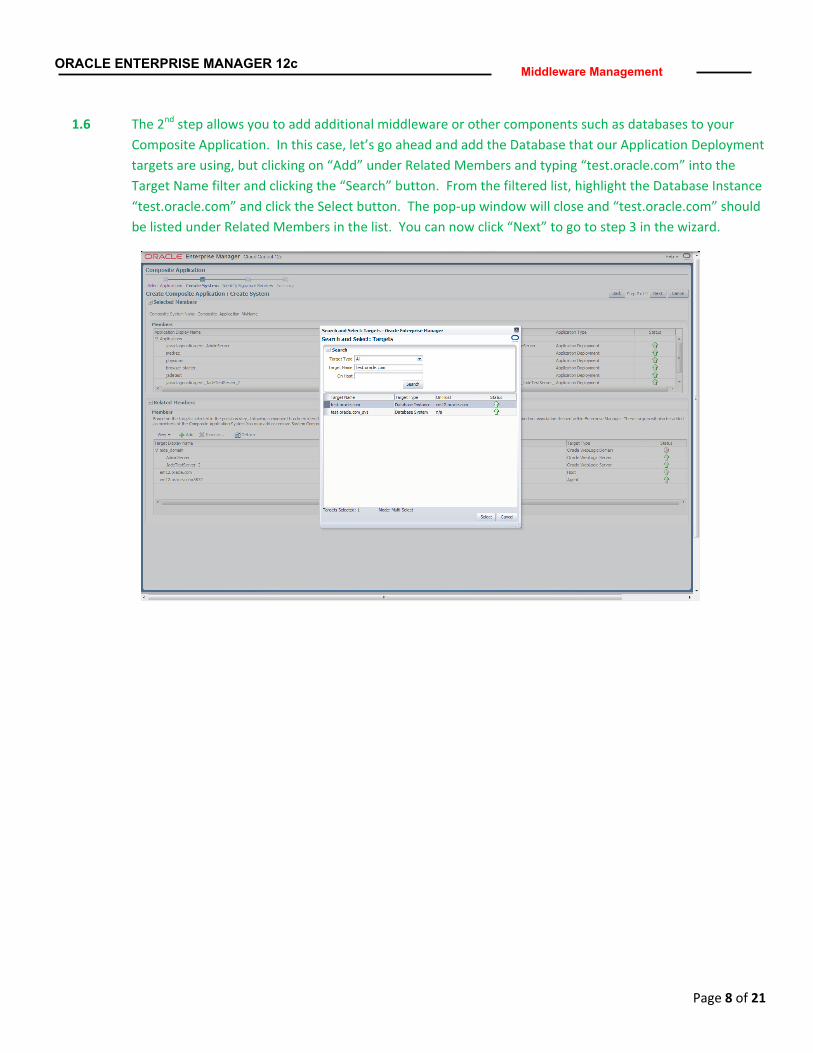
1.6 The 2nd step allows you to add additional middleware or other components such as databases to your Composite Application. In this case, let’s go ahead and add the Database that our Application Deployment targets are using, but clicking on “Add” under Related Members and typing “test.oracle.com” into the Target Name filter and clicking the “Search” button. From the filtered list, highlight the Database Instance “test.oracle.com” and click the Select button. The pop‐up window will close and “test.oracle.com” should be listed under Related Members in the list. You can now click “Next” to go to step 3 in the wizard.
Page 9 of 21
ORACLE ENTERPRISE MANAGER 12c Middleware Management
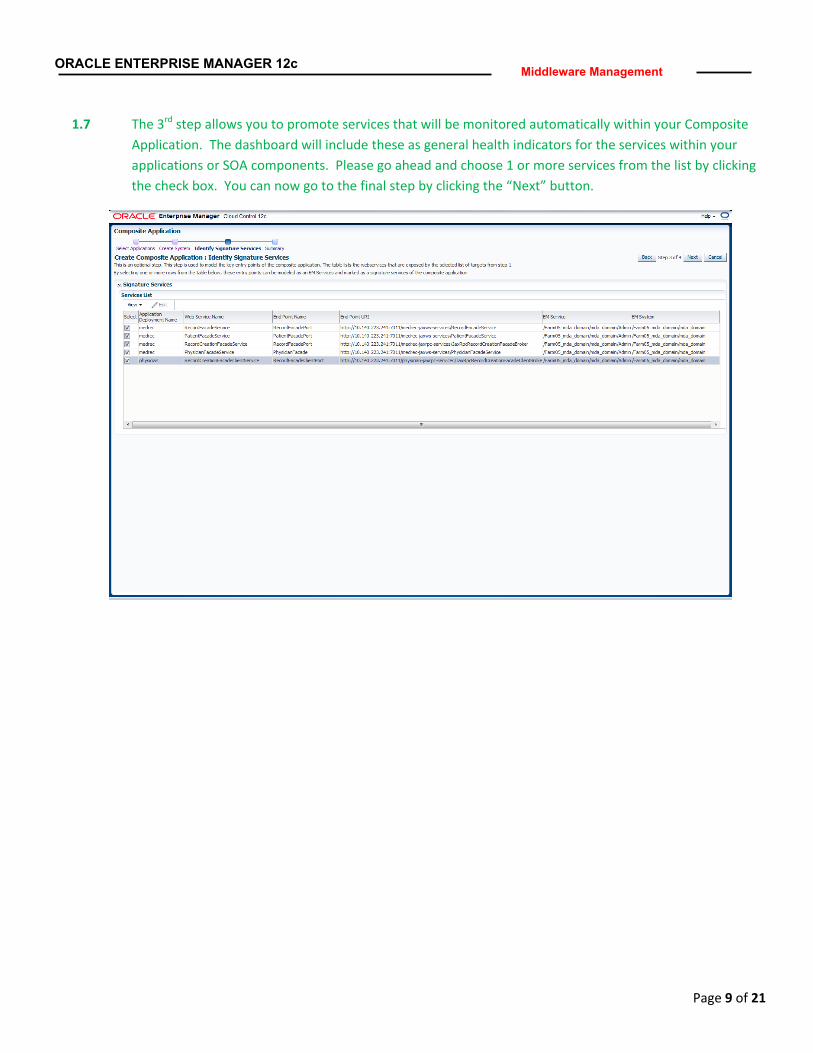
1.7 The 3rd step allows you to promote services that will be monitored automatically within your Composite Application. The dashboard will include these as general health indicators for the services within your applications or SOA components. Please go ahead and choose 1 or more services from the list by clicking the check box. You can now go to the final step by clicking the “Next” button.
Page 10 of 21
ORACLE ENTERPRISE MANAGER 12c Middleware Management
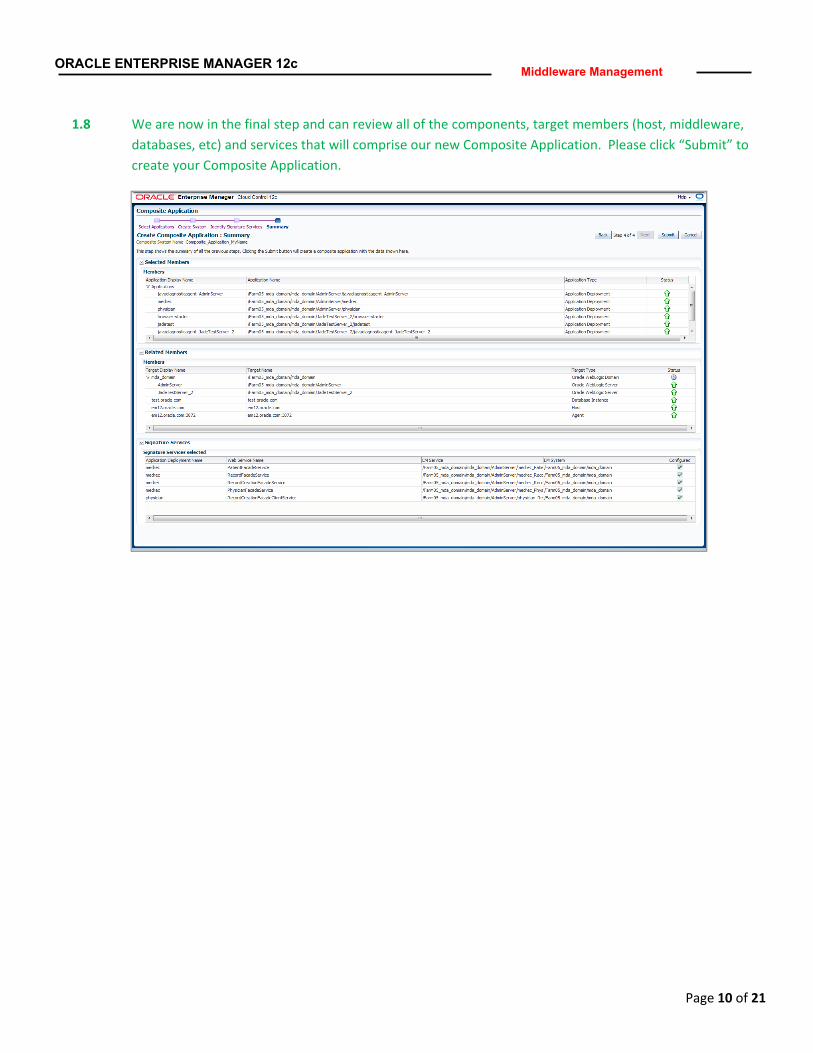
1.8 We are now in the final step and can review all of the components, target members (host, middleware, databases, etc) and services that will comprise our new Composite Application. Please click “Submit” to create your Composite Application.
Page 11 of 21
ORACLE ENTERPRISE MANAGER 12c Middleware Management
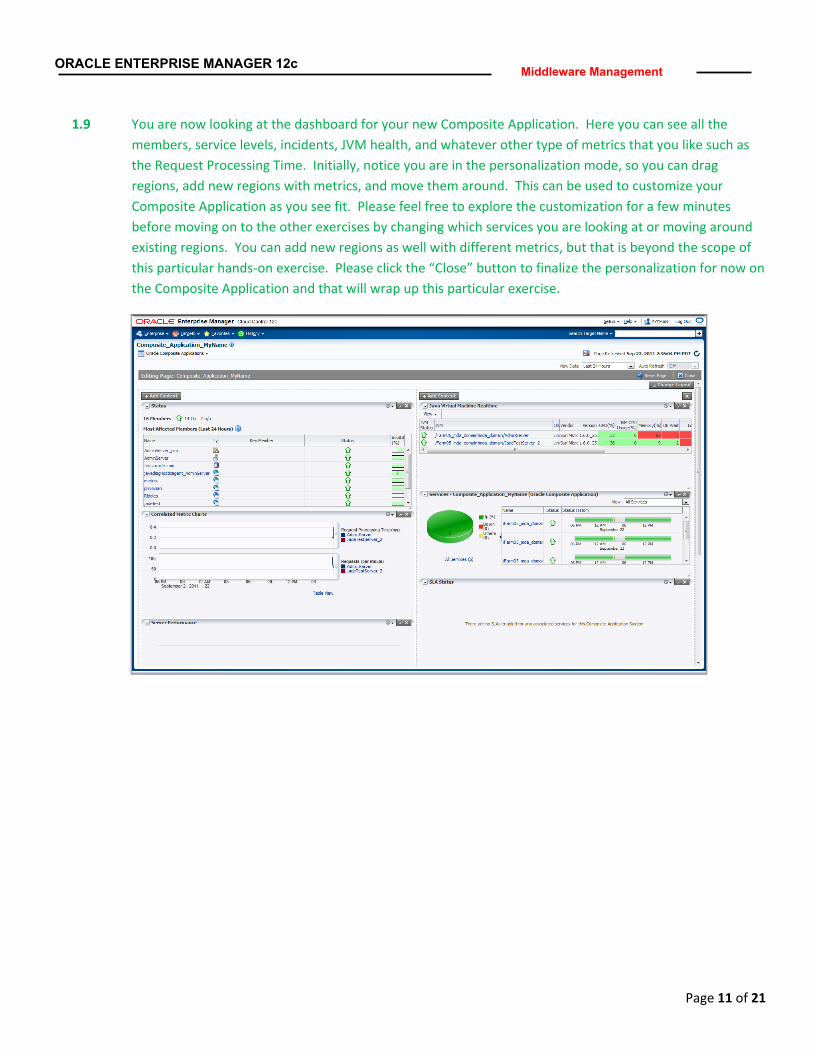
1.9 You are now looking at the dashboard for your new Composite Application. Here you can see all the members, service levels, incidents, JVM health, and whatever other type of metrics that you like such as the Request Processing Time. Initially, notice you are in the personalization mode, so you can drag regions, add new regions with metrics, and move them around. This can be used to customize your Composite Application as you see fit. Please feel free to explore the customization for a few minutes before moving on to the other exercises by changing which services you are looking at or moving around existing regions. You can add new regions as well with different metrics, but that is beyond the scope of this particular hands‐on exercise. Please click the “Close” button to finalize the personalization for now on the Composite Application and that will wrap up this particular exercise.

Page 12 of 21
ORACLE ENTERPRISE MANAGER 12c Middleware Management
B. Cross-tier root cause analysis using JVM Diagnostics (JVMD)
Estimated Time to Complete Use Case: 8 minutes Business Case
• Assume a notification of an incident has occurred for a specific Composite Application indicating at the request time for a critical business application has been reduced to near‐zero
• Drill into alert/incident and utilize problem analysis to confirm the problematic component, drill‐
back into the problematic Application Deployment home page to analyze further
• Investigating further shows that this is consistent with heavy load on the application. Using Enterprise Manager’s Composite Application dashboard and Application and Dependency
• Once you determine the root cause of performance problem by drilling down through the Java EE
infrastructure and identifying the problematic component, continue to drill back into JVM diagnostics in context from that component back to the root cause.
• Examine underlying JVM performance and threads to better understand to correlate the perceived
performance issues of the components with the underlying JVM activity
• Drill back into perceived DB lock problem back to DB diagnostics to determine what might be the underlying cause of the locked SQL call displayed JVM Diagnostics
2. Understanding the Top Activity page
2.1 This lab assumes that you are already signed on to Enterprise Manager. If you are not signed on, follow steps 1.1 and 1.2 above.
2.2 Navigate to Composite Applications. Enterprise Manager ‐> Targets ‐> Composite Applications

Page 13 of 21
ORACLE ENTERPRISE MANAGER 12c Middleware Management
2.3 Place your cursor over the Target “Composite_Application”. Click
2.4 In this case, we can see a number of locks in both of our JVM targets. As you can see, these are
highlighted as red in the Java Virtual Machine Real‐time region. We are going to focus on the jadetestServer_2_jvm. Please note the high number of locks showing on that particular JVM.
2.5 In order to quickly investigate this, we can click on the JVM link directly in the Java Virtual Machine Realtime region.

Page 14 of 21
ORACLE ENTERPRISE MANAGER 12c Middleware Management
2.6 You are now on the JadetestServer_2_jvm within the WLS Domain associated with JadetestServer_2. You can see a various metrics including the CPU, memory, garbage collection, thread state and other key metrics. You can easily filter on these by clicking on anything in the associated graphs below or via the filters at the top. In this case, now filters are necessary, but feel free to experiment with the metrics and filtering which goes all the way to the associated database metrics (bottom of the page). The large number of database waits and other thread states is very indicative of a hung application and thus that will be the focus of our root cause analysis.

Page 15 of 21
ORACLE ENTERPRISE MANAGER 12c Middleware Management
2.7 Let’s investigate the thread state of the real‐time JVM environment, but let’s click on the Live Thread Analysis link at the top to take us into the live thread investigation. You are now looking at the Live Thread screen showing the threads and their state and associated variable and other key component and member metrics.
2.8 We can see several threads in a wait or locked state. If we click on any related to the /additem.jsp or /checkout.jsp requests from our application, we can see that they are either locked by another thread or in a DB Wait state. We will quickly find that everything maps back to the fact that the threads with a DB Wait state are locking the application. In order to discover the root cause, we need to drill back to the database session. We can do this by highlighting any thread with a DB Wait state and then clicking the DB Wait link in the Thread Info.

Page 16 of 21
ORACLE ENTERPRISE MANAGER 12c Middleware Management
2.9 We are now in the database diagnostics screen and can see the database session associated with the SQL our application is trying to run is locked by table lock contention created from another database session.

Page 17 of 21
ORACLE ENTERPRISE MANAGER 12c Middleware Management
2.10 By clicking the Blocking Session ID, we can drill back into the blocking session which turns out to be a SQL session that is kicked off from SQLPlus outside the application, which represents a maintenance routine that has accidently locked the table. In this case, please do not kill the blocking SQL session, but keep in mind that at this point the issue could be addressed by a DBA thus completing the communication between different teams necessary to resolve a potentially painful cross‐tier problem impacting the service levels of our application.
6

Page 18 of 21
ORACLE ENTERPRISE MANAGER 12c Middleware Management
C. Middleware Diagnostic Advisor
Estimated Time to Complete Use Case: 8 minutes
Business Case Users are experiencing application response time issues. Typically Administrator will get lost in hundreds and thousands of metrics that are coming in from various sources. More time Administrator spends on doing the root cause manually may actually mean more loss business for the organization. Oracle Enterprise Manager helps Administrator with valuable information rather than just bunch of ‘performance metrics’. This information is given in terms of ‘findings’ on WebLogic server. These performance findings are generated based on variety of performance metrics from Oracle Enterprise Manager’s End‐to‐End diagnostic solution and various rules that will determine the root cause of the issue. This proactive root‐cause‐analysis helps Administrator save valuable time when it comes to identifying performance bottlenecks in production applications. In this particular case Oracle Enterprise Manager finds if the application response time issues is caused by applications having to wait (for longer time) for getting JDBC database connection from the JDBC datasource. Using various correlated metrics and complex rules Oracle Enterprise Managers decides if the JDBC datasource pool size is inadequate and gives appropriate finding.
3. Understanding the Middleware Diagnostic Advisor
3.1 This lab assumes that you are already signed on to Enterprise Manager. If you are not signed on, follow steps 1.1 and 1.2 above.

Page 19 of 21
ORACLE ENTERPRISE MANAGER 12c Middleware Management
3.2 From any page in Enterprise Manager, navigate to the Middleware targets, via “Targets ‐> Middleware”
3.3 From the Middleware Targets Home Page, filter on “AdminServer”, and click the arrow to search for that target name. Click on the “AdminServer” in the mda_domain.

Page 20 of 21
ORACLE ENTERPRISE MANAGER 12c Middleware Management
3.4 On the Admin Server Home Page, click on the number associated with Diagnostic Findings
3.5 The Diagnostic Advisor Home Page lists the diagnostic findings generated over a certain time period. We
can also examine each finding by clicking on the icon under the chart.
Drill into the finding by clicking on “SQL Execution takes a long time”.

Page 21 of 21
ORACLE ENTERPRISE MANAGER 12c Middleware Management
3.6 This takes you to the JDBC SQL Exception page. There are a number of different charts and data that can assist middleware, database, and functional analysts to troubleshoot issues.
End of FMW Lab