oracle solaris studio 12.2 dbxtool tutorial - oracle documentation
TRANSCRIPT
Oracle Solaris Studio 12.2 dbxtoolTutorialSeptember 2010
■ “Introduction” on page 2■ “The Example Program” on page 2■ “Configuring dbxtool” on page 3■ “Diagnosing a Core Dump” on page 7■ “Using Breakpoints and Stepping” on page 14■ “Using Advanced Breakpoint Techniques” on page 22■ “Using Breakpoint Scripts to Patch Your Code” on page 41
IntroductionThis tutorial uses a “buggy” example program to demonstrate how to use dbxtool, the stand-alone graphicaluser interface (GUI) for the dbx debugger, effectively. It starts with the basics and then moves on to moreadvanced features.
The Example ProgramThis tutorial uses a simplified and somewhat artificial simulation of the dbx debugger. The source code forthis C++ program is available in the examples/debugger/debug_tutorial directory in your installed OracleSolaris Studio 12.2 software.
1. Copy the directory to your own private working area. For example:
cp -r /opt/solstudio12.2/examples/debugger/debug_tutorial ~/debug_tutorial
2. Build the program:
make
CC -g -c main.cc
CC -g -c interp.cc
CC -g -c cmd.cc
CC -g -c debugger.cc
CC -g -c cmds.cc
CC -g main.o interp.o cmd.o debugger.o cmds.o -o a.out
The program is made up of the following modules:
cmd.h cmd.cc Class Cmd, a base for implementingdebugger commands
interp.h interp.cc Class Interp, a simple commandinterpreter
debugger.h debugger.cc Class Debugger, mimics the mainsemantics of a debugger
cmds.h cmds.cc Implementations of various debuggingcommands
main.h main.cc The main() function and error handling.Sets up an Interp, creates variouscommands and assigns them to theInterp. Runs the Interp.
Run the program and try a few dbx commands:
$ a.out
> exec date
Sun Jun 21 16:13:06 PDT 2009
> display var
will display ’var’
> stop in X
> run running ...
stopped in X
Oracle Solaris Studio 12.2 dbxtool Tutorial 2
var = {
a = ’100’
b = ’101’
c = ’<error>’
d = ’102’
e = ’103’
f = ’104’
}
> quit
Goodby
$
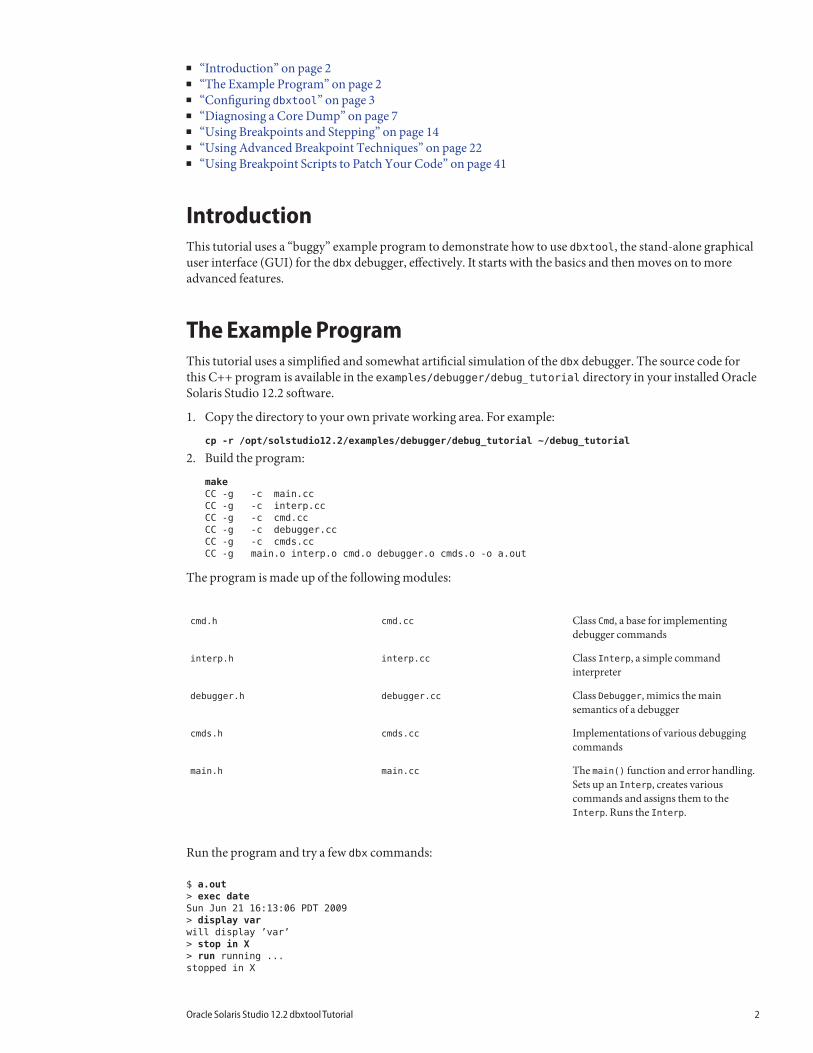
Configuring dbxtool
Start dbxtool by typing:
installation_directory/bin/dbxtool
The first time you start dbxtool, the window looks like the following:
If you are reading this tutorial in your web browser, it is probably taking up half your screen, so you will find itbeneficial to customize dbxtool to make it a half-screen application as well.
The following are examples of the various ways you can customize dbxtool.
■ Make the toolbar icons smaller:■ Right-click anywhere in the toolbar and choose Small Toolbar Icons.
■ Move the Call Stack window out of the way:
Oracle Solaris Studio 12.2 dbxtool Tutorial 3
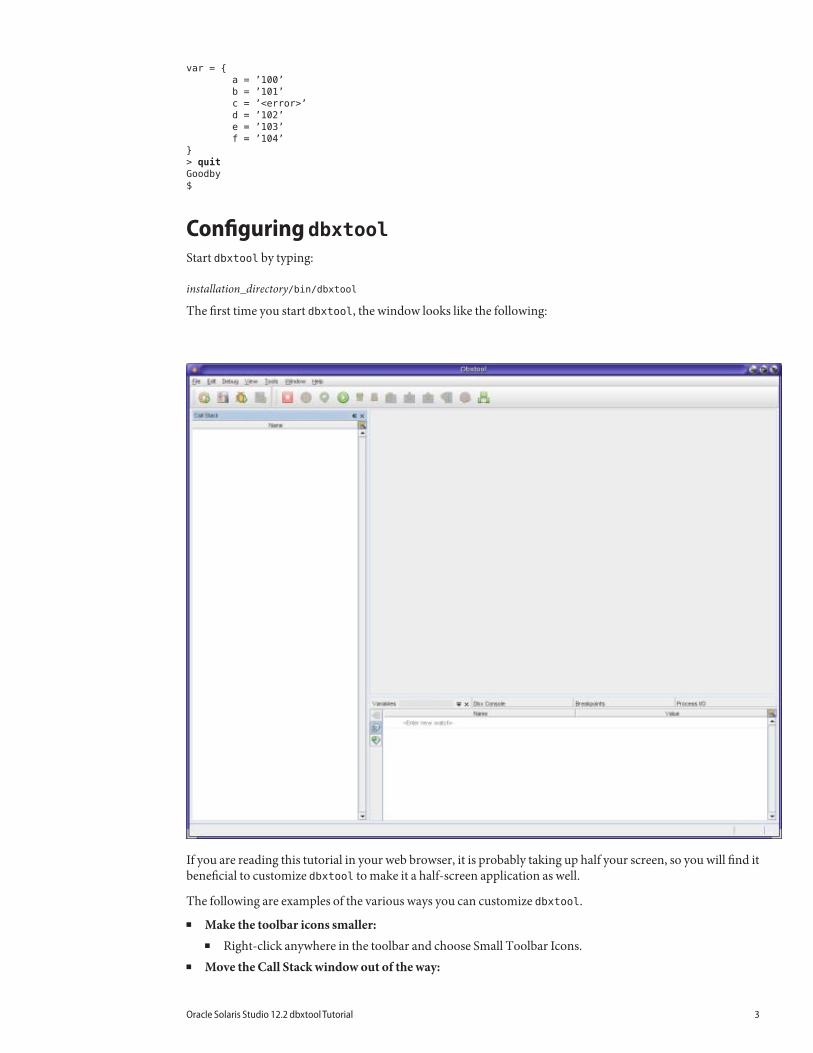
1. Click the header of the Call Stack window and drag the window downward and to the right. Let it gowhen the red outline is in this position:
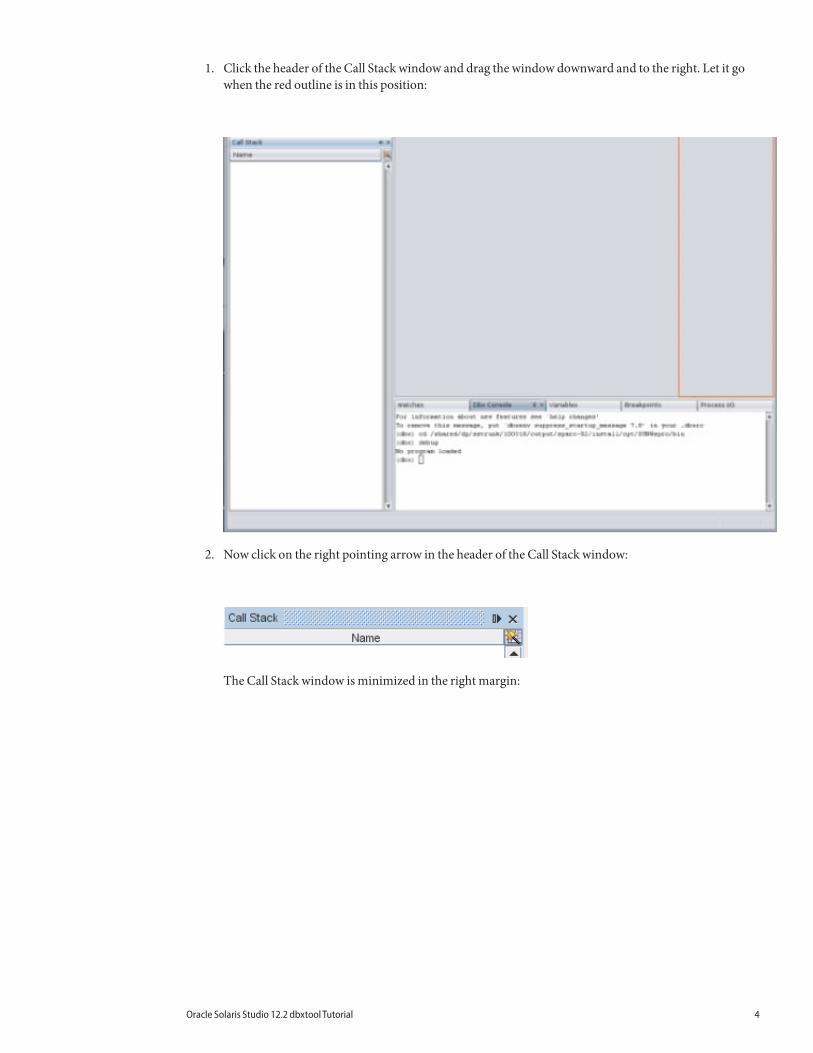
2. Now click on the right pointing arrow in the header of the Call Stack window:
The Call Stack window is minimized in the right margin:
Oracle Solaris Studio 12.2 dbxtool Tutorial 4
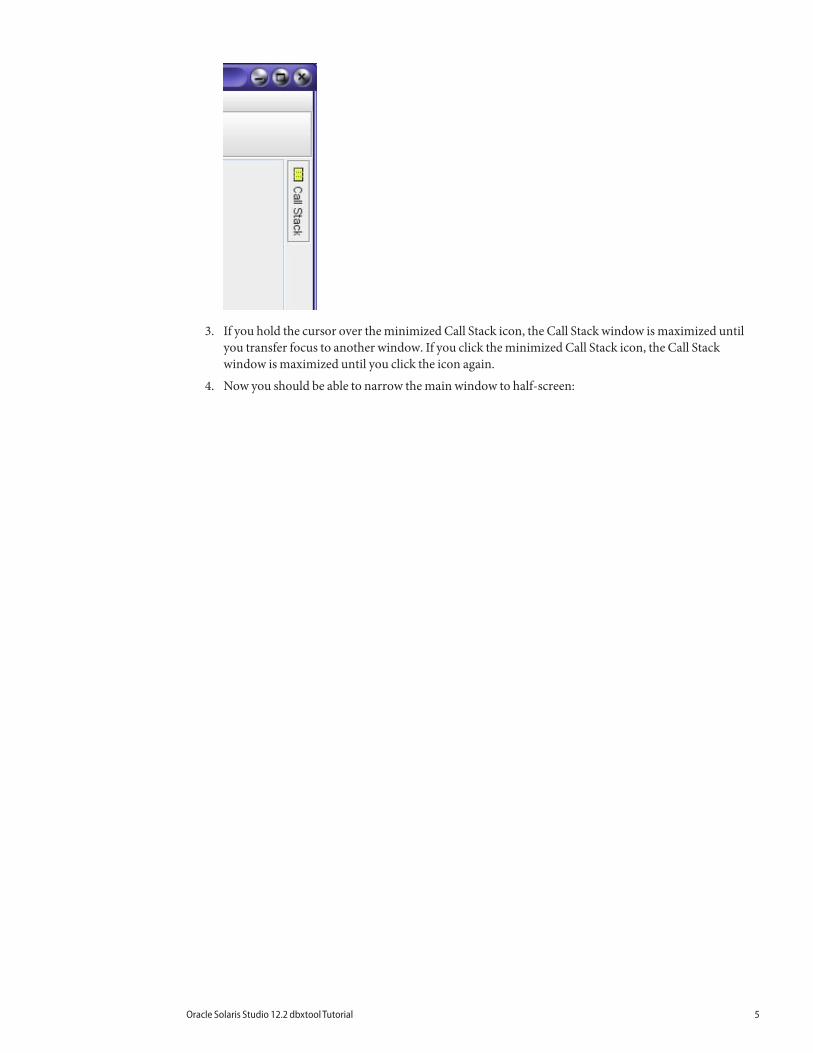
3. If you hold the cursor over the minimized Call Stack icon, the Call Stack window is maximized untilyou transfer focus to another window. If you click the minimized Call Stack icon, the Call Stackwindow is maximized until you click the icon again.
4. Now you should be able to narrow the main window to half-screen:
Oracle Solaris Studio 12.2 dbxtool Tutorial 5
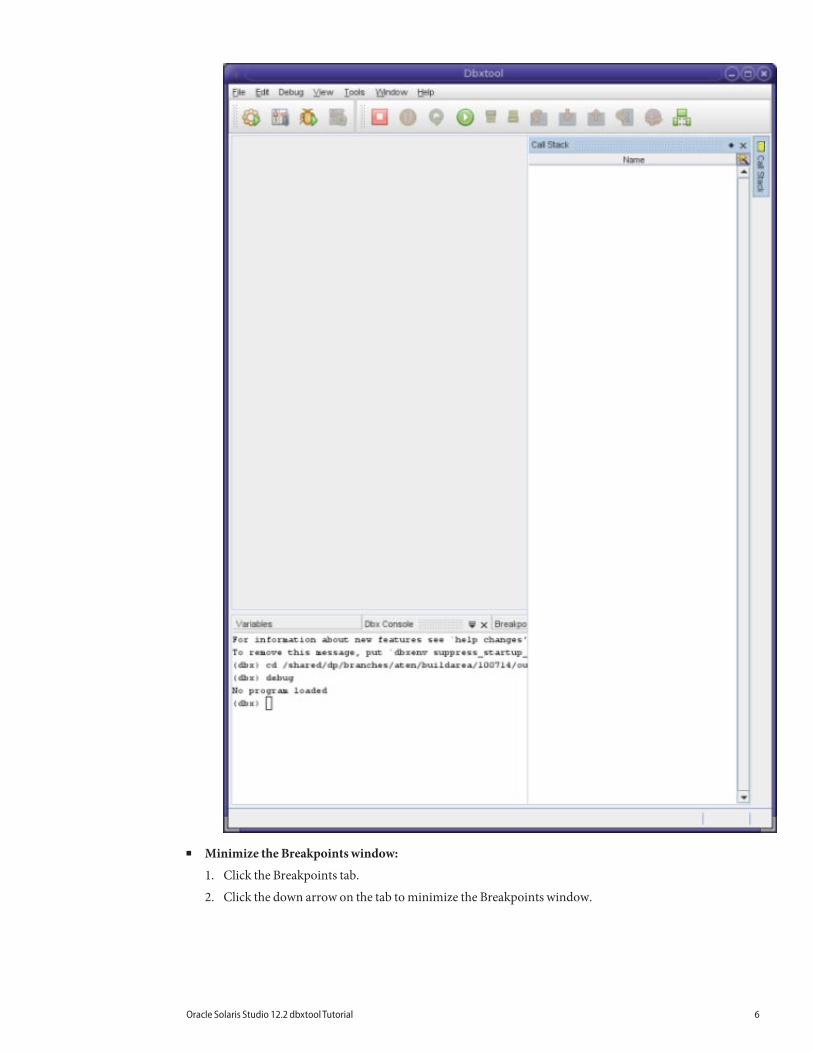
■ Minimize the Breakpoints window:
1. Click the Breakpoints tab.
2. Click the down arrow on the tab to minimize the Breakpoints window.
Oracle Solaris Studio 12.2 dbxtool Tutorial 6
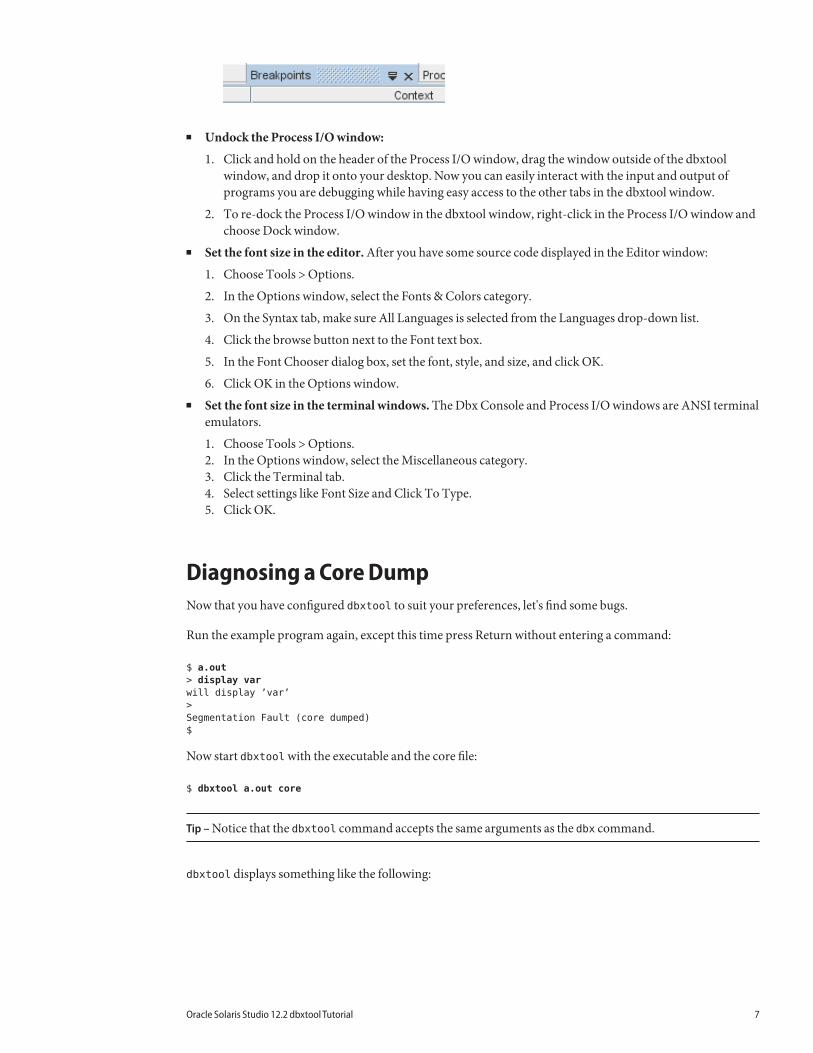
■ Undock the Process I/O window:
1. Click and hold on the header of the Process I/O window, drag the window outside of the dbxtoolwindow, and drop it onto your desktop. Now you can easily interact with the input and output ofprograms you are debugging while having easy access to the other tabs in the dbxtool window.
2. To re-dock the Process I/O window in the dbxtool window, right-click in the Process I/O window andchoose Dock window.
■ Set the font size in the editor. After you have some source code displayed in the Editor window:
1. Choose Tools > Options.
2. In the Options window, select the Fonts & Colors category.
3. On the Syntax tab, make sure All Languages is selected from the Languages drop-down list.
4. Click the browse button next to the Font text box.
5. In the Font Chooser dialog box, set the font, style, and size, and click OK.
6. Click OK in the Options window.■ Set the font size in the terminal windows. The Dbx Console and Process I/O windows are ANSI terminal
emulators.
1. Choose Tools > Options.2. In the Options window, select the Miscellaneous category.3. Click the Terminal tab.4. Select settings like Font Size and Click To Type.5. Click OK.
Diagnosing a Core DumpNow that you have configured dbxtool to suit your preferences, let's find some bugs.
Run the example program again, except this time press Return without entering a command:
$ a.out
> display var
will display ’var’
>
Segmentation Fault (core dumped)
$
Now start dbxtool with the executable and the core file:
$ dbxtool a.out core
Tip – Notice that the dbxtool command accepts the same arguments as the dbx command.
dbxtool displays something like the following:
Oracle Solaris Studio 12.2 dbxtool Tutorial 7
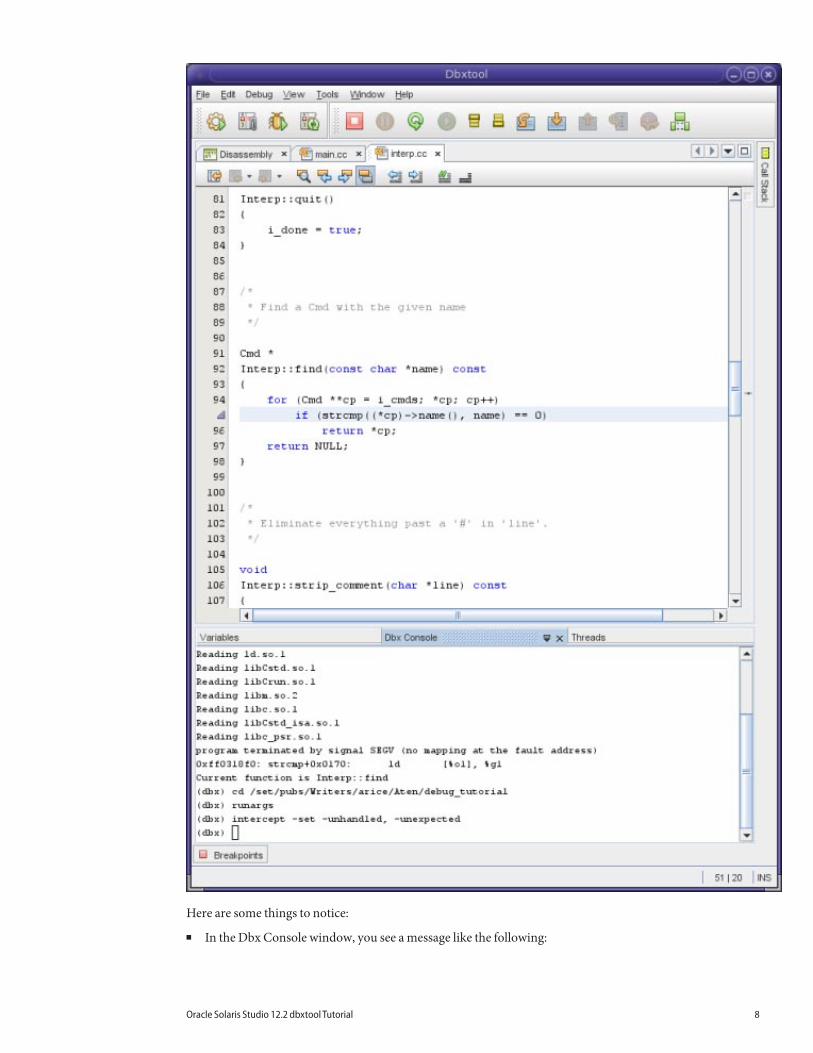
Here are some things to notice:
■ In the Dbx Console window, you see a message like the following:
Oracle Solaris Studio 12.2 dbxtool Tutorial 8
program terminated by signal SEGV (no mapping at fault address)
0xff0318f0: strcmp+0x0170: ld [%ol], %gl
Current function is Interp::find
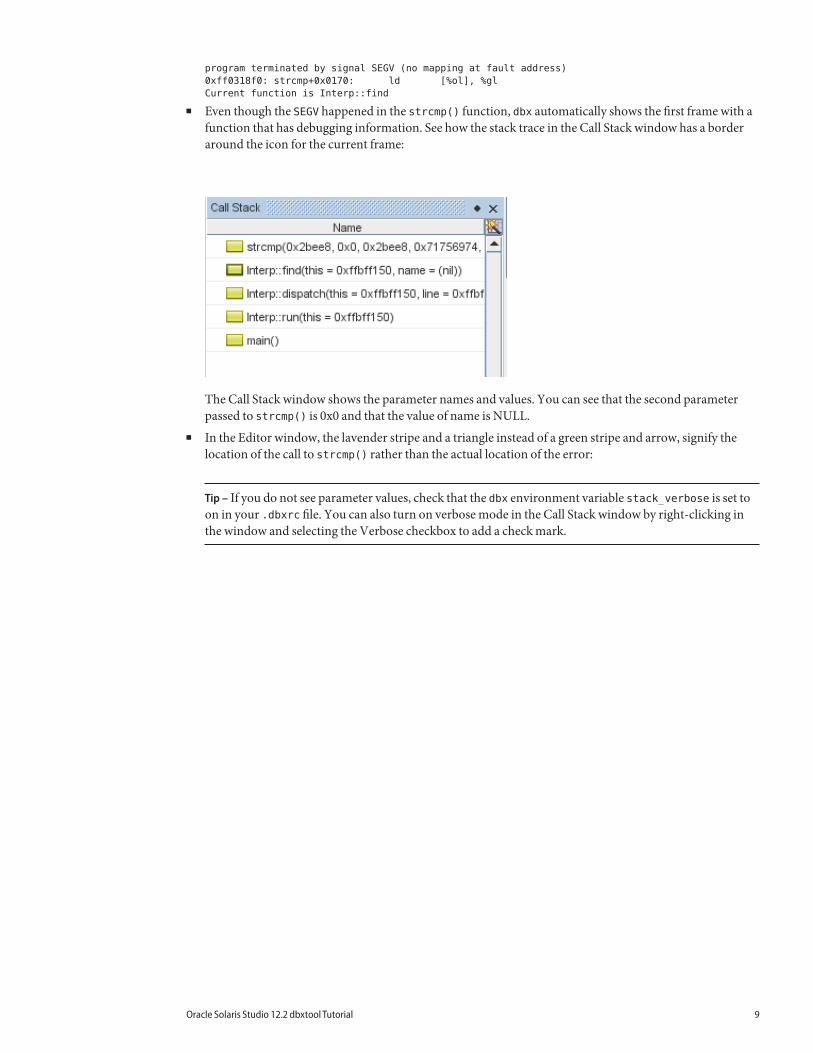
■ Even though the SEGV happened in the strcmp() function, dbx automatically shows the first frame with afunction that has debugging information. See how the stack trace in the Call Stack window has a borderaround the icon for the current frame:
The Call Stack window shows the parameter names and values. You can see that the second parameterpassed to strcmp() is 0x0 and that the value of name is NULL.
■ In the Editor window, the lavender stripe and a triangle instead of a green stripe and arrow, signify thelocation of the call to strcmp() rather than the actual location of the error:
Tip – If you do not see parameter values, check that the dbx environment variable stack_verbose is set toon in your .dbxrc file. You can also turn on verbose mode in the Call Stack window by right-clicking inthe window and selecting the Verbose checkbox to add a check mark.
Oracle Solaris Studio 12.2 dbxtool Tutorial 9
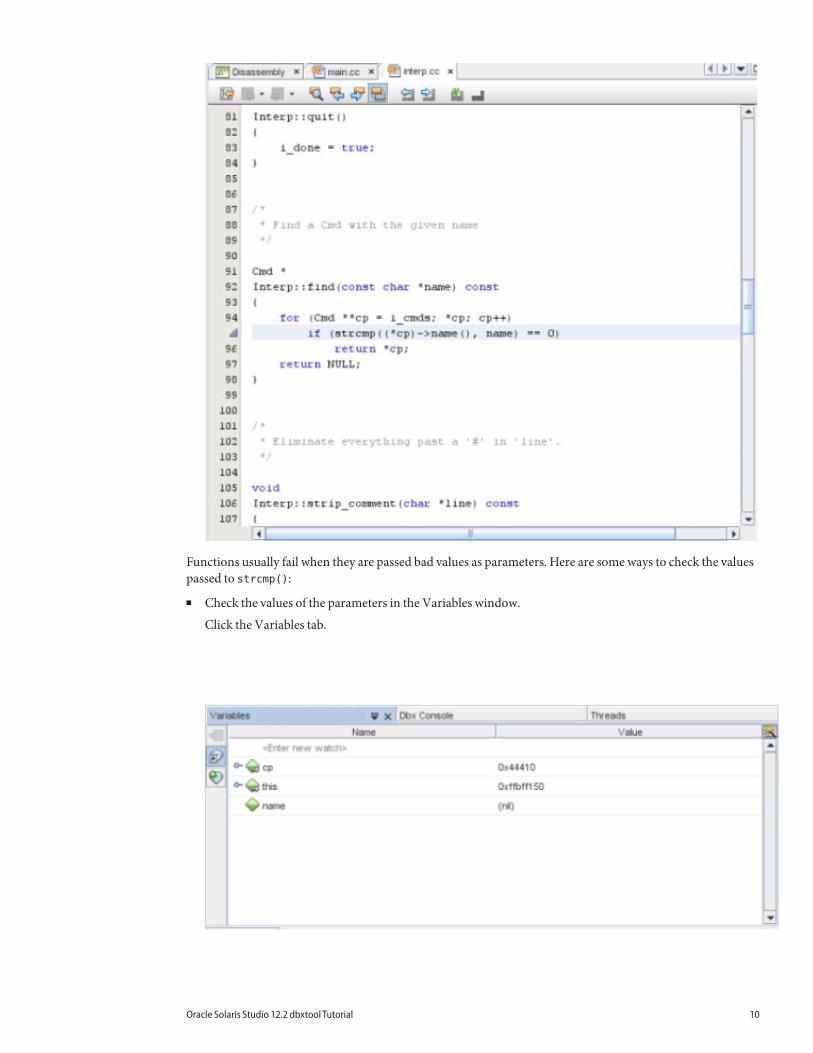
Functions usually fail when they are passed bad values as parameters. Here are some ways to check the valuespassed to strcmp():
■ Check the values of the parameters in the Variables window.
Click the Variables tab.
Oracle Solaris Studio 12.2 dbxtool Tutorial 10
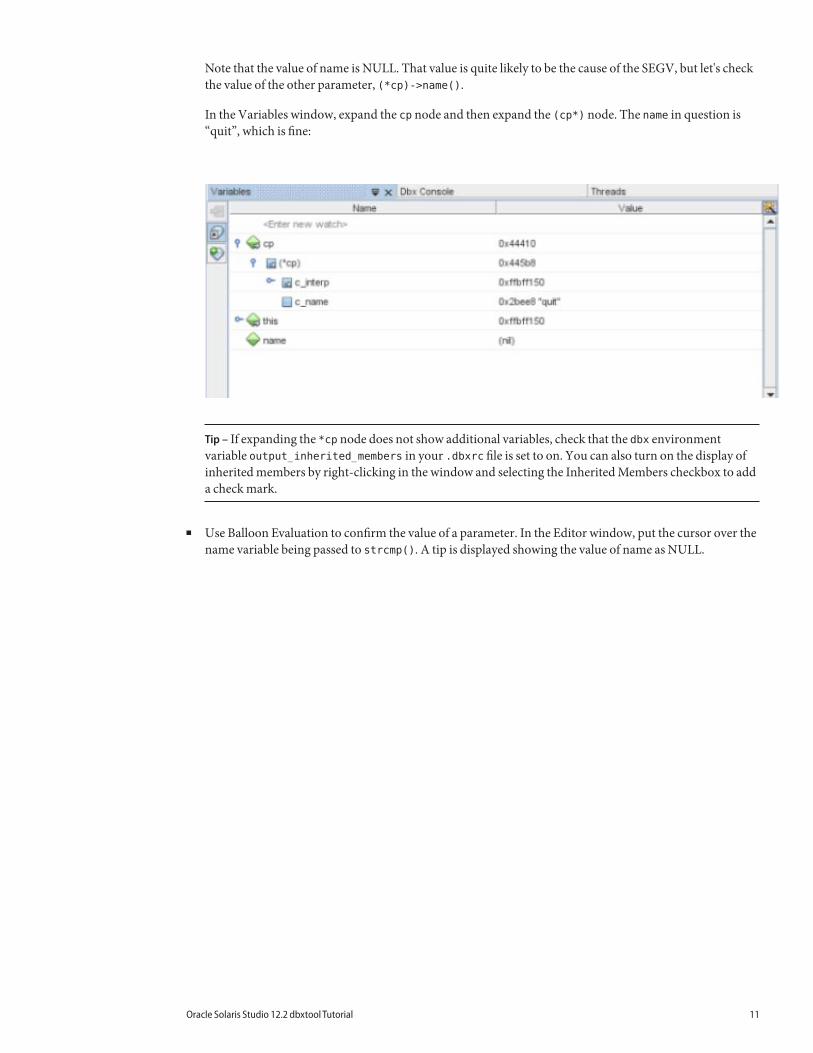
Note that the value of name is NULL. That value is quite likely to be the cause of the SEGV, but let's checkthe value of the other parameter, (*cp)->name().
In the Variables window, expand the cp node and then expand the (cp*) node. The name in question is“quit”, which is fine:
Tip – If expanding the *cp node does not show additional variables, check that the dbx environmentvariable output_inherited_members in your .dbxrc file is set to on. You can also turn on the display ofinherited members by right-clicking in the window and selecting the Inherited Members checkbox to adda check mark.
■ Use Balloon Evaluation to confirm the value of a parameter. In the Editor window, put the cursor over thename variable being passed to strcmp(). A tip is displayed showing the value of name as NULL.
Oracle Solaris Studio 12.2 dbxtool Tutorial 11
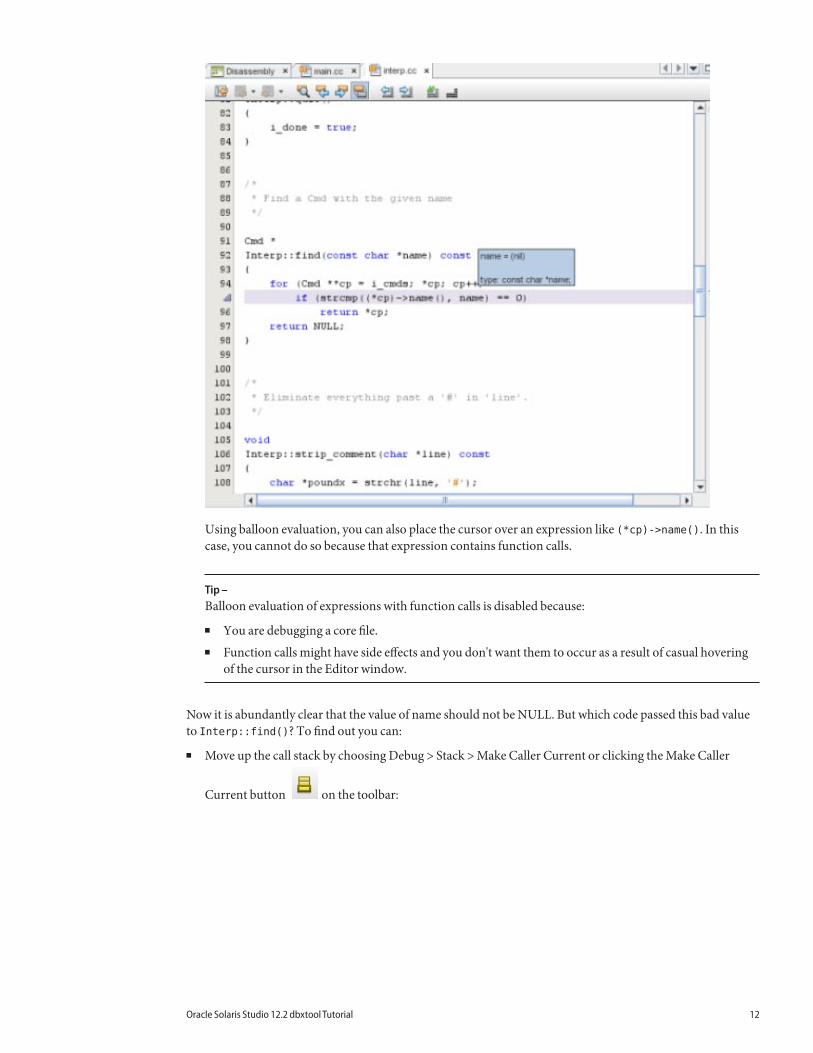
Using balloon evaluation, you can also place the cursor over an expression like (*cp)->name(). In thiscase, you cannot do so because that expression contains function calls.
Tip –Balloon evaluation of expressions with function calls is disabled because:
■ You are debugging a core file.■ Function calls might have side effects and you don't want them to occur as a result of casual hovering
of the cursor in the Editor window.
Now it is abundantly clear that the value of name should not be NULL. But which code passed this bad valueto Interp::find()? To find out you can:
■ Move up the call stack by choosing Debug > Stack > Make Caller Current or clicking the Make Caller
Current button on the toolbar:
Oracle Solaris Studio 12.2 dbxtool Tutorial 12
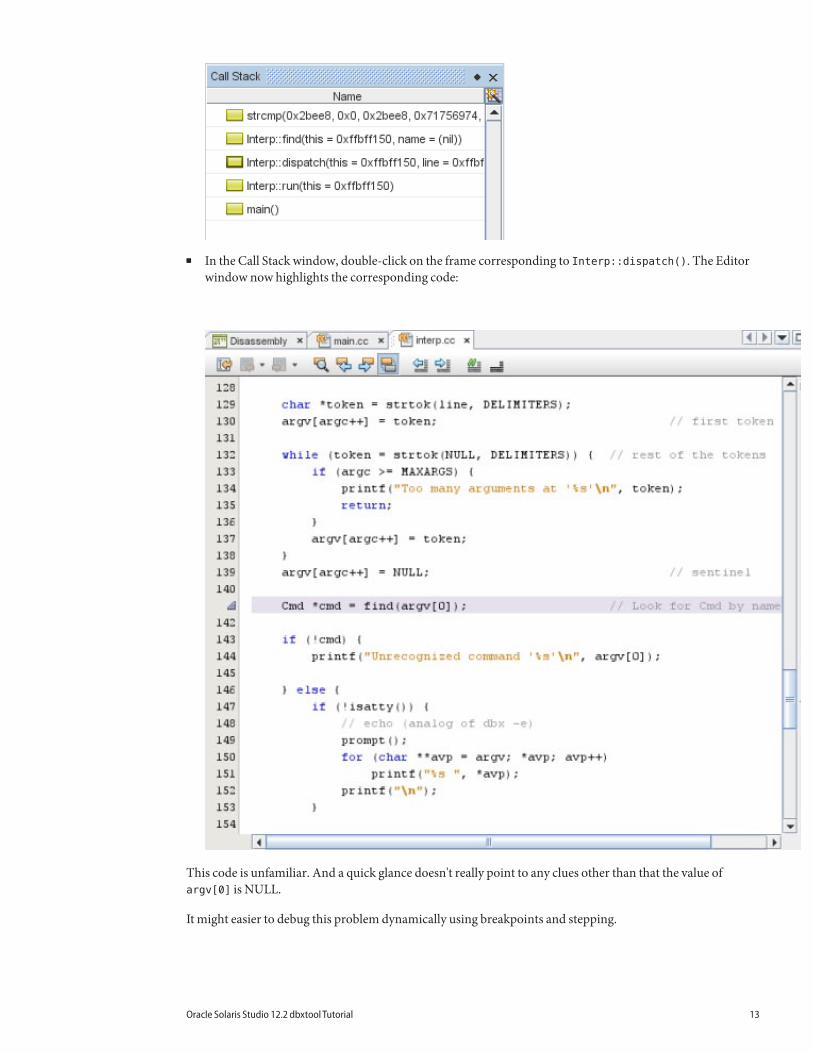
■ In the Call Stack window, double-click on the frame corresponding to Interp::dispatch(). The Editorwindow now highlights the corresponding code:
This code is unfamiliar. And a quick glance doesn't really point to any clues other than that the value ofargv[0] is NULL.
It might easier to debug this problem dynamically using breakpoints and stepping.
Oracle Solaris Studio 12.2 dbxtool Tutorial 13
Using Breakpoints and SteppingBreakpoints let you stop a program a bit before the manifestation of a bug and step through the code in thehope of discovering what went wrong.
If you haven't already done so, now might be a good time to undock the Process I/O window.
You ran the program from the command line earlier. Now reproduce the bug by running the program indbxtool:
1. Click the Run button on the toolbar or type run in the Dbx Console window.
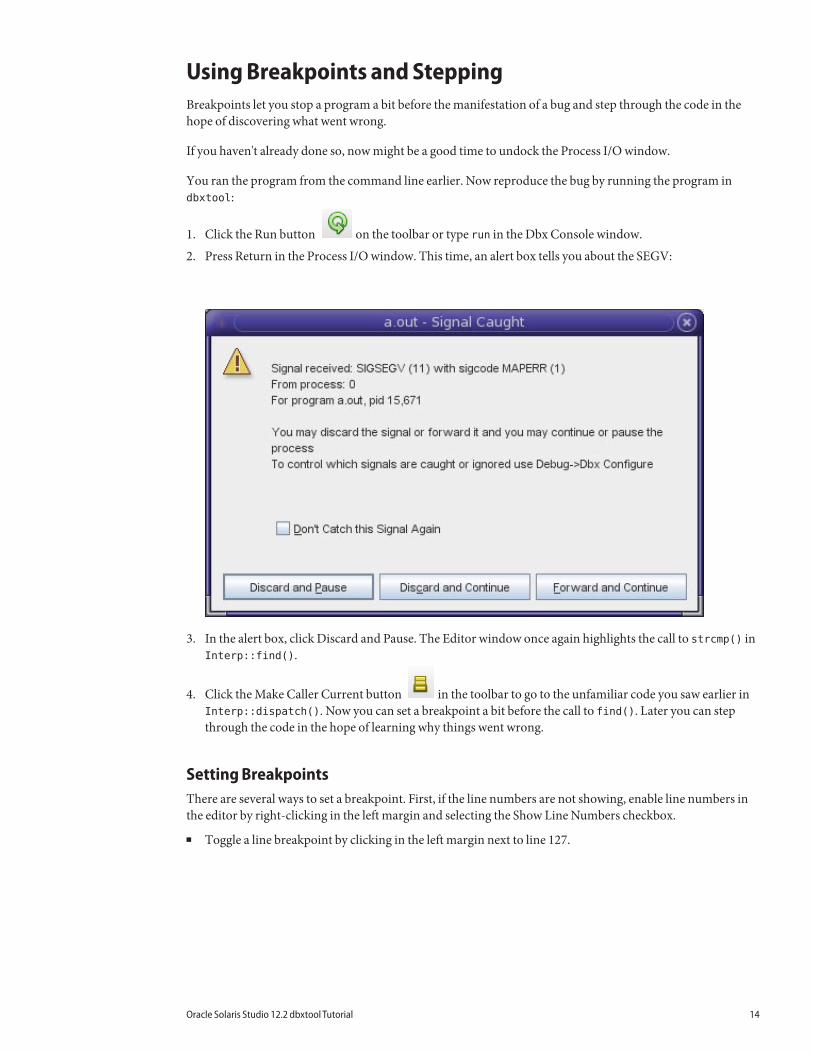
2. Press Return in the Process I/O window. This time, an alert box tells you about the SEGV:
3. In the alert box, click Discard and Pause. The Editor window once again highlights the call to strcmp() inInterp::find().
4. Click the Make Caller Current button in the toolbar to go to the unfamiliar code you saw earlier inInterp::dispatch(). Now you can set a breakpoint a bit before the call to find(). Later you can stepthrough the code in the hope of learning why things went wrong.
Setting BreakpointsThere are several ways to set a breakpoint. First, if the line numbers are not showing, enable line numbers inthe editor by right-clicking in the left margin and selecting the Show Line Numbers checkbox.
■ Toggle a line breakpoint by clicking in the left margin next to line 127.
Oracle Solaris Studio 12.2 dbxtool Tutorial 14
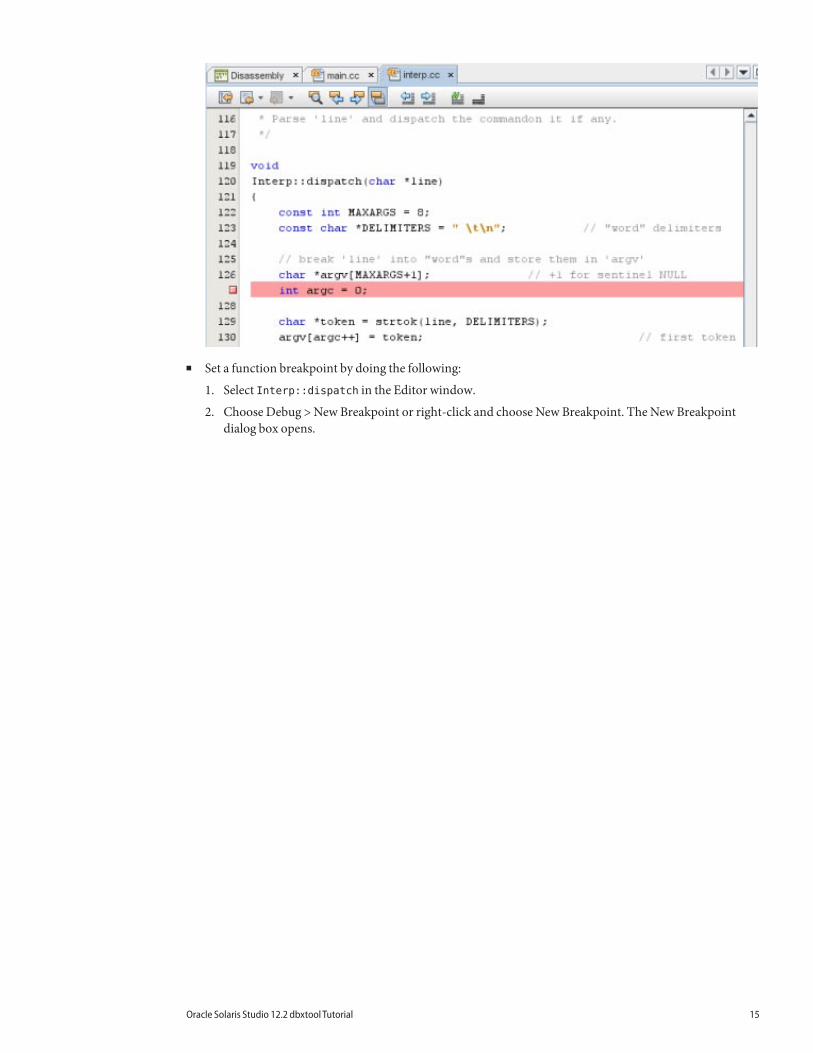
■ Set a function breakpoint by doing the following:
1. Select Interp::dispatch in the Editor window.
2. Choose Debug > New Breakpoint or right-click and choose New Breakpoint. The New Breakpointdialog box opens.
Oracle Solaris Studio 12.2 dbxtool Tutorial 15
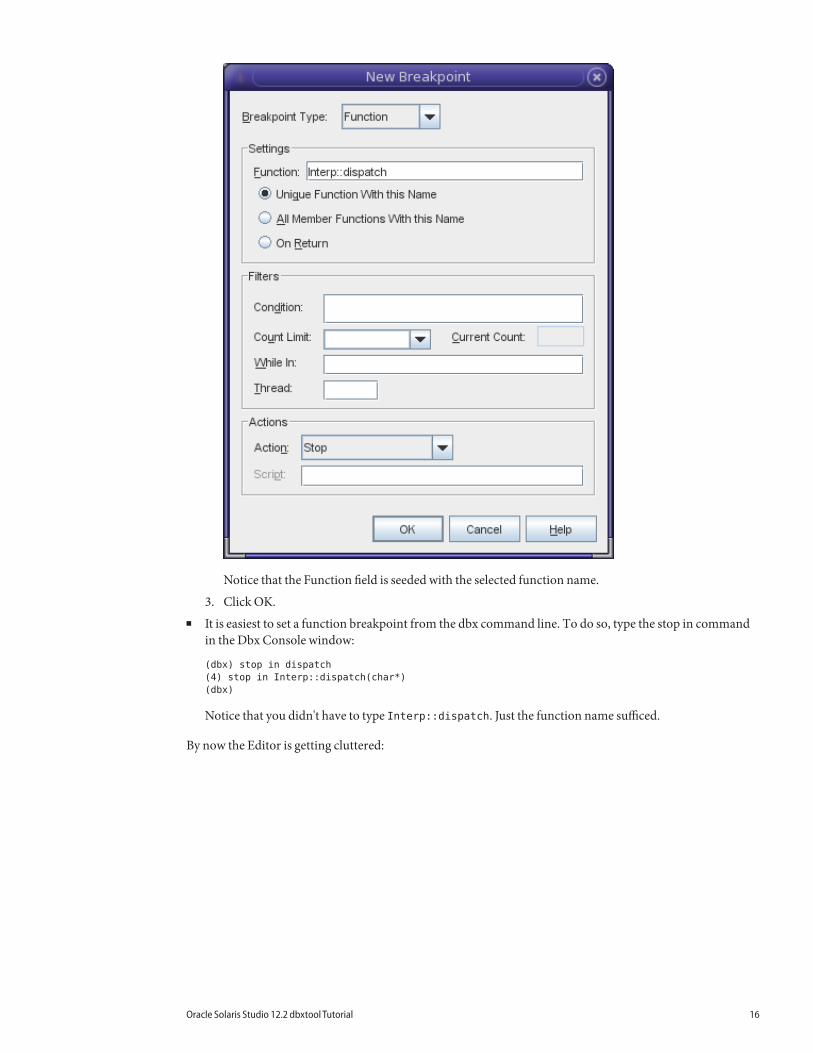
Notice that the Function field is seeded with the selected function name.
3. Click OK.■ It is easiest to set a function breakpoint from the dbx command line. To do so, type the stop in command
in the Dbx Console window:
(dbx) stop in dispatch
(4) stop in Interp::dispatch(char*)
(dbx)
Notice that you didn't have to type Interp::dispatch. Just the function name sufficed.
By now the Editor is getting cluttered:
Oracle Solaris Studio 12.2 dbxtool Tutorial 16
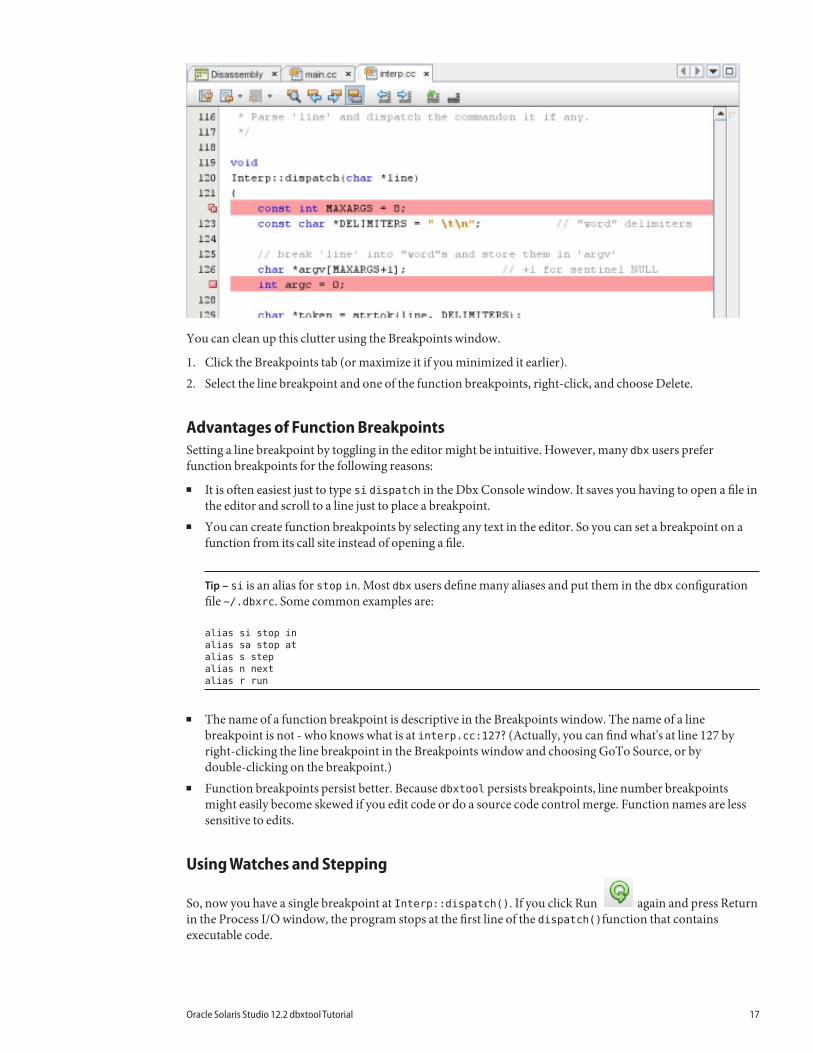
You can clean up this clutter using the Breakpoints window.
1. Click the Breakpoints tab (or maximize it if you minimized it earlier).2. Select the line breakpoint and one of the function breakpoints, right-click, and choose Delete.
Advantages of Function BreakpointsSetting a line breakpoint by toggling in the editor might be intuitive. However, many dbx users preferfunction breakpoints for the following reasons:
■ It is often easiest just to type si dispatch in the Dbx Console window. It saves you having to open a file inthe editor and scroll to a line just to place a breakpoint.
■ You can create function breakpoints by selecting any text in the editor. So you can set a breakpoint on afunction from its call site instead of opening a file.
Tip – si is an alias for stop in. Most dbx users define many aliases and put them in the dbx configurationfile ~/.dbxrc. Some common examples are:
alias si stop in
alias sa stop at
alias s step
alias n next
alias r run
■ The name of a function breakpoint is descriptive in the Breakpoints window. The name of a linebreakpoint is not - who knows what is at interp.cc:127? (Actually, you can find what's at line 127 byright-clicking the line breakpoint in the Breakpoints window and choosing GoTo Source, or bydouble-clicking on the breakpoint.)
■ Function breakpoints persist better. Because dbxtool persists breakpoints, line number breakpointsmight easily become skewed if you edit code or do a source code control merge. Function names are lesssensitive to edits.
Using Watches and Stepping
So, now you have a single breakpoint at Interp::dispatch(). If you click Run again and press Returnin the Process I/O window, the program stops at the first line of the dispatch()function that containsexecutable code.
Oracle Solaris Studio 12.2 dbxtool Tutorial 17
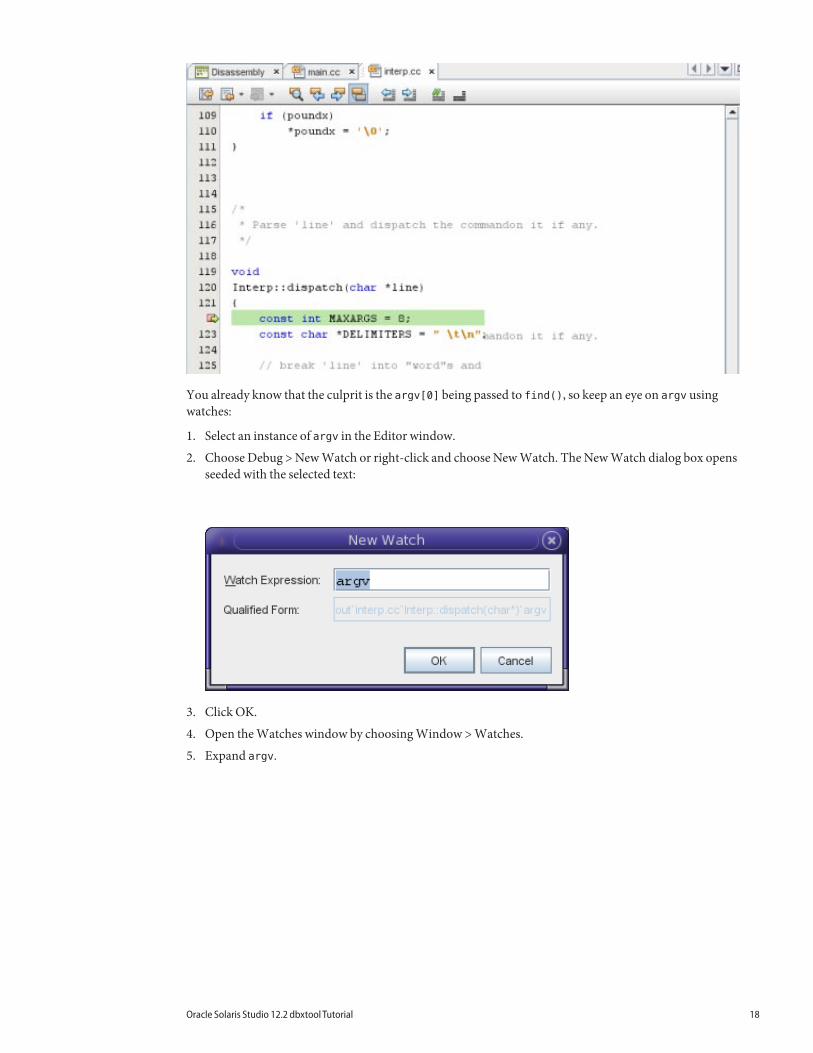
You already know that the culprit is the argv[0] being passed to find(), so keep an eye on argv usingwatches:
1. Select an instance of argv in the Editor window.
2. Choose Debug > New Watch or right-click and choose New Watch. The New Watch dialog box opensseeded with the selected text:
3. Click OK.
4. Open the Watches window by choosing Window > Watches.
5. Expand argv.
Oracle Solaris Studio 12.2 dbxtool Tutorial 18
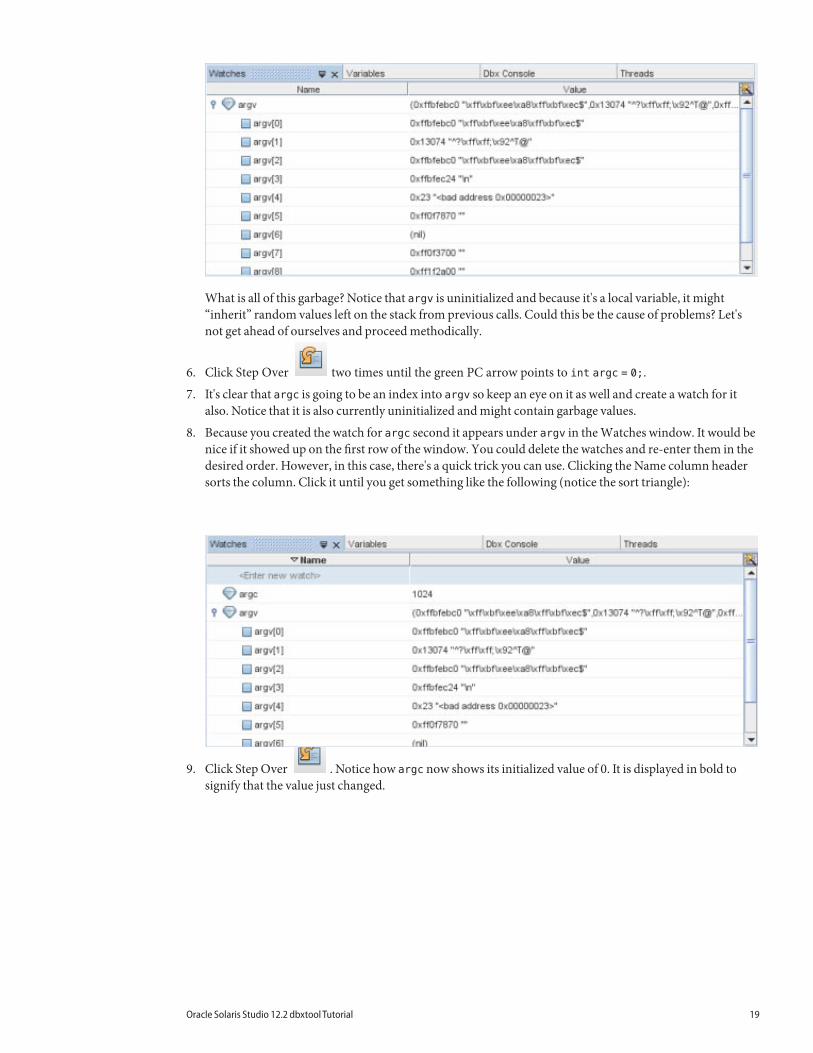
What is all of this garbage? Notice that argv is uninitialized and because it's a local variable, it might“inherit” random values left on the stack from previous calls. Could this be the cause of problems? Let'snot get ahead of ourselves and proceed methodically.
6. Click Step Over two times until the green PC arrow points to int argc = 0;.
7. It's clear that argc is going to be an index into argv so keep an eye on it as well and create a watch for italso. Notice that it is also currently uninitialized and might contain garbage values.
8. Because you created the watch for argc second it appears under argv in the Watches window. It would benice if it showed up on the first row of the window. You could delete the watches and re-enter them in thedesired order. However, in this case, there's a quick trick you can use. Clicking the Name column headersorts the column. Click it until you get something like the following (notice the sort triangle):
9. Click Step Over . Notice how argc now shows its initialized value of 0. It is displayed in bold tosignify that the value just changed.
Oracle Solaris Studio 12.2 dbxtool Tutorial 19
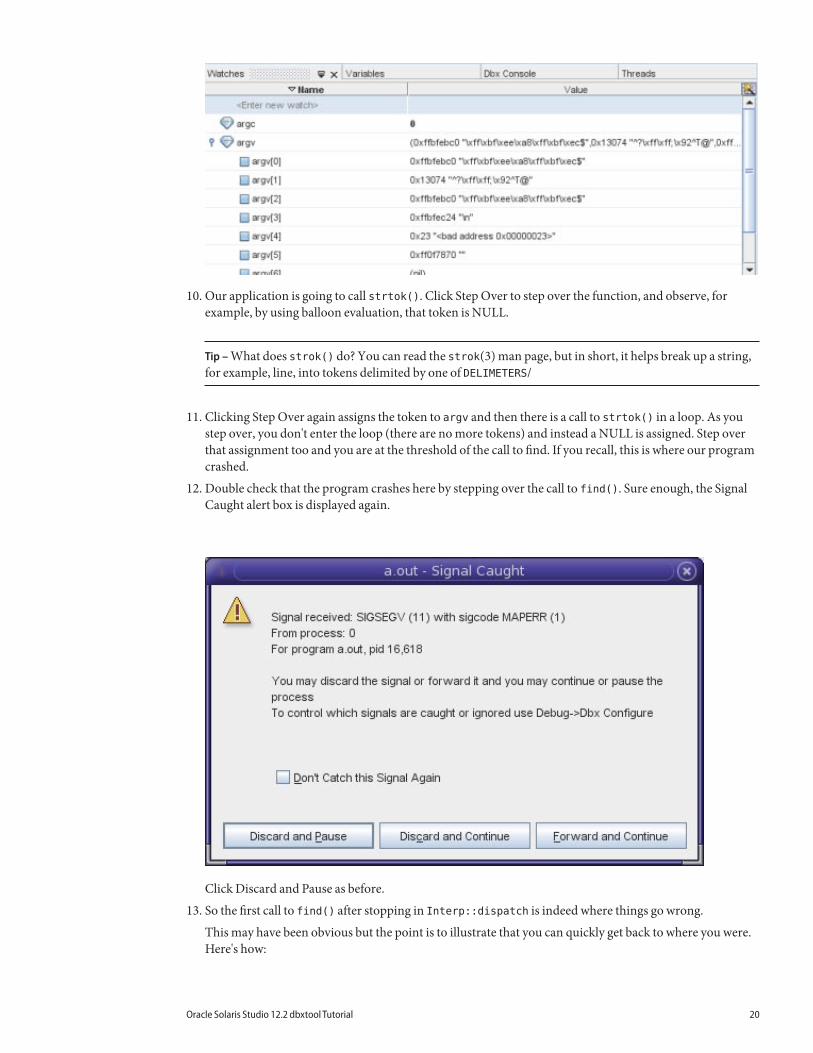
10. Our application is going to call strtok(). Click Step Over to step over the function, and observe, forexample, by using balloon evaluation, that token is NULL.
Tip – What does strok() do? You can read the strok(3) man page, but in short, it helps break up a string,for example, line, into tokens delimited by one of DELIMETERS/
11. Clicking Step Over again assigns the token to argv and then there is a call to strtok() in a loop. As youstep over, you don't enter the loop (there are no more tokens) and instead a NULL is assigned. Step overthat assignment too and you are at the threshold of the call to find. If you recall, this is where our programcrashed.
12. Double check that the program crashes here by stepping over the call to find(). Sure enough, the SignalCaught alert box is displayed again.
Click Discard and Pause as before.
13. So the first call to find() after stopping in Interp::dispatch is indeed where things go wrong.
This may have been obvious but the point is to illustrate that you can quickly get back to where you were.Here's how:
Oracle Solaris Studio 12.2 dbxtool Tutorial 20
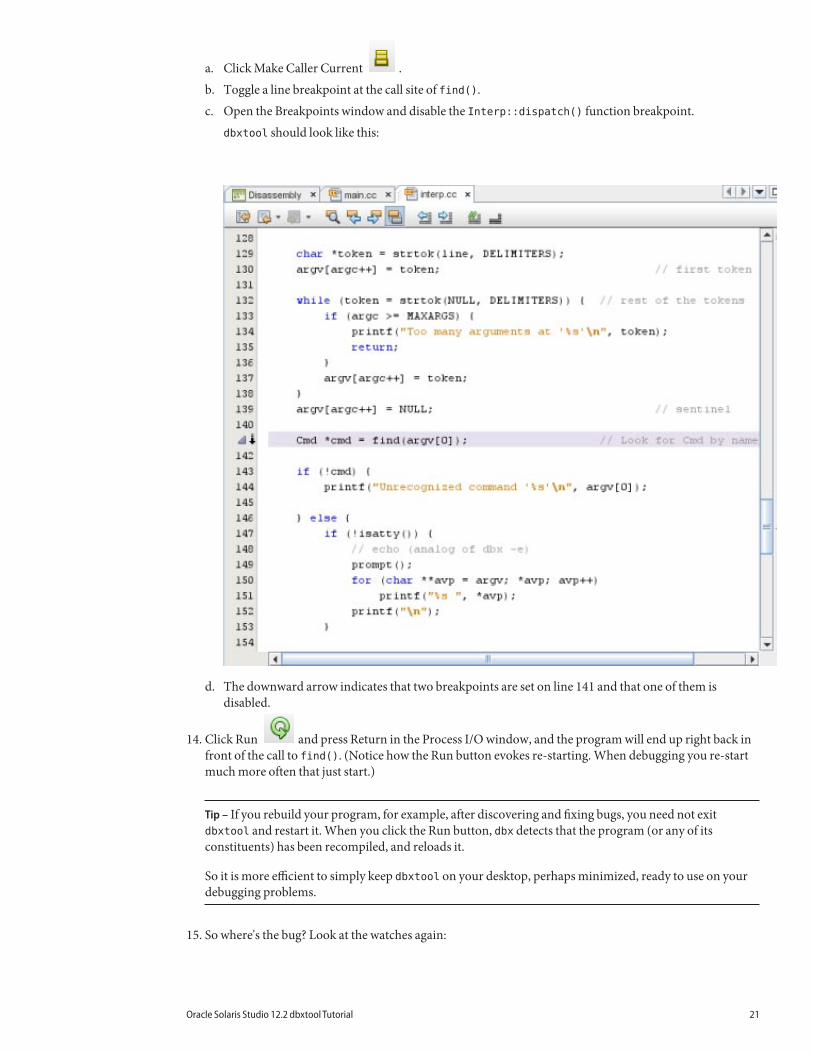
a. Click Make Caller Current .b. Toggle a line breakpoint at the call site of find().c. Open the Breakpoints window and disable the Interp::dispatch() function breakpoint.
dbxtool should look like this:
d. The downward arrow indicates that two breakpoints are set on line 141 and that one of them isdisabled.
14. Click Run and press Return in the Process I/O window, and the program will end up right back infront of the call to find(). (Notice how the Run button evokes re-starting. When debugging you re-startmuch more often that just start.)
Tip – If you rebuild your program, for example, after discovering and fixing bugs, you need not exitdbxtool and restart it. When you click the Run button, dbx detects that the program (or any of itsconstituents) has been recompiled, and reloads it.
So it is more efficient to simply keep dbxtool on your desktop, perhaps minimized, ready to use on yourdebugging problems.
15. So where's the bug? Look at the watches again:
Oracle Solaris Studio 12.2 dbxtool Tutorial 21
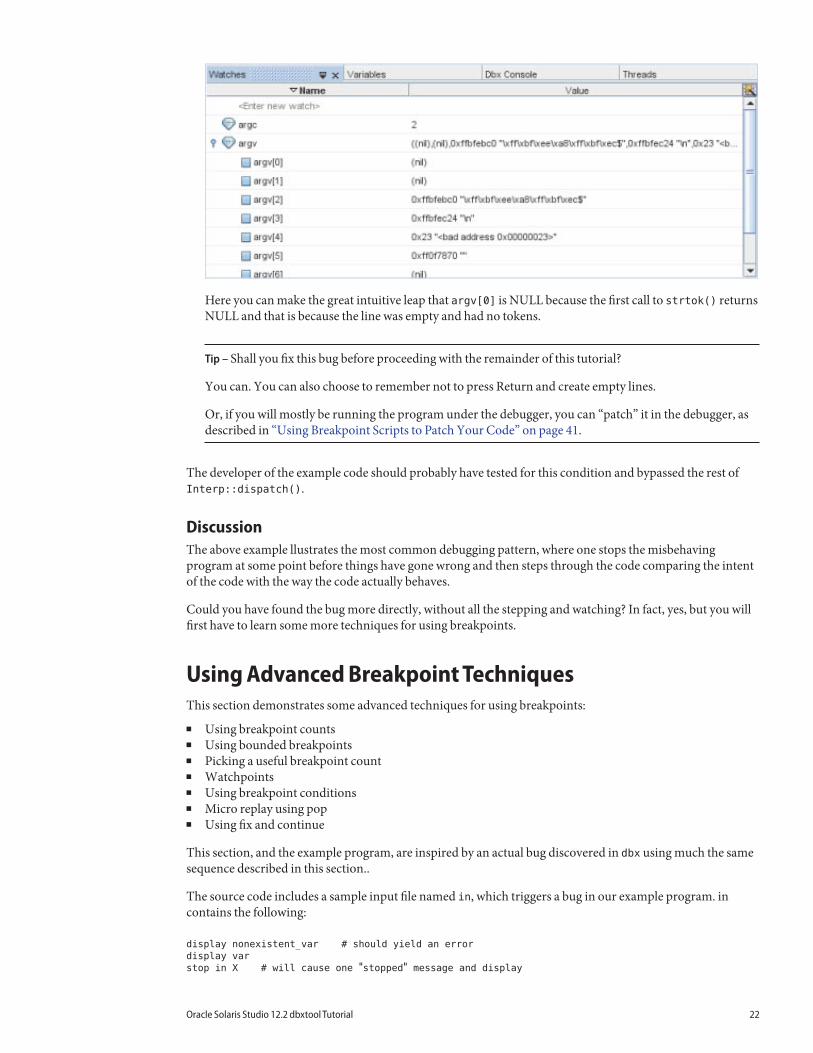
Here you can make the great intuitive leap that argv[0] is NULL because the first call to strtok() returnsNULL and that is because the line was empty and had no tokens.
Tip – Shall you fix this bug before proceeding with the remainder of this tutorial?
You can. You can also choose to remember not to press Return and create empty lines.
Or, if you will mostly be running the program under the debugger, you can “patch” it in the debugger, asdescribed in “Using Breakpoint Scripts to Patch Your Code” on page 41.
The developer of the example code should probably have tested for this condition and bypassed the rest ofInterp::dispatch().
DiscussionThe above example llustrates the most common debugging pattern, where one stops the misbehavingprogram at some point before things have gone wrong and then steps through the code comparing the intentof the code with the way the code actually behaves.
Could you have found the bug more directly, without all the stepping and watching? In fact, yes, but you willfirst have to learn some more techniques for using breakpoints.
Using Advanced Breakpoint TechniquesThis section demonstrates some advanced techniques for using breakpoints:
■ Using breakpoint counts■ Using bounded breakpoints■ Picking a useful breakpoint count■ Watchpoints■ Using breakpoint conditions■ Micro replay using pop■ Using fix and continue
This section, and the example program, are inspired by an actual bug discovered in dbx using much the samesequence described in this section..
The source code includes a sample input file named in, which triggers a bug in our example program. incontains the following:
display nonexistent_var # should yield an error
display var
stop in X # will cause one "stopped" message and display
Oracle Solaris Studio 12.2 dbxtool Tutorial 22
stop in Y # will cause second "stopped" message and display
run
cont
cont
run
cont
cont
Notice that there are no empty lines so as not to trigger the bug you discovered in the previous section.
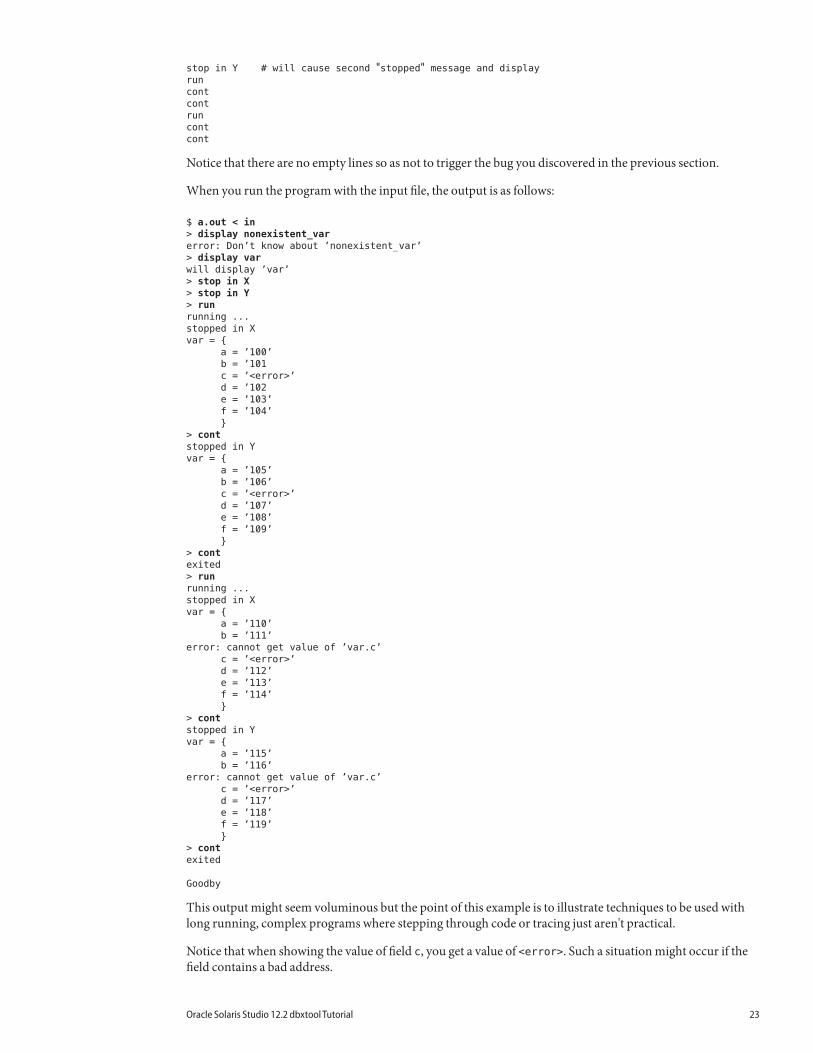
When you run the program with the input file, the output is as follows:
$ a.out < in
> display nonexistent_var
error: Don’t know about ’nonexistent_var’
> display var
will display ’var’
> stop in X
> stop in Y
> run
running ...
stopped in X
var = {
a = ’100’
b = ’101
c = ’<error>’
d = ’102
e = ’103’
f = ’104’
}
> cont
stopped in Y
var = {
a = ’105’
b = ’106’
c = ’<error>’
d = ’107’
e = ’108’
f = ’109’
}
> cont
exited
> run
running ...
stopped in X
var = {
a = ’110’
b = ’111’
error: cannot get value of ’var.c’
c = ’<error>’
d = ’112’
e = ’113’
f = ’114’
}
> cont
stopped in Y
var = {
a = ’115’
b = ’116’
error: cannot get value of ’var.c’
c = ’<error>’
d = ’117’
e = ’118’
f = ’119’
}
> cont
exited
Goodby
This output might seem voluminous but the point of this example is to illustrate techniques to be used withlong running, complex programs where stepping through code or tracing just aren't practical.
Notice that when showing the value of field c, you get a value of <error>. Such a situation might occur if thefield contains a bad address.
Oracle Solaris Studio 12.2 dbxtool Tutorial 23
The ProblemNotice that when you ran the program a second time, you received additional error messages that you didn'tget on the first run:
error: cannot get value of ’var.c’
The error() function uses a variable, err_silent, to silence error messages in certain circumstances. Forexample, in the case of the display command, instead of displaying an error message, problems are displayedas c = ’<error>’.
Step 1: RepeatabilityThe first step is to set up a debug target and configure it so the bug can easily be repeated by clicking Run
.
Start debugging the program as follows:
1. If you haven't yet compiled the example program, do so by following the instructions in “The ExampleProgram” on page 2.
2. Choose Debug > Debug Executable.
3. In the Debug Executable dialog box, browse for or type in the path to the executable.
4. In the Arguments field, type:
< in
5. Copy and paste the directory portion of the executable path into the Run Directory field.
6. Click Debug.
Oracle Solaris Studio 12.2 dbxtool Tutorial 24
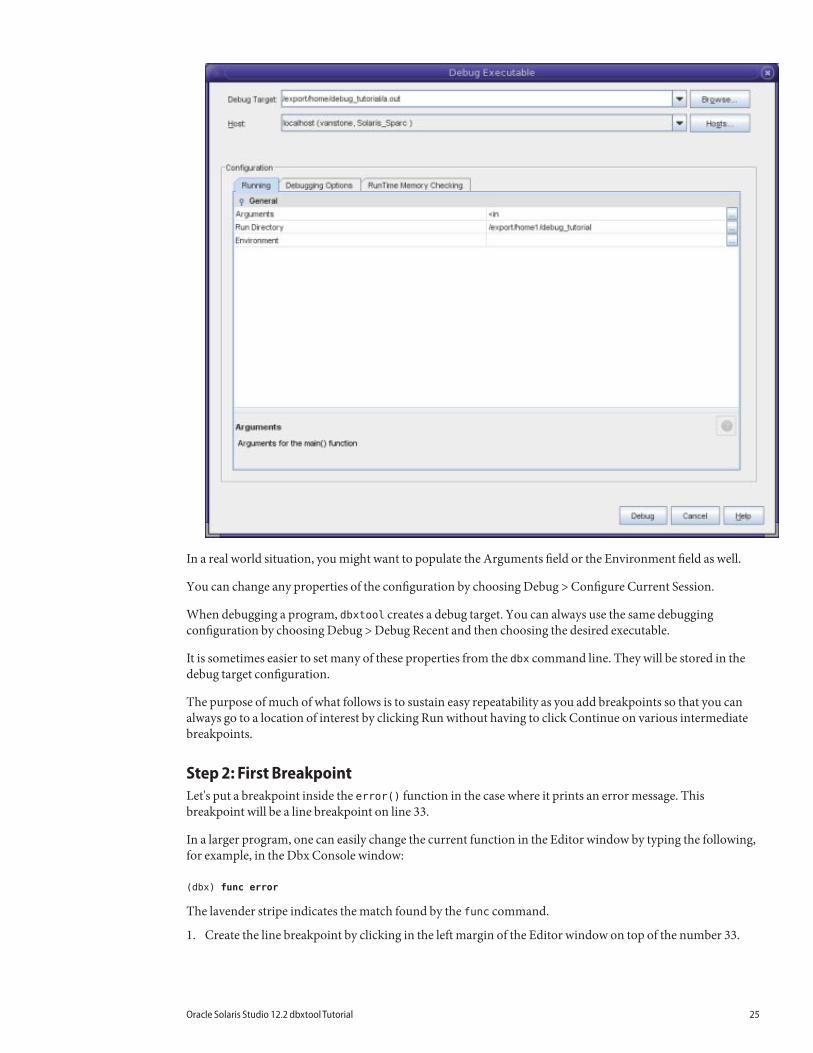
In a real world situation, you might want to populate the Arguments field or the Environment field as well.
You can change any properties of the configuration by choosing Debug > Configure Current Session.
When debugging a program, dbxtool creates a debug target. You can always use the same debuggingconfiguration by choosing Debug > Debug Recent and then choosing the desired executable.
It is sometimes easier to set many of these properties from the dbx command line. They will be stored in thedebug target configuration.
The purpose of much of what follows is to sustain easy repeatability as you add breakpoints so that you canalways go to a location of interest by clicking Run without having to click Continue on various intermediatebreakpoints.
Step 2: First BreakpointLet's put a breakpoint inside the error() function in the case where it prints an error message. Thisbreakpoint will be a line breakpoint on line 33.
In a larger program, one can easily change the current function in the Editor window by typing the following,for example, in the Dbx Console window:
(dbx) func error
The lavender stripe indicates the match found by the func command.
1. Create the line breakpoint by clicking in the left margin of the Editor window on top of the number 33.
Oracle Solaris Studio 12.2 dbxtool Tutorial 25
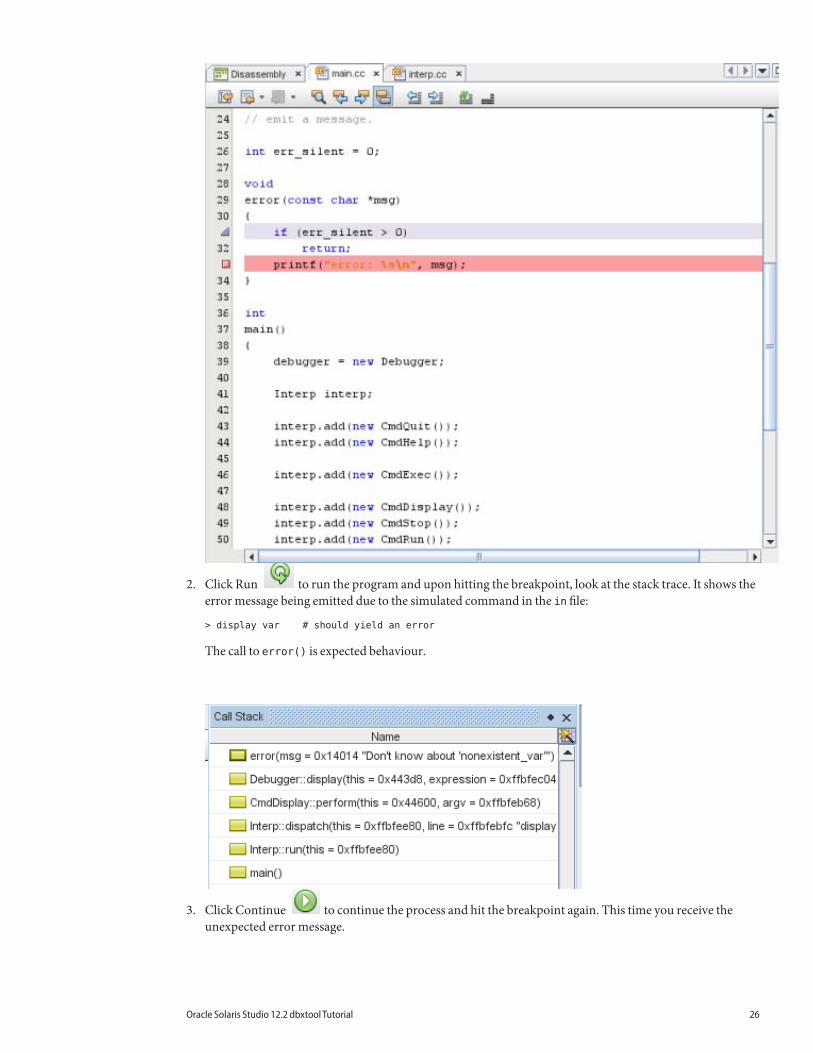
2. Click Run to run the program and upon hitting the breakpoint, look at the stack trace. It shows theerror message being emitted due to the simulated command in the in file:
> display var # should yield an error
The call to error() is expected behaviour.
3. Click Continue to continue the process and hit the breakpoint again. This time you receive theunexpected error message.
Oracle Solaris Studio 12.2 dbxtool Tutorial 26
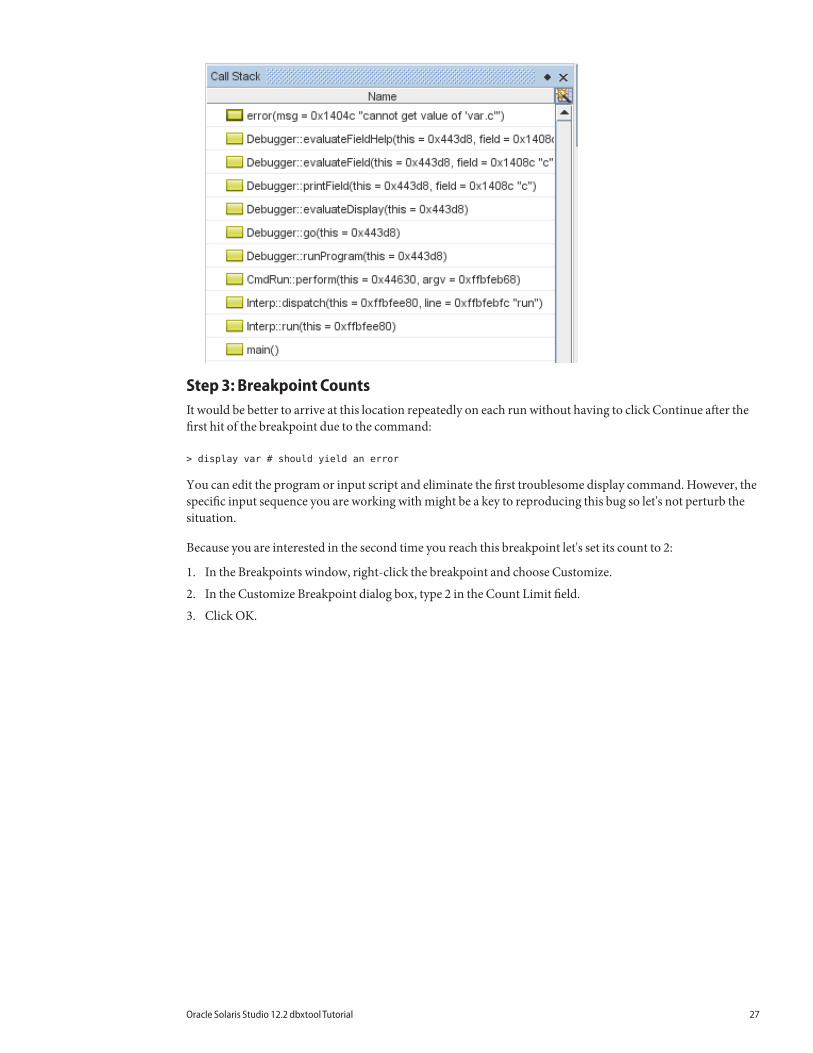
Step 3: Breakpoint CountsIt would be better to arrive at this location repeatedly on each run without having to click Continue after thefirst hit of the breakpoint due to the command:
> display var # should yield an error
You can edit the program or input script and eliminate the first troublesome display command. However, thespecific input sequence you are working with might be a key to reproducing this bug so let's not perturb thesituation.
Because you are interested in the second time you reach this breakpoint let's set its count to 2:
1. In the Breakpoints window, right-click the breakpoint and choose Customize.
2. In the Customize Breakpoint dialog box, type 2 in the Count Limit field.
3. Click OK.
Oracle Solaris Studio 12.2 dbxtool Tutorial 27
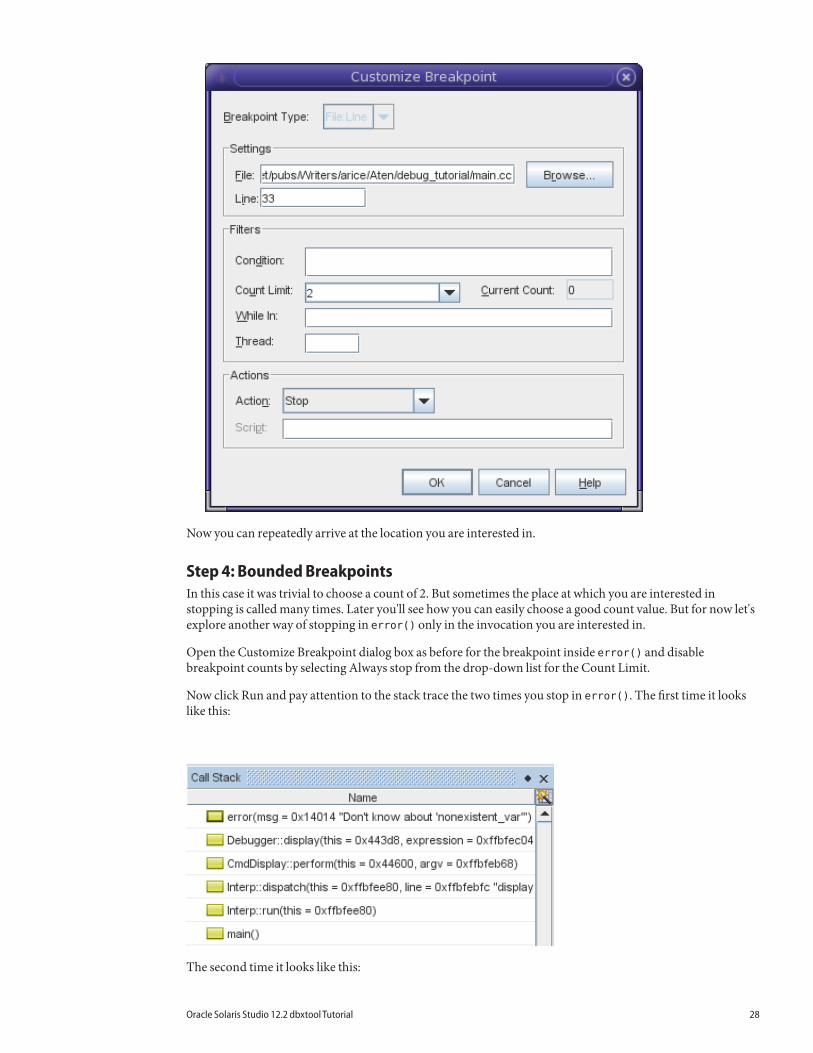
Now you can repeatedly arrive at the location you are interested in.
Step 4: Bounded BreakpointsIn this case it was trivial to choose a count of 2. But sometimes the place at which you are interested instopping is called many times. Later you'll see how you can easily choose a good count value. But for now let'sexplore another way of stopping in error() only in the invocation you are interested in.
Open the Customize Breakpoint dialog box as before for the breakpoint inside error() and disablebreakpoint counts by selecting Always stop from the drop-down list for the Count Limit.
Now click Run and pay attention to the stack trace the two times you stop in error(). The first time it lookslike this:
The second time it looks like this:
Oracle Solaris Studio 12.2 dbxtool Tutorial 28
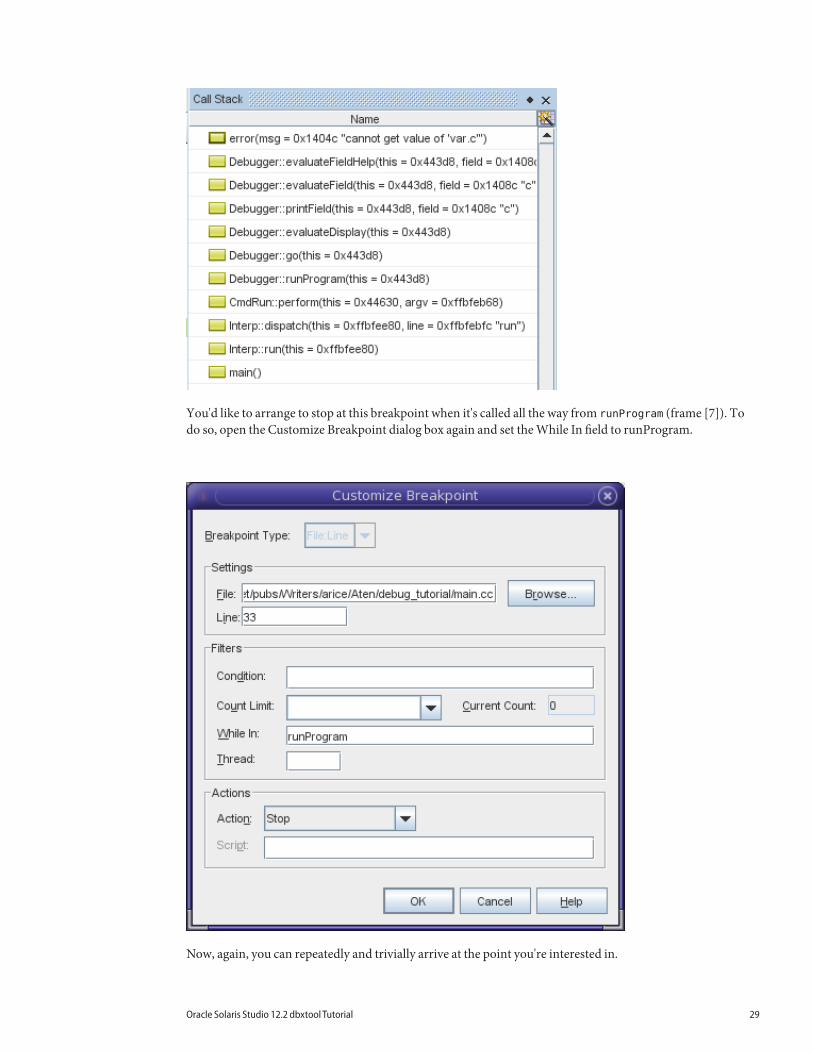
You'd like to arrange to stop at this breakpoint when it's called all the way from runProgram (frame [7]). Todo so, open the Customize Breakpoint dialog box again and set the While In field to runProgram.
Now, again, you can repeatedly and trivially arrive at the point you're interested in.
Oracle Solaris Studio 12.2 dbxtool Tutorial 29
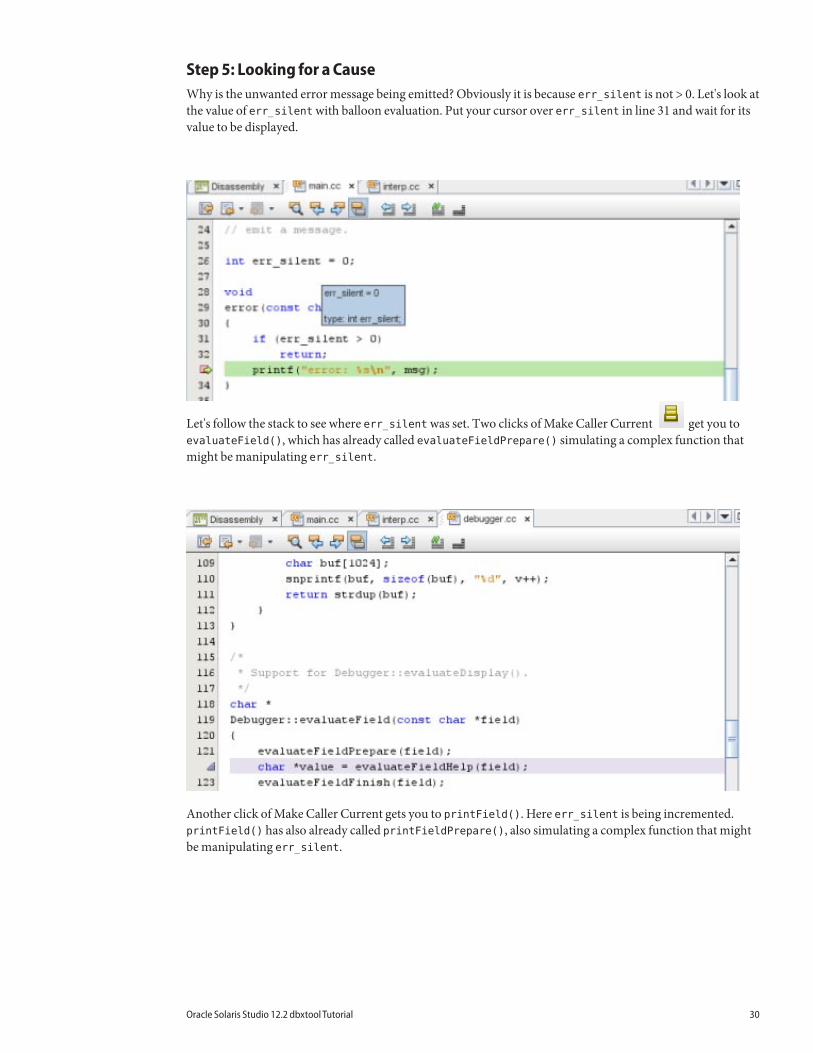
Step 5: Looking for a CauseWhy is the unwanted error message being emitted? Obviously it is because err_silent is not > 0. Let's look atthe value of err_silent with balloon evaluation. Put your cursor over err_silent in line 31 and wait for itsvalue to be displayed.
Let's follow the stack to see where err_silent was set. Two clicks of Make Caller Current get you toevaluateField(), which has already called evaluateFieldPrepare() simulating a complex function thatmight be manipulating err_silent.
Another click of Make Caller Current gets you to printField(). Here err_silent is being incremented.printField() has also already called printFieldPrepare(), also simulating a complex function that mightbe manipulating err_silent.
Oracle Solaris Studio 12.2 dbxtool Tutorial 30
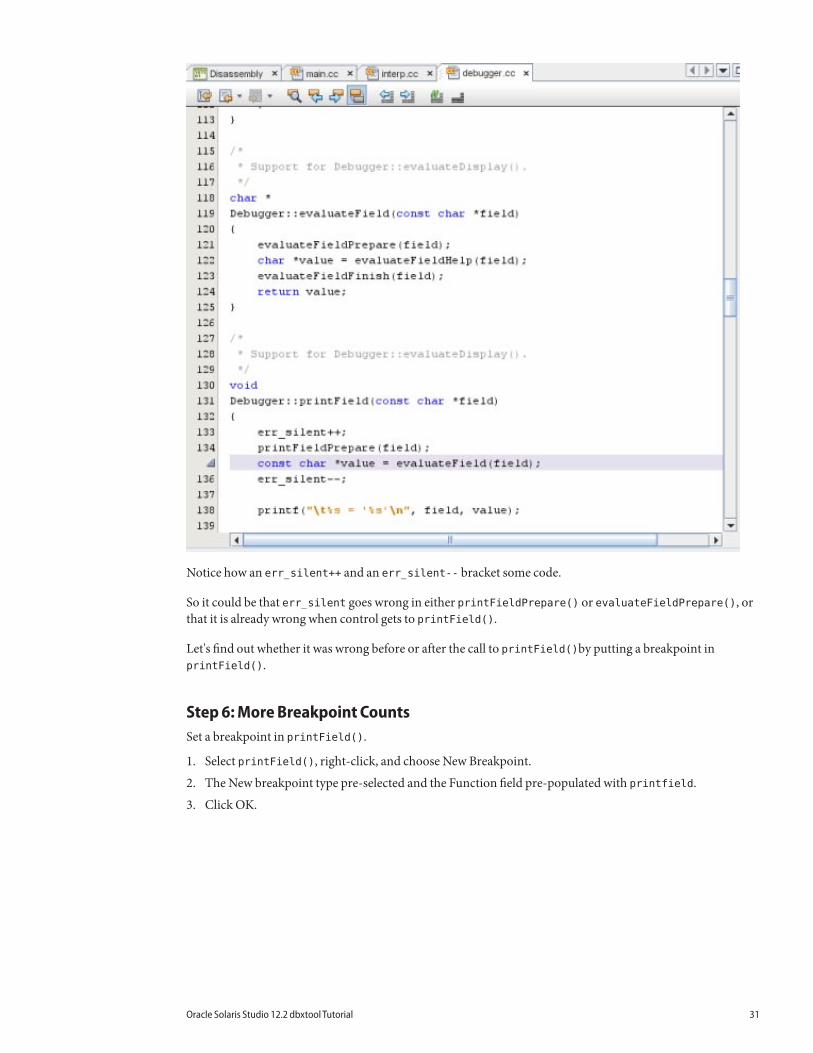
Notice how an err_silent++ and an err_silent-- bracket some code.
So it could be that err_silent goes wrong in either printFieldPrepare() or evaluateFieldPrepare(), orthat it is already wrong when control gets to printField().
Let's find out whether it was wrong before or after the call to printField()by putting a breakpoint inprintField().
Step 6: More Breakpoint CountsSet a breakpoint in printField().
1. Select printField(), right-click, and choose New Breakpoint.
2. The New breakpoint type pre-selected and the Function field pre-populated with printfield.
3. Click OK.
Oracle Solaris Studio 12.2 dbxtool Tutorial 31
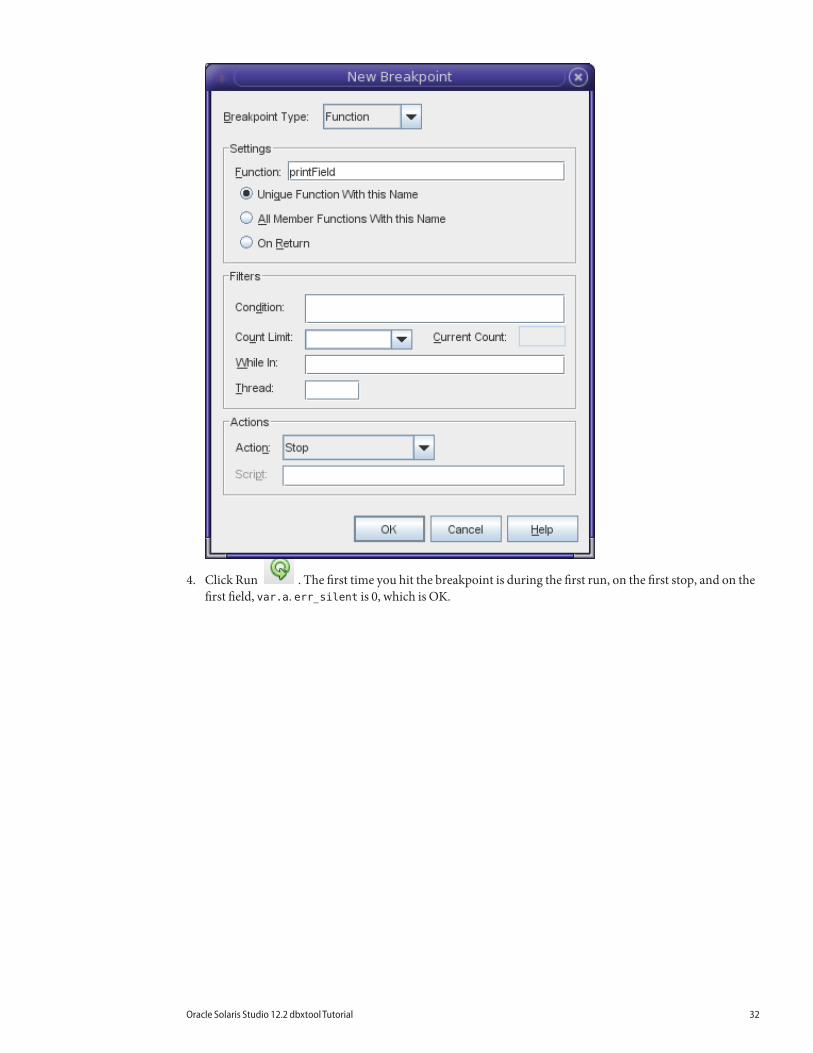
4. Click Run . The first time you hit the breakpoint is during the first run, on the first stop, and on thefirst field, var.a. err_silent is 0, which is OK.
Oracle Solaris Studio 12.2 dbxtool Tutorial 32
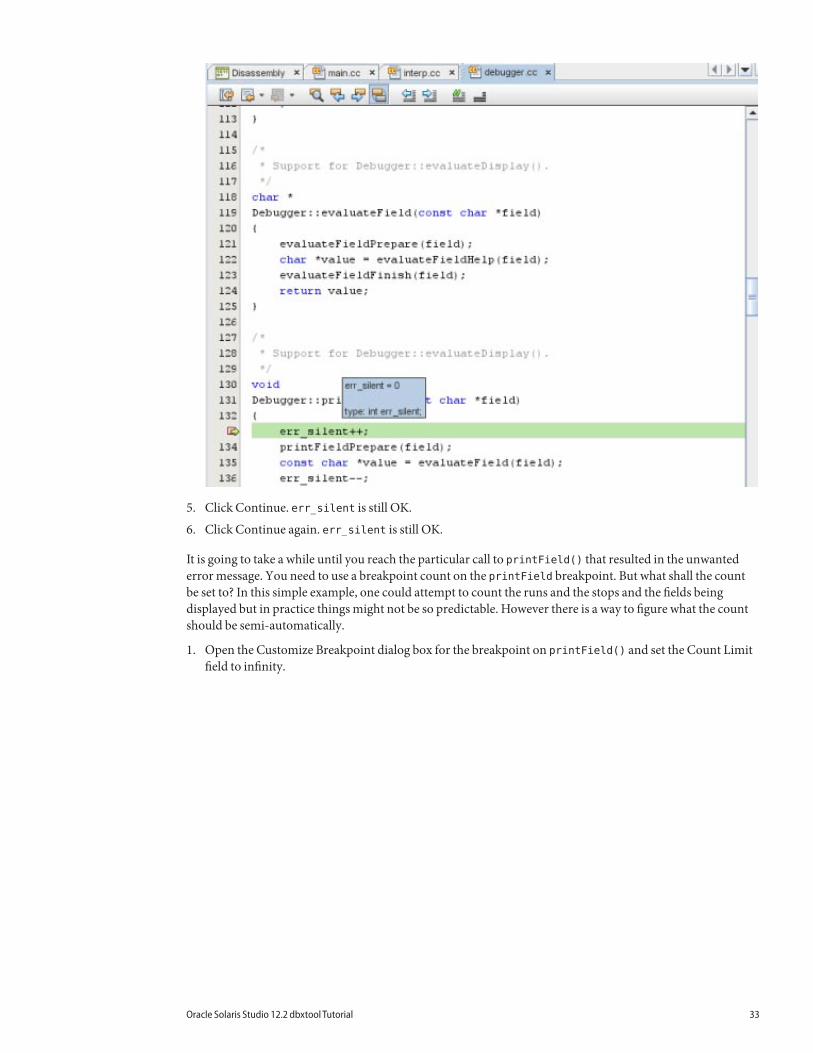
5. Click Continue. err_silent is still OK.
6. Click Continue again. err_silent is still OK.
It is going to take a while until you reach the particular call to printField() that resulted in the unwantederror message. You need to use a breakpoint count on the printField breakpoint. But what shall the countbe set to? In this simple example, one could attempt to count the runs and the stops and the fields beingdisplayed but in practice things might not be so predictable. However there is a way to figure what the countshould be semi-automatically.
1. Open the Customize Breakpoint dialog box for the breakpoint on printField() and set the Count Limitfield to infinity.
Oracle Solaris Studio 12.2 dbxtool Tutorial 33
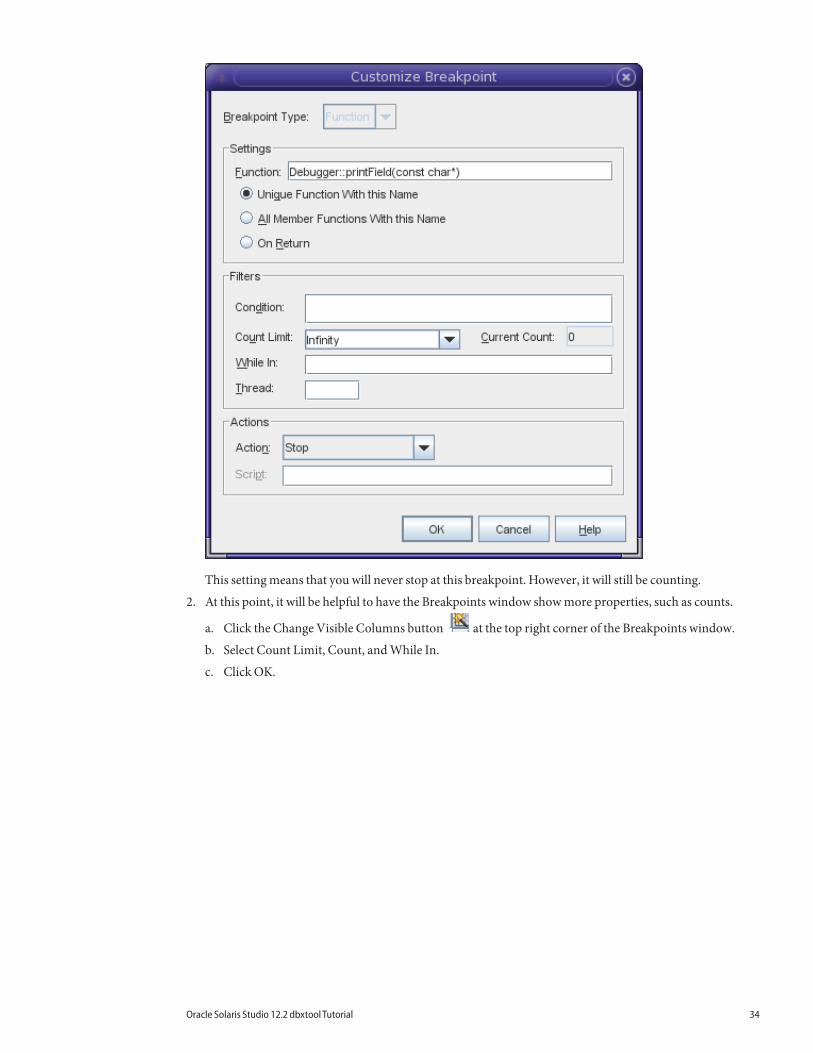
This setting means that you will never stop at this breakpoint. However, it will still be counting.
2. At this point, it will be helpful to have the Breakpoints window show more properties, such as counts.
a. Click the Change Visible Columns button at the top right corner of the Breakpoints window.
b. Select Count Limit, Count, and While In.
c. Click OK.
Oracle Solaris Studio 12.2 dbxtool Tutorial 34
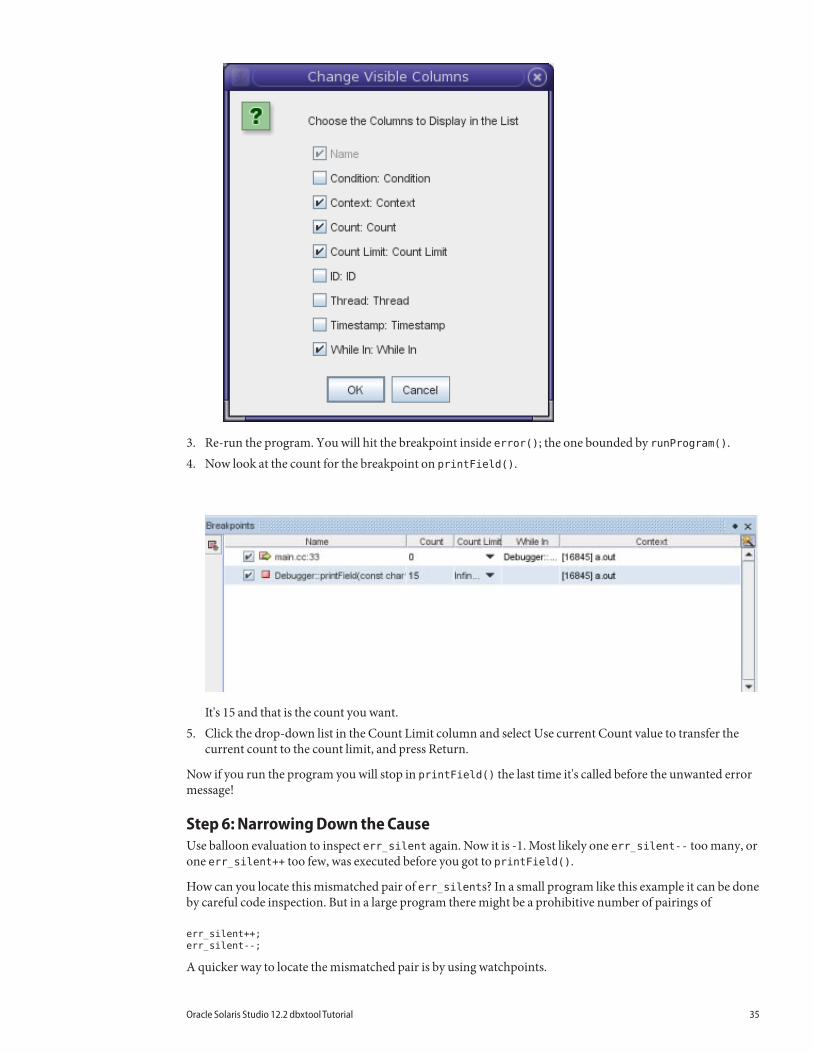
3. Re-run the program. You will hit the breakpoint inside error(); the one bounded by runProgram().4. Now look at the count for the breakpoint on printField().
It's 15 and that is the count you want.5. Click the drop-down list in the Count Limit column and select Use current Count value to transfer the
current count to the count limit, and press Return.
Now if you run the program you will stop in printField() the last time it's called before the unwanted errormessage!
Step 6: Narrowing Down the CauseUse balloon evaluation to inspect err_silent again. Now it is -1. Most likely one err_silent-- too many, orone err_silent++ too few, was executed before you got to printField().
How can you locate this mismatched pair of err_silents? In a small program like this example it can be doneby careful code inspection. But in a large program there might be a prohibitive number of pairings of
err_silent++;
err_silent--;
A quicker way to locate the mismatched pair is by using watchpoints.
Oracle Solaris Studio 12.2 dbxtool Tutorial 35
Tip – It might also be the case that it is not a mismatched set of err_silent++; and err_silent--; at all, but arogue pointer overwriting the contents of err_silent. Watchpoints would be more effective in catching sucha problem.
Step 7: Using WatchpointsTo create a watchpoint on err_silent:
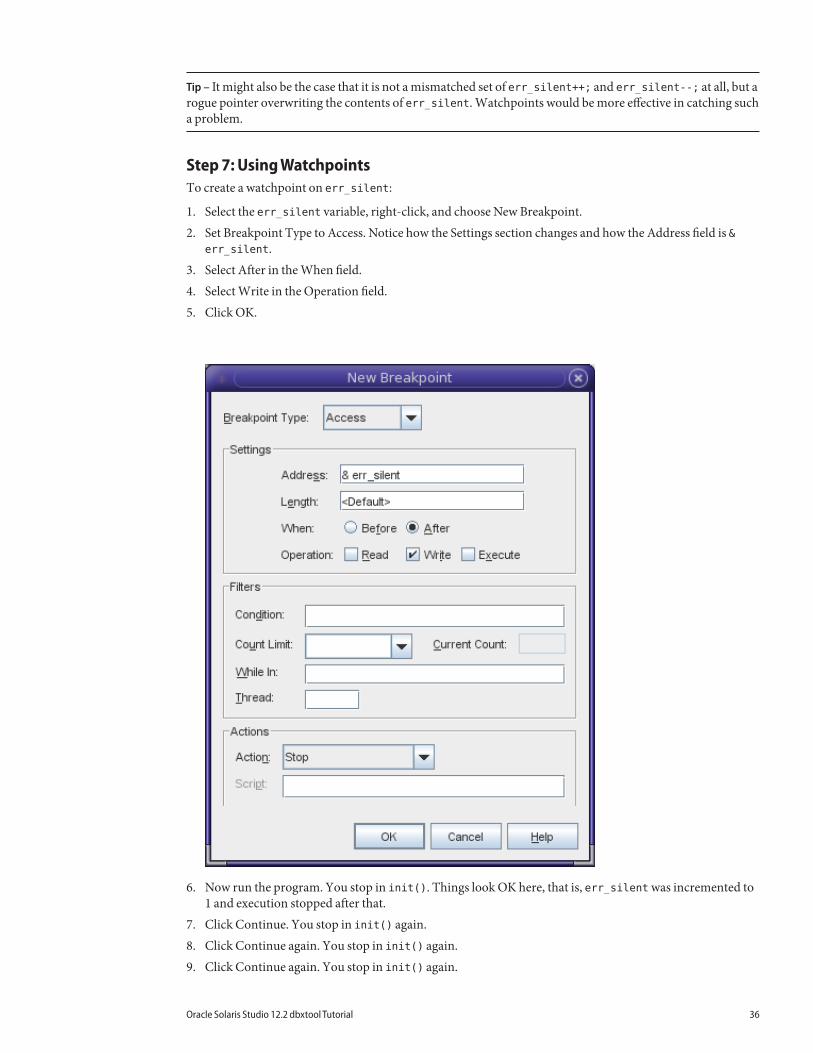
1. Select the err_silent variable, right-click, and choose New Breakpoint.2. Set Breakpoint Type to Access. Notice how the Settings section changes and how the Address field is &
err_silent.3. Select After in the When field.4. Select Write in the Operation field.5. Click OK.
6. Now run the program. You stop in init(). Things look OK here, that is, err_silent was incremented to1 and execution stopped after that.
7. Click Continue. You stop in init() again.8. Click Continue again. You stop in init() again.9. Click Continue again. You stop in init() again.
Oracle Solaris Studio 12.2 dbxtool Tutorial 36
10. Click Continue again. Now you stop in stopIn(). Things look OK here too, that is, no -1s.
It might take a while before err_silent is set to -1 and you don't want to be slavishly clicking Continue lestyour eyes glaze over and you miss the time it actually changed to -1. But there is a better way.
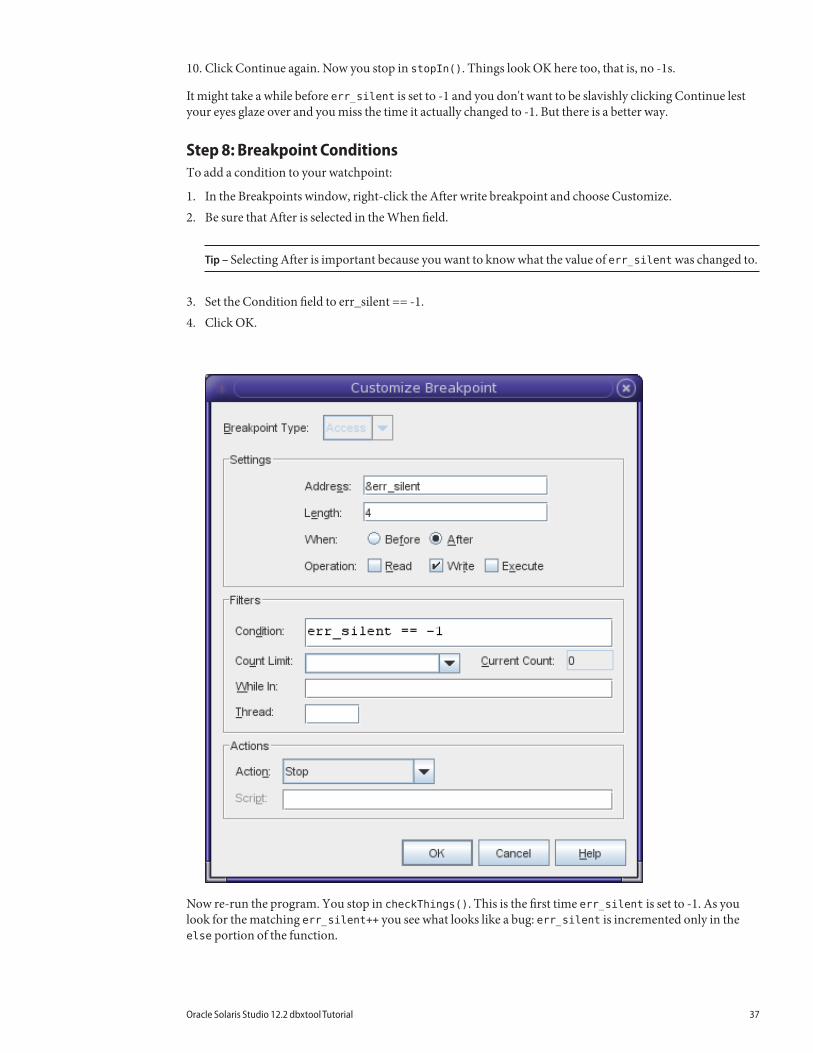
Step 8: Breakpoint ConditionsTo add a condition to your watchpoint:
1. In the Breakpoints window, right-click the After write breakpoint and choose Customize.2. Be sure that After is selected in the When field.
Tip – Selecting After is important because you want to know what the value of err_silent was changed to.
3. Set the Condition field to err_silent == -1.4. Click OK.
Now re-run the program. You stop in checkThings(). This is the first time err_silent is set to -1. As youlook for the matching err_silent++ you see what looks like a bug: err_silent is incremented only in theelse portion of the function.
Oracle Solaris Studio 12.2 dbxtool Tutorial 37
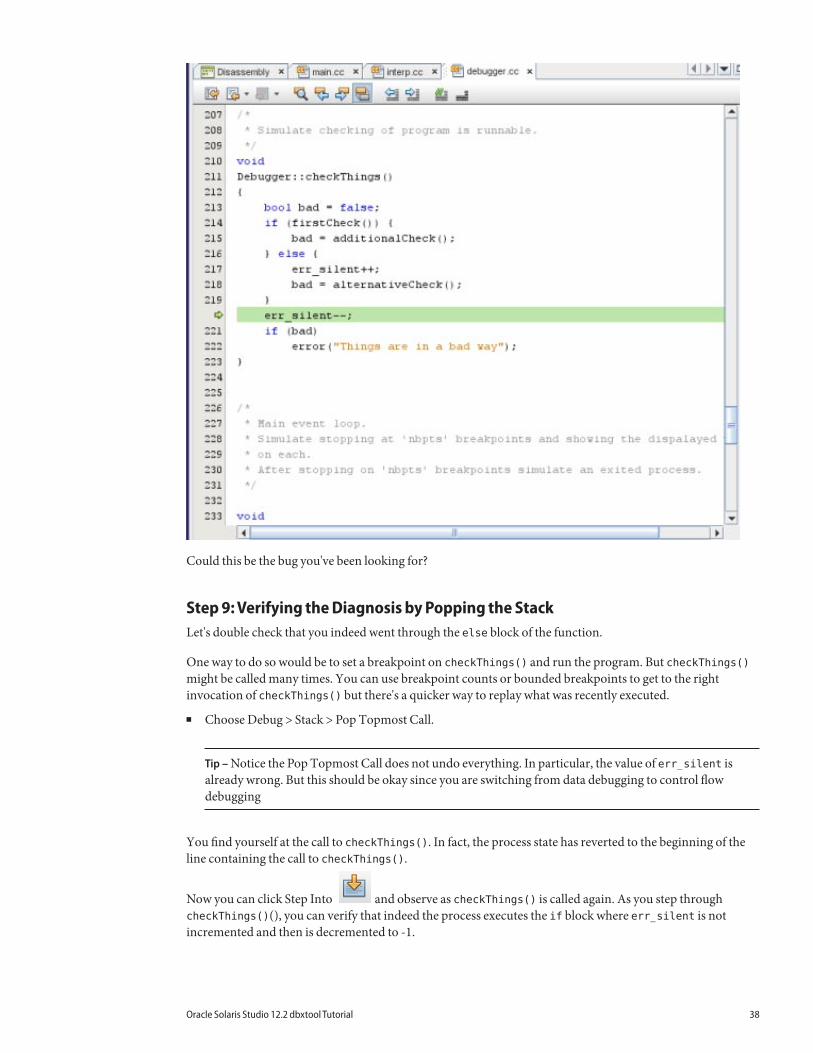
Could this be the bug you've been looking for?
Step 9: Verifying the Diagnosis by Popping the StackLet's double check that you indeed went through the else block of the function.
One way to do so would be to set a breakpoint on checkThings() and run the program. But checkThings()might be called many times. You can use breakpoint counts or bounded breakpoints to get to the rightinvocation of checkThings() but there's a quicker way to replay what was recently executed.
■ Choose Debug > Stack > Pop Topmost Call.
Tip – Notice the Pop Topmost Call does not undo everything. In particular, the value of err_silent isalready wrong. But this should be okay since you are switching from data debugging to control flowdebugging
You find yourself at the call to checkThings(). In fact, the process state has reverted to the beginning of theline containing the call to checkThings().
Now you can click Step Into and observe as checkThings() is called again. As you step throughcheckThings()(), you can verify that indeed the process executes the if block where err_silent is notincremented and then is decremented to -1.
Oracle Solaris Studio 12.2 dbxtool Tutorial 38
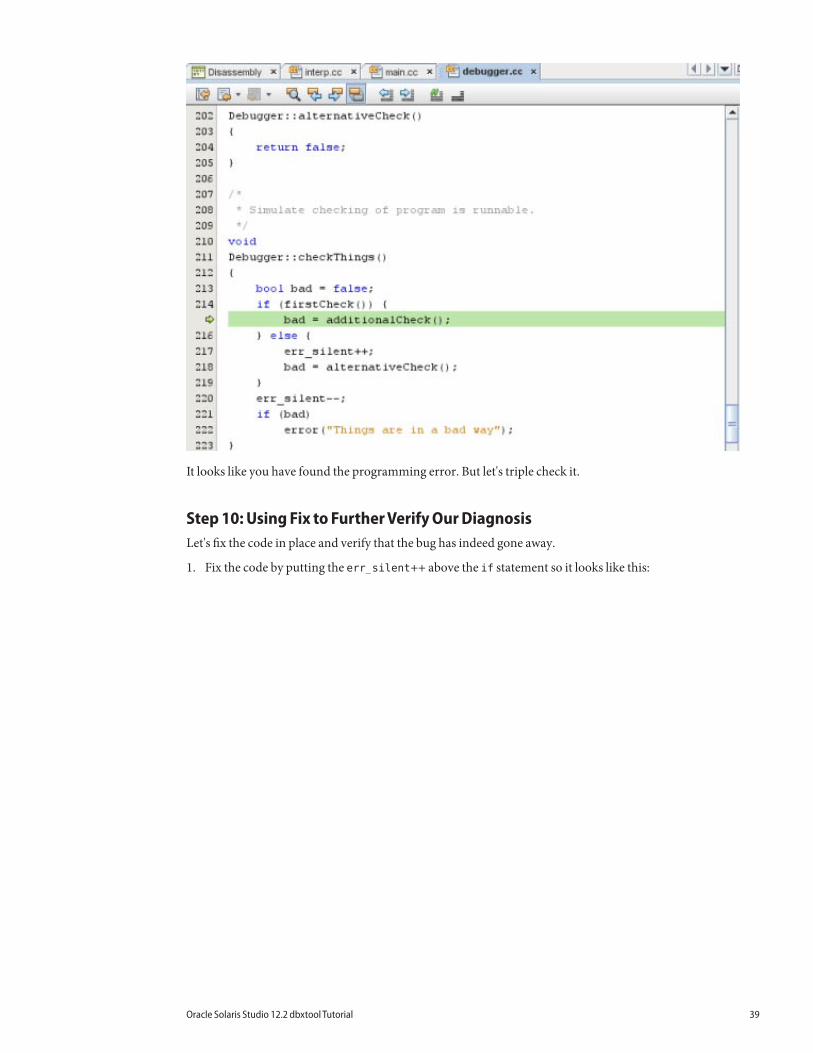
It looks like you have found the programming error. But let's triple check it.
Step 10: Using Fix to Further Verify Our DiagnosisLet's fix the code in place and verify that the bug has indeed gone away.
1. Fix the code by putting the err_silent++ above the if statement so it looks like this:
Oracle Solaris Studio 12.2 dbxtool Tutorial 39
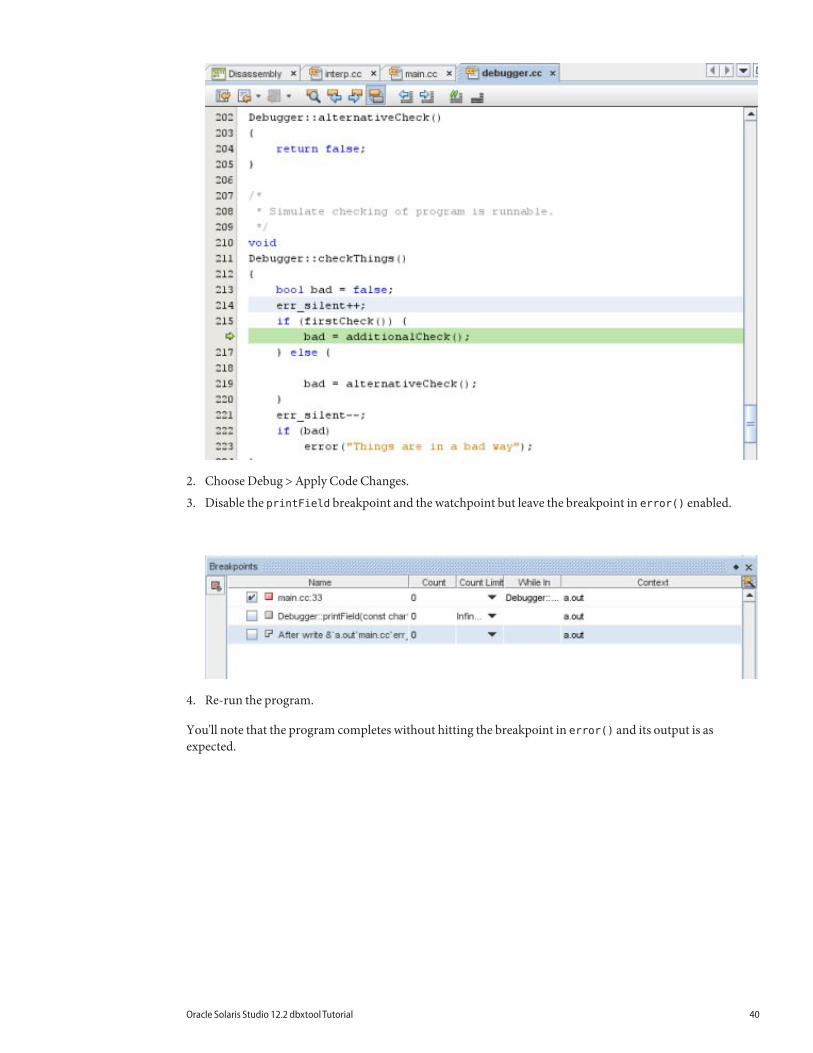
2. Choose Debug > Apply Code Changes.
3. Disable the printField breakpoint and the watchpoint but leave the breakpoint in error() enabled.
4. Re-run the program.
You'll note that the program completes without hitting the breakpoint in error() and its output is asexpected.
Oracle Solaris Studio 12.2 dbxtool Tutorial 40
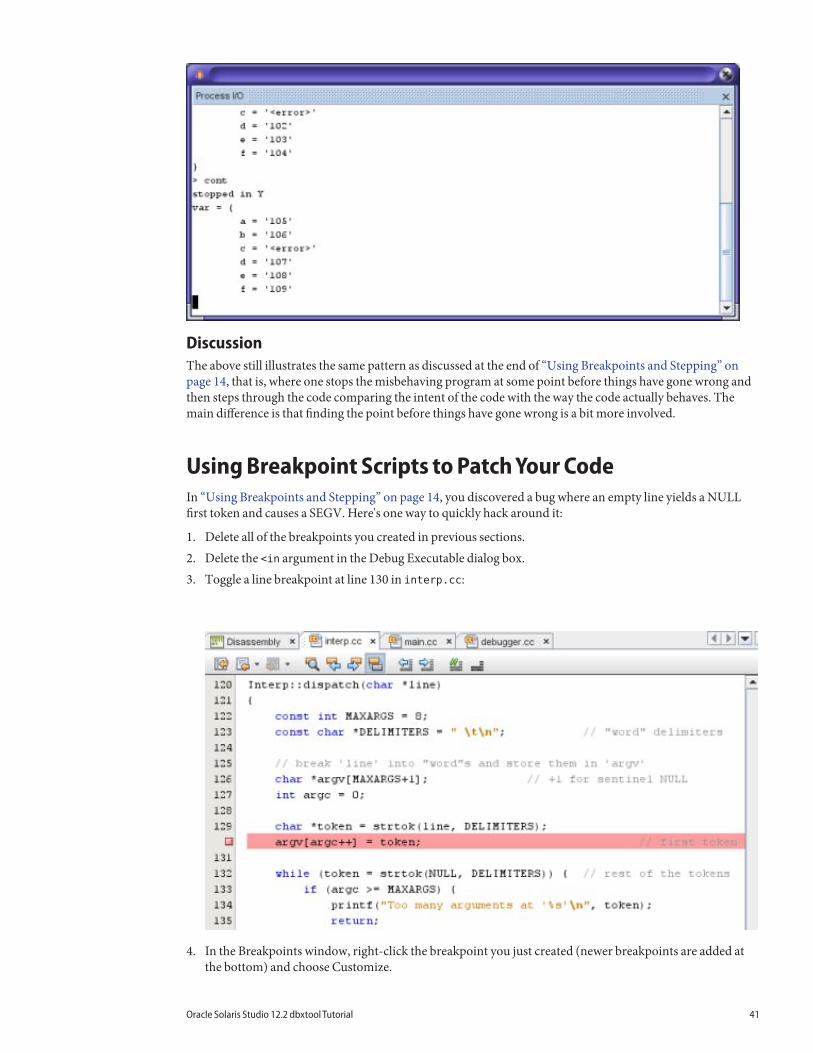
DiscussionThe above still illustrates the same pattern as discussed at the end of “Using Breakpoints and Stepping” onpage 14, that is, where one stops the misbehaving program at some point before things have gone wrong andthen steps through the code comparing the intent of the code with the way the code actually behaves. Themain difference is that finding the point before things have gone wrong is a bit more involved.
Using Breakpoint Scripts to Patch Your CodeIn “Using Breakpoints and Stepping” on page 14, you discovered a bug where an empty line yields a NULLfirst token and causes a SEGV. Here's one way to quickly hack around it:
1. Delete all of the breakpoints you created in previous sections.2. Delete the <in argument in the Debug Executable dialog box.3. Toggle a line breakpoint at line 130 in interp.cc:
4. In the Breakpoints window, right-click the breakpoint you just created (newer breakpoints are added atthe bottom) and choose Customize.
Oracle Solaris Studio 12.2 dbxtool Tutorial 41
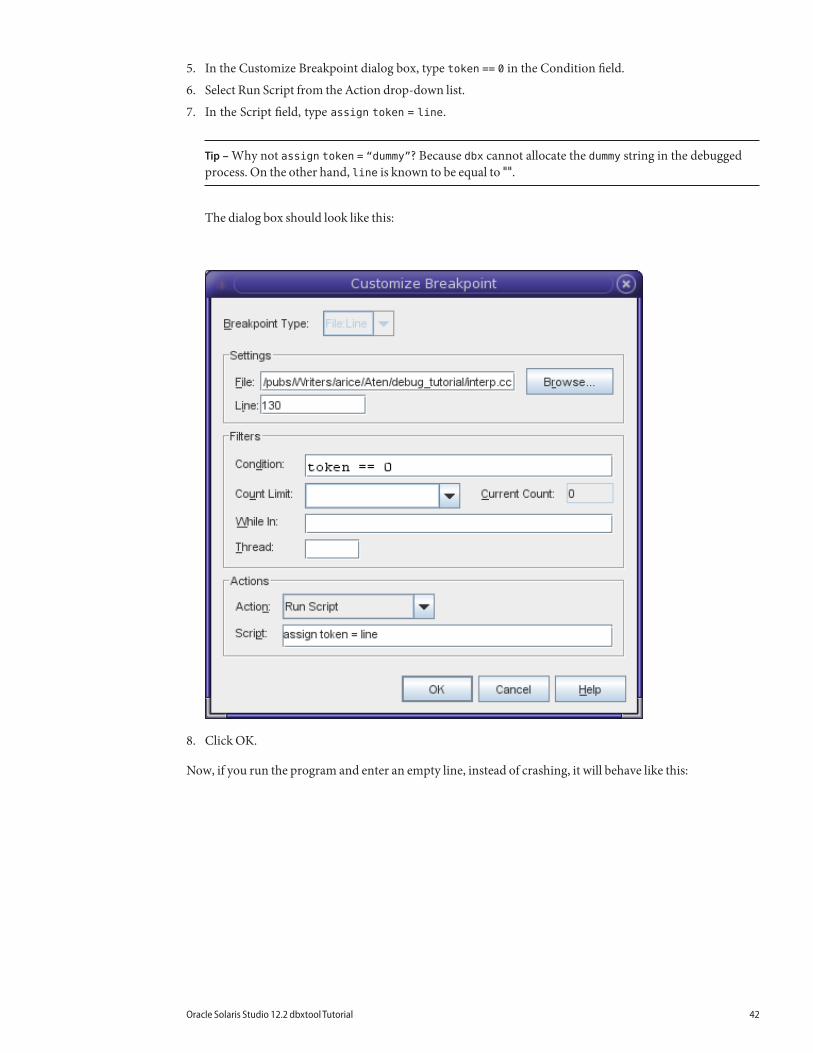
5. In the Customize Breakpoint dialog box, type token == 0 in the Condition field.
6. Select Run Script from the Action drop-down list.
7. In the Script field, type assign token = line.
Tip – Why not assign token = “dummy”? Because dbx cannot allocate the dummy string in the debuggedprocess. On the other hand, line is known to be equal to "".
The dialog box should look like this:
8. Click OK.
Now, if you run the program and enter an empty line, instead of crashing, it will behave like this:
Oracle Solaris Studio 12.2 dbxtool Tutorial 42
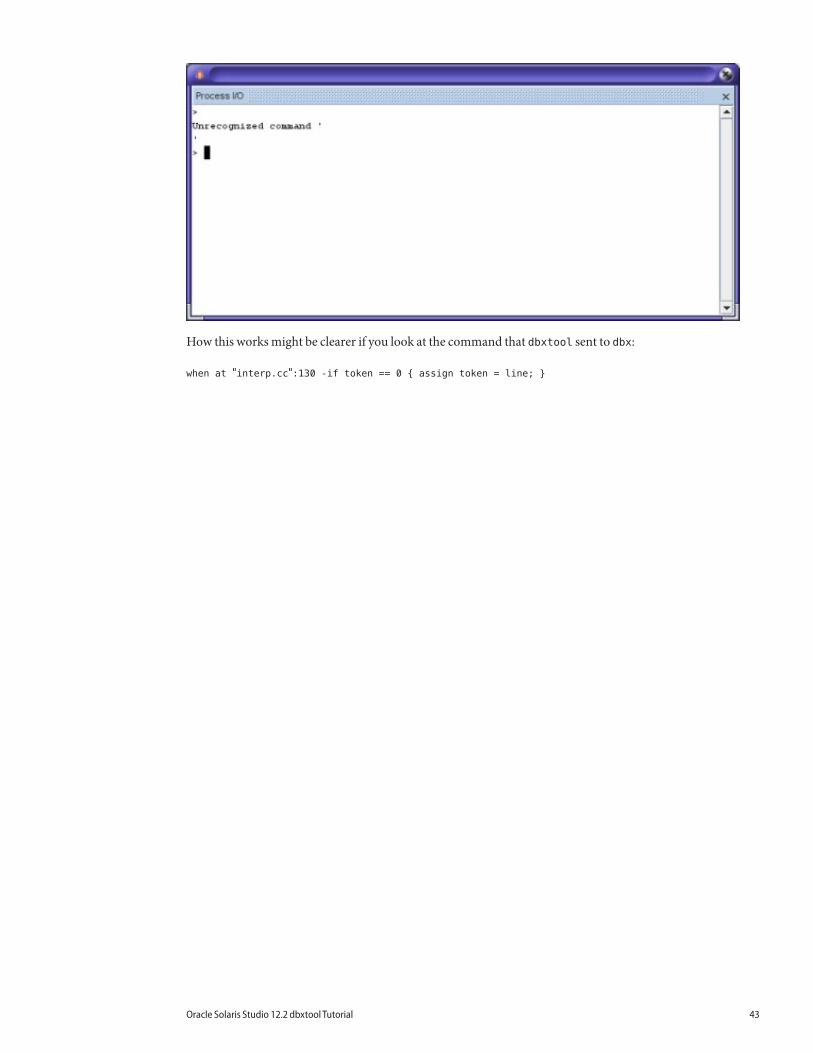
How this works might be clearer if you look at the command that dbxtool sent to dbx:
when at "interp.cc":130 -if token == 0 { assign token = line; }
Oracle Solaris Studio 12.2 dbxtool Tutorial 43
Oracle Corporation 500 Oracle Parkway, Redwood City, CA 94065 U.S.A.
Copyright ©2010 This software and related documentation are provided under a license agreement containing restrictions on use and disclosure and are protected by intellectual property laws. Except as expressly permitted inyour license agreement or allowed by law, you may not use, copy, reproduce, translate, broadcast, modify, license, transmit, distribute, exhibit, perform, publish, or display any part, in any form, or by any means. Reverseengineering, disassembly, or decompilation of this software, unless required by law for interoperability, is prohibited.The information contained herein is subject to change without notice and is not warranted to be error-free. If you find any errors, please report them to us in writing.If this is software or related software documentation that is delivered to the U.S. Government or anyone licensing it on behalf of the U.S. Government, the following notice is applicable:U.S. GOVERNMENT RIGHTS Programs, software, databases, and related documentation and technical data delivered to U.S. Government customers are “commercial computer software” or “commercial technical data”pursuant to the applicable Federal Acquisition Regulation and agency-specific supplemental regulations. As such, the use, duplication, disclosure, modification, and adaptation shall be subject to the restrictions and license termsset forth in the applicable Government contract, and, to the extent applicable by the terms of the Government contract, the additional rights set forth in FAR 52.227-19, Commercial Computer Software License (December 2007).Oracle America, Inc., 500 Oracle Parkway, Redwood City, CA 94065.This software or hardware is developed for general use in a variety of information management applications. It is not developed or intended for use in any inherently dangerous applications, including applications which maycreate a risk of personal injury. If you use this software or hardware in dangerous applications, then you shall be responsible to take all appropriate fail-safe, backup, redundancy, and other measures to ensure its safe use. OracleCorporation and its affiliates disclaim any liability for any damages caused by use of this software or hardware in dangerous applications.Oracle and Java are registered trademarks of Oracle and/or its affiliates. Other names may be trademarks of their respective owners.AMD, Opteron, the AMD logo, and the AMD Opteron logo are trademarks or registered trademarks of Advanced Micro Devices. Intel and Intel Xeon are trademarks or registered trademarks of Intel Corporation. All SPARCtrademarks are used under license and are trademarks or registered trademarks of SPARC International, Inc. UNIX is a registered trademark licensed through X/Open Company, Ltd.This software or hardware and documentation may provide access to or information on content, products, and services from third parties. Oracle Corporation and its affiliates are not responsible for and expressly disclaim allwarranties of any kind with respect to third-party content, products, and services. Oracle Corporation and its affiliates will not be responsible for any loss, costs, or damages incurred due to your access to or use of third-partycontent, products, or services.821-2127