oral health 2016 report
TRANSCRIPT

ORAL HEALTH2016 REPORT
WINDSOR-ESSEX COUNTY HEALTH UNIT
APRIL 2016
1
Authors: Mackenzie Slifierz
Epidemiologist
Gillian Stager Health Promotion Specialist
Contributors: Kim Casier Oral Health Manager Nicole Dupuis Health Promotion Director Ramsey D’Souza Manager of Epidemiology, Planning, Evaluation, and Quality Citation: Windsor-Essex County Health Unit. (2016). Oral Health 2016 Report. Windsor, Ontario. Windsor-Essex County Health Unit 1005 Ouellette Avenue Windsor, Ontario N9A 4J8 www.wechu.org 519-258-2146 © Windsor-Essex County Health Unit, April 2016.

2
Oral Health 2016 Report
Windsor-Essex County Health Unit
April 2016

3

4
A Message from the Medical Officer of Health of Windsor-Essex County
The Windsor-Essex County Health Unit is pleased to present the Oral Health 2016 Report. This initial report is significant as it is the first local report of its kind and will act as a baseline for similar reports we will do in the future. This report contains information on the current status of the oral health of residents of Windsor-Essex County, providing a profile of the region’s population by using available assessment and surveillance data. It also contains a description of the current oral health programs offered through the health unit and available to Windsor-Essex County residents and reports on the outcomes of these programs. We are pleased to use this report to showcase our community partnerships, programs, and services. I wish to acknowledge the participation and contributions of the Corporation of the City of Windsor for providing data for this report. In addition, we would like to thank the Oral Health Advisory Committee for their partnership and support of our oral health programs and services. The information in this first report will be extremely useful in identifying the specific oral health needs in our community, determining inequities in oral health and access to services, and planning for future oral health services and health promotion and prevention programs. Sincerely,
Dr. Gary M. Kirk Medical Officer of Health and CEO Windsor-Essex County Health Unit
5
Contents
A Message from the Medical Officer of Health of Windsor-Essex County ................................ 4 List of Tables ......................................................................................................................... 6 List of Figures ........................................................................................................................ 8 Glossary .............................................................................................................................. 10 Executive Summary ............................................................................................................. 11 Introduction ........................................................................................................................ 13
What is oral health? .................................................................................................................. 13 Why does oral health matter? .................................................................................................. 13 Why is oral health important to children?................................................................................ 13 What are the barriers to good oral health? .............................................................................. 14 What is public health’s role in oral health care? ...................................................................... 15
Objectives ........................................................................................................................... 16 Methods ............................................................................................................................. 17
Data Sources ............................................................................................................................. 17 Core Indicators .......................................................................................................................... 18
Oral Health Profile of Windsor-Essex County ........................................................................ 19 Dental Insurance ....................................................................................................................... 19 Visiting the Dentist .................................................................................................................... 20 Brushing Habits ......................................................................................................................... 22 Oral Health Status ..................................................................................................................... 23 Emergency Department Visits for Oral Health issues ............................................................... 26 Day Surgeries for Oral Health Issues ......................................................................................... 29 Community Water Fluoridation ................................................................................................ 32
Oral Health Programs in Windsor-Essex County ................................................................... 33 School Screenings ..................................................................................................................... 33 Preventive Services ................................................................................................................... 41 Financial Assistance Programs .................................................................................................. 43 Health Promotion Activities ...................................................................................................... 47
Oral Health Clinic Survey: Windsor-Essex County Health Unit ............................................... 50 Purpose of the Survey ............................................................................................................... 50 Respondent Demographics ....................................................................................................... 50 Survey Findings ......................................................................................................................... 52
Recommendations and Conclusions ..................................................................................... 56 Appendix A: Oral Health Core Indicators .............................................................................. 57 Appendix B: Community Water Fluoridation Statement ....................................................... 59 Appendix C: Youth Tobacco Prevention Dental Project ......................................................... 60 References .......................................................................................................................... 61
6
List of Tables
Table 1. The percentage of Windsor-Essex County residents (≥12 years old) with dental insurance by age group and household income (2013-2014).
Table 2. The percentage of Windsor-Essex County residents (≥12 years old) that visits the dentist at least once a year by age group and household income (2013-2014).
Table 3. The percentage of Windsor-Essex County residents (≥12 years old) that self-report very good or excellent oral health by age group and household income (2013-2014).
Table 4. Oral characteristics of Windsor-Essex County and Ontario residents (≥12 years old) (2013-2014).
Table 5. Oral health conditions of children (1-17 years old) visiting the emergency department in Windsor-Essex County (2010-2014).
Table 6. Oral health conditions of adults (≥18 years old) visiting the emergency department in Windsor-Essex County (2010-2014).
Table 7. The fluoride concentration (parts per million) of foods, beverages, and drinking water.
Table 8. Oral health screening of children at schools in Windsor-Essex County (2011-2015).
Table 9. The number of school facilities screened in Windsor-Essex County (2011-2015) and the intensity of tooth decay among grade 2 students at those facilities.
Table 10. Screening outcomes for children at schools in Windsor-Essex County (2011-2015).
Table 11. Trends of the core indicators for oral health as identified by the Association of Public Health Epidemiologists in Ontario, Windsor-Essex County (2011-2015).
Table 12. The number of preventative oral health services offered by the Windsor-Essex County Health Unit at its various locations throughout the region (2011-2015).
Table 13. The number of children eligible for the Children In Need of Treatment (CINOT) program presenting to the Windsor, Essex, and Leamington oral health clinics (2011-2015).
Table 14. The demographics of the primary caregivers whose child accessed the oral health clinic at the Windsor-Essex County Health Unit, 2015.

7
Table 15. Behaviours and knowledge related to oral health of primary caregivers whose child accessed the oral health clinic at the Windsor-Essex County Health Unit (2015).
Table 16. Knowledge related to child oral health of primary caregivers whose child accessed the oral health clinic at the Windsor-Essex County Health Unit (2015).
Table 17. Accessibility to dental services and oral health information for primary caregivers whose child accessed the oral health clinic at the Windsor-Essex County Health Unit (2015).
Supplementary Table 1. Core indicators for the oral health of children and youth as identified by the Association of Public Health Epidemiologists in Ontario.
8
List of Figures
Figure 1. The percentage of Windsor-Essex County residents (≥12 years old) with a dental insurance plan (2013-2014).
Figure 2. The percentage of Windsor-Essex County and Ontario residents (≥12 years old) that visit the dentist for regular check-ups or for emergency care only (2013-2014).
Figure 3. The percentage of Windsor-Essex County and Ontario residents (≥12 years old) that brush their teeth regularly (2013-2014).
Figure 4. Self-perceived health of teeth and mouth among residents (≥12 years old) of Windsor-Essex County and Ontario (2013-2014).
Figure 5. The percentage of Windsor-Essex County and Ontario residents (≥12 years old) that reported oral health issues in the past month (2013-2014).
Figure 6. The annual number of oral health-realted emergency department (ED) visits by children (1-17 years old) and adults (≥18 years old) in Windsor-Essex County (2010-2014).
Figure 7. Total number of oral health-related emergency department (ED) visits by age group, Windsor-Essex County (2010-2014).
Figure 8. The rate of day surgeries for oral health issues among children and youth (0-19 years old) in Windsor-Essex County (WEC) and Ontario (ON), 2010-2014.
Figure 9. The average annual number of day surgeries for oral health issues in Windsor-Essex County by sex and age, 2010-2014.
Figure 10. The average annual rate of day surgeries for oral health issues among children and youth (0-19 years old) by Forward Sortation Areas (FSA) in Windsor-Essex County, 2010-2014.
Figure 11. Comparison of school screening outcomes between Windsor-Essex County and Ontario (2011-2015).
Figure 12. The proportion of caries-free children in the screening program by school grade and school year, Windsor-Essex County (2011-2015).
Figure 13. The deft/DMFT index of screened children by school grade and school year, Windsor-Essex County (2011-2015).
9
Figure 14. Percent of students with at least one decayed/missing/filled primary or permanent tooth (deft or DMFT≥1) by municipality, Windsor-Essex County (2014-2015 school year).
Figure 15. The kit distributed to children in the Baby Oral Health Program.
Figure 16. Number of children receiving treatment by either a dental hygienist (RDH) or dentist (DDS) through the Health Smiles Ontario (HSO) program in Windsor-Essex County (2011-2015).
Figure 17. The total cost of treatments in the Health Smiles Ontario (HSO) program, Windsor-Essex County (2011-2015).
Figure 18. The total amount paid through Ontario Works for oral health services children (<18 years old) in Windsor-Essex County (2010-2014).
Figure 19. The total amount paid by category through Ontario Works for oral health services for children (<18 years old) in Windsor-Essex County (2010-2014).

10
Glossary
APHEO – Association of Public Health Epidemiologists in Ontario DMFT – Decayed/Missing/Filled permanent teeth deft – decayed/extracted/filled primary teeth Epidemiology – the study of the causes and patterns of diseases in populations Periodontal disease – disease of the gums with symptoms that range from inflammation to tissue damage PFS – pit and fissure sealant PATF - professionally applied topical fluoride WEC – Windsor-Essex County; includes the municipalities of Amherstburg, Essex, Kingsville, Lakeshore, LaSalle, Leamington, Pelee, Tecumseh, and Windsor WECHU – Windsor-Essex County Health Unit
11
Executive Summary
Oral health is vital to general health and overall well-being at every stage of life. Most oral health conditions are largely preventable, yet people may not properly care for their teeth through their own health habits or lack of resources to seek professional preventive dental care. Oral health issues share common risk factors with other chronic diseases, as well as their underlying social determinants of health, such as income, employment, education, or other social factors that can impact health. Public health units are well-situated to take a leading role in improving oral health in the communities they serve. The Oral Health 2016 Report was prepared by the Windsor-Essex County Health Unit to provide baseline information about the oral health status of, and public services currently offered in, our community. The key findings are summarized below. Oral health profile of Windsor-Essex County: • Nearly 1 in 3 residents report having no form of dental insurance coverage. • Over 1 in 4 residents do not regularly visit the dentist for annual check-ups. • Nearly 1 in 5 residents report brushing their teeth less than twice per day. • Residents from low income households consistently had less dental insurance coverage,
were less likely to visit the dentist for regular annual check-ups, and had poorer overall oral health status and habits.
• There is an average of 544 emergency department visits each year for oral health issues. • Each year, there is an average rate of 806 oral day surgeries per 100,000 children and youth.
The rate of oral day surgeries is greatest in Leamington and certain parts of Windsor. • None of the nine municipalities in Windsor-Essex County fluoridate their water supplies. Oral health programs in Windsor-Essex County: • In the 2014-2015 school year, 15,868 children from 116 schools were screened for oral
health issues. School screening results from 2011 to 2015 indicate that oral health is worsening for children in Windsor-Essex County.
• When compared to Windsor, children from Leamington had more decayed/missing/filled teeth, and children from LaSalle and Tecumseh had fewer decayed/missing/filled teeth.
• In 2015, there were 283 children (0-4 years old) screened through the Baby Oral Health Programs (BOHP).
• The health unit provided preventive services to 2,232 children (<18 years old) in 2015 at its oral health clinics in Windsor, Essex, and Leamington.
• In 2015, there were 865 children eligible for the Children in Need of Treatment (CINOT) program and 666 children in the Healthy Smiles Ontario (HSO) program.
• The Ontario Works program covered $948,422 in dental expenses for children in 2015; most of this went to restorative, preventive, and diagnostic services.

12
Evaluative Oral Health Clinic Survey (Windsor-Essex County Health Unit): • Caregivers bringing their children to the health unit dental clinics were well-educated and
spoke a variety of languages; 16% were new Canadians. • The primary reason for visiting the clinic was for a check-up. Of the children visiting the
clinic, 44% did not have a dentist and 46% of caregivers did not visit the dentist regularly. The main reasons for not having a dentist were no insurance coverage and the high cost of care.
• Seventy percent (70%) of caregivers were unsure about whether their community water supply is fluoridated.
Overall, these important findings demonstrate that oral health is worsening in our community and that there is a need for expanded oral health care in Windsor-Essex County, particularly among those who experience barriers to basic preventative care.

13
Introduction
What is oral health? Oral health is a key part of overall well-being and can directly impact a person’s quality of life. The Canadian Dental Association outlines oral health as a state that is linked to a person’s physical and emotional well-being (Canadian Dental Association, 2010). Good oral health means being free of mouth and facial pain, cavities, periodontal disease, and any other negative issues that impact the oral cavity (Petersen, 2003).
Two of the most common oral health concerns are tooth decay (cavities) and periodontal disease (gum disease) (Ministry of Health and Long-Term Care, 2012). In fact, cavities are one of the most prevalent chronic infectious diseases among Ontarians; yet these same oral health issues are largely preventable (Ministry of Health and Long-Term Care, 2012).
To prevent oral health issues, it is recommended to brush twice a day, floss once a day, visit the dentist regularly, and eat a healthy diet (Canadian Dental Association, 2010). Regular professional oral health care is an important part in maintaining good oral health, as it involves prevention, diagnosis, and treatment of issues such as cavities and gum disease, in a timely manner (College of Dental Hygienists of Ontario, 2014).
Why does oral health matter? Oral health issues can also impact a person’s quality of life. Missing teeth and oral pain can impact a person’s speech, what they eat, and how they socialize (College of Dental Hygienists of Ontario, 2014). In fact, some studies have shown that people who report chronic mouth pain are more likely to take a sick day (Quinonez, Figueiroedo, & Locker, 2011).
In recent years an increasing amount of research has shown the important link between oral health and overall health. Oral health issues have been linked to respiratory infections, cardiovascular disease, diabetes, and poor nutrition. More recently, evidence has emerged that shows a link between maternal periodontal disease and babies with low birth weights (Ministry of Health and Long-Term Care, 2012).
Why is oral health important to children? Oral health is a key part of a child’s overall health and well-being. It is important to many aspects of a child’s development, as poor oral health can lead to issues with eating, speech development, and self-esteem (Rowan-Legg, 2013). Dental issues and oral pain can also result in missed school days and negatively impact learning and behavior. In Canada, it is estimated that 2.26 million school days are lost each year due to dental visits or dental sick days (Health Canada, 2010).
In Canada, cavities are the most common chronic childhood disease, with more than 50% of children between the ages of 6 to 11 having had a cavity, while toddlers 2 to 4 years of age are also demonstrating increasing rates of cavities, as well (Rowan-Legg, 2013). Another oral health concern that children may experience is early childhood caries (ECC); a condition where one or more missing, decayed or filled teeth are present in a child. When serious cases of ECC occur, surgery may be required. This type of surgery is the most common surgery among
14
children in Canada, with the highest prevalence among Aboriginal children (Canadian Institute for Health Information, 2013) (Seto, Ha Thanh, & Quinonez, 2014). In Ontario, the Erie St Clair Local Health Integration Network (LHIN) – which includes Windsor-Essex, Chatham-Kent, and Sarnia-Lambton – has the third highest rate of this type of surgery (21.2 per 1,000 children aged 1 to younger than 5 years of age), following the highest rates in the North East and North West LHINs (Canadian Institute for Health Information, 2013).
Preventative dental care for children can benefit oral health and reduce costs later on (Rowan-Legg, 2013). Health promotion and prevention at an early age can help develop a solid foundation for life-long oral health. The Canadian Dental Association recommends a dental assessment for babies within six months of their first tooth or by the child’s first birthday. This allows for identifying any concerns at an early stage, and allows for the opportunity to provide caregivers with information on proper oral hygiene and nutrition.
What are the barriers to good oral health? There are direct links between poor oral health and poor overall health, so it is not surprising that oral diseases have many of the same social and economic determinants (e.g., income, employment, education, access to health services, social support and other factors that impact the health of people and communities) as other chronic diseases (College of Dental Hygienists of Ontario, 2014). Oral health and general health should not be thought of separately; oral health is one important component of overall health (Seto, Ha Thanh, & Quinonez, 2014). This becomes clear when oral health is looked at in relation to chronic disease risk factors. Diabetes, heart disease, and cancer all share common risk factors such as poor diet, alcohol use, and smoking and these are also possible risk factors for poor oral health, along with several others (Federal, Provincial and Territorial Dental Working Group, 2012). In Ontario, the majority of oral health care services are not publicly funded, which means that Ontarians are responsible for the costs of their own dental care. In Ontario, public dental coverage is the lowest of all the provinces, as only 1.2 percent of the dental services are publically funded (Canadian Centre for Policy Alternatives, 2011). Ontario provides public dental coverage to children of low income families, but there are very few options for adults with low income, including seniors (Wellesley Institute, 2015).
There are four ways people pay for their dental care: out of their own pocket, through government subsided programs (e.g., Ontario Works, and Healthy Smiles Ontario), third-party insurance (often through employer insurance benefits), or private dental insurance. The lack of coverage and access to oral health care is a key barrier for good oral health.
There are several other indicators that can act as barriers to good oral health, including, education level, income, age, where you live (urban or rural), and immigrant status. Compared to the rest of the population, immigrants receive less preventative services and more treatment, and experience more negative oral health outcomes (Canadian Academy of Health Sciences, 2014). This is important for Windsor-Essex County given the large immigrant population in the region. Furthermore, a recent systematic review found that newcomer families (refugees and immigrants) have poor oral health and face several barriers to using dental care services (Reza, et al., 2016), including language, navigating a new health care system, and lack of financial resources.
15
One outcome of poor access to oral health care can be seen through the burden it has created on other parts of the health care system. People are going to hospital emergency departments for dental problems because they are in pain and cannot afford dental treatment in the regular oral health care setting (Quiñonez, Gibson, Jokovic, & Locker, 2009). This access problem can also impact how frequently people use physician offices for dental pain.
What is public health’s role in oral health care? The Windsor-Essex County Health Unit, along with all other Public Health Units in Ontario, offers oral health programs in accordance with the Ontario Public Health Standards (OPHS) (Ontario Ministry of Health and Long-term Care [OMHLTC], 2014). In Ontario, Public Health Units are governed by these standards and they outline what programs and services the board of health is responsible to offer the community. Oral health is addressed under the Child Health standard of the OPHS. The goal of this standard is “to enable all children to attain and sustain optimal health and development potential” (OMHLTC, 2014, p. 39).
The oral health-specific requirement under the standard states that the goal of this requirement is to ensure “an increased proportion of children have optimal oral health” (OMHLTC, 2014, p. 39). This goal of improving the oral health of children in Windsor-Essex County is to be achieved through the implementation of various mandated activities (protocols), including:
• Oral Health Assessment and Surveillance Protocol, 2008 (Oral health assessment and surveillance/Dental screening in elementary schools) (OMHLTC, 2008a).
• Preventive Oral Health Services Protocol, 2008 (Providing preventive services) (OMHLTC, 2008b).
• Children In Need Of Treatment (CINOT) Program Protocol, 2008 (Treatment services to children in need of urgent treatment, without dental insurance or means to pay for care) (OMHLTC, 2008c).
• Protocol for the Monitoring of Community Water Fluoride Levels (not applicable in this instance, as fluoride was removed from the Windsor municipal water supply in 2013) (OMHLTC, 2014).
The present report primarily addresses the assessment and surveillance requirements, including monitoring trends over time, emerging trends, and priority populations.
16
Objectives
The aim of this report is to describe the current status of oral health in Windsor-Essex County. Specifically, this report will address the following objectives:
1. Provide an oral health profile of the Windsor-Essex County population using available assessment and surveillance data.
2. Describe the current oral health programs available to Windsor-Essex County residents and report on the outcomes of applicable programs.
3. Evaluate the oral health knowledge, behaviours, attitudes, and resources available to caregivers whose children were attending the oral health clinics run by the Windsor-Essex County Health Unit.
The information in this report can be used to identify the oral health needs in our community, determine inequities in oral health and access to services, examine and detail the dental programs and services offered by the Windsor-Essex County Health Unit, and plan for future oral health services and health promotion and prevention programs.

17
Methods
To fulfill the objectives of this report, data were collected from various sources. The specific data sources for each section of the report are listed below:
• The oral health profile was constructed by using data from the Canadian Community Health Survey and the National Ambulatory Care Reporting System.
• Data for oral health programs were sources from the Oral Health Information Support System, Ontario Works, and the Windsor-Essex County Health Unit records.
• Data for the evaluation of the oral health clinic at the Windsor-Essex County Health Unit were collected from a survey tool developed by the health unit.
The data were analyzed by the Epidemiology, Planning, Evaluation, and Quality Department at the Windsor-Essex County Health Unit. The specific analytical methodology for each data source is described in the next section.
Data Sources Canadian Community Health Survey (CCHS): The Canadian Community Health Survey (CCHS) is an annual cross-sectional survey that collects information related to health status, health care utilization, and health determinants for non-institutionalized Canadians aged 12 years and over in all provinces and territories. The CCHS contains two oral health components which focus on accessing dental services (e.g., visits to the dentist), oral health behaviours (e.g., brushing), and self-reported oral health status (e.g., toothaches, sensitivity). Reliable estimates for health regions (e.g., Windsor-Essex County) can be produced by using a collated 2-year data set (e.g., 2013-2014). The estimates presented in this report adhere to the guidelines in the 2014 CCHS User Guide and were generated using bootstrapped weights. If the coefficient of variation (CV) was ≥16.6 and ≤33.3 the estimates was accompanied by a cautionary statement of high sampling variability. If the CV was >33.3 the estimate was excluded from the reported due to very high sampling variability. National Ambulatory Care Reporting System (NACRS): This database captures client visits for ambulatory care in facilities and the community. It is administered by the Canadian Institute for Health Information and contains ambulatory care data for outpatient and community-based clinics, emergency department visits, and day surgeries. In addition to service-specific information, it also collects demographic information. Data for oral health-related emergency department visits and day surgeries in Windsor-Essex County (2010-2014) were extracted from this database and presented in this report. Oral Health Information Support System (OHISS): The Oral Health Information Support System (OHISS) is a database used for oral health screening and surveillance activities by public health units as mandated by Ontario Public Health Standards (2008). OHISS captures data on all children and youth under 18 who partake in publicly funded dental services (e.g., screening). Data extracted from OHISS for the 2011/2012 to 2014/2015 school years was used to generate the core indicators described in Supplementary Table 1.
18
Oral Health Clinic Survey, Windsor-Essex County Health Unit: The Oral Health Clinic Survey (WECHU) was implemented to determine the oral health knowledge, behaviours, attitudes, and resources available to caregivers whose children were attending the dental clinics run by the Windsor-Essex County Health Unit. The survey was designed by the oral health team at the Windsor-Essex County Health Unit and was pre-tested among the dental hygienists and dental assistants. In some cases, responses were categorized on a five-point Likert scale (strongly disagree to strongly agree). The survey was conducted at three dental clinics run by the Windsor-Essex County Health Unit in Windsor, Essex, and Leamington from June 2015 through to July 2015. The survey was available in paper format and electronic format through FluidSurvey on an iPad. Caregivers of children at the dental clinics were invited to participate in the survey and entry into a draw for a $10 gift card was provided as an incentive. There were 112 surveys completed. During analysis, 4 surveys were omitted because the respondent was not the primary caregiver and 1 survey was omitted due to incompleteness of qualifying questions. The remaining 107 surveys were analyzed.
Core Indicators The Association of Public Health Epidemiologists in Ontario (APHEO) has developed a suite of standardized indicators that align with the Ontario Public Health Standards and allow for consistent reporting of population health data by public health agencies in Ontario (APHEO and PHO, 2012). Included in these are oral health indicators which primarily focus on the oral health status of school-age children and youth (see Supplementary Table 1). This report provides these prescribed oral health indicators for the previous 4 school years (2011-2015) as well as additional indicators that were deemed relevant to oral health. However, two APHEO indicators (the proportion of children eligible for Children in Need of Care and the proportion of kindergarten students with Early Childhood Tooth Decay) cannot be determined using the data currently available from OHISS.

19
Oral Health Profile of Windsor-Essex County
This oral health profile of the Windsor-Essex County population presents the most recent comprehensive information collected through the CCHS (2013 and 2014 cycles) and NACRS (2010-2014). The specific oral health information presented in this section includes:
• Dental insurance coverage
• Visits to the dentist
• Brushing habits
• Self-reported oral health issues
• Emergency department visits for oral health issues
• Community water fluoridation
When feasible, local data were broken down to identify differences by age and socio-economic status. The equivalent Ontario values are also provided as a comparator when appropriate.
Dental Insurance The type of dental insurance coverage for Windsor-Essex County residents ≥12 years old is reported in Figure 1. Many (62%) residents are either wholly or partially covered by a dental insurance plan, although 1 in 3 residents report having no form of dental insurance coverage. Employer-sponsored plans are the primary form of coverage, while private and government plans only cover 10% of the Windsor-Essex County population. Figure 1. The percentage of Windsor-Essex County residents (≥12 years old) with a dental insurance plan (2013-2014).
Source: Canadian Community Health Survey [2013-2014], Statistics Canada, Public Use Microdata File, Statistics Canada. E – This value should be used with caution due to high sampling variability.
52%
7%E 3%E
32%
6%
Employer-sponsored plan
Government-sponsored plan
Private plan
No Dental Insurance
Unspecified

20
Analyzing the data by age and household income provides insight into inequity of dental insurance coverage among Windsor-Essex County residents (see Table 1). In general, individuals from households with a low annual income reported having dental insurance coverage less often than individuals from households with a middle or high annual income. Seniors (65+ years old) generally reported having dental insurance less often than other age groups. Those who reported having dental insurance most often were middle aged (45-64 years old) individuals from high income households and those who reported having dental insurance least often were seniors (65+ years old) from low income households. Table 1. The percentage of Windsor-Essex County residents (≥12 years old) with dental insurance by age group and household income (2013-2014).
Annual Household Income 12-19 years old
20-44 years old
45-64 years old
65+ years old
Low <$30,000 53.5%E 48.3% 44.1% 29.5%E
Middle $30,000-$99,999 70.0% 68.0% 73.0% 61.1%
High >$100,000 78.8% 67.2% 89.6% 72.7%
Source: Canadian Community Health Survey [2013-2014], Statistics Canada, Public Use Microdata File, Statistics Canada. E – This value should be used with caution due to high sampling variability.
Visiting the Dentist The frequency of dentist visits for Windsor-Essex County residents is reported in Figure 2. Seventy percent (70%) of Windsor-Essex County residents reported visiting the dentist once a year or more for a check-up. This was similar to the Ontario value; however, more Windsor-Essex County residents opted for only one annual check-up over multiple check-ups annually. Among Windsor-Essex County residents, 1 in 4 do not regularly visit the dentist for annual check-ups: 5% report visiting the dentist less than once per year for a check-up and 21% report visiting for emergency care only. These values are similar for Ontario.

21
Figure 2. The percentage of Windsor-Essex County and Ontario residents (≥12 years old) that visit the dentist for regular check-ups or for emergency care only (2013-2014).
Source: Canadian Community Health Survey [2013-2014], Statistics Canada, Public Use Microdata File, Statistics Canada. Analyzing dentist visits by age and annual household income reveals certain inequities (see Table 2). Windsor-Essex County residents from low income households reported annual check-ups much less often than individuals from middle and high income households. For age groups, the only inequity observed was that youth (12-19 years old) reported annual check-ups more often than other age groups. Overall, Windsor-Essex County residents over 19 years old from low income households reported annual dental check-ups the least often. Table 2. The percentage of Windsor-Essex County residents (≥12 years old) that visits the dentist at least once a year by age group and household income (2013-2014).
Annual Household Income 12-19 years old
20-44 years old
45-64 years old
65+ years old
Low <$30,000 59.7%E 46.8% 44.9%E 47.8%
Middle $30,000-$99,999 84.2% 70.0% 76.9% 74.7%
High >$100,000 88.4% 80.6% 90.2% 81.5%
Source: Canadian Community Health Survey [2013-2014], Statistics Canada, Public Use Microdata File, Statistics Canada. E – This value should be used with caution due to high sampling variability.
More than once ayear for check-ups
About once a year forcheck-ups
Less than once a yearfor check-ups
Only for emergencycare
WEC 28.9% 41.2% 5.0% 21.4%ON 41.6% 29.0% 6.0% 19.9%
0%
10%
20%
30%
40%
50%
Perc
enta
ge o
f the
pop
ulat
ion
(%)
22
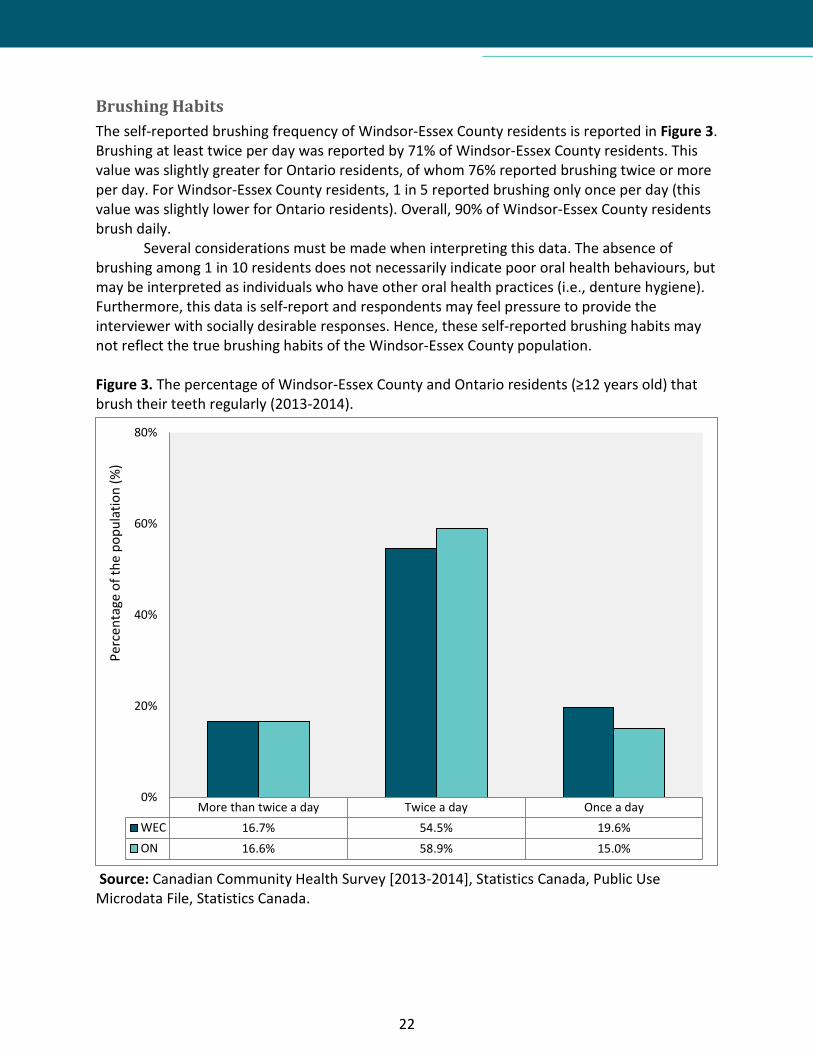
Brushing Habits The self-reported brushing frequency of Windsor-Essex County residents is reported in Figure 3. Brushing at least twice per day was reported by 71% of Windsor-Essex County residents. This value was slightly greater for Ontario residents, of whom 76% reported brushing twice or more per day. For Windsor-Essex County residents, 1 in 5 reported brushing only once per day (this value was slightly lower for Ontario residents). Overall, 90% of Windsor-Essex County residents brush daily.
Several considerations must be made when interpreting this data. The absence of brushing among 1 in 10 residents does not necessarily indicate poor oral health behaviours, but may be interpreted as individuals who have other oral health practices (i.e., denture hygiene). Furthermore, this data is self-report and respondents may feel pressure to provide the interviewer with socially desirable responses. Hence, these self-reported brushing habits may not reflect the true brushing habits of the Windsor-Essex County population. Figure 3. The percentage of Windsor-Essex County and Ontario residents (≥12 years old) that brush their teeth regularly (2013-2014).
Source: Canadian Community Health Survey [2013-2014], Statistics Canada, Public Use Microdata File, Statistics Canada.
More than twice a day Twice a day Once a dayWEC 16.7% 54.5% 19.6%ON 16.6% 58.9% 15.0%
0%
20%
40%
60%
80%
Perc
enta
ge o
f the
pop
ulat
ion
(%)
23
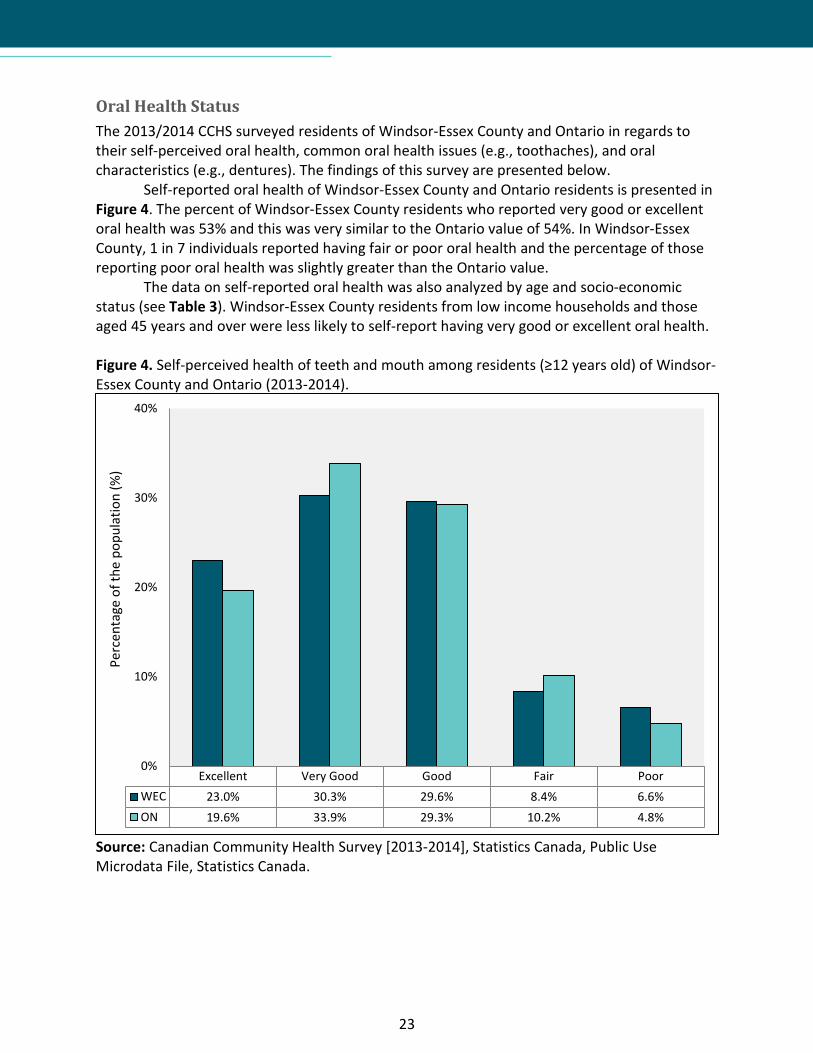
Oral Health Status The 2013/2014 CCHS surveyed residents of Windsor-Essex County and Ontario in regards to their self-perceived oral health, common oral health issues (e.g., toothaches), and oral characteristics (e.g., dentures). The findings of this survey are presented below.
Self-reported oral health of Windsor-Essex County and Ontario residents is presented in Figure 4. The percent of Windsor-Essex County residents who reported very good or excellent oral health was 53% and this was very similar to the Ontario value of 54%. In Windsor-Essex County, 1 in 7 individuals reported having fair or poor oral health and the percentage of those reporting poor oral health was slightly greater than the Ontario value.
The data on self-reported oral health was also analyzed by age and socio-economic status (see Table 3). Windsor-Essex County residents from low income households and those aged 45 years and over were less likely to self-report having very good or excellent oral health. Figure 4. Self-perceived health of teeth and mouth among residents (≥12 years old) of Windsor-Essex County and Ontario (2013-2014).
Source: Canadian Community Health Survey [2013-2014], Statistics Canada, Public Use Microdata File, Statistics Canada.
Excellent Very Good Good Fair PoorWEC 23.0% 30.3% 29.6% 8.4% 6.6%ON 19.6% 33.9% 29.3% 10.2% 4.8%
0%
10%
20%
30%
40%
Perc
enta
ge o
f the
pop
ulat
ion
(%)

24
Table 3. The percentage of Windsor-Essex County residents (≥12 years old) that self-report very good or excellent oral health by age group and household income (2013-2014).
Annual Household Income 12-19 years old
20-44 years old
45-64 years old
65+ years old
Low <$30,000 57.4%E 39.6%E 27.1%E 33.9E
Middle $30,000-$99,999 62.1% 57.6% 57.4% 49.2
High >$100,000 66.2% 64.6% 66.1% 76.4
Source: Canadian Community Health Survey [2013-2014], Statistics Canada, Public Use Microdata File, Statistics Canada. E – This value should be used with caution due to high sampling variability. When surveyed about experiencing oral health issues in the past month, over 1 in 4 residents of Windsor-Essex County reported tooth sensitivity to hot or cold; this was the leading oral health issue among respondents. Additional oral health issues are reported in Figure 5. The least frequently reported issues were pain in or around the jaw joints and pain in the mouth or face. There were no major differences between Windsor-Essex County and Ontario. Figure 5. The percentage of Windsor-Essex County and Ontario residents (≥12 years old) that reported oral health issues in the past month (2013-2014).
Source: Canadian Community Health Survey [2013-2014], Statistics Canada, Public Use Microdata File, Statistics Canada.
Toothsensitivity tohot or cold
Dry mouth Bad breath Bleedinggums Toothache
Pain in oraround jaw
joints
Pain in themouth or
faceWEC 26.8% 14.8% 12.6% 12.1% 11.8% 9.8% 6.5%ON 27.9% 14.5% 13.4% 13.4% 11.0% 9.6% 7.1%
0%
5%
10%
15%
20%
25%
30%
Perc
enta
ge o
f the
pop
ulat
ion
(%)

25
The oral characteristics of the Windsor-Essex County and Ontario populations are reported in Table 4. The majority (93%) of Windsor-Essex County residents reported having at least one tooth and 15% reported having dentures or false teeth, which was slightly lower than the Ontario value. Nearly 1 in 10 residents of Windsor-Essex County reported having a tooth removed by a dentist in the past year and this was slightly greater than the Ontario value. There was a small proportion who reported having difficulty speaking or being socially limited due to oral health issues. Table 4. Oral characteristics of Windsor-Essex County and Ontario residents (≥12 years old) (2013-2014).
Oral Health Characteristic Percentage of Windsor-Essex residents (%)
Percentage of Ontario residents (%)
Has one or more of own teeth 92.6 92.2
Has dentures or false teeth 15.3 17.5
Has had any teeth removed by a dentist in the past 12 months 9.6 7.6
Has experienced any oral or facial pain or discomfort 47.7 49.6
Has difficultly speaking clearly due to a condition of the teeth/mouth 1.7E 2.5
Has been limited socially due to oral health status in past 12 months 3.3E 4.6
Source: Canadian Community Health Survey [2013-2014], Statistics Canada, Public Use Microdata File, Statistics Canada. E – This value should be used with caution due to high sampling variability.

26
Emergency Department Visits for Oral Health issues An outcome of poor access to oral health care can be seen through the impact it has on the health care system. People are using hospital emergency departments for dental problems because they are in pain and cannot afford dental treatment in the regular oral health care setting (Quiñonez, Gibson, Jokovic, & Locker, 2009).
This is an expensive and ineffective alternative to preventative oral health care. Individuals who access emergency departments (ED) for oral health issues tend to receive pain medication (e.g., opioids), and not treatment to resolve the oral health problem, which means that many will return to the ED. In an Ontario study, it was found that the majority (78%) of these types of visits were triaged as non-urgent, and most (93%) were simply discharged (Quiñonez, Gibson, Jokovic, & Locker, 2009).
In 2013, there were almost 59,000 visits to the ED for oral health problems. At a minimum cost of $513 per visit, the total estimated cost for dental visits to EDs in Ontario was at least $30 million in 2013 (Maund, 2014a). Visits to Ontario physicians’ offices for oral health problems in 2012 totaled 217,728 visits at a cost of $7.3 million (Maund, 2014b).
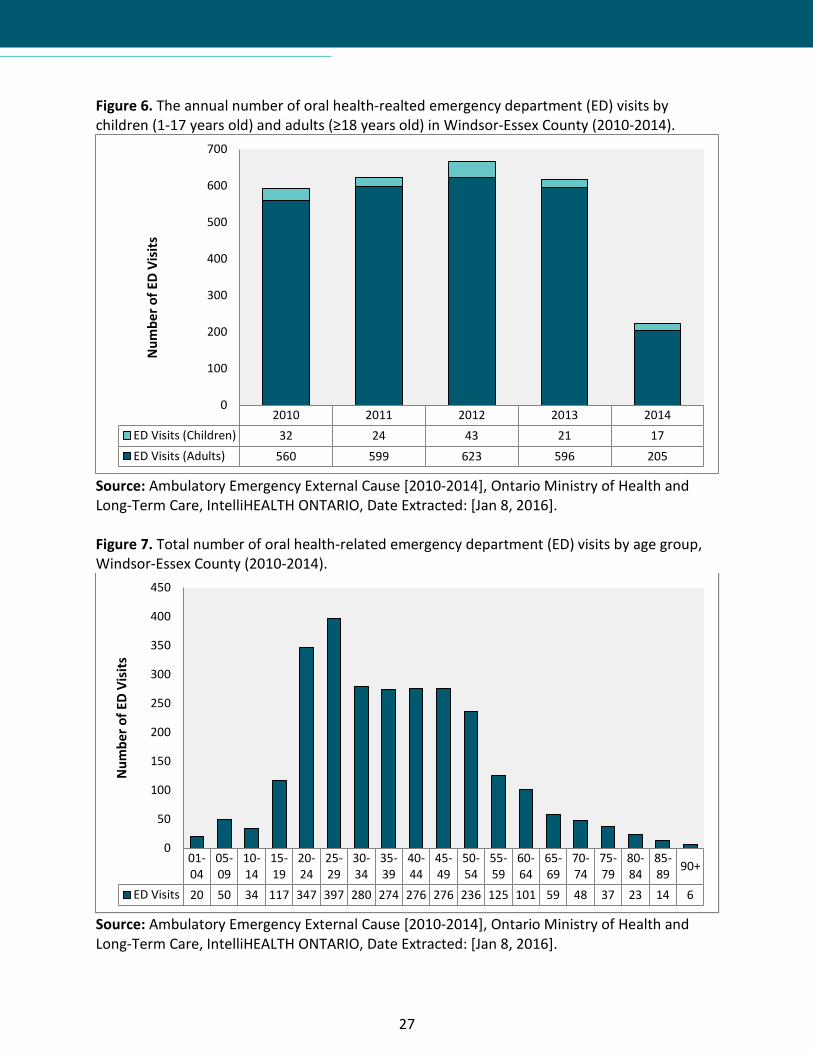
The number of EDs visits in Windsor-Essex County for oral health issues is reported by year in Figure 6 and by age in Figure 7. Between 2010 and 2014 there we a total of 2,720 visits to the ED for problems related to oral health. This corresponds to an average annual rate of 135 oral health-related ED visits per 100,000 population. Based on a minimum of $513 per visits (Maund, 2014a), it is estimated that the average total cost for ED dental visits is $279,000 per year in Windsor-Essex County.
Children (1-17 years old) represented 5% of oral health-related ED visits in Windsor-Essex County; this makes sense given that there are a number of publicly funded programs for children in Ontario (e.g., Healthy Smiles Ontario). It is unclear why the number of ED visits for oral health issues was lower in 2014 than in previous years.
27
Figure 6. The annual number of oral health-realted emergency department (ED) visits by children (1-17 years old) and adults (≥18 years old) in Windsor-Essex County (2010-2014).
Source: Ambulatory Emergency External Cause [2010-2014], Ontario Ministry of Health and Long-Term Care, IntelliHEALTH ONTARIO, Date Extracted: [Jan 8, 2016]. Figure 7. Total number of oral health-related emergency department (ED) visits by age group, Windsor-Essex County (2010-2014).
Source: Ambulatory Emergency External Cause [2010-2014], Ontario Ministry of Health and Long-Term Care, IntelliHEALTH ONTARIO, Date Extracted: [Jan 8, 2016].
2010 2011 2012 2013 2014ED Visits (Children) 32 24 43 21 17ED Visits (Adults) 560 599 623 596 205
0
100
200
300
400
500
600
700N
umbe
r of E
D Vi
sits
01-04
05-09
10-14
15-19
20-24
25-29
30-34
35-39
40-44
45-49
50-54
55-59
60-64
65-69
70-74
75-79
80-84
85-89 90+
ED Visits 20 50 34 117 347 397 280 274 276 276 236 125 101 59 48 37 23 14 6
0
50
100
150
200
250
300
350
400
450
Num
ber o
f ED
Visi
ts
28
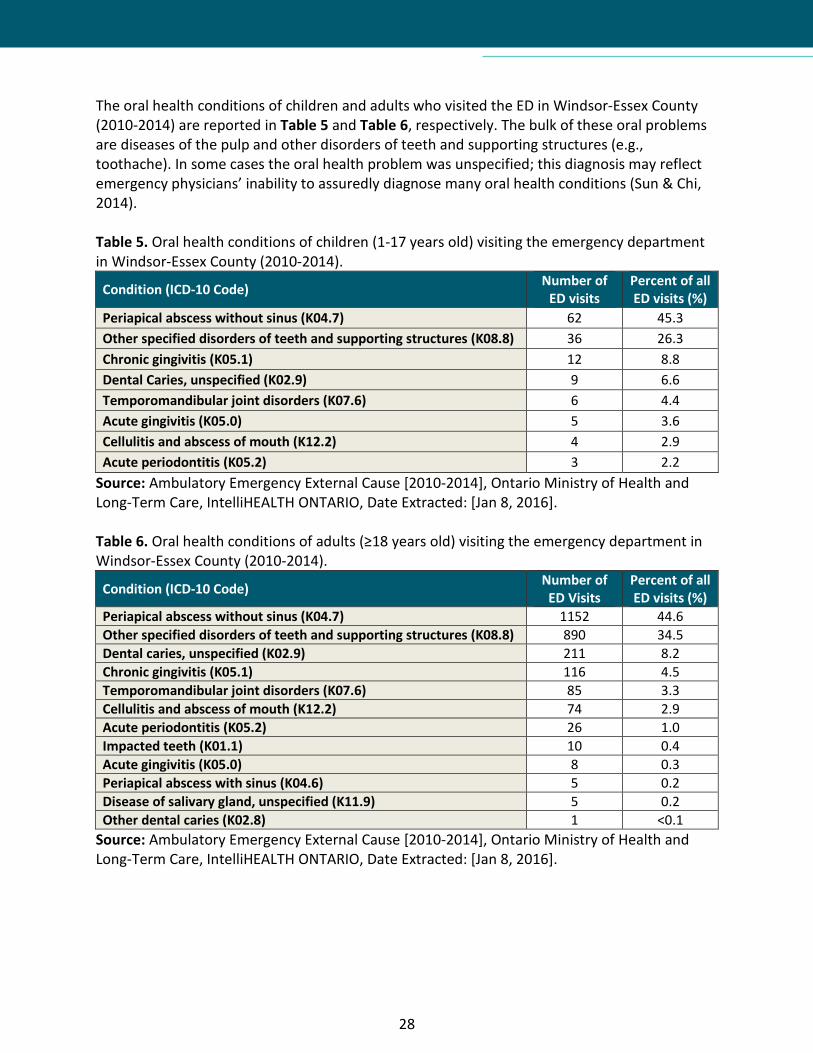
The oral health conditions of children and adults who visited the ED in Windsor-Essex County (2010-2014) are reported in Table 5 and Table 6, respectively. The bulk of these oral problems are diseases of the pulp and other disorders of teeth and supporting structures (e.g., toothache). In some cases the oral health problem was unspecified; this diagnosis may reflect emergency physicians’ inability to assuredly diagnose many oral health conditions (Sun & Chi, 2014). Table 5. Oral health conditions of children (1-17 years old) visiting the emergency department in Windsor-Essex County (2010-2014).
Condition (ICD-10 Code) Number of ED visits
Percent of all ED visits (%)
Periapical abscess without sinus (K04.7) 62 45.3 Other specified disorders of teeth and supporting structures (K08.8) 36 26.3 Chronic gingivitis (K05.1) 12 8.8 Dental Caries, unspecified (K02.9) 9 6.6 Temporomandibular joint disorders (K07.6) 6 4.4 Acute gingivitis (K05.0) 5 3.6 Cellulitis and abscess of mouth (K12.2) 4 2.9 Acute periodontitis (K05.2) 3 2.2
Source: Ambulatory Emergency External Cause [2010-2014], Ontario Ministry of Health and Long-Term Care, IntelliHEALTH ONTARIO, Date Extracted: [Jan 8, 2016]. Table 6. Oral health conditions of adults (≥18 years old) visiting the emergency department in Windsor-Essex County (2010-2014).
Condition (ICD-10 Code) Number of ED Visits
Percent of all ED visits (%)
Periapical abscess without sinus (K04.7) 1152 44.6 Other specified disorders of teeth and supporting structures (K08.8) 890 34.5 Dental caries, unspecified (K02.9) 211 8.2 Chronic gingivitis (K05.1) 116 4.5 Temporomandibular joint disorders (K07.6) 85 3.3 Cellulitis and abscess of mouth (K12.2) 74 2.9 Acute periodontitis (K05.2) 26 1.0 Impacted teeth (K01.1) 10 0.4 Acute gingivitis (K05.0) 8 0.3 Periapical abscess with sinus (K04.6) 5 0.2 Disease of salivary gland, unspecified (K11.9) 5 0.2 Other dental caries (K02.8) 1 <0.1
Source: Ambulatory Emergency External Cause [2010-2014], Ontario Ministry of Health and Long-Term Care, IntelliHEALTH ONTARIO, Date Extracted: [Jan 8, 2016].
29
Day Surgeries for Oral Health Issues The most common type of day surgery for children in Canada is for oral health issues primarily caused by early childhood cavities. In fact, nearly 1 in 3 day surgeries among children are for oral health issues (Canadian Institute for Health Information, 2013). Despite the commonness of this problem, the majority of these cases are preventable. Children with the highest risk of developing oral health issues that require day surgery include Aboriginals, those from low-income households, and those from rural communities (Canadian Institute for Health Information, 2013).
The rate of day surgeries among children and youth (0-19 years old) is reported in Figure 8 for Windsor-Essex County and Ontario (2010-2014). There is an average annual rate of 806 oral day surgeries (per 100,000 children and youth) in Windsor-Essex County among children and youth. In 2014, the rate of oral day surgeries was 2.4-times greater in Windsor-Essex County compared to Ontario. The average number of day surgeries in Windsor-Essex County is reported in Figure 9 by age and sex. Locally, most oral health-related day surgeries are among younger children (0-9 years old) and slightly more females are affected.
The average annual rate of oral day surgeries among children and youth (0-19 years old) was mapped by the first three digits of the patient’s postal code (referred to as the Forward Sortation Area or “FSA”) and is shown in Figure 10. The rates ranged from 43 to 139 oral day surgeries per 10,000 children and youth per year. The highest rate (139 oral day surgeries per 10,000 children and youth) was in the FSA N8H (the Leamington area), followed by N9A (105 oral day surgeries per 10,000 children and youth), N8Y (105 oral day surgeries per 10,000 children and youth), and N9B (103 oral day surgeries per 10,000 children and youth) which includes the neighbourhoods of Downtown Windsor, Walkerville, Ford City, and University/Bridgeview. The lowest rate (43 oral day surgeries per 10,000 children and youth) was in the FSA N9J (the LaSalle area), followed by N8N (52 oral day surgeries per 10,000 children and youth), N9H (52 oral day surgeries per 10,000 children and youth), and N9E (57 oral day surgeries per 10,000 children and youth) which includes Tecumseh, LaSalle, and South Windsor, respectively. These findings are unsurprising as children from low-income and rural households are at greater risk of developing oral health issues that require day surgery (Canadian Institute for Health Information, 2013).
In Ontario, the healthcare costs for these procedures are, on average, $1,408 per surgery (Canadian Institute for Health Information, 2013). Based on this average cost and using a local average of 806 oral day surgeries per year, it is estimated that oral day surgeries among children and youth in Windsor-Essex County costs $1.13 million each year. The cost and burden of oral surgeries that is placed on the healthcare system could be reduced through health promotion and prevention strategies.

30
Figure 8. The rate of day surgeries for oral health issues among children and youth (0-19 years old) in Windsor-Essex County (WEC) and Ontario (ON), 2010-2014.
Source: Ambulatory Emergency External Cause [2010-2014], Ontario Ministry of Health and Long-Term Care, IntelliHEALTH ONTARIO, Date Extracted: [March 21, 2016]. Figure 9. The average annual number of day surgeries for oral health issues in Windsor-Essex County by sex and age, 2010-2014.
Source: Ambulatory Emergency External Cause [2010-2014], Ontario Ministry of Health and Long-Term Care, IntelliHEALTH ONTARIO, Date Extracted: [March 21, 2016].
2010 2011 2012 2013 2014WEC 831.1 884.5 817.0 725.0 772.3ON 308.9 327.0 323.4 318.0 324.9
0.0
200.0
400.0
600.0
800.0
1000.0
Day
surg
erie
s per
100
,000
child
ren
and
yout
h
0-4 5-9 10-14 15-19Male 146.4 166.0 21.0 6.2Female 189.6 205.8 30.6 10.2
0.0
50.0
100.0
150.0
200.0
250.0
Aver
age
num
ber o
f day
surg
erie
s per
ye
ar

31
Figure 10. The average annual rate of day surgeries for oral health issues among children and youth (0-19 years old) by Forward Sortation Areas (FSA) in Windsor-Essex County, 2010-2014.
Source: Ambulatory Emergency External Cause [2010-2014], Ontario Ministry of Health and Long-Term Care, IntelliHEALTH ONTARIO, Date Extracted: [March 21, 2016].
32
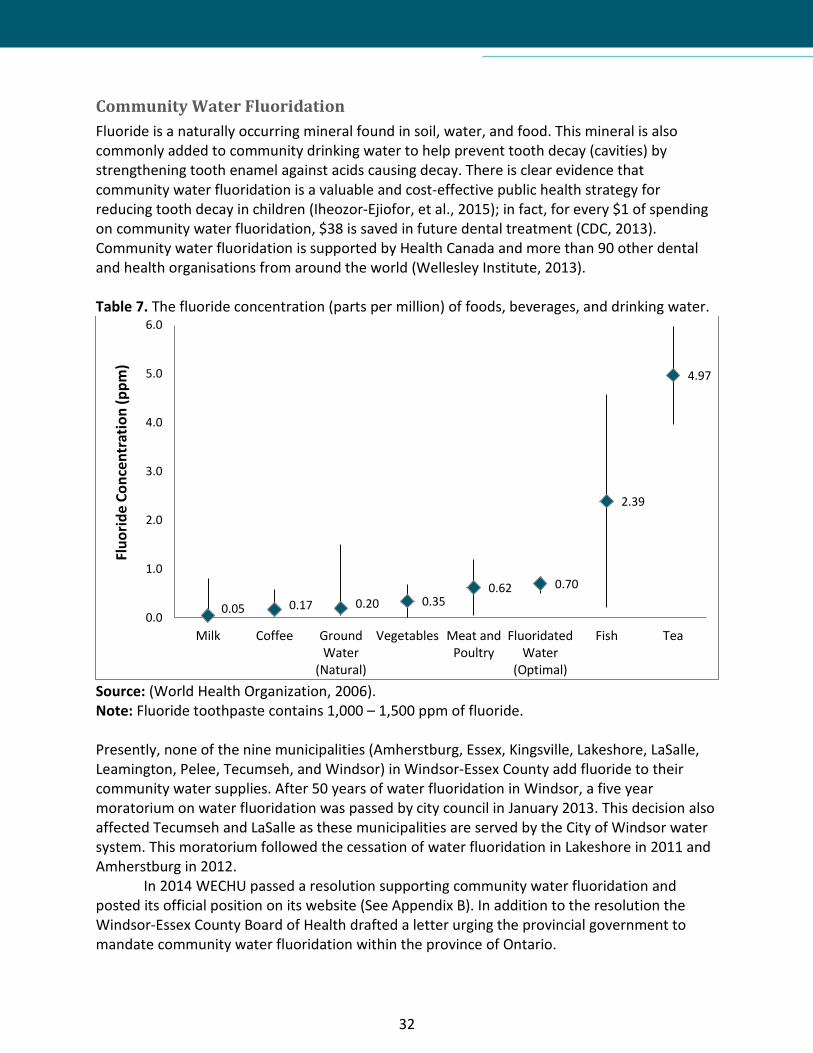
Community Water Fluoridation Fluoride is a naturally occurring mineral found in soil, water, and food. This mineral is also commonly added to community drinking water to help prevent tooth decay (cavities) by strengthening tooth enamel against acids causing decay. There is clear evidence that community water fluoridation is a valuable and cost-effective public health strategy for reducing tooth decay in children (Iheozor-Ejiofor, et al., 2015); in fact, for every $1 of spending on community water fluoridation, $38 is saved in future dental treatment (CDC, 2013). Community water fluoridation is supported by Health Canada and more than 90 other dental and health organisations from around the world (Wellesley Institute, 2013). Table 7. The fluoride concentration (parts per million) of foods, beverages, and drinking water.
Source: (World Health Organization, 2006). Note: Fluoride toothpaste contains 1,000 – 1,500 ppm of fluoride. Presently, none of the nine municipalities (Amherstburg, Essex, Kingsville, Lakeshore, LaSalle, Leamington, Pelee, Tecumseh, and Windsor) in Windsor-Essex County add fluoride to their community water supplies. After 50 years of water fluoridation in Windsor, a five year moratorium on water fluoridation was passed by city council in January 2013. This decision also affected Tecumseh and LaSalle as these municipalities are served by the City of Windsor water system. This moratorium followed the cessation of water fluoridation in Lakeshore in 2011 and Amherstburg in 2012.
In 2014 WECHU passed a resolution supporting community water fluoridation and posted its official position on its website (See Appendix B). In addition to the resolution the Windsor-Essex County Board of Health drafted a letter urging the provincial government to mandate community water fluoridation within the province of Ontario.
0.05 0.17 0.20 0.35 0.62 0.70
2.39
4.97
0.0
1.0
2.0
3.0
4.0
5.0
6.0
Milk Coffee GroundWater
(Natural)
Vegetables Meat andPoultry
FluoridatedWater
(Optimal)
Fish Tea
Fluo
ride
Conc
entr
atio
n (p
pm)

33
Oral Health Programs in Windsor-Essex County
There are several oral health programs that operate in Windsor-Essex County with the aim of improving oral health, primarily among children. Some programs are a collaboration of public health, community partners, school boards, and government agencies. The oral health programs in Windsor-Essex County are described in the following sections: (i) School Screenings, (ii) Preventive Services, (iii) Health Promotion Activities, and (iv) Community Partnerships and Intersectoral Collaboration.
School Screenings School dental screenings are conducted each year in all publicly funded elementary schools and some privately funded elementary schools. The Ontario Public Health Standards (OPHS) outline the requirement of providing annual oral health screenings to students in JK, SK, and Grade 2 at all publicly funded schools as per the Oral Health Assessment and Surveillance Protocol (OMHLTC, 2008a). Based on the Grade 2 screening results, a calculation is done to determine the school’s screening intensity level. Schools that are calculated to have a higher intensity level are required to have additional grades screened.
The “no touch” screening is done by a Registered Dental Hygienist. A ten to thirty second visual inspection of the child’s mouth is conducted with the aid of a sterilized mouth mirror and a light source. Data is collected and recorded in the Oral Health Information Support System (OHISS) for interpretation, analysis and statistical purposes.
Caregivers are notified prior to the screening date and may exclude their child from screening by notifying the school administration in writing prior to the date of the screening. A letter of no consent will be honoured for that school year only.
Through these screenings and other screening that are conducted in the community, children are identified that are in need of preventive services or urgent dental care. If the child does not have a dental provider and is in need of further care they may be referred to one of the health unit’s three clinics or to a local oral health provider

34
The following school screening results for Windsor-Essex County uses information extracted from OHISS (2011/2012 to 2014/2015 school years) to describe the oral health status of children between the ages of 4 – 14 years old who participated in the school screening program. This program is not able to screen all children but, of the approximately 48,000 children (aged 4 – 14 years old) living in Windsor-Essex County, an average of 41% of all children in this age group are screened each year through the school screening program. The total number of students screened each school year is reported in Table 8. Table 8. Oral health screening of children at schools in Windsor-Essex County (2011-2015).
School Year Students Screened Students Absent Students Excluded/Refused
2011-2012 17,102 1,200 (7.0%) 333 (2.0%) 2012-2013 22,438 1,504 (6.7%) 576 (2.6%) 2013-2014 23,198 1,322 (5.7%) 704 (3.0%) 2014-2015 15,868 873 (5.5%) 461 (2.9%)
Source: Oral Health information Support System [2011-2015], Ministry of Health and Long-Term Care (Accessed October 29, 2015). For the 2014-2015 school year, this program conducted screenings at 116 school facilities. Eleven (9.5%) of these schools had high intensities of tooth decay among grade 2 students. Compared to Ontario data (from 28 Public Health Units), 2454 school facilities were screened and 367 (15.0%) were considered to have high screening intensities. The number of school facilities where dental screening was conducted and the intensity of tooth decay among grade 2 students are reported in Table 9 for the Windsor-Essex County population. Table 9. The number of school facilities screened in Windsor-Essex County (2011-2015) and the intensity of tooth decay among grade 2 students at those facilities.
School Year Facilities Screened
High Intensity Facilities
Medium Intensity Facilities
Low Intensity Facilities
2011-2012 120 13 (10.8%) 12 (10.0%) 95 (79.2%) 2012-2013 116 10 (8.6%) 13 (11.2%) 93 (80.2%) 2013-2014 114 16 (14.0%) 13 (11.4%) 85 (74.6%) 2014-2015 116 11 (9.5%) 18 (15.5%) 87 (75.0%)
Source: Oral Health information Support System [2011-2015], Ministry of Health and Long-Term Care (Accessed October 29, 2015).
35
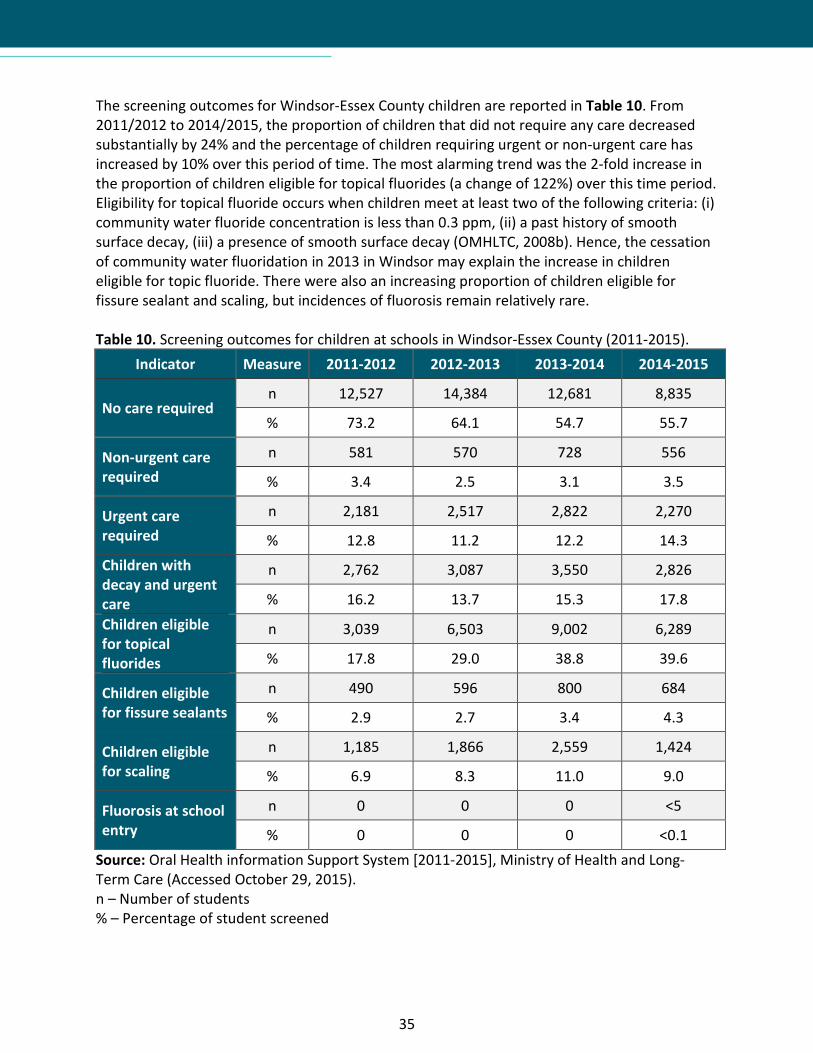
The screening outcomes for Windsor-Essex County children are reported in Table 10. From 2011/2012 to 2014/2015, the proportion of children that did not require any care decreased substantially by 24% and the percentage of children requiring urgent or non-urgent care has increased by 10% over this period of time. The most alarming trend was the 2-fold increase in the proportion of children eligible for topical fluorides (a change of 122%) over this time period. Eligibility for topical fluoride occurs when children meet at least two of the following criteria: (i) community water fluoride concentration is less than 0.3 ppm, (ii) a past history of smooth surface decay, (iii) a presence of smooth surface decay (OMHLTC, 2008b). Hence, the cessation of community water fluoridation in 2013 in Windsor may explain the increase in children eligible for topic fluoride. There were also an increasing proportion of children eligible for fissure sealant and scaling, but incidences of fluorosis remain relatively rare. Table 10. Screening outcomes for children at schools in Windsor-Essex County (2011-2015).
Indicator Measure 2011-2012 2012-2013 2013-2014 2014-2015
No care required n 12,527 14,384 12,681 8,835
% 73.2 64.1 54.7 55.7
Non-urgent care required
n 581 570 728 556
% 3.4 2.5 3.1 3.5
Urgent care required
n 2,181 2,517 2,822 2,270
% 12.8 11.2 12.2 14.3 Children with decay and urgent care
n 2,762 3,087 3,550 2,826
% 16.2 13.7 15.3 17.8 Children eligible for topical fluorides
n 3,039 6,503 9,002 6,289
% 17.8 29.0 38.8 39.6
Children eligible for fissure sealants
n 490 596 800 684
% 2.9 2.7 3.4 4.3
Children eligible for scaling
n 1,185 1,866 2,559 1,424
% 6.9 8.3 11.0 9.0
Fluorosis at school entry
n 0 0 0 <5
% 0 0 0 <0.1 Source: Oral Health information Support System [2011-2015], Ministry of Health and Long-Term Care (Accessed October 29, 2015). n – Number of students % – Percentage of student screened
36
Figure 11. Comparison of school screening outcomes between Windsor-Essex County and Ontario (2011-2015).
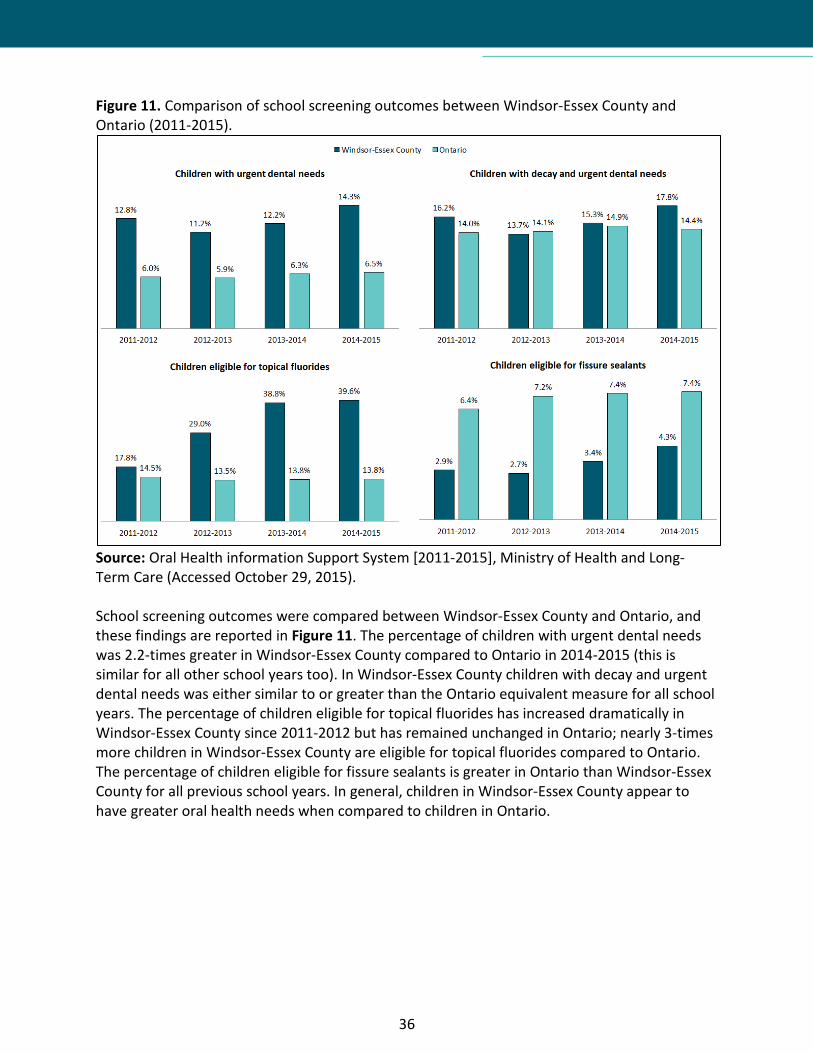
Source: Oral Health information Support System [2011-2015], Ministry of Health and Long-Term Care (Accessed October 29, 2015). School screening outcomes were compared between Windsor-Essex County and Ontario, and these findings are reported in Figure 11. The percentage of children with urgent dental needs was 2.2-times greater in Windsor-Essex County compared to Ontario in 2014-2015 (this is similar for all other school years too). In Windsor-Essex County children with decay and urgent dental needs was either similar to or greater than the Ontario equivalent measure for all school years. The percentage of children eligible for topical fluorides has increased dramatically in Windsor-Essex County since 2011-2012 but has remained unchanged in Ontario; nearly 3-times more children in Windsor-Essex County are eligible for topical fluorides compared to Ontario. The percentage of children eligible for fissure sealants is greater in Ontario than Windsor-Essex County for all previous school years. In general, children in Windsor-Essex County appear to have greater oral health needs when compared to children in Ontario.
37
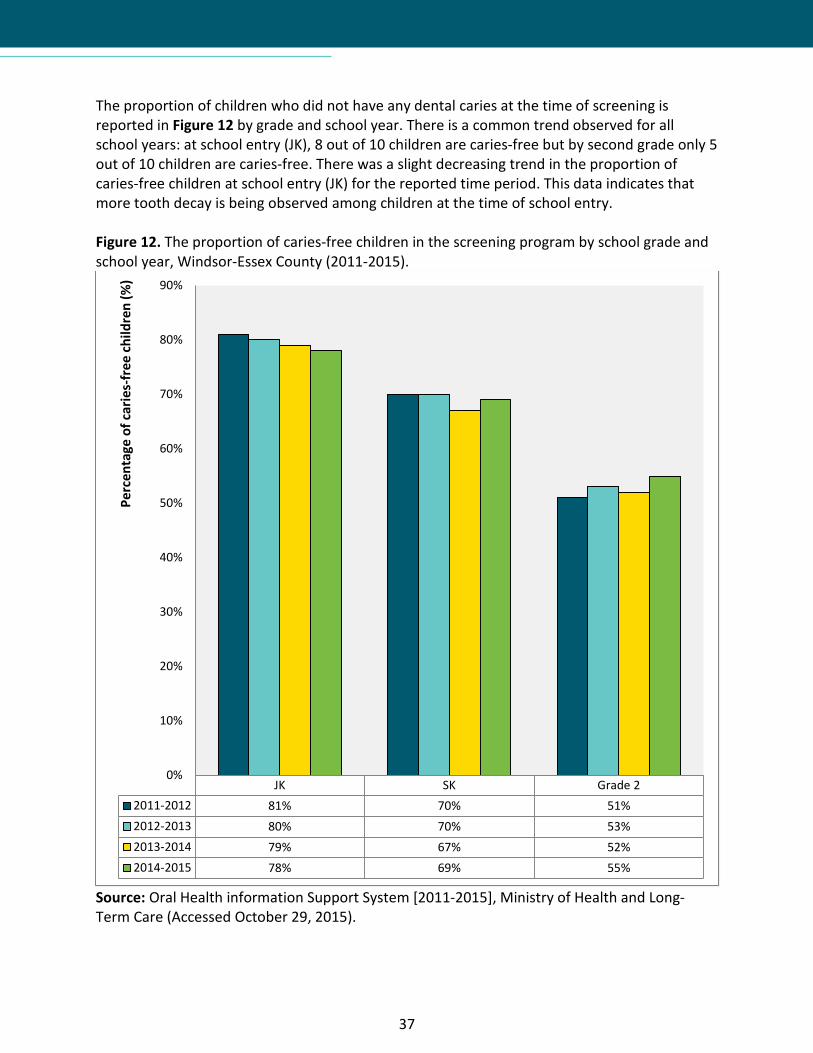
The proportion of children who did not have any dental caries at the time of screening is reported in Figure 12 by grade and school year. There is a common trend observed for all school years: at school entry (JK), 8 out of 10 children are caries-free but by second grade only 5 out of 10 children are caries-free. There was a slight decreasing trend in the proportion of caries-free children at school entry (JK) for the reported time period. This data indicates that more tooth decay is being observed among children at the time of school entry. Figure 12. The proportion of caries-free children in the screening program by school grade and school year, Windsor-Essex County (2011-2015).
Source: Oral Health information Support System [2011-2015], Ministry of Health and Long-Term Care (Accessed October 29, 2015).
JK SK Grade 22011-2012 81% 70% 51%2012-2013 80% 70% 53%2013-2014 79% 67% 52%2014-2015 78% 69% 55%
0%
10%
20%
30%
40%
50%
60%
70%
80%
90%
Perc
enta
ge o
f car
ies-
free
child
ren
(%)

38
The deft/DMFT index is a measure of decayed, missing, extracted, and filled teeth (a greater index value indicates more decayed/missing/extracted/filled teeth). The deft/DMFT index for children (JK to Grade 2) in Windsor-Essex County is reported in Figure 13. For JK students, the deft/DMFT index was greatest in 2014-2015 and lowest in 2011-2012. This may indicate a trend in more decayed, extracted/missing, or filled primary and permanent teeth among children at the time of school entry. There was also an overall trend by grade-level: the deft/DMFT index increased for students in higher grade levels. Figure 13. The deft/DMFT index of screened children by school grade and school year, Windsor-Essex County (2011-2015).
Source: Oral Health information Support System [2011-2015], Ministry of Health and Long-Term Care (Accessed October 29, 2015).
JK SK Grade 22011-2012 0.75 1.40 2.312012-2013 0.83 1.35 2.292013-2014 0.79 1.45 2.392014-2015 0.84 1.34 2.14
0.00
0.50
1.00
1.50
2.00
2.50
3.00
deft
/DM
FT in
fex

39
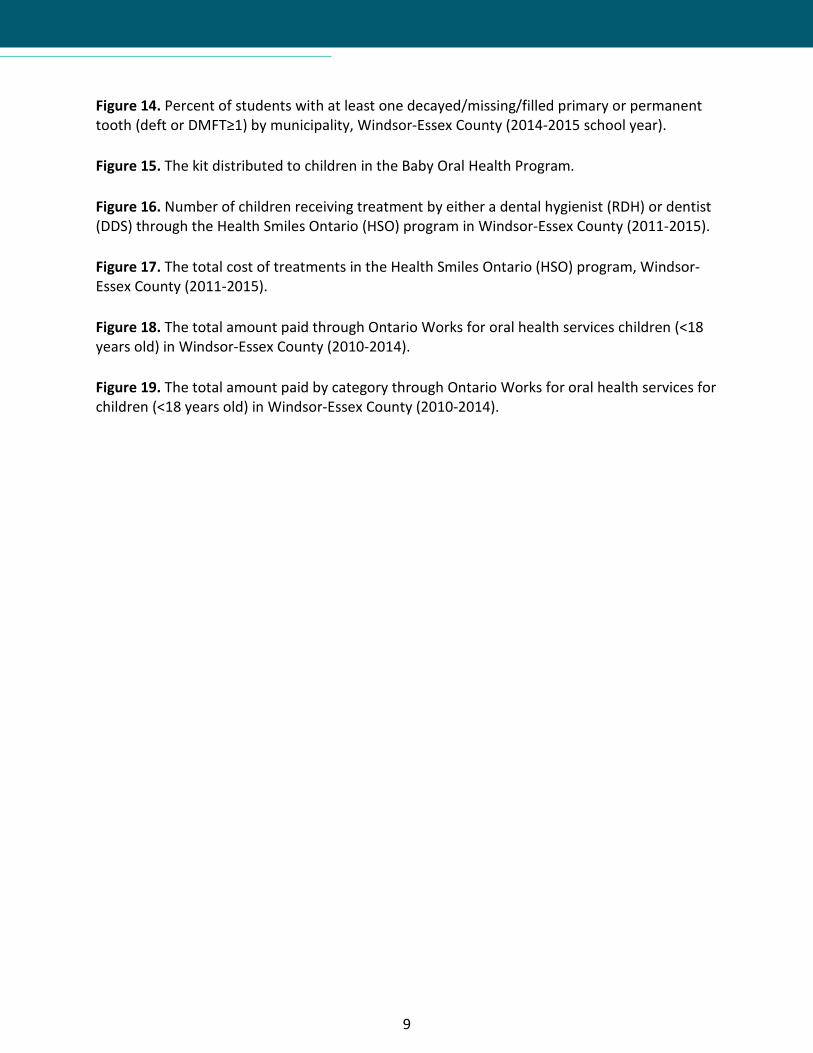
For the 2014-2015 school year, the percentage of screened students with at least one decayed/missing/filled primary or permanent tooth (deft or DMFT≥1) was analyzed by municipality (see Figure 14). Overall, LaSalle had the lowest percentage of students with deft or DMFT≥1 and Leamington had the greatest percentage of students with deft or DMFT≥1. When comparing other municipalities to Windsor, the following significant differences were detected:
• For LaSalle, 12.9% fewer JK students (95% CI: 3.1-22.7%; P=0.01) and 10.5% fewer Grade 2 students (95% CI: 0.6-20.5%; P=0.04) had any decayed, missing, or filled teeth compared to Windsor.
• For Tecumseh, 10.0% fewer JK students (95% CI: 1.4-18.7%; P=0.02), 13.5% fewer SK students (95% CI: 5.2-21.7%; P<0.01), and 15.1% fewer Grade 2 students (95% CI: 6.3-23.8%; P<0.01) had any decayed, missing, or filled teeth compared to Windsor.
• For Leamington, 18.5% more JK students (95% CI: 10.3-26.7%; P<0.01), 10.3% more SK students (95% CI: 2.4-18.1%; P=0.01), and 11.7% more Grade 2 students (95% CI: 3.4-20.0%; P<0.01) had any decayed, missing, or filled teeth compared to Windsor.
• For Amherstburg, Essex, Kingsville, and Lakeshore, the percentage of students (JK, SK, and Grade 2) with decayed, missing, or filled teeth was not significantly different than Windsor.
Overall, when comparing municipalities to Windsor, Tecumseh and LaSalle had better oral health and Leamington had poorer oral health among elementary students (JK, SK, Grade 2). Figure 14. Percent of students with at least one decayed/missing/filled primary or permanent tooth (deft or DMFT≥1) by municipality, Windsor-Essex County (2014-2015 school year).
Source: Oral Health information Support System [2011-2015], Ministry of Health and Long-Term Care (Accessed March 18, 2016). Note: Pelee was excluded due to very low sample size.
Amherstburg Essex Kingsville LaSalle Lakeshore Leamington Tecumseh Windsor
JK 21.2% 16.8% 23.2% 11.1% 18.3% 37.8% 13.0% 23.2%
SK 30.5% 29.9% 35.5% 25.4% 28.4% 41.7% 18.7% 32.3%
Grade 2 42.8% 46.6% 46.2% 37.2% 44.2% 57.4% 31.7% 46.9%
0.0%
10.0%
20.0%
30.0%
40.0%
50.0%
60.0%
70.0%
Perc
ent (
%) o
f stu
dent
s with
def
t or D
MFT
≥ 1

40
A summary of the core indicators for oral health prescribed by APHEO are reported in Table 11 along with the observed trend of these measures from 2011/2012 to 2014/2015. Every trend indicated a worsening in oral health status for children in Windsor-Essex County with the exception of the fluorosis index which remained unchanged. Table 11. Trends of the core indicators for oral health as identified by the Association of Public Health Epidemiologists in Ontario, Windsor-Essex County (2011-2015).
Indicator 2011-2012 2012-2013 2013-2014 2014-2015 Overall Trend
deft/DMFT index* 0.75 0.83 0.79 0.84 12% ↑
Caries-free children* (%) 81.0 80.0 79.0 78.0 4% ↓
Children with urgent dental needs (%) 12.8 11.2 12.2 14.3 12% ↑
Children with decay and urgent dental needs (%) 16.2 13.7 15.3 17.8 10% ↑
Children eligible for topical fluorides (%) 17.8 29.0 38.8 39.6 122% ↑
Children eligible for fissure sealants (%) 2.9 2.7 3.4 4.3 48% ↑
Fluorosis Index* (%) 0 0 0 <0.1 0% —
Source: Oral Health information Support System [2011-2015], Ministry of Health and Long-Term Care (Accessed October 29, 2015). *At school entry (kindergarten). Overall, the school screening results demonstrate that children in Windsor-Essex County have greater oral health needs compared to the province and that the oral health of children in Windsor-Essex County has worsened over the time period examined by this report. These alarming trends warrant further activities to prevent poor oral health among children and youth in our region.
41
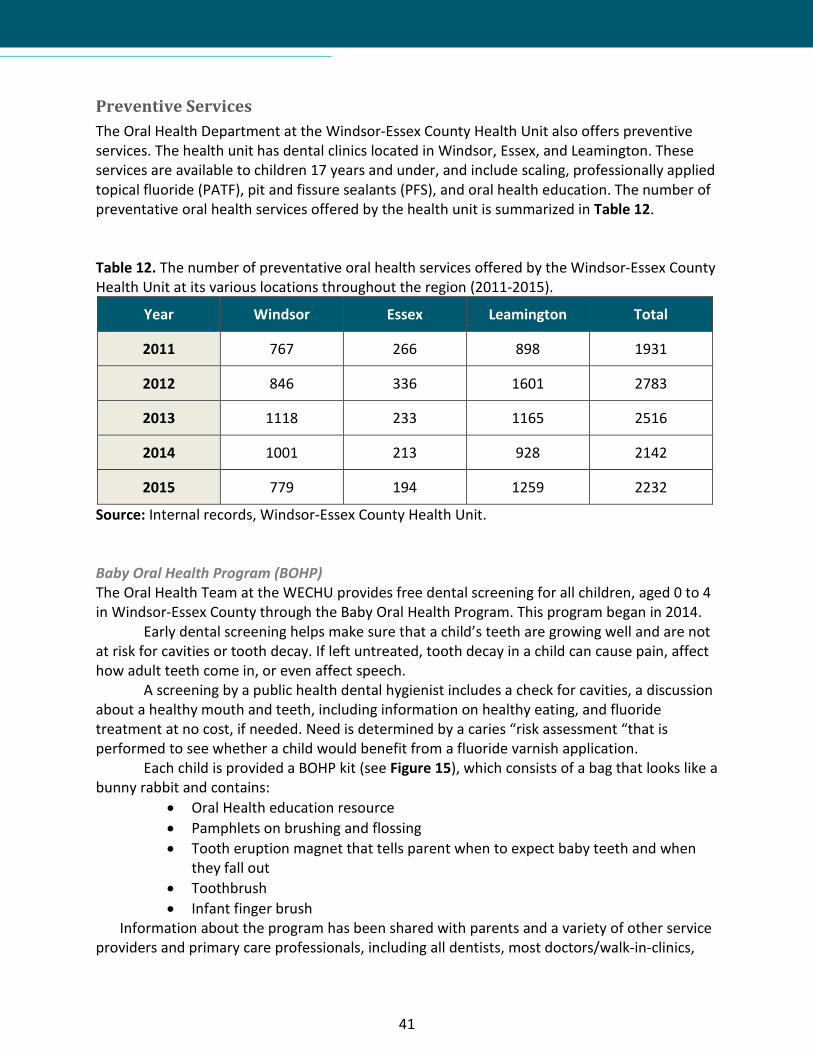
Preventive Services The Oral Health Department at the Windsor-Essex County Health Unit also offers preventive services. The health unit has dental clinics located in Windsor, Essex, and Leamington. These services are available to children 17 years and under, and include scaling, professionally applied topical fluoride (PATF), pit and fissure sealants (PFS), and oral health education. The number of preventative oral health services offered by the health unit is summarized in Table 12. Table 12. The number of preventative oral health services offered by the Windsor-Essex County Health Unit at its various locations throughout the region (2011-2015).
Year Windsor Essex Leamington Total
2011 767 266 898 1931
2012 846 336 1601 2783
2013 1118 233 1165 2516
2014 1001 213 928 2142
2015 779 194 1259 2232
Source: Internal records, Windsor-Essex County Health Unit. Baby Oral Health Program (BOHP) The Oral Health Team at the WECHU provides free dental screening for all children, aged 0 to 4 in Windsor-Essex County through the Baby Oral Health Program. This program began in 2014.
Early dental screening helps make sure that a child’s teeth are growing well and are not at risk for cavities or tooth decay. If left untreated, tooth decay in a child can cause pain, affect how adult teeth come in, or even affect speech.
A screening by a public health dental hygienist includes a check for cavities, a discussion about a healthy mouth and teeth, including information on healthy eating, and fluoride treatment at no cost, if needed. Need is determined by a caries “risk assessment “that is performed to see whether a child would benefit from a fluoride varnish application.
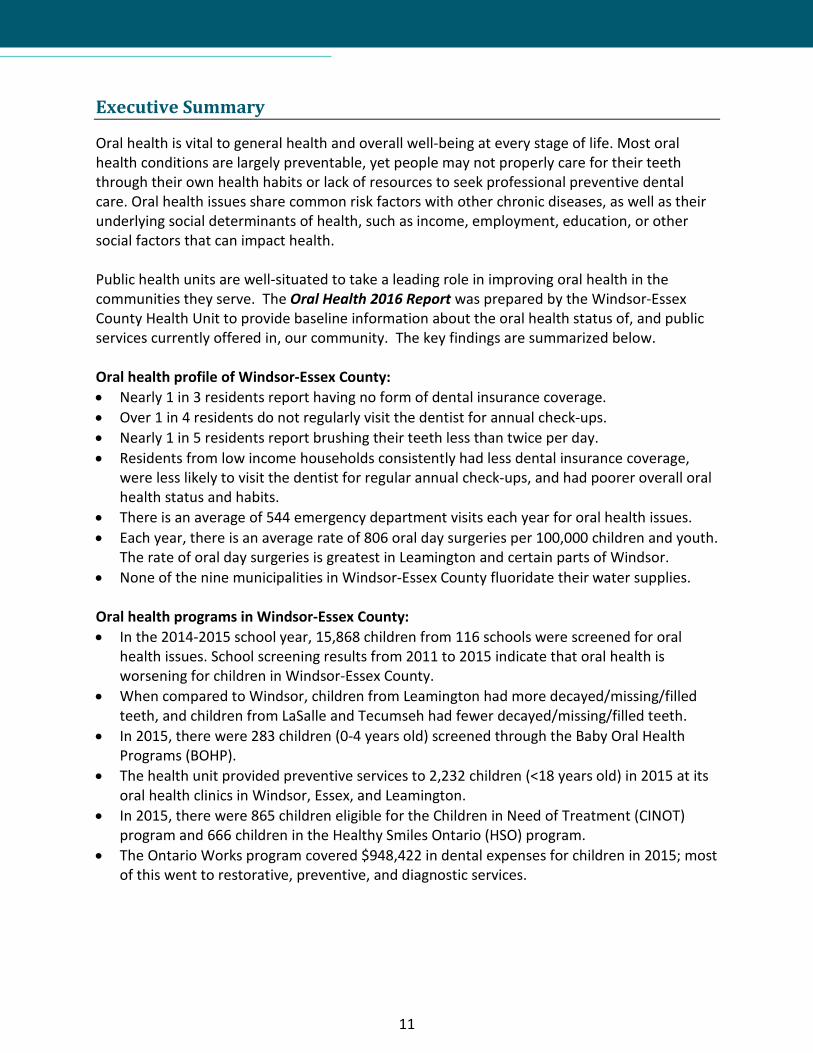
Each child is provided a BOHP kit (see Figure 15), which consists of a bag that looks like a bunny rabbit and contains:
• Oral Health education resource • Pamphlets on brushing and flossing • Tooth eruption magnet that tells parent when to expect baby teeth and when
they fall out • Toothbrush • Infant finger brush
Information about the program has been shared with parents and a variety of other service providers and primary care professionals, including all dentists, most doctors/walk-in-clinics,

42
nurse practitioners, recreation centres, Ontario Early Years Centres, child care centres, children’s consignment stores, and the midwives of Windsor. This information has been disseminated through flyers, posters, news releases, and social media. In fact, during Oral Health Month in April 2015, social media was used as part of a larger promotional strategy for the Baby Oral Health Program.
When the BOHP launched in 2014 there were 12 children (0-4 years old) screened through this program. In 2015, there were 283 children (0-4 years old) screened through the BOHP in Windsor-Essex County. Figure 15. The kit distributed to children in the Baby Oral Health Program.

43
Financial Assistance Programs In Ontario, there are relatively few oral health programs that are available to those who cannot afford them. The majority of these programs are for children 17 years old and under. In Windsor-Essex County, like most communities across the province, there are an exceptionally limited number of programs for adults. The available programs and their eligibility requirements are listed below. Children in Need of Treatment Program (CINOT) CINOT is a provincially and municipally funded program for children in need of treatment. These children are identified through dental screening programs at schools or at other oral health screening programs in the community (e.g., Ontario Early Years Centres). This program is administered in accordance with the Children In Need Of Treatment (CINOT) Program Protocol (Ontario Ministry of Health and Long-term Care, 2008). To be eligible and a child must meet certain criteria:
• The child does not have any dental insurance and; • The parent/guardian signs a written declaration that the cost of dental treatment would
result in financial hardship and; • The child must have an urgent dental need requiring treatment.
The number of CINOT eligible children in Windsor-Essex County is reported in Table 13 by calendar year. The average annual number of CINOT eligible children presenting to the oral health clinics in the City of Windsor and the County of Essex were 696 and 369, respectively. Although fewer children are being screened and there are less CINOT eligible children, the total proportion of CINOT eligible children has remained constant from 2012 to 2015. Table 13. The number of children eligible for the Children In Need of Treatment (CINOT) program presenting to the Windsor, Essex, and Leamington oral health clinics (2011-2015).
Year Number of Children Screened Number of CINOT Eligible
Children (%) Total
CINOT Eligible
Children
Total Cost of CINOT
Treatments Windsor Essex Leam-ington Windsor Essex Leam-
ington
2011 2122 297 1106 935 (44%)
91 (31%)
435 (39%)
1461 (41%) $810,503
2012 1338 140 671 685 (51%)
55 (39%)
359 (54%)
1099 (51%) $676,729
2013 1348 65 593 706 (52%)
32 (49%)
265 (45%)
1003 (50%) $694,628
2014 1205 55 564 608 (50%)
20 (36%)
269 (48%)
897 (49%) $701,376
2015 1082 117 543 547 (51%)
38 (32%)
280 (52%)
865 (50%) $703,915
Source: Internal records, Windsor-Essex County Health Unit.

44
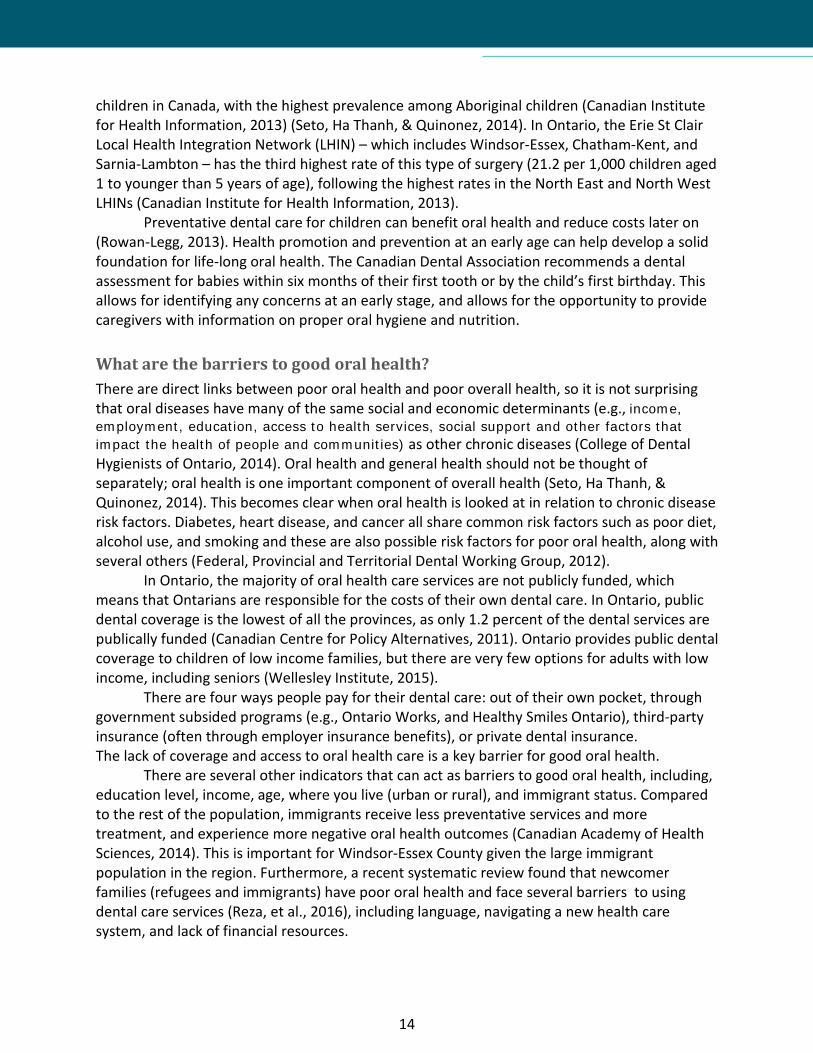
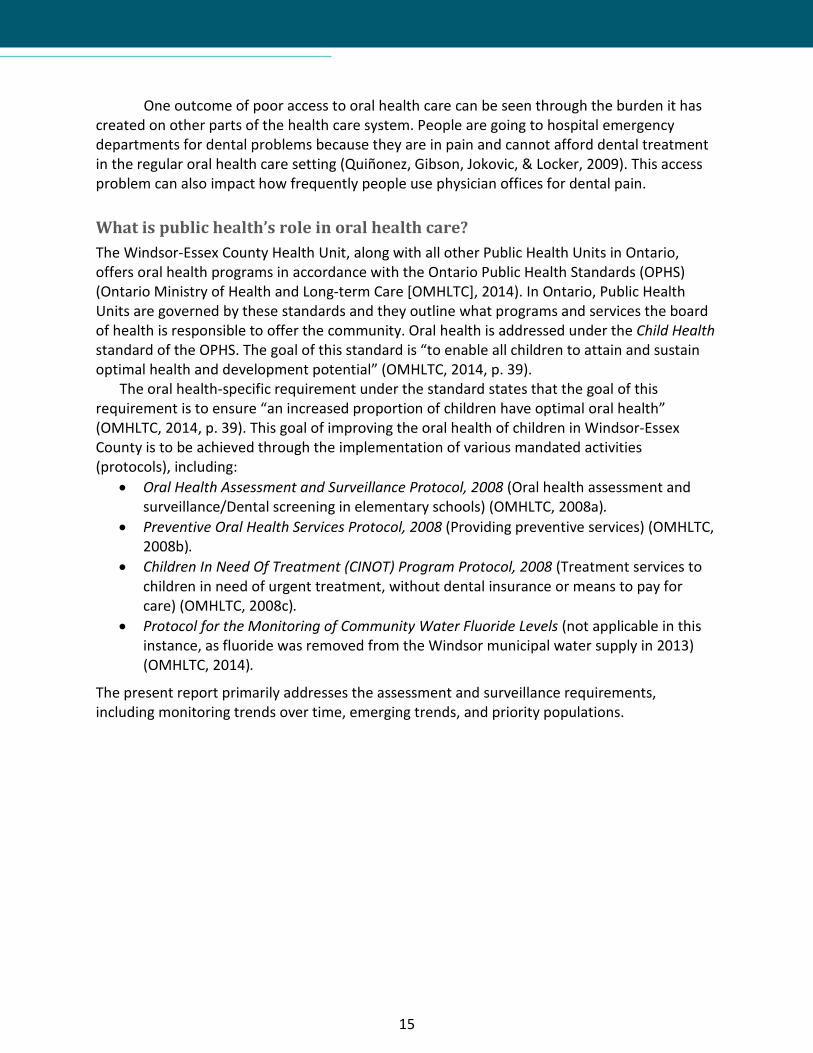
Healthy Smiles Ontario Program (HSO) The HSO program is available to children 17 years of age and under who do not have access to any form of dental coverage and whose parents have limited incomes. This program offers some preventive and restorative dental coverage for eligible children. The HSO program includes check-ups, cleanings, and x-rays. From 2011 to 2015, there has been a 6-fold increase in the number of children receiving HSO treatments (see Figure 16) and a 3-fold increase in the total cost of HSO treatments (see Figure 17). Figure 16. Number of children receiving treatment by either a dental hygienist (RDH) or dentist (DDS) through the Health Smiles Ontario (HSO) program in Windsor-Essex County (2011-2015).
Source: Internal records, Windsor-Essex County Health Unit. Figure 17. The total cost of treatments in the Health Smiles Ontario (HSO) program, Windsor-Essex County (2011-2015).
Source: Internal records, Windsor-Essex County Health Unit.
2011 2012 2013 2014 2015RDH 67 104 201 243 354DDS 41 110 245 286 312
0
50
100
150
200
250
300
350
400
Num
ber o
f chi
ldre
n in
HSO
$140,565
$246,258 $281,781
$345,037
$469,014
$0
$100,000
$200,000
$300,000
$400,000
$500,000
$600,000
2011 2012 2013 2014 2015
Tota
l Cos
t of H
SO T
reat
men
ts

45
Ontario Works (OW) Child Dental Services These services are provided to children 17 years of age and under who have parents receiving OW benefits. The services that are covered under this program include basic dental care and preventative services. This program is administered by the City of Windsor for Windsor and Essex County residents; the amount paid locally through OW is shown in Figure 18 and these costs are broken down in Figure 19. The total amount paid through OW for oral health services for Windsor-Essex County children has increased by 17.5% since 2010; 64% of this increase is attributed to increases in restorative and preventive services. Forty-one percent of OW payments were for restorative services and 19.3% were for preventive services. These figures highlight the fact that children are getting help in the latter stages rather than monies being spent early to prevent these problems. Figure 18. The total amount paid through Ontario Works for oral health services children (<18 years old) in Windsor-Essex County (2010-2014).
Source: Employment and Social Services, the Corporation of the City of Windsor.
2010 2011 2012 2013 2014Total $807,719 $874,655 $884,992 $877,662 $948,422
$700,000
$750,000
$800,000
$850,000
$900,000
$950,000
$1,000,000
Tota
l am
ount
pai
d ($
)

46
Figure 19. The total amount paid by category through Ontario Works for oral health services for children (<18 years old) in Windsor-Essex County (2010-2014).
Source: Employment and Social Services, the Corporation of the City of Windsor. Services for Adults and Seniors There are very few publically funded programs available to adults, including seniors, in Ontario. Ontario Works offers services to some adults, but it is limited to very basic dental services (which are at the discretion of the municipality that funds these programs).
In Windsor-Essex County there are two options available for adults and seniors who do not have insurance or the resources to pay for dental services. St. Clair College offers full mouth scaling by dental hygiene students. The college offers a limited set of other basic dental care services, including fluoride treatment and sealants, for a nominal fee of $25 for adults or $20 for seniors. A second program offering basic dental service is Street Heath, a program of the Windsor Essex County Health Centre. They offer assessments, cleaning, and basic extractions for clients that demonstrate they do not have the financial means to pay for these services. Other Programs for Children and Adults There are a few other publically funded oral health programs for children and youth. These include the Ontario Disability Support Program and the Assistance for Children with Severe Disabilities Program. For adults, Operation Smile is one example of some additional services that are available in the community. It is an event that is hosted by the Essex County Dental Society, in partnership with the St Clair College dental clinic. The event is designed to promote oral health in the community and offers basic restorative and surgical services to people that might not otherwise have access to such services.
Diagnostic Preventive Restorative Endodontics Oral & MaxSurgery
AdjunctiveGen Services
2010 $153,697 $143,061 $342,315 $35,942 $71,116 $61,2842011 $162,889 $158,528 $353,591 $31,743 $98,458 $69,0812012 $168,345 $159,872 $362,831 $32,854 $93,118 $67,4312013 $159,710 $167,818 $358,162 $34,639 $86,424 $69,6492014 $170,581 $183,348 $392,796 $34,633 $95,883 $70,203
$0
$100,000
$200,000
$300,000
$400,000
$500,000
Amou
nt P
aid
by O
ntar
io W
orks

47
Health Promotion Activities Health promotion strategies to improve oral health go beyond traditional education to include strategies such as developing strong community partnerships, reorienting health care systems, and developing healthy public policies (Ontario Association of Public Health Dentistry, 2007). Community Events and Workshops Each year many different types of events take place in a variety of settings that provide an excellent opportunity to connect with those in our community. Child health fairs, Ontario Early Years Centers, JK registration events, and Building Blocks to Better Babies clinics, are just a few of the examples where the health unit’s dental teams are able to connect with parents and their young children, to access and discuss their child’s oral health. “Calling All 2 and 3 Year Olds” These developmental health and wellness fairs are held at several locations in WEC. Parents are encouraged to bring their children for free developmental screening, dental screening, hearing consultation, vision information, behaviour consultation, nutrition screening, and speech consultation. The most visited service at these events was dental screening: 55% of children attending the event visited the dental booth. Of those screened, 16% got a referral, 37% required a follow-up, and 21% required a consultation. Furthermore, health fairs were held at the New Canadian Centre of Excellence with the purpose of screening new Canadian children for oral health issues as these individuals tend to experience severe health inequities. Dentistry’s Role in Identifying and Reporting Abuse In Canada, all health care professionals are required to report suspected cases of abuse of children, adults, or seniors, that are under their care. Oral health professionals are required to report dental neglect in accordance with Section 72 (1) of the Family and Child Services Act (Ontario Ministry of Community and Social Services, 2014). Unfortunately, some barriers prevent abuse from being reported. One of these barriers is lack of training for health professionals in identifying and recognizing abuse. It is essential that dental health professionals are able to recognize signs and symptoms and know how to report these situations in our community.
Recently, the Windsor-Essex County Health Unit, St Clair College, Windsor-Essex Children`s Aid Society, Windsor-Essex County Dental Hygienist’s Society and Windsor Police Services partnered to provide an educational workshop to help dental health professionals, police services, and children protection workers identify and report abuse. This workshop was presented by Dr. Frank Stechey, an internationally recognized expert in forensic and sports dentistry. This workshop looked at the provincial and federal mandates for all health care professionals on reporting suspected abuse; how to document suspicious injuries; and where to report suspected assault/abuse in our community. There were several hundred in attendance at two separate events. The feedback was very positive, with 94% reporting an interest in further training in this area.

48
Community Partnerships and Intersectoral Collaboration Dental programs can be more effective when they are implemented with collaboration from other key community partners. Social determinants of oral health are often factors outside the influence of oral health professionals, so in order to impact these factors we must work in partnership with other community stakeholders (Canadian Academy of Health Sciences, 2014). This section of the report will describe some of our community partnerships and intersectoral collaborations. Windsor Essex Fluoride Varnish Pilot Project (WEFVPP) Primary care professionals (PCPs), such as nurses and physicians, can play an important role in preventing cavities and other oral health issues (Seto, Ha Thanh, & Quinonez, 2014). PCPs usually see children several times prior to their first dental visit, and this offers an opportunity for implementing early-stage preventive oral care and education.
Children are seen at regular intervals in the first year of life at well-baby visits and regularly after that. At these visits a child can be screened for tooth decay and the caregiver can be provided with nutritional and oral health guidance. A PCP can also apply fluoride varnish, which is a protective coating that is applied to a child’s teeth. The varnish application only takes a few minutes to apply and is flavoured.
The Windsor Essex Fluoride Varnish Pilot Project (WEFVPP) provides an excellent opportunity for PCPs in Windsor-Essex County to become involved in the delivery of evidence-based preventive oral healthcare. This program is adapted from the well-designed and successful program created by Niagara Region Public Health. The main purpose of the WEFVPP is to assess the feasibility and short-term impacts of applying fluoride varnish to children (less than 6 years old), in a primary care setting. There are 9 participating sites, including Family Health Teams, Community Health Centres, and Nurse-Led Practitioner clinics. The pilot will run from February 2016 to October 2016. This pilot project is funded, in part, by the Windsor-Essex Community Foundation with in-kind support from the Windsor-Essex County Health Unit. Preventive Services at Chatham-Kent Area School For the past two years the Oral Health Department has partnered with Chatham-Kent Public Health Unit’s dental program to offer preventive services to a Low German school in Chatham-Kent. Many of the children attending this private Mennonite school live in Essex County. These students were provided scaling, topical fluoride, PFS, and education about proper oral hygiene. The health unit was pleased to work in partnership with Chatham-Kent to provide these services, as it allows for a broader professional network of those in public health that offer a range of services to Low German residents in several communities in Southwestern Ontario. Flossophy Newsletter Regular communication with the dental community in Windsor and Essex County is an important strategy to indirectly serve the residents and families in our region. The Flossophy newsletter is one way we can reach out to other dental professions in our community and is a positive channel for communication to inform the local dental community of recent and timely developments within dental public health. The newsletter is mailed out at least twice a year by
49
the health unit to all dental offices in Windsor-Essex County. It provides communication about upcoming workshops in the community and any resources that are available to dental offices. St Clair College Dental Program Training dental professionals is an important part of developing a good oral health care system for our communities. Public health dentistry is a speciality and is unique because it serves the community as the “client”, rather than the individual. It focuses on preventing and managing dental diseases and promoting oral health through organized community efforts (Americian Dental Association, 2016).
St. Clair College offers both a Dental Hygiene and Dental Assisting program. The health unit partners with the college in a variety of ways. Each year the health unit provides dental students with an orientation to dental public health, and various opportunities to job shadow our dental teams as they conduct school screening and other clinics. We are part of a Program Advisory Committee which provides input into the curriculum developed for the college’s dental programs. The health unit has also loaned our portable equipment to help dental hygiene students in their work with seniors in long-term care facilities. Oral Health and Education Advisory Group This advisory committee was initially formed after the City of Windsor decided that the savings from ceasing community water fluoridation be redirected to oral and nutrition education in Windsor and Essex County for a period of 5 years.
This committee is made up of City Administration, and representatives of the Windsor-Essex County Health Unit, Essex County Dental Society, Ontario Dental Hygienists Association, St. Clair College Dental Program, and Family Services Windsor Essex.
The Advisory Committee has identified key potential audiences for nutritional and oral health programs. The health unit has worked with the advisory committee to identify appropriate targets based on the surveillance data from our community and other evidence-based practices. The proposed target groups include children (0-3 years old), low income households, the homeless, new mothers, seniors, immigrants, and non-English speaking residents.
Baby Oral Health programming will be the focus for 2016, and will include resource packages for new mothers, a health communication strategy to reach key stakeholders (e.g., early childhood educators, pediatricians, and dental professionals) and a professional development opportunity for dental professionals to gain a clear recognition of the value of early intervention in oral health care. Youth Tobacco Prevention Dental Project There is current research that shows that face-to-face interaction with a healthcare provider and providing print materials to youth can reduce the risk of smoking initiation among children and youth (Moyer, 2013). This pilot project was conducted in Southwestern Ontario, as a partnership between public health units and local dentists. The project ran from April, 2015 to July, 2015 to test the usefulness of using prevention and cessation resources with high school-aged youth in dental settings. These resources included magnets, posters, and booklets to engage this population (See Appendix C).

50
Oral Health Clinic Survey: Windsor-Essex County Health Unit
Purpose of the Survey Parents' dental health habits and oral health-related knowledge and attitudes can influence their children’s oral health (Castilho, Mialhe, Barbosa, & Puppin-Rontani, 2013). Oral health education programs that target preventive actions, such as brushing habits, and eating patterns can have significant effects on oral health outcomes (Arrow, Raheb, & Miller, 2013; Bozorgmehr, Hajizamani, & Malek, 2013). In order to assess caregiver’s knowledge, attitudes and behaviour relating to brushing habits, cavities, baby teeth, and fluoride, the Oral Health Clinic Survey was developed.
This survey was then administered to caregivers that attended one of the three dental clinics of the Windsor Essex County Health Unit, between June and July, 2015. The survey was conducted to explore the characteristics and demographics of the clients seen in the clinics. The goal of conducting the survey was to assess what client’s needs were in terms of services, if there were knowledge gaps relating to good oral health habits, or barriers to accessing dental services.
Respondent Demographics The demographics of the primary caregiver who accessed the oral health clinic at the Windsor-Essex County Health Unit on behalf of their child in 2015 are reported in Table 14. The average household size of the primary caregivers (4.9 people per household) was larger than the Windsor-Essex County average of 3.0 individuals per household unit. The caregivers also had higher educational achievement (67% report having a post-secondary education) than the Windsor-Essex County population (58% report having a post-secondary education). Just under 50% of primary caregivers report English as the language they speak most often at home; Arabic, German, Urdu, and Chinese collectively accounted for 34% of non-official languages commonly spoken at home. Only 16% of caregivers were new immigrants (1-5 year residency) while 65% indicated living in Canada for 10 or more years; the average length of residency was 17 years.

51
Table 14. The demographics of the primary caregivers whose child accessed the oral health clinic at the Windsor-Essex County Health Unit, 2015.
Source: Oral Health Clinic Survey [2015], Windsor-Essex County Health Unit.
Demographics n % Age of caregiver completing survey
20-29 11 10.3% 30-39 55 51.4% 40-49 35 32.7% ≥50 5 4.7% Average age 37.8 -
Household size 2-3 17 15.9% 4-5 59 55.1% 6-7 23 21.5% ≥8 8 7.5% Average household size 4.9 -
Education Less than high school 12 11.2% High school 23 21.5% Post-Secondary 72 67.3%
Language spoken most often at home English 50 46.7% Arabic 11 10.3% German 10 9.3% Urdu 8 7.5% Chinese 7 6.5% Other language 20 18.7%
Canadian residency of primary caregiver (years) 1-5 years 18 16.8% 6-10 years 17 15.9% 11-15 years 21 19.6% 16-20 years 12 11.2% ≥21 years 37 34.6% Average residency 17.4 -
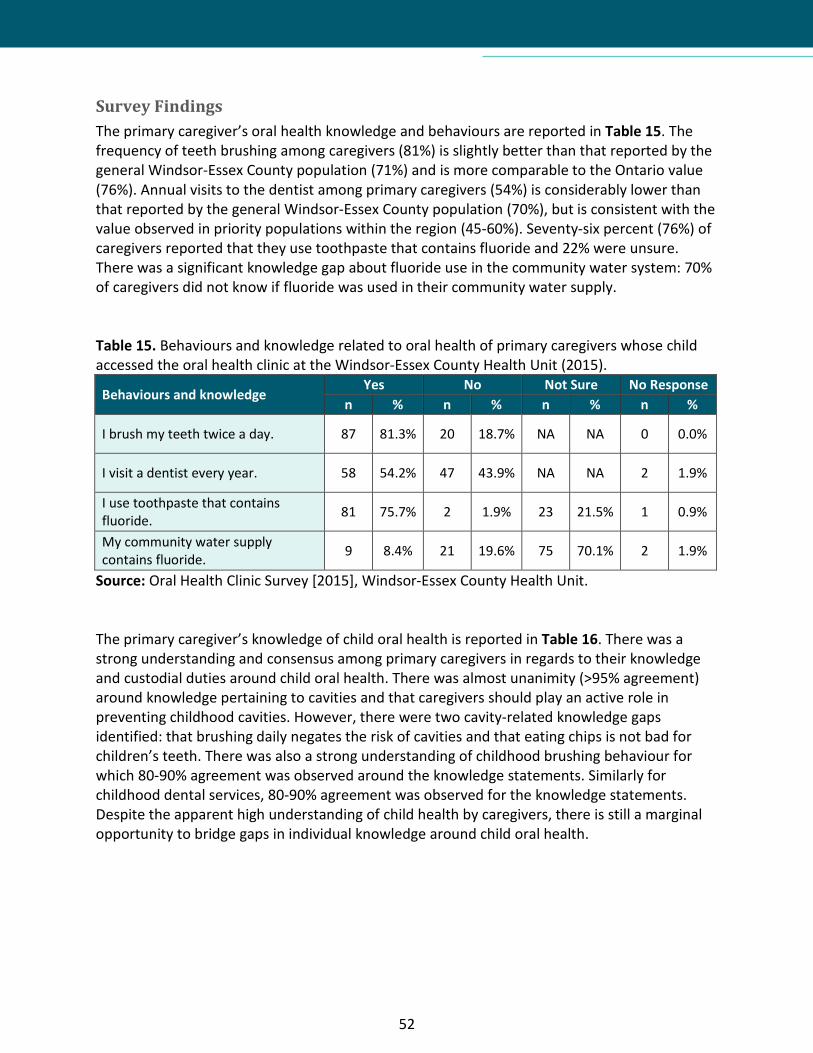
52
Survey Findings The primary caregiver’s oral health knowledge and behaviours are reported in Table 15. The frequency of teeth brushing among caregivers (81%) is slightly better than that reported by the general Windsor-Essex County population (71%) and is more comparable to the Ontario value (76%). Annual visits to the dentist among primary caregivers (54%) is considerably lower than that reported by the general Windsor-Essex County population (70%), but is consistent with the value observed in priority populations within the region (45-60%). Seventy-six percent (76%) of caregivers reported that they use toothpaste that contains fluoride and 22% were unsure. There was a significant knowledge gap about fluoride use in the community water system: 70% of caregivers did not know if fluoride was used in their community water supply. Table 15. Behaviours and knowledge related to oral health of primary caregivers whose child accessed the oral health clinic at the Windsor-Essex County Health Unit (2015).
Behaviours and knowledge Yes No Not Sure No Response n % n % n % n %
I brush my teeth twice a day. 87 81.3% 20 18.7% NA NA 0 0.0%
I visit a dentist every year. 58 54.2% 47 43.9% NA NA 2 1.9%
I use toothpaste that contains fluoride. 81 75.7% 2 1.9% 23 21.5% 1 0.9%
My community water supply contains fluoride. 9 8.4% 21 19.6% 75 70.1% 2 1.9%
Source: Oral Health Clinic Survey [2015], Windsor-Essex County Health Unit. The primary caregiver’s knowledge of child oral health is reported in Table 16. There was a strong understanding and consensus among primary caregivers in regards to their knowledge and custodial duties around child oral health. There was almost unanimity (>95% agreement) around knowledge pertaining to cavities and that caregivers should play an active role in preventing childhood cavities. However, there were two cavity-related knowledge gaps identified: that brushing daily negates the risk of cavities and that eating chips is not bad for children’s teeth. There was also a strong understanding of childhood brushing behaviour for which 80-90% agreement was observed around the knowledge statements. Similarly for childhood dental services, 80-90% agreement was observed for the knowledge statements. Despite the apparent high understanding of child health by caregivers, there is still a marginal opportunity to bridge gaps in individual knowledge around child oral health.

53
Table 16. Knowledge related to child oral health of primary caregivers whose child accessed the oral health clinic at the Windsor-Essex County Health Unit (2015).
Primary caregiver's knowledge of child oral health
Strongly Disagree Disagree Agree Strongly
Agree No
Response n % n % n % n % n %
Cavities Cavities can affect my child's health. 3 2.8% 1 0.9% 38 35.5% 65 60.7% 0 0.0% Cavities are a serious problem in baby teeth. 2 1.9% 3 2.8% 47 43.9% 55 51.4% 0 0.0%
It is important that I check my child's teeth for cavities. 2 1.9% 1 0.9% 52 48.6% 50 46.7% 2 1.9%
My child may get cavities even though they brush daily. 5 4.7% 25 23.4% 62 57.9% 13 12.1% 2 1.9%
It is my duty to help my child lower the risk of getting cavities. 0 0.0% 3 2.8% 47 43.9% 57 53.3% 0 0.0%
Childhood cavities can be prevented by reducing sugary foods and drinks between meals.
3 2.8% 2 1.9% 40 37.4% 61 57.0% 1 0.9%
Eating chips is bad for my child's teeth. 4 3.7% 26 24.3% 46 43.0% 26 24.3% 5 4.7%
Drinking pop is bad for my child's teeth. 7 6.5% 4 3.7% 35 32.7% 57 53.3% 4 3.7%
Brushing A child should be able to brush their own teeth by age 6. 3 2.8% 16 15.0% 58 54.2% 28 26.2% 2 1.9%
My child's teeth should be brushed twice daily; in the morning and before bed.
1 0.9% 5 4.7% 41 38.3% 59 55.1% 1 0.9%
It is best for a child to use a toothpaste with fluoride. 2 1.9% 13 12.1% 52 48.6% 36 33.6% 4 3.7%
If my child uses fluoride toothpaste, it will prevent cavities. 1 0.9% 16 15.0% 60 56.1% 25 23.4% 5 4.7%
It's okay to share a toothbrush with my child. 78 72.9% 18 16.8% 4 3.7% 7 6.5% 0 0.0%
Dental services A child should have their teeth checked by a dentist by age 1. 1 0.9% 9 8.4% 59 55.1% 36 33.6% 2 1.9%
There's no need to go to the dentist unless my child has a problem with their teeth.
32 29.9% 53 49.5% 14 13.1% 8 7.5% 0 0.0%
Baby teeth are not that important because they fall out. 49 45.8% 45 42.1% 8 7.5% 5 4.7% 0 0.0%
Source: Oral Health Clinic Survey [2015], Windsor-Essex County Health Unit.

54
The primary caregiver’s accessibility to dental services is reported in Table 17. The primary reason for visiting the oral health clinic at the Windsor-Essex County Health Unit was for a check-up (43%). Of the children attending the oral health clinic, 44% do not have a family dentist; the main reasons being no dental insurance (29%) and high cost of care (20%). In regards to accessing dental information, 75% indicated an interest for more dental hygiene information; specifically, the majority (57%) wanted information on accessing free dental programs. The most desired way to receive dental information was through brochures or pamphlets (60%) and the internet/website (45%). Fifty percent of the caregivers did not want the information translated into a language they could better understand, but 39% would like this offered. Table 17. Accessibility to dental services and oral health information for primary caregivers whose child accessed the oral health clinic at the Windsor-Essex County Health Unit (2015). Access to dental services and oral health information n % Main reason for visiting the oral health clinic today
School follow-up visit 10 9.3% Baby Oral Health Program 13 12.1% Checkup 46 43.0% Tooth ache or cavity 17 15.9% Cleaning 8 7.5% Other unspecified 8 7.5% No response 2 1.9%
Does your child have a family dentist Yes 60 56.1% No 47 43.9%
Reasons for not having a family dentist Fear of the dentist 1 0.9% Hard to get to the office 7 6.5% High cost of care 21 19.6% No dental office nearby 3 2.8% No dental insurance or no dental plan 31 29.0% Other unspecified 11 10.3%
I would like to have more information about dental hygiene for my child Yes 80 74.8% No 22 20.6% No response 5 4.7%
I would like more information on the following Accessing free dental programs 61 57.0% Brushing and flossing 49 45.8% Foods to avoid 45 42.1% Healthy diet 35 32.7%

55
Access to dental services and oral health information n % Which way would you like to get dental information
Brochures or pamphlets 64 59.8% Educational programs 40 37.4% Internet or website 48 44.9% Radio 8 7.5% Television 19 17.8% Workshops 17 15.9%
I would like to have the information translated into the language I speak at home Yes 42 39.3% No 53 49.5% No response 12 11.2%
Source: Oral Health Clinic Survey [2015], Windsor-Essex County Health Unit. In conclusion, the results of this evaluative survey demonstrate that there are still opportunities to inform and educate caregivers about proper oral health behaviours and habits for their children; a large proportion of caregivers indicated that they would like to receive more information related to brushing, flossing, and diet. It also highlights some important barriers to accessing oral healthcare, including lack of a family dentist, lack of dental insurance coverage, and the high cost of care. Caregivers accessing the health unit’s oral health clinic were primarily interested in more information on accessing free dental programs and receiving dental information (brochures, pamphlets, websites) that are translated into other languages.
56
Recommendations and Conclusions
Based on the data and analysis, the Windsor-Essex County Health Unit proposes the following recommendations for future actions, with our community partners, to improve the oral health status and access to oral health care:
1. Promote and support policies for residents of Windsor-Essex County to have access to community water fluoridation and advocate for provincial coordination regarding the provision of community water fluoridation.
2. Integrate oral health education into relevant Windsor-Essex County Health Unit programs and community-based programs, such as healthy eating, chronic disease prevention, tobacco cessation, and programs for expecting or new parents.
3. Continue to provide oral health screenings for preschool and nursery programs, and look at the feasibility of expanding these services to include brushing programs and policies, recognizing that at this age it is important to start good oral health habits for life
4. Offer a range of preventive services in schools with children at higher risk of dental disease. The services may include: daily brushing programs; fluoride varnish application; fluoride mouth rinse programs; dental sealants; scaling; oral health education; and oral health promotion.
5. Conduct a promotional campaign to educate targeted sectors of the public and health professionals about the importance of good oral health and its link to good overall health.
6. Continue work with inter-professional collaborations (public health, oral health professionals and primary care practitioners) to implement early-stage preventive oral care and education.
7. Support advocacy strategies and collaborate with community partners to expand oral health outreach programs to increase the availability of oral health care and information to vulnerable populations.
8. Advocate for improved collection of data on oral health needs and services in Ontario and nationally, to better support evidence-based decision making in oral health care programming.
The results of this report allow us to draw several conclusions about the oral health status of residents in Windsor-Essex County. In general, children in Windsor and Essex County appear to have greater oral health needs when compared to children in Ontario, and the oral health status of this population has worsened over the time period examined by this report. In addition, many adults and seniors lack access to any form of dental services.
These critical findings demonstrate the significant need to expand programming and advocacy activities to prevent poor oral health in our region. This report provides direction on identifying priority areas and developing specific plans. The Windsor-Essex County Health Unit can play a key role in collaborating with community partners to move this work forward.

57
Appendix A: Oral Health Core Indicators
Supplementary Table 1. Core indicators for the oral health of children and youth as identified by the Association of Public Health Epidemiologists in Ontario. Name Definition Method OHISS1
deft/DMFT index
The proportion of the number of teeth decayed, missing/extracted or filled to the total number of teeth examined in kindergarten children.
Numerator: number of decayed, missing, extracted, or filled teeth in kindergarten children.
DMF Total (DMF Details Report, JK)
Denominator: total number of teeth examined in kindergarten children.
Total screened (DMF Report, JK)
Caries-free children
The proportion of the children at school entry who have never had any cavities.
Numerator: total number of children at school entry who have never had a cavity.
DMF=0 (DMF Report, JK)
Denominator: total number of kindergarten children surveyed.
Total screened (DMF Report, JK)
Children with urgent dental needs
The proportion of children with urgent dental needs.
Numerator: number of children with urgent dental treatment needs.
CUC (SSR, all grades)
Denominator: total number of children examined.
Screened (SSR, all grades)
Children with decay and urgent dental needs
The proportion of children with decay and urgent dental needs.
Numerator: number of children with decay and/or urgent dental treatment needs.
CUC+N-Urg2 (SSR, all grades)
Denominator: total number of children examined.
Screened (SSR, all grades)
Children eligible for CINOT3
The proportion of children eligible for children in need of treatment (CINOT) program.
Numerator: number of children eligible for CINOT.
N/A
Denominator: total number of children examined (from birth to grade 8).
N/A
Children eligible for topical fluorides
The proportion of children eligible for topical fluorides.
Numerator: number of children eligible for topical fluorides.
PATF (SSR, all grades)
Denominator: total number of children examined.
Screened (SSR, all grades)
Children eligible for fissure sealants
The proportion of children eligible for fissure sealants.
Numerator: number of children eligible for fissure sealants.
PFS (SSR, all grades)
Denominator: total number of children examined.
Screened (SSR, all grades)

58
Fluorosis Index
The proportion of the children at school entry who have dental fluorosis.
Numerator: number of children at school entry who have fluorosis.
FL (SSR, JK)
Denominator: total number of kindergarten children surveyed.
Screened (SSR, JK)
Early childhood tooth decay (ECTD)
The proportion of children at school entry (kindergarten) who have decayed, missing/extracted or filled teeth consistent with the pattern of ECTD to the total number of teeth examined among children.
Numerator: number of school entry (kindergarten) children with ECTD.
N/A
Denominator: total number of kindergarten children examined.
N/A
Source: Core Indicators, Association of Public Health Epidemiologists in Ontario (Updated August 2014), Accessed November 2015 (http://core.apheo.ca/index.php?pid=55). SSR – Screening Summary Report 1Field name on report (name of report). 2Assumption: non-urgent decay. 3Available through internal records only.
59
Appendix B: Community Water Fluoridation Statement
The Windsor-Essex County Health Unit’s Board of Directors recommends that the Province of Ontario amend the regulations of the Safe Drinking Water Act to require community water fluoridation for all municipal water systems (when source-water levels are below the Health Canada recommended level of 0.7 mg/L) to prevent dental caries (tooth decay) and provide the funding and support to municipalities required.
• Community Water fluoridation promotes good (oral) health and the relationship between poor oral health and poor physical and mental health is clear.
• Community Water fluoridation is essential to minimize tooth decay, and help to restore and strengthen tooth enamel.
• Community Water fluoridation is recognized as the single most effective public health measure to prevent tooth decay.
• Those in lower socio-economic status (SES) are at higher risk for poor health and oral health.
• Community Water fluoridation is about equity. It is the most economical way to benefits all residents in the community irrespective of their SES, education or employment status.
• Most oral health services in Ontario are at a cost to our residents and favour those who can afford to pay.
• Global Health experts (World Health Organization, Centers for Disease Control, Health Canada) and scientific evidences support community water fluoridation to prevent tooth decay.
• When fluoride is added to the water at the recommended levels, studies have shown there is no link to negative health outcomes.
• For every $1 of spending on community water fluoridation, $38 is saved in future dental treatment.
• Fluorosis (a cosmetic alteration of the appearance of the tooth enamel) is associated only with areas that have exceeded the recommended concentration of fluoride in the drinking water.
• Research has shown declines in tooth decay where community water fluoridation has been introduced.

60
Appendix C: Youth Tobacco Prevention Dental Project
61
References
Americian Dental Association. (2016). Definitions of Recognized Dental Specialties. Retrieved Febuary 27, 2016, from Specialty Definitions: http://www.ada.org/en/education-careers/careers-in-dentistry/dental-specialties/specialty-definitions
Arrow, P., Raheb, J., & Miller, M. (2013). Breief Oral Health Promotion Intervention Aamong Parents of Young Children to Reduce Early Childhood Dental Decay. BMC Public Health, 13(1), p. 245.
Bozorgmehr, E., Hajizamani, A., & Malek, M. (2013). Oral Health Behaviour of parents as a predictor of oral health status of their children. ISRN Dentistry, pp. 1-5.
Canadian Academy of Health Sciences. (2014). Improving Access to Oral Health Care: For Vulnerable People Living in Canada. Retrieved from http://cahs-acss.ca/wp-content/uploads/2015/07/Access_to_Oral_Care_FINAL_REPORT_EN.pdf
Canadian Centre for Policy Alternatives. (2011). Putting Our Money Where Our Mouth Is: The Future of Dental Care in Canada. Ottawa, ON: CCPA.
Canadian Dental Association. (2010). Retrieved from Position Paper on Access to Oral Health Care for Canadians: http://www.cda-adc.ca/_files/position_statements/accessToCarePaper.pdf
Canadian Institute for Health Information. (2013). Treatment of Preventable Dental Cavities in Preschoolers: A Focus on Day Surgery Under General Anesthesia. Ottawa, ON: CIHI.
Castilho, A., Mialhe, F., Barbosa, T., & Puppin-Rontani, R. (2013). Influence of Family Environment on Children's Oral Health: A Systematic Review. Jornal de Pediatria, 89(2), pp. 116-123.
Centers for Disease Control and Prevention (CDC). (2013). Cost savings of community water fluoridation. Retrieved from Centers for Disease Control and Prevention: http://www.cdc.gov/fluoridation/factsheets/cost.htm
College of Dental Hygienists of Ontario. (2014). Review of Oral Health Services in Ontario. Retrieved from http://www.cdho.org/otherdocuments/OHSReview.pdf
Federal, Provincial and Territorial Dental Working Group. (2012). Reducing Dental Disease: A Canadian Oral Health Framework 2013-2018. Retrieved from https://www.caphd.ca/sites/default/files/FrameworkOctober%202014%20-%20FINAL%20English.pdf
Health Canada. (2010). Summary Report on the Findings of the Oral Health Component of the Canadian Health Measures Survey 2007–2009. Retrieved from http://www.fptdwg.ca/index_htm_files/CHMS-E-summ.pdf
Heldman, A., Schindelar, J., & Weaver, J. (2013). Social media engagement and public health communication: implications for public healthorganizations being truly "social'. Public Health Reviews, 35.
62
Iheozor-Ejiofor, Z., Worthington, H., Walsh, T., O’Malley, L., Clarkson, J., Macey, R., et al. (2015). Water fluoridation for the prevention of dental caries (Review). Cochrane Library.
Maund. (2014). Information on Hospital Emergency Room Visits for Dental Programs.
Maund, J. (2014). Information on Physician Visits for Dental Problems in Ontario. Retrieved from http://aohc.org/Information-Physician-Visits-Dental-Problems-Ontario
Ministry of Health and Long-Term Care. (2012). Oral Health: More Than Just Cavities. Retrieved from http://www.health.gov.on.ca/en/common/ministry/publications/reports/oral_health/oral_health.pdf
Moyer, V. (2013). Primary Care Interventions to Prevent Tobacco Use in Children and Adolescents: U.S. Preventive Services Task Force Recommendation Statement. Annals of Internal Medicine, 159(8), pp. 552-557.
Ontario Association of Public Health Dentistry. (2007). Position Statement on Oral Health Promotion. Retrieved from http://www.oaphd.on.ca/images/stories/pdfs/oralhealthpromotion.pdf
Ontario Ministry of Community and Social Services. (2014). Reporting Child Abuse and Neglect: It's Your Duty. Your responsibilities under the Child and Family Services Act. Queen's Printer for Ontario.
Ontario Ministry of Health and Long-term Care. (2008). Children in Need of Treatment (CINOT) Program Protocol. Retrieved from http://www.health.gov.on.ca/en/pro/programs/publichealth/oph_standards/docs/cinot.pdf
Ontario Ministry of Health and Long-term Care. (2008). Oral Health Assessment and Suveillance Protocol. Retrieved from http://www.health.gov.on.ca/en/pro/programs/publichealth/oph_standards/docs/oral_health_assess.pdf
Ontario Ministry of Health and Long-term Care. (2014). Ontario Public Health Standards, 2008. Toronto, ON: Queen's Printer of Ontario.
Ontario Ministry of Health and Long-Term Care. (2014). Protocol for the Monitoring of Community Water Fluoride Levels.
Ontario Ministry of Health and Long-term Care, 2008. (n.d.). Preventive Oral Health Services Protocol. Retrieved from http://www.health.gov.on.ca/en/pro/programs/publichealth/oph_standards/docs/preventive_oral_health.pdf
Ontartio Ministry of Health and Long-Term Care. (2008). Children in Need of Treatment (CINOT) Program Protocol.

63
Petersen, P. (2003). The World Oral Health Report 2003: Continuous improvement of oral health in the 21st century - the approach of the WHO Global Oral Health Program. Geneva, Switzerland: World Health Organization.
Quinonez, C., Figueiroedo, R., & Locker, D. (2011). Disability days in Canada associted with dental problems: A pilot study. International Journal of Dental Hygiene, 9(2), pp. 132-135.
Quiñonez, C., Gibson, D., Jokovic, A., & Locker, D. (2009). Emergency department visits for dental care of nontraumatic origin. Community Dentistry and Oral Epidemiology, 37, 366–371.
Reza, M., Amin, M., Sgro, A., Abdelaziz, A., Ito, D., Main, P., et al. (2016). Retrieved from Oral Health Status of Immigrant and Refugee Children in North America: A Scoping Review: http://www.jcda.ca/g3
Rowan-Legg, A. (2013, January 11). Oral health care for children - a call for action. Paediatric Child Health, 37-43.
Seto, D., Ha Thanh, M., & Quinonez, C. (2014). Brushing Up on Oral Health: Northwest Territories. Nortwest Territories Health and Social Services.
Sun, B., & Chi, C. (2014). Retrieved from Emergency Department Visits for Non-Traumatic Dental Problems in Oregon State: http://www.oregoncf.org/templates/media/files/oral_health_funders_collaborative/dental-report-final.pdf
Wellesley Institute. (2015). Retrieved from Low Wages, No Benefits: Expanding Access to Health Benefits for Low Income Ontarians: http://www.wellesleyinstitute.com/wp-content/uploads/2015/02/Low-Wages-No-Benefits-Wellesley-Institute-Feb-2015.pdf
Wellsley Institute. (2013). The Real Cost of Removing Water Fluoridation. Toronto, Ontario: Wellsley Institute.
World Health Organization. (2006). Fluoride in Drinking-Water. London: IWA Publishing.

64

WINDSOR-ESSEX COUNTY HEALTH UNIT
1005 Ouellette Avenue Windsor, Ontario N9A 4J8 www.wechu.org 519-258-2146
© Windsor-Essex County Health Unit, April 2016.