orange cde · library and serving as chaperones on fieldtrips ... weekly academic support for their...
TRANSCRIPT

2012-13 School Accountability Report Card — Published During the 2013-14 School Year
OCCS: CHEP/PCHSOrange CDE
Principal’s MessageOrange County Community School (OCCS) is the umbrella name for two programs: the Community Home Education Program (CHEP) and Pacific Coast High School (PCHS). Both programs are winners of the Exemplary Independent Study Recognition Award.
CHEP is an independent study program, servicing and supporting parents who wish to teach their grade K-8 children at home or in community based co-op settings. CHEP provides the guidance, sup-port, and assistance of credentialed teachers to parents in lesson planning, teaching strategies, in-dividualized California Standards-based curriculum selection, students’ and teachers’ textbooks, and assessment/evaluation of student achievement. The program provides computer labs at each of its four sites, individual and group tutorials, student and parent activities, workshops, and classes.
CHEP’s Mission: The purpose of the CHEP is to create a partnership between parents, students, teach-ers, and the community that will inspire students in grades K-8 to learn and grow to their potential, equip parents to be the most effective teachers of their children, and provide the community with a viable, public, home-based educational option.
PCHS is Western Association of Schools and Colleges (WASC) accredited and offers a public high school curriculum within a combination home-based and college-style learning format. Operationally, it is a service-oriented high school that is the result of a team effort among the parents, students, faculty, and staff. PCHS offers online courses, on-campus electives, at-home electives, support seminars tied to the curriculum of science and math, computer labs, and UC-approved A-G courses.
PCHS’s Mission: To provide an exemplary public high school for students who are seeking an alterna-tive, challenging, and relevant educational experience. Through technology, online courses, on-campus courses, electives, and a variety of purposeful active learning opportunities, we prepare students for successful futures. Pacific Coast High School offers a safe and supportive environment for the 21st century learner.
School SafetyOCCS utilizes the ACCESS Safe School Plan, and the staff has written individual site safety plans and holds drills monthly at the elementary level. Staff members conduct site inspections on a regular basis.
CHEP: Each site reviews portions of School Safety Plan monthly (therefore, covering the entire plan in a year). The School Safety Plan was last reviewed, updated, and discussed with the school faculty February 2013.
PCHS: The School Safety Plan was last reviewed, updated, and discussed with the school faculty February 2013.
Robert Hammond, 1st District
David L. Boyd, 2nd District
Dr. Ken L. Williams, 3rd District
John W. Bedell, Ph.D, 4th District
Elizabeth Parker, 5th District
Orange County Board of Education
Community Home Education Program (CHEP)
Jane Doney, Principal E-mail: [email protected]
2910 Redhill Avenue, Ste. 200 Costa Mesa, CA 92626 Phone: (714) 327-1000
Grades: TK-8 www.ocde.us/chep/
Pacific Coast High School (PCHS) Machele Kilgore, Principal E-mail: [email protected]
14262 Franklin Avenue, Ste. 100 Tustin, CA 92780
Phone: (714) 245-6500
Grades: 9-12 pchs.k12.ca.us
CDS Code: 30-10306-3030632
Professional DevelopmentProfessional development opportunities are provided throughout the school year for all staff members. We believe in and provide a learning environment for all students, parents, teachers, and staff. PCHS teachers attend weekly and CHEP teachers attend monthly staff meetings that offer support and train-ing to improve their teaching skills. Teachers and support staff are encouraged to attend a plethora of staff development opportunities offered through OCDE and nationally recognized trainers. Professional development has centered in the areas of technology, math, language arts/writing skills, social science, science, and assessment.
Ten school days are dedicated to staff and professional development yearly, including each of the last three years. Additionally, teachers are encouraged to attend one to three professional developments put on by outside agencies/vendors yearly.
Vision Statement
Our students learn in an alternative environment receiving a world class education that ensures their academic and personal success.
Mission Statement
We care for, teach, and inspire all ACCESS students to discover their potential, develop their character, and maximize their learning so that they can become successful contributors to society.
Orange County Department of Education
Al Mijares, Ph.D., Superintendent E-mail: [email protected]
Jeff Hittenberger, Ph.D., Chief Academic Officer
E-mail: [email protected]
200 Kalmus Drive Costa Mesa, CA 92628 Phone: (714) 966-4000
www.ocde.us

2OCCS:CHEP/PCHS • 2012-13 SARC
2012-13 School YearDemographics
Enrollment by Student GroupThe total enrollment at the school was 1,525 students for the 2012-13 school year. The pie chart dis-plays the percentage of students enrolled in each group.
Socioeconomically Disadvantaged 8.30%English Learners 12.60%
Students with Disabilities 0.00%
Hispanic or Latino19.3%
American Indian or Alaska Native
0.6%
Asian17.6%
Native Hawaiian or Pacific Islander
0.4%
Filipino0.5%
Black or African American
2.6%
White50.2%
Two or More Races4.7%
No Response 3.9%
2012-13 Enrollment by Grade
Enrollment by Grade LevelThe bar graph displays the total number of students enrolled in each grade for the 2012-13 school year.
K
1
2
3
4
5
6
7
8
9
10
11
12
121
126
122
117
114
126
95
136
137
89
112
116
116
Three-Year Data ComparisonNumber of Classrooms by Size
10-11 11-12 12-13
Subject 1-22 23-32 33+ 1-22 23-32 33+ 1-22 23-32 33+
English-Language Arts 8 2 4 2 6 9 6
Mathematics 2 1 3 5 1 2 14 3
Science 3 1 1 1 1 4 1
History-Social Science 4 1 1 4 1 4 1
Three-Year Data ComparisonAverage Class Size
Class Size DistributionThe bar graphs display the three-year data for average class size and the table displays the three-year data for the number of classrooms by size.
English-LanguageArts
Mathematics Science History-SocialScience
38 38 38 38
62
4336
2923 21
27 27
10-11 11-12 12-13
“Orange County Community School
(OCCS) is the umbrella name for two programs:
the Community Home Education
Program (CHEP) and Pacific Coast High
School (PCHS).”

3OCCS:CHEP/PCHS • 2012-13 SARC
2012-13 School YearCalifornia Physical Fitness Test
Percentage of Students Meeting Fitness Standards OCCS: CHEP/PCHS
Grade 5 Grade 7 Grade 9
Four of Six Standards 37.80% 26.40% 21.60%
Five of Six Standards 25.50% 35.50% 34%
Six of Six Standards 22.40% 22.70% 16.50%
1. Aerobic Capacity
2. Body Composition
3. Flexibility
4. Abdominal Strength and Endurance
5. Upper Body Strength and Endurance
6. Trunk Extensor Strength and Flexibility
Encouraging and assisting students in establishing lifelong habits of regular physical activity is the primary goal of the Fitnessgram®. The table shows the percentage of students meeting the fitness standards of being in the “healthy fitness zone” for the most recent testing period. For more detailed information on the California PFT, please visit www.cde.ca.gov/ta/tg/pf.
California Physical Fitness TestEach spring, all students in grades 5, 7, and 9 are required to participate in the California Physical Fit-ness Test (PFT). The Fitnessgram® is the designated PFT for students in California public schools put forth by the State Board of Education. The PFT measures six key fitness areas:
Parental InvolvementCHEP
Parents are the catalyst for the CHEP and PCHS programs. The growing number of families in Orange County desiring to educate their children at home under the educational guidance and assistance of the Orange County Department of Education prompted the need and implementation of both programs:
There are a variety of opportunities for family involvement within the two programs.
• Parents and students meet with teachers as often as needed, but meet a minimum of once a month
• Parents may participate in Parent/Teacher Organizations (PTOs)
• Volunteer opportunities include: assisting with theater arts and drama productions, helping in the library and serving as chaperones on fieldtrips
• Parents may teach classes in extracurricular subjects, such as arts and crafts
• Families are invited to attend school events such as the annual Expo which features students’ sci-ence and cultural projects, as well as a student Talent Show
PCHS
Pacific Coast High School (PCHS) is a public high school accredited by the Western Association of Schools and Colleges (WASC) that operates very much like a community college for high school stu-dents. Parent participation and support is important for students’ success. PCHS offers many opportuni-ties for parents to become involved in the school program.
Parents are on campus frequently for impromptu, required, or requested meetings with instructors.
Parents provide weekly academic support for their child by assuring they complete syllabus require-ments and weekly assignments, attend electives, pass required classes, pass science lab require-ments, and pass all on-campus testing.
Parents support off-campus required field trips and student service events by scheduling/providing transportation.
Parents attend college information workshops.
Parents may also support electives on campus, volunteer/assist with drama rehearsals and presenta-tions as well as mock trial competitions, clubs, and student social events.
For more information on how to become involved, contact Principal of CHEP Jane Doney at (714) 327-1000 or Principal of PCHS Machele Kilgore at (714) 245-6500. The Web site contacts are http://chep.ocde.us and http://www.pch.k12.ca.us.
“Parents are the catalyst for the CHEP and PCHS programs.”
Suspension and Expulsion Rates
OCCS: CHEP/PCHS
10-11 11-12 12-13
Suspension Rates 0.0% 0.0% 0.0%
Expulsion Rates 0.0% 0.0% 0.0%
Orange CDE
10-11 11-12 12-13
Suspension Rates 13.0% 2.2% 1.5%
Expulsion Rates 0.0% 0.0% 0.0%
Suspensions and ExpulsionsThis table shows the school and district suspension and expulsion rates for the most recent three-year period. Please note, a new method for calculating sus-pension and expulsion rates was imple-mented starting in the 2011-12 school year – the rates in 2011-12 and beyond cannot be truly compared to previous rates since they are calculated differently.
Public Internet AccessInternet access is available at public libraries and other locations that are publicly accessible (i.e., the California State Library). Access to the Internet at libraries and public locations is generally provided on a first-come, first-served basis. Other use restrictions include the hours of operation, the length of time that a workstation may be used (depending on availability), the types of software programs available at a workstation, and the ability to print documents.

4OCCS:CHEP/PCHS • 2012-13 SARC
Spring 2013 ResultsStudents Scoring at Proficient or Advanced Levels
Group English- Language Arts Mathematics Science History-
Social Science
All Students in the District 32% 36% 30% 17%
All Students at the School 71% 53% 69% 49%
Male 66% 55% 67% 54%
Female 75% 51% 71% 45%
Black or African American 71% 40% 27% v
American Indian or Alaska Native v v v v
Asian 83% 68% 79% 64%
Filipino v v v v
Hispanic or Latino 69% 43% 58% 31%
Native Hawaiian or Pacific Islander v v v v
White 67% 53% 71% 52%
Two or More Races 75% 58% 82% 56%
Socioeconomically Disadvantaged 73% 42% v v
English Learners 39% 37% v v
Students with Disabilities v v v v
Students Receiving Migrant Education Services v v v v
v Scores are not shown when the number of students tested is 10 or less, either because the number of students tested in this category is too small for statistical accuracy or to protect student privacy.
Three-Year Data ComparisonStudents Scoring at Proficient or Advanced Levels
OCCS: CHEP/PCHS Orange CDE California
Subject 10-11 11-12 12-13 10-11 11-12 12-13 10-11 11-12 12-13
English-Language Arts 70% 72% 71% 27% 30% 32% 54% 56% 55%
Mathematics 44% 47% 53% 28% 30% 36% 49% 50% 50%
Science 63% 64% 69% 23% 23% 29% 57% 60% 59%
History-Social Science 52% 54% 49% 19% 21% 17% 48% 49% 49%
STAR Results for All StudentsThe Standardized Testing and Reporting Program (STAR) results are evaluated and compared to state content standards using the following five performance levels: Advanced (exceeds state standards), Proficient (meets state standards), Basic, Below Basic, and Far Below Basic. Students scoring at the Proficient or Advanced level meet state standards in that content area. The tables show the percent-age of students who scored at Proficient or Advanced levels in English-language arts, mathematics, science, and history-social science.
STAR Results by Student Group: English-Language Arts, Mathematics, Science, and History-Social Science
Standardized Testing and Reporting ProgramThe Standardized Testing and Reporting Program (STAR) aims to identify strengths and weaknesses to improve student learn-ing. The STAR consists of several key tests that are designed for the student’s age and individual needs. These tests in-clude the California Standards Test (CST), California Modified Assessment (CMA), and California Alternate Performance As-sessment (CAPA).
The CSTs are multiple choice tests in English-language arts, mathematics, science, and history-social science for varying grade levels. Some grade levels also participate in an essay writing test. The CSTs are used to determine students’ achievement of the California Academic Content Standards. These standards describe the knowledge and skills that students are expected to learn at each grade level and subject.
The CMA is a modified assessment for students with disabilities who have an Individualized Education Plan. It is designed to assess those students whose disabilities prevent them from achieving grade-level proficiency on an assessment of the content standards with or without accommodations.
The CAPA is an alternate assessment for students with significant cognitive disabili-ties who are unable to take the CST with accommodations or modifications or the CMA with accommodations.
For more information on the STAR includ-ing tests, participation, groups, and scores by grade level, please visit star.cde.ca.gov.

5OCCS: CHEP/PCHS • 2012-13 SARC
Academic Performance IndexThe Academic Performance Index (API) is an annual measure of the academic performance and progress of the schools within California. API is measured on a scale from 200 to 1,000. This score reflects the school, district, or a student group’s performance level based on the results of statewide testing. The state has set an API score of 800 as the statewide target.
The annual API reporting cycle consists of the Base API (not published in this SARC) and Growth API. The Base API begins the reporting cycle and the results are released ap-proximately a year after testing occurs (e.g. The 2012 Base API is calculated from results of statewide testing in spring 2012, but the results are not released until May 2013). Growth API calculates test results in the same fashion and with the same indicators as the Base API but from test results from the following year (e.g. The 2013 Growth API is calculated from re-sults of statewide testing in spring 2013 and released in September 2013). To represent how much a school’s API changed from 2012-13, the 2012 Base API is subtracted from the 2013 Growth API. The Base API Report includes the Base API, targets, and ranks. The Growth API Report includes Growth API, growth achieved, and whether or not targets were met.
To learn more about API, visit www.cde.ca.gov/ta/ac/ap/ for the API information guide and the API overview guide.
API Ranks
Three-Year Data Comparison
2010 2011 2012
Statewide API Rank 6 6 6
Similar Schools API Rank 8 9 9
nData are reported only for numerically significant groups.
v Scores are not shown when the number of students tested is 10 or less, either because the number of students tested in this category is too small for statistical accuracy or to protect student privacy.
2013 Growth API and Three-Year Data ComparisonAPI Growth by Student Group
Group
2013 Growth API OCCS: CHEP/PCHS –
Actual API ChangeOCCS: CHEP/PCHS Orange CDE California
Number of Students
Growth API
Number of Students
Growth API
Number of Students
Growth API 10-11 11-12 12-13
All Students 920 844 2,293 666 4,655,989 790 12 1 9
Black or African American 26 771 52 652 296,463 708 n n n
American Indian or Alaska Native 3 v 20 482 30,394 743 n n n
Asian 195 889 231 852 406,527 906 -1 16 0
Filipino 4 v 8 v 121,054 867 n n n
Hispanic or Latino 159 824 1,178 570 2,438,951 744 20 2 32
Native Hawaiian or Pacific Islander 2 v 10 v 25,351 774 n n n
White 464 830 698 753 1,200,127 853 10 -5 -1
Two or More Races 37 865 64 769 125,025 824 n n n
Socioeconomically Disadvantaged 22 816 952 548 2,774,640 743 n n n
English Learners 108 816 803 558 1,482,316 721 n n n
Students with Disabilities 5 v 121 410 527,476 615 n n n
API Growth by Student GroupAssessment data is reported only for numerically significant groups. To be considered numerically significant for the API, the group must have either: (1) at least 50 students with valid STAR scores who make up at least 15 percent of the total valid STAR scores, or (2) at least 100 students with valid STAR scores. This table displays, by student group, first, the 2013 Growth API at the school, district, and state level followed by the actual API change in points added or lost for the past three years at the school.
API RanksSchools are ranked in 10 categories of equal size, called deciles, from one (lowest) to 10 (highest) based on their API Base reports. A school’s “statewide API rank” com-pares its API to the APIs of all other schools statewide of the same type (elementary, middle, or high school). A “similar schools API rank” reflects how a school com-pares to 100 statistically matched similar schools. This table shows the school’s three-year data for statewide API rank and similar schools’ API rank.
6OCCS:CHEP/PCHS • 2012-13 SARC
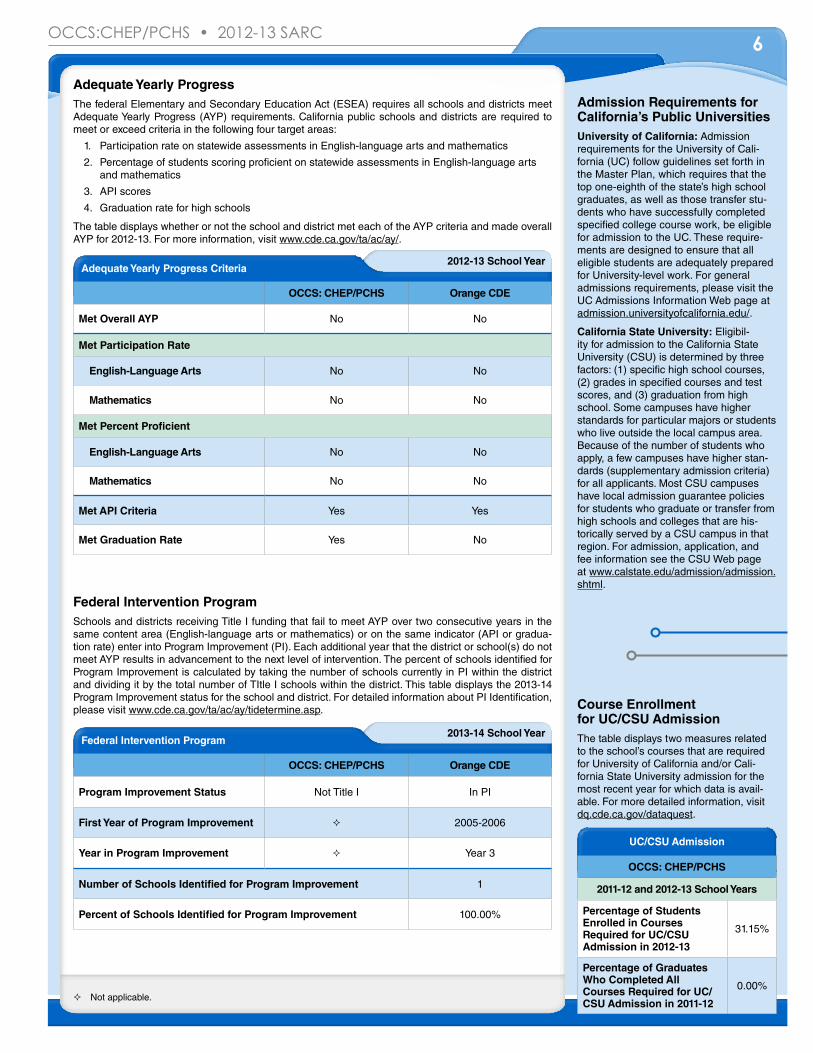
2012-13 School YearAdequate Yearly Progress Criteria
OCCS: CHEP/PCHS Orange CDE
Met Overall AYP No No
Met Participation Rate
English-Language Arts No No
Mathematics No No
Met Percent Proficient
English-Language Arts No No
Mathematics No No
Met API Criteria Yes Yes
Met Graduation Rate Yes No
² Not applicable.
Adequate Yearly ProgressThe federal Elementary and Secondary Education Act (ESEA) requires all schools and districts meet Adequate Yearly Progress (AYP) requirements. California public schools and districts are required to meet or exceed criteria in the following four target areas:
1. Participation rate on statewide assessments in English-language arts and mathematics
2. Percentage of students scoring proficient on statewide assessments in English-language arts and mathematics
3. API scores
4. Graduation rate for high schools
The table displays whether or not the school and district met each of the AYP criteria and made overall AYP for 2012-13. For more information, visit www.cde.ca.gov/ta/ac/ay/.
2013-14 School YearFederal Intervention Program
OCCS: CHEP/PCHS Orange CDE
Program Improvement Status Not Title I In PI
First Year of Program Improvement ² 2005-2006
Year in Program Improvement ² Year 3
Number of Schools Identified for Program Improvement 1
Percent of Schools Identified for Program Improvement 100.00%
Federal Intervention ProgramSchools and districts receiving Title I funding that fail to meet AYP over two consecutive years in the same content area (English-language arts or mathematics) or on the same indicator (API or gradua-tion rate) enter into Program Improvement (PI). Each additional year that the district or school(s) do not meet AYP results in advancement to the next level of intervention. The percent of schools identified for Program Improvement is calculated by taking the number of schools currently in PI within the district and dividing it by the total number of TItle I schools within the district. This table displays the 2013-14 Program Improvement status for the school and district. For detailed information about PI Identification, please visit www.cde.ca.gov/ta/ac/ay/tidetermine.asp.
Admission Requirements for California’s Public UniversitiesUniversity of California: Admission requirements for the University of Cali-fornia (UC) follow guidelines set forth in the Master Plan, which requires that the top one-eighth of the state’s high school graduates, as well as those transfer stu-dents who have successfully completed specified college course work, be eligible for admission to the UC. These require-ments are designed to ensure that all eligible students are adequately prepared for University-level work. For general admissions requirements, please visit the UC Admissions Information Web page at admission.universityofcalifornia.edu/.
California State University: Eligibil-ity for admission to the California State University (CSU) is determined by three factors: (1) specific high school courses, (2) grades in specified courses and test scores, and (3) graduation from high school. Some campuses have higher standards for particular majors or students who live outside the local campus area. Because of the number of students who apply, a few campuses have higher stan-dards (supplementary admission criteria) for all applicants. Most CSU campuses have local admission guarantee policies for students who graduate or transfer from high schools and colleges that are his-torically served by a CSU campus in that region. For admission, application, and fee information see the CSU Web page at www.calstate.edu/admission/admission.shtml.
UC/CSU Admission
OCCS: CHEP/PCHS
2011-12 and 2012-13 School Years
Percentage of Students Enrolled in Courses Required for UC/CSU Admission in 2012-13
31.15%
Percentage of Graduates Who Completed All Courses Required for UC/CSU Admission in 2011-12
0.00%
Course Enrollment for UC/CSU AdmissionThe table displays two measures related to the school’s courses that are required for University of California and/or Cali-fornia State University admission for the most recent year for which data is avail-able. For more detailed information, visit dq.cde.ca.gov/dataquest.
7OCCS: CHEP/PCHS • 2012-13 SARC
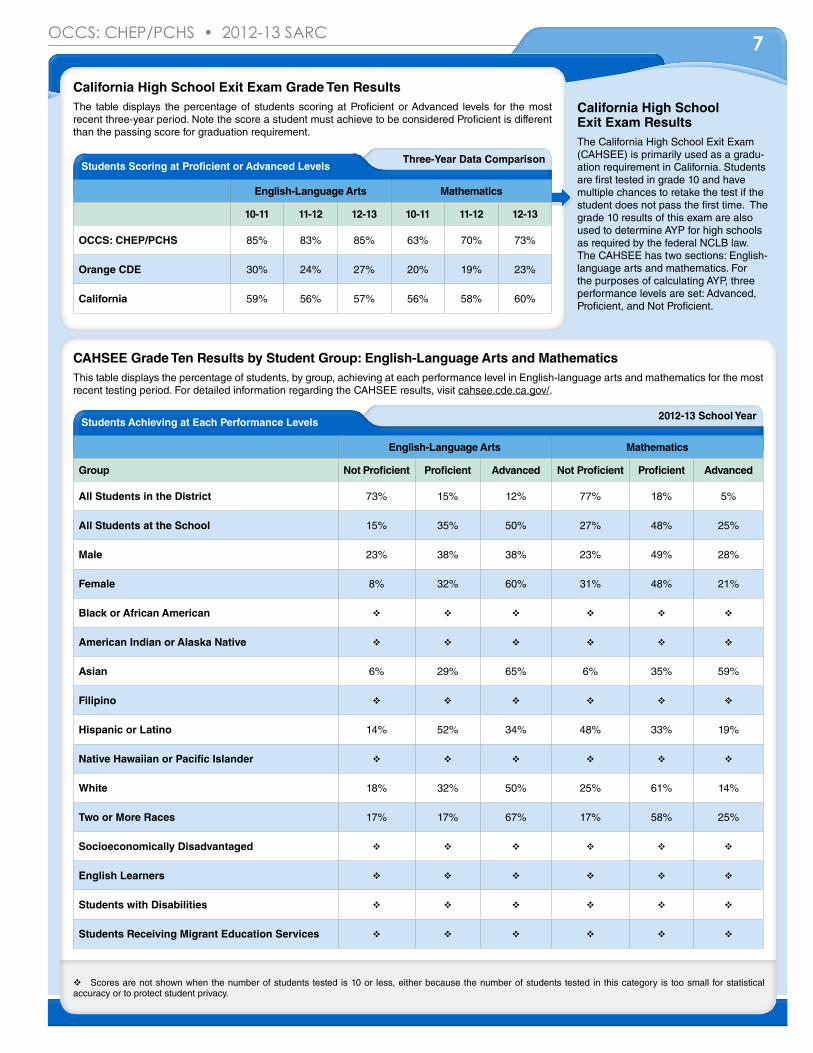
California High School Exit Exam ResultsThe California High School Exit Exam (CAHSEE) is primarily used as a gradu-ation requirement in California. Students are first tested in grade 10 and have multiple chances to retake the test if the student does not pass the first time. The grade 10 results of this exam are also used to determine AYP for high schools as required by the federal NCLB law. The CAHSEE has two sections: English-language arts and mathematics. For the purposes of calculating AYP, three performance levels are set: Advanced, Proficient, and Not Proficient.
v Scores are not shown when the number of students tested is 10 or less, either because the number of students tested in this category is too small for statistical accuracy or to protect student privacy.
Three-Year Data ComparisonStudents Scoring at Proficient or Advanced Levels
English-Language Arts Mathematics
10-11 11-12 12-13 10-11 11-12 12-13
OCCS: CHEP/PCHS 85% 83% 85% 63% 70% 73%
Orange CDE 30% 24% 27% 20% 19% 23%
California 59% 56% 57% 56% 58% 60%
2012-13 School YearStudents Achieving at Each Performance Levels
English-Language Arts Mathematics
Group Not Proficient Proficient Advanced Not Proficient Proficient Advanced
All Students in the District 73% 15% 12% 77% 18% 5%
All Students at the School 15% 35% 50% 27% 48% 25%
Male 23% 38% 38% 23% 49% 28%
Female 8% 32% 60% 31% 48% 21%
Black or African American v v v v v v
American Indian or Alaska Native v v v v v v
Asian 6% 29% 65% 6% 35% 59%
Filipino v v v v v v
Hispanic or Latino 14% 52% 34% 48% 33% 19%
Native Hawaiian or Pacific Islander v v v v v v
White 18% 32% 50% 25% 61% 14%
Two or More Races 17% 17% 67% 17% 58% 25%
Socioeconomically Disadvantaged v v v v v v
English Learners v v v v v v
Students with Disabilities v v v v v v
Students Receiving Migrant Education Services v v v v v v
CAHSEE Grade Ten Results by Student Group: English-Language Arts and MathematicsThis table displays the percentage of students, by group, achieving at each performance level in English-language arts and mathematics for the most recent testing period. For detailed information regarding the CAHSEE results, visit cahsee.cde.ca.gov/.
California High School Exit Exam Grade Ten ResultsThe table displays the percentage of students scoring at Proficient or Advanced levels for the most recent three-year period. Note the score a student must achieve to be considered Proficient is different than the passing score for graduation requirement.

8OCCS: CHEP/PCHS • 2012-13 SARC
v Scores are not shown when the number of students tested is 10 or less, either because the number of students tested in this category is too small for statistical accuracy or to protect student privacy.
“Pacific Coast High School offers a safe and supportive environment for the 21st century learner.”
Graduating Class of 2013Completion of High School Graduation Requirements
Group OCCS: CHEP/PCHS Orange CDE California
All Students 153 1,398 418,598
Black or African American v 51 28,078
American Indian or Alaska Native v 14 3,123
Asian 18 68 41,700
Filipino v v 12,745
Hispanic or Latino 26 834 193,516
Native Hawaiian or Pacific Islander v v 2,585
White 90 359 127,801
Two or More Races 15 35 6,790
Socioeconomically Disadvantaged v 622 217,915
English Learners 18 537 93,297
Students with Disabilities v 119 31,683
Completion of High School Graduation RequirementsThis table displays school, District, and California data for the number of students in the most recent graduating class who met all State and local graduation requirements for grade 12 completion, including having passed both the English-language arts and mathematics portions of the California High School Exit Exam (CAHSEE) or received a local waiver or State exemption. For more information, please visit www.cde.ca.gov/ta/tg/hs.
Three-Year Data ComparisonGraduation and Dropout Rates
Graduation Rate Dropout Rate
09-10 10-11 11-12 09-10 10-11 11-12
OCCS: CHEP/PCHS 82.63% 85.60% 85.56% 12.30% 9.50% 9.00%
Orange CDE 82.63% 85.60% 85.56% 12.30% 9.50% 9.00%
California 74.72% 77.14% 78.73% 16.60% 14.70% 13.10%
Graduates and DropoutsThis table displays the graduation and dropout rates for the most recent three-year period for which data is available. Please note, a new method for calculating graduation and dropout rates was implemented starting with the class of 2010. The new rates should not be compared to data from previous years. Please visit www2.ed.gov/policy/elsec/guid/hsgrguidance.pdf for more information. Career Technical Education Data
OCCS: CHEP/PCHS
2012-13 Participation
Number of Pupils Participating in CTE 0
Percentage of Pupils Who Completed a CTE Program and Earned a High School Diploma
0%
Percentage of CTE Courses that are Sequenced or Articulated Between a School and Institutions of Postsecondary Education
0%
Career Technical Education ProgramsOf PCHS students, 13 percent requested work permits, 11 percent obtained enter-tainment work permits, and 10 percent enrolled in Vocational Exploration with Vocational Exploration work permits. Ap-proximately 11 percent of our graduates enter the work force full time. Another 4 percent enter technical school after gradu-ation, 2 percent are pursuing professional ballet careers, 4 percent are attending art academies, and 1 percent are pursuing professional music careers. Approximately 87 percent of PCHS graduates attend college, with the majority enrolling in com-munity college while working part time.
PCHS has a partnership with Central County ROP and students are encour-aged to participate in their CTE programs. Please see individual ROP Web sites for program sequences offered. PCHS stu-dents have participated in ROP courses through North County ROP, Central County ROP, Coastline ROP, Capo-Lagu-na Beach ROP, and Tri-City ROP. Each ROP is run differently and offers different courses than the others. Please see the individual ROP Web sites for listings of the primary representatives of the career tech-nical advisory committees and industries represented.
Students are provided information and assistance in pursuing Regional Occupa-tion Program (ROP) courses. A bulletin board accessible by all students displays the ROP information for the four ROP dis-tricts and the course offerings. Interested students apply for enrollment. Attendance and grades are sent to the school.
Career Technical Education ParticipationThis table displays information about par-ticipation in the school’s Career Technical Education (CTE) programs.

9OCCS:CHEP/PCHS • 2012-13 SARC
• Systems: Gas Systems and Pipes, Sewer, Mechanical Systems (heating, ventilation, and air conditioning)
• Interior: Interior Surfaces (floors, ceilings, walls, and window casings)
• Cleanliness: Pest/Vermin Control, Overall Cleanliness (school grounds, buildings, rooms, and common areas)
• Electrical: Electrical Systems (interior and exterior)
• Restrooms/Fountains: Restrooms, Sinks/Drinking Fountains (interior and exterior)
• Safety: Fire Safety Equipment, Emergency Systems, Hazardous Materials (interior and exterior)
• Structural: Structural Condition, Roofs
• External: Windows/Doors/Gates/Fences, Playgrounds/School Grounds
School Facility Items Inspected The tables show the results of the school’s most recent inspection using the Facility Inspection Tool (FIT) or equivalent school form. The following is a list of items inspected.
2013-14 School YearDeficiencies and Repairs
Items Inspected Deficiencies, Action Taken or Planned, and Date of Action
Structural Repairs are needed on the roof. Work completion in Spring of 2014.
Deficiencies and RepairsThe table lists the repairs required for all deficiencies found during the site inspection. Regardless of each item’s repair status, all deficiencies are listed.
School FacilitiesContinued from left
Our sites are clean, well decorated, and maintain a “new” look. The parking lots are resurfaced and restriped as needed. We have professional landscapers attending the grounds on a weekly basis. Data is collected and reassessed by the school on a continual (weekly and/or monthly) basis to be sure our policies provide the safest and cleanest environment for students.
Inspections for the Deferred Maintenance program are done regularly to identify facility needs and maintenance issues. Annual facility inspection evaluations (FIT) are done to certify that we are in compli-ance with Education Code 17002(d)(2) and to ensure school facilities are in good repair. Monthly routine site inspections are also done by using the Good Repair*/Safety Report to turn in any facility condition(s) that need immediate repair.
In 2007-08, the ACCESS Community School program implemented a five-year master plan to renovate specific facility repairs and equipment replacement by us-ing funds provided by the State Deferred Maintenance program. These funds are earmarked for the repair of HVAC equip-ment, electrical needs, paint, and flooring to maintain the operation of the facilities.
In addition, general fund budget alloca-tions are used for tenant improvement projects for sites that were mandated to relocate for various reasons.
Throughout the duration of the five-year master plan, the ACCESS County Com-munity program continues its site renova-tion project on specific facility repairs and equipment replacement needs. Most recently in 2012-13, three additional sites were renovated through the site renova-tion project countywide.
In 2013-14, there are plans in early spring to complete the CHEP Central site renovation. The majority renovations will be funded through the State Deferred Maintenance program and/or general fund budget allocations.
2013-14 School Year
School Facility Good Repair Status This inspection determines the school facility’s good repair status using ratings of good condition, fair condition, or poor condition. The overall summary of facility conditions uses ratings of exemplary, good, fair, or poor.
School Facility Good Repair Status
Items Inspected Repair Status Items Inspected Repair Status
Systems Good Restrooms/Fountains Good
Interior Good Safety Good
Cleanliness Good Structural Fair
Electrical Good External Good
Overall Summary of Facility Conditions Good
Date of the Most Recent School Site Inspection 08/30/2013
Date of the Most Recent Completion of the Inspection Form 08/30/2013
School FacilitiesCHEP is located in four sites throughout Orange County: Costa Mesa, Anaheim, Mission Viejo, and Cy-press. PCHS has one site centrally located in Tustin. All sites are leased except for the Costa Mesa facil-ity, which is owned by the Orange County Department of Education. All five OCCS sites have teachers’ offices to meet with students and their families, two to four classrooms for on-site classes, a curriculum storage room, and a student computer lab.
The following safety measures are taken to ensure our staff and students have a safe and healthy envi-ronment: all students, parents, and visitors must sign-in at the school office when entering or leaving the campus. Parents of K-8 students are required to walk inside the building when dropping off or picking up students. High school students are required to stand in a designated place directly in front of the building when waiting to be picked up by their parents. Professional cleaning crews clean all five sites in the evenings 2-5 times a week. The sites have the carpeting cleaned one to two times yearly, and are painted every time the leases are renewed.
School site are in buildings that have passed facility inspection for structural safety, meet building code requirements, and State educational fire codes.
Continued on sidebar
10OCCS:CHEP/PCHS • 2012-13 SARC
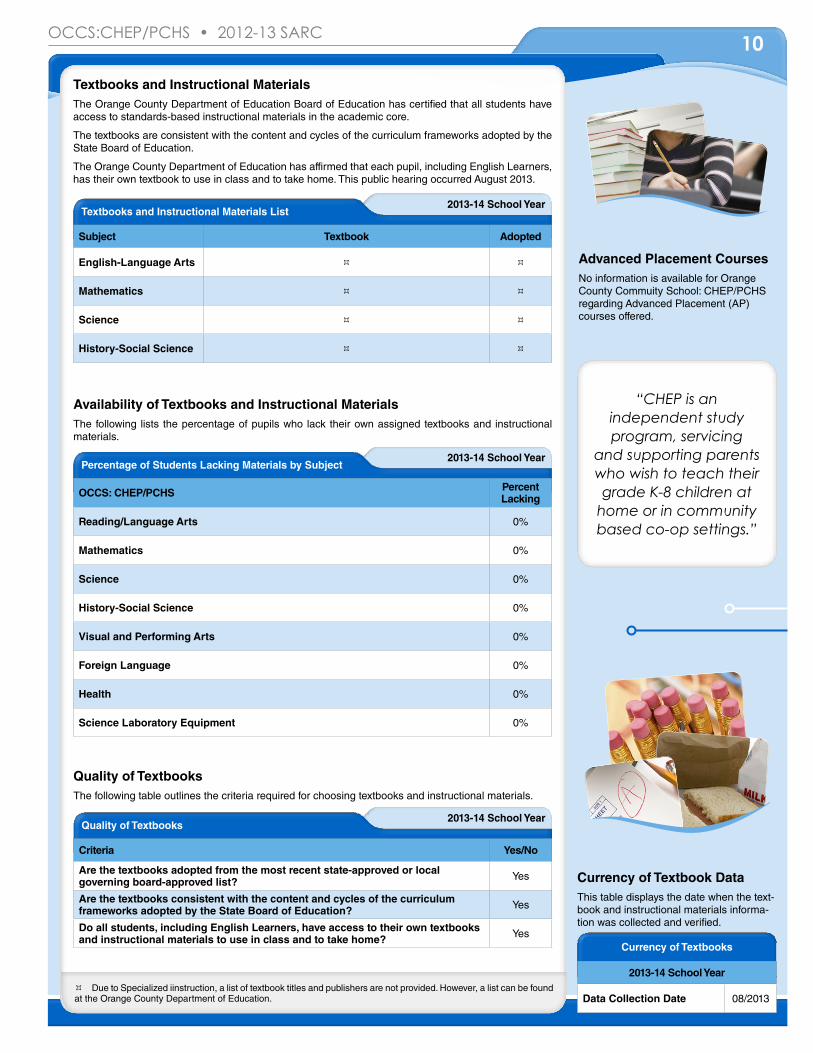
Currency of Textbooks
2013-14 School Year
Data Collection Date 08/2013
2013-14 School YearTextbooks and Instructional Materials List
Subject Textbook Adopted
English-Language Arts ³ ³
Mathematics ³ ³
Science ³ ³
History-Social Science ³ ³
Textbooks and Instructional MaterialsThe Orange County Department of Education Board of Education has certified that all students have access to standards-based instructional materials in the academic core.
The textbooks are consistent with the content and cycles of the curriculum frameworks adopted by the State Board of Education.
The Orange County Department of Education has affirmed that each pupil, including English Learners, has their own textbook to use in class and to take home. This public hearing occurred August 2013.
2013-14 School YearQuality of Textbooks
Criteria Yes/No
Are the textbooks adopted from the most recent state-approved or local governing board-approved list? Yes
Are the textbooks consistent with the content and cycles of the curriculum frameworks adopted by the State Board of Education? Yes
Do all students, including English Learners, have access to their own textbooks and instructional materials to use in class and to take home? Yes
Quality of TextbooksThe following table outlines the criteria required for choosing textbooks and instructional materials.
Currency of Textbook DataThis table displays the date when the text-book and instructional materials informa-tion was collected and verified.
³ Due to Specialized iinstruction, a list of textbook titles and publishers are not provided. However, a list can be found at the Orange County Department of Education.
2013-14 School YearPercentage of Students Lacking Materials by Subject
OCCS: CHEP/PCHS Percent Lacking
Reading/Language Arts 0%
Mathematics 0%
Science 0%
History-Social Science 0%
Visual and Performing Arts 0%
Foreign Language 0%
Health 0%
Science Laboratory Equipment 0%
Availability of Textbooks and Instructional MaterialsThe following lists the percentage of pupils who lack their own assigned textbooks and instructional materials.
Advanced Placement CoursesNo information is available for Orange County Commuity School: CHEP/PCHS regarding Advanced Placement (AP) courses offered.
“CHEP is an independent study program, servicing
and supporting parents who wish to teach their grade K-8 children at
home or in community based co-op settings.”

11OCCS:CHEP/PCHS • 2012-13 SARC
Three-Year Data ComparisonTeacher Credential Information
Orange CDE OCCS: CHEP/PCHS
Teachers 12-13 10-11 11-12 12-13
With Full Credential 346 44 45 45
Without Full Credential 0 0 0 0
Teaching Outside Subject Area of Competence 0 0 0
Teacher QualificationsThis table shows information about teacher credentials and teacher qualifications. Teachers without a full credential include teachers with district and university internships, pre-internships, emergency or other permits, and waivers. For more information on teacher credentials, visit www.ctc.ca.gov/.
Three-Year Data ComparisonTeacher Misassignments and Vacant Teacher Positions
OCCS: CHEP/PCHS
Teachers 11-12 12-13 13-14
Teacher Misassignments of English Learners 0 0 0
Total Teacher Misassignments 0 0 0
Vacant Teacher Positions 0 0 0
Teacher Misassignments and Vacant Teacher PositionsThis table displays the number of teacher misassignments (positions filled by teachers who lack legal authorization to teach that grade level, subject area, student group, etc.) and the number of vacant teacher positions (not filled by a single designated teacher assigned to teach the entire course at the beginning of the school year or semester). Please note total teacher misassignments includes the num-ber of teacher misassignments of English Learners.
2012-13 School YearNo Child Left Behind Compliant Teachers
Percent of Classes in Core Academic Subjects
Taught by Highly Qualified Teachers
Not Taught by Highly Qualified Teachers
OCCS: CHEP/PCHS 98.94% 1.06%
All Schools in District 97.35% 2.65%
High-Poverty Schools in District 99.34% 0.66%
Low-Poverty Schools in District 93.42% 6.58%
Core Academic Classes Taught by Highly Qualified TeachersThe No Child Left Behind Act (NCLB) extended ESEA to require that core academic subjects be taught by Highly Qualified Teachers, defined as having at least a bachelor’s degree, an appropriate California teaching credential, and demonstrated competence for each core academic subject area he or she teaches. The table displays data regarding highly qualified teachers from the 2012-13 school year.
High-poverty schools are defined as those schools with student participation of approximately 40 per-cent or more in the free and reduced priced meals program. Low-poverty schools are those with student participation of approximately 39 percent or less in the free and reduced priced meals program. For more information on teacher qualifications related to NCLB, visit www.cde.ca.gov/nclb/sr/tq.
Academic Counselors and School Support Staff Data
2012-13 School Year
Academic Counselors
FTE of Academic Counselors 0.00
Ratio of Students Per Academic Counselor ²
Support Staff FTE
Social/Behavioral or Career Development Counselors 0.00
Library Media Teacher (Librarian) 0.00
Library Media Services Staff (Paraprofessional) 0.00
Psychologist «
Social Worker 0.00
Nurse 0.05
Speech/Language/Hearing Specialist 0.00
Resource Specialist (non-teaching) 0.00
Academic Counselors and School Support StaffThis table displays information about aca-demic counselors and support staff at the school and their full-time equivalent (FTE).
Types of Services FundedProfessional development was provided by staff development categorical funding and curriculum was purchased through Instructional Materials Funding Realign-ment Program (IMFRP) funding.
²Not applicable.
« On an as-needed basis.

12OCCS: CHEP/PCHS • 2012-13 SARC
Data for this year’s SARC was provided by the California Department of Education (CDE), school, and district offices. For additional information on California schools and districts, please visit DataQuest at http://data1.cde.ca.gov/dataquest. DataQuest is an online resource that provides reports for accountability, test data, enrollment, graduates, dropouts, course enrollments, staffing, and data regarding English Learners. For further information regarding the data elements and terms used in the SARC see the 2012-13 Academic Performance Index Reports Information Guide located on the CDE API Web page at www.cde.ca.gov/ta/ac/ap. Per Education Code Section 35256, each school district shall make hard copies of its annually updated report card available, upon request, on or before February 1 of each year.
All data accurate as of December 2013.
School Accountability Report Card
PubliShed by:
www.sia-us.com | 800.487.9234
School Financial Data
2011-12 Fiscal Year
Total Expenditures Per Pupil $3,810
Expenditures Per Pupil From Restricted Sources $0
Expenditures Per Pupil From Unrestricted Sources $3,810
Annual Average Teacher Salary $94,698
School Financial DataThe following table displays the school’s average teacher salary and a breakdown of the school’s expenditures per pupil from unrestricted and restricted sources.
Expenditures Per PupilSupplemental/Restricted expenditures come from money whose use is controlled by law or by a donor. Money that is designated for specific purposes by the district or governing board is not consid-ered restricted. Basic/Unrestricted expen-ditures are from money whose use, except for general guidelines, is not controlled by law or by a donor.
In accordance with Stateand federal requirements, theSchool Accountability Report
Card (SARC) is put forth annuallyby all public schools as a tool forparents and interested parties to
stay informed of the school’sprogress, test scores, and
achievements.
School Accountability Report Card
Financial Data The financial data displayed in this SARC is from the 2011-12 fiscal year. The most current fiscal infor-mation available provided by the state is always two years behind the current school year, and one year behind most other data included in this report. For detailed information on school expenditures for all districts in California, see the CDE Current Expense of Education & Per-pupil Spending Web page at www.cde.ca.gov/ds/fd/ec/. For information on teacher salaries for all districts in California, see the CDE Certificated Salaries & Benefits Web page at www.cde.ca.gov/ds/fd/cs/. To look up expenditures and salaries for a specific school district, see the Ed-Data Web site at www.ed-data.org.
2011-12 Fiscal YearDistrict Salary Data
Orange CDE Similar Sized District
Beginning Teacher Salary ÷ ÷
Mid-Range Teacher Salary ÷ ÷
Highest Teacher Salary ÷ ÷
Average Elementary School Principal Salary ÷ ÷
Average Middle School Principal Salary ÷ ÷
Average High School Principal Salary ÷ ÷
Superintendent Salary ÷ ÷
Teacher Salaries — Percent of Budget ÷ ÷
Administrative Salaries — Percent of Budget ÷ ÷
District Financial DataThis table displays district teacher and administrative salary information and compares the figures to the state averages for districts of the same type and size based on the salary schedule. Note the district salary data does not include benefits.
2011-12 Fiscal YearFinancial Data Comparison
Expenditures Per Pupil From
Unrestricted Sources
Annual Average Teacher
Salary
OCCS: CHEP/PCHS $3,810 $94,698
Orange CDE $7,706 $102,466
California $5,537 $68,369
School and District — Percent Difference -50.6% -7.6%
School and California — Percent Difference -31.2% +38.5%
Financial Data ComparisonThis table displays the school’s per pupil expenditures from unrestricted sources and the school’s aver-age teacher salary and compares it to the district and state data.
÷ County offices of education that operate schools are not required to report this data.