orbital and structural evolution of triton - geology and structural evolution of triton rishi sugla...
TRANSCRIPT

Orbital and Structural Evolution of Triton
Rishi Sugla
Advisors: Saswata Hier-Majumder
Douglas Hamilton
Vedran Lekic
GEOL393H
26 April 2013
Abstract
Triton, Neptune’s largest moon, is one of the coldest bodies in our universe with asurface temperature of 38 K. Even at this low temperature, Triton may have sustainedan ammonia-rich subsurface ocean throughout its history. The potential presence ofthis ocean relies on Triton’s orbital evolution and internal composition through time.The orbital evolution refers to changes in the semi-major axis, eccentricity, and orbitalfrequency of Triton over time. The changes in internal composition, or structuralevolution, refer to the progressive crystallization of Tritons ammonia rich subsurfaceocean. After its capture by Neptune from a heliocentric binary, Triton’s orbit wasrapidly circularized. The circularization of Triton’s orbit around Neptune most likelyoccurred during the first few hundred Ma after the formation of our solar system.Subsequently, the orbital frequency and semi-major axis of Triton’s orbit evolved toits current value. During the first semester of my thesis, I investigate the evolution oforbital frequency and semi-major axis of Triton using the governing ordinary differentialequations from orbital dynamics.
Due to the retrograde nature of Triton’s orbit, its semi-major axis decays over time.Results from my simulation indicate that Triton’s semi-major axis decays slowly, byapproximately 6% over 3.5 Ga past the circularization of its orbit. This leads to anapproximately 8% increase in orbital frequency over this period. The normalized tidaldissipation, however, increases by nearly 60% within this time period. The increasein average tidal dissipation helps warming the ice shell and will likely retard the rateof freezing of the subsurface ocean. This thesis hypothesizes that Triton’s spin-upincreases tidal heating enough to sustain a polar subsurface ocean. As spin-up occurs,the magnitude of tidal dissipation within the ice shell increases. Tidal dissipationpredominantly acts of the base of the ice shell near the polar regions. As progressiveincreases in tidal dissipation due to Triton’s spin-up occur, crystallization rates of theice shell decrease. At values as low as 8× 10⁻⁵, models show maintains a 200km thickocean beneath its icy outer shell. As eccentricities decrease further, polar oceans ratherthan global oceans become increasingly likely. My calculations show that in most casesa global subsurface ocean is not sustained over time. In many cases, however, a polarsubsurface ocean is sustained until present day for a wide range of variable parameters.Therefore, I accept the hypothesis that Triton’s spin-increases tidal heating enough tosustain a polar susburface ocean.
1

Contents
1 Introduction 4
1.1 Geology and current internal structure of Triton . . . . . . . . . . . . . . . . 41.2 Orbital History . . . . . . . . . . . . . . . . . . . . . . . . . . . . . . . . . . 6
2 Methods 8
2.1 Orbital evolution . . . . . . . . . . . . . . . . . . . . . . . . . . . . . . . . . 92.2 Thermal and structural evolution . . . . . . . . . . . . . . . . . . . . . . . . 112.3 Error analysis . . . . . . . . . . . . . . . . . . . . . . . . . . . . . . . . . . . 12
3 Results 16
4 Suggestion for Future Work 20
5 Discussion 22
2

List of Figures
1 Cross sectional view of Triton’s interior (not to scale), based on Gaeman et al.
(2012). . . . . . . . . . . . . . . . . . . . . . . . . . . . . . . . . . . . . . . . 52 A schematic diagram outlining Triton’s capture by Neptune. During stage 1,
Triton, one of the objects in the binary, orbits around the Sun. During stage2, Triton is captured by Neptune’s gravity. . . . . . . . . . . . . . . . . . . 6
3 Diagram of circularization of Triton (not to scale). . . . . . . . . . . . . . . . 74 A schematic diagram depicting the tide raised in a two body system. The
quantity ǫ depicts the lag between the tidal bulge and the perturbing body. . 85 Model of the numerical calculations in the orbital-structural-thermal evolution
model. . . . . . . . . . . . . . . . . . . . . . . . . . . . . . . . . . . . . . . . 96 Mesh grid composed of quadratic quadrilaterals. Propogation of ice sheet
advancement was solved using Finite Element Method calculation in DyMMS. 137 Numerical and analytical solutions for the function f(x) = x3 for varying step
sizes. The top left graph has 10 steps, the top right 100, and the bottomcenter 1000. . . . . . . . . . . . . . . . . . . . . . . . . . . . . . . . . . . . 14
8 A plot of L1, L2, and L∞ norms as a function of grid size for the exact solutionf(x) = x3. . . . . . . . . . . . . . . . . . . . . . . . . . . . . . . . . . . . . 15
9 A schematic diagram outlining Triton’s capture by Neptune. During stage 1,Triton, one of the objects in the binary, orbits around the Sun. During stage2, Triton is captured by Neptune’s gravity. . . . . . . . . . . . . . . . . . . 16
10 Variation of tidal dissipation within Triton over time. . . . . . . . . . . . . 1711 Variation of radial flux within Triton over time. . . . . . . . . . . . . . . . . 1812 Variation of temperature within Triton over time. . . . . . . . . . . . . . . 1913 The ratio of Triton’s semi-major axis and Neptune’s radius with respect to
time (top) and eccentricity dampening rate (bottom)for a for a k2
QN
with an
order of magnitude of 10−4. . . . . . . . . . . . . . . . . . . . . . . . . . . . 2014 The ratio of Triton’s semi-major axis and Neptune’s radius with respect to
time (top) and eccentricity dampening rate (bottom)for a for a k2
QN
with an
order of magnitude of 10−3. . . . . . . . . . . . . . . . . . . . . . . . . . . . 2115 The ratio of Triton’s semi-major axis and Neptune’s radius with respect to
time (top) and eccentricity dampening rate (bottom)for a for a k2
QN
with an
order of magnitude of 10−2. . . . . . . . . . . . . . . . . . . . . . . . . . . . 21
3

1 Introduction
Triton is the largest of Neptune’s thirteen moons with a radius of 1325 km and a mass of2.14× 1022 kg. Over half of Triton’s surface is composed of N2 in solid solution with carbonmonoxide (CO) and methane (CH4). The other half of Triton’s surface is composed of carbondioxide (CO2) and water ice (H2O) (McKinnon and Kirk , 2007). Despite the abundance ofvolatiles on its surface, data from the Voyager mission suggests that Triton’s density is 2065kg m−3, high enough to require a core composed of both silicate and metal. The interior ofTriton is likely composed of a metallic core at its center. Above the metallic core, a silicatemantle containing radioactive elements is likely present. The schematic diagram in Figure1 outlines a likely interior structure of Triton (Gaeman et al., 2012).The heating from theseradioactive elements could contribute to the potential subsurface ocean within Triton.
Current orbital parameters provide us with some clue regarding Triton’s origin. The orbitof Triton is retrograde and has high inclination of 156.85 degrees. By comparison, Earth’smoon has an inclination of 1.54 degrees. Such a retrograde orbit and high inclination indicatethat Triton was captured by Neptune after originally being in a heliocentric orbit around thesun (Agnor and Hamilton, 2006). Triton’s similar density to Kuiper Belt objects indicatethat it was formed in that area (McKinnon and Kirk , 2007).
The following subsections discuss the observed geologic features on Triton’s surface andthe orbital history of Triton.
1.1 Geology and current internal structure of Triton
Triton contains several recent geologic features. These features include an area of quasi-linearridges and dimples formed by diapirism, a poorly understood polar region, and undulatinghigh plains (McKinnon and Kirk , 2007). The undulating high plains form from icy volcanism.The icy volcanism manifests as a series of vents and terrestrial volcanic calderas. The currentcomposition of the icy lavas is currently unknown. The region of quasi-linear ridges anddimples on Triton are commonly referred to as cantaloupe terrain. This region displays awell ordered structural pattern of kidney shaped depressions known as cavi. The uniformsize of the cavi indicate their diapric origin. The region of cantaloupe terrain also containswell formed parallel ridges which bound a central trough (McKinnon and Kirk , 2007). Theseridges are 6-10 km across crest-to-crest and several hundred meters high. Fissures in thisregion are less numerous and are 2-3 km wide. Images from Voyager show that some areasof the cantaloupe terrain are engulfed by up to a few hundred meters of bright ice. Theoverall thickness of the polar ice is believed to be less than 1 km thick. Although this regionis a polar cap, the icy terrain may behave as if it is glaciated due to warming from depositsof volatile ice such as N2 (McKinnon and Kirk , 2007).
4

Figure 1: Cross sectional view of Triton’s interior (not to scale), based on Gaeman et al.
(2012).
Triton is likely geologically active. Stern and Mckinnon (2000) suggest that the surfaceage of Triton is less than 100 Ma based on crater counts. The young surface age, combinedwith the observed structures on Triton’s surface indicate that these features were createdwithin the last 100 Ma. The driving force behind the geologic activity, however, is stilldebated.
One explanation suggests that Triton’s current geologic activity is due to deformationdue to tidal diurnal stress within Triton as it orbits Neptune (Prockter et al., 2005). A studyby McKinnon and Kirk (2007), however, suggests that tidal diurnal stress alone would bean insufficient mechanism to generate the previously mentioned geologic features. Triton’slow eccentricity does not result in a strong enough tidal forcing to create tide-based geologicfeatures such as those seen on Europa (Greenberg et al., 1998).
Gaeman et al. (2012) used the abundances of these radiogenic elements to model heattransport within the interior of Triton over time. This model dynamically incorporatedthickening and thinning of Triton’s ice shell while examining the coupling between the iceshell-ocean in Triton. The model of ice sheet growth or retreat was examined as a functionof different eccentricities. Gaeman et al. (2012) found that even at low values of Triton’seccentricity, a subsurface ocean may have been sustained within its interior over a geologically
5

Figure 2: A schematic diagram outlining Triton’s capture by Neptune. During stage 1,Triton, one of the objects in the binary, orbits around the Sun. During stage 2, Triton iscaptured by Neptune’s gravity.
significant period of time.The changes in orbital evolution, however, are poorly constrained. This work seeks to
further constrain orbital evolution, namely semi-major axis and eccentricity, so it may becoupled with previous models of structural evolution developed by Gaeman et al. (2012).If a subsurface ocean exists within Triton, it may have the potential to sustain life withinits ammonia-rich subsurface ocean. In addition, it is possible that its silicate mantle maypotentially contain silicate-based life, however this is less likely (McKinnon and Kirk , 2007).
1.2 Orbital History
There are two proposed methods for the capture of Triton into Neptune’s orbit. The firsthypothesis suggests that Triton was in a binary system in a heliocentric orbit as shown inFigure 2. As the binary system approached Triton, its orbit interacted with the gravitationalfield of Neptune resulting in capture (Agnor and Hamilton, 2006). The second mechanismfor capture is a satellite coming into repeated contact with Neptune by hydrodynamic drag,which would result in net energy dissipation from the system (McKinnon and Leith, 1995).The latter is unlikely because of the high number of passes which would have had to occurin order for the capture to be likely (Agnor and Hamilton, 2006).
Once capture occurs, the orbit of the satellite would circularize to its current, nearlycircular eccentricity. The energy loss from these systems would come from tidal dissipationof energy in Triton caused by Neptune as the satellite continued its orbit (Ross and Schubert ,
6

Figure 3: Diagram of circularization of Triton (not to scale).
1990). An alternative hypothesis suggests that this capture caused a perturbation of pre-existing satellites orbiting Neptune. The perturbed satellites then collided to form a debrisdisk around Neptune. The interaction of Triton with this debris disk increased the rate ofenergy loss of the satellite, leading to an increased rate of circularization (Cuk and Gladman,2005). Both hypotheses for capture suggest that the circularization of Triton occurred in ashort time interval ( 105 years).
The rapid circularization of Triton contributed a large amount of energy into this system(Figure 3) (Ross and Schubert , 1990). Ross and Schubert (1990) hypothesize that this energywould have inevitably created a subsurface ocean within Triton. A mechanism sustainingthis subsurface ocean post-circularization is tidal blanketing (Gaeman et al., 2012). Tidaldissipation, while only a modest source of heat compared to the radiogenic elements withinTriton, plays an important role in sustaining the post-circularized subsurface ocean. This isbecause tidal dissipation does not act evenly on the ice shell, instead acting predominantlyon the basal surface of the ice shell. This mechanism reduces the basal heat flux on the iceshell and slows the crystallization of the ice shell overlying the subsurface ocean (Gaeman
et al., 2012).While the model constructed by Gaeman et al. (2012) uses varying values of eccentricity
in order to examine its effect on the structural evolution of Triton, it does not take intoaccount the dynamic values of semi-major axis it changed over time. Since tidal blanketing,caused by tidal dissipation of heating, plays a major role in ice sheet growth or retreat theorbital evolution of Triton must be further constrained. A model of orbital evolution isconstructed in this study to determine how it changed over time. Eventually, this modelwill be coupled with the model of structural evolution developed by Gaeman et al. (2012)
7

to better understand the potential of a subsurface ocean within Triton.
2 Methods
Figure 4: A schematic diagram depicting the tide raised in a two body system. The quantityǫ depicts the lag between the tidal bulge and the perturbing body.
The coupled orbital and structural evolution models for this thesis must take into accountthree main parameters which directly relate to ice shell growth and retreat throughout time.For Triton, the thermal, orbital, and structural evolution must all be considered. Thesethree factors directly feed into one another. The structure and semi major axis of Tritonat an intitial time will alter the tidal dissipation in Triton’s subsurface ocean which existedpost-capture. The tidal dissipation of energy will then directly affect the conductive heattransder of laten heat of crystallization through the base of the ice shell. This tidal dissipationis calculated by a previously constructed numerical code known as TiRADE. The change inconduction corresponds a dynamic freezing rate which well change as a result. Finally, thefreezing rate will change the structure of the ice shell and the loop will begin again. Thisprocess is governed by three differential equations which describe the thermal, orbital, andstructural evolution. These governing equations will be described in further detail below. Amodel of this process can be seen in Figure 5.
8

Figure 5: Model of the numerical calculations in the orbital-structural-thermal evolutionmodel.
2.1 Orbital evolution
In this thesis, the Neptune-Triton system is treated as a two body system and neglect thegravitational effects of Neptune’s other moons. In the simple two-body system, illustrated inthe schematic Figure 4, the perturbing body (Neptune) raises a tide in the perturbed body(Triton). If the orbital frequencies of the two bodies are different, the tidal bulge, indicatedby the dark shaded regions either precede or lag the perturbing body. As the total energyand the angular momentum in the system must be conserved, the energy required to raisethe tide is dissipated through changes in the orbit (Murray and Dermott , 1999, Ch 4.9). Theangle of lag ǫ depicted in Figure 4 is related to the dissipation factor Q by the relation,
sin 2ǫ = −1
Q. (1)
In the Neptune-Triton system, Triton exerts a torque and tidal bulge onto Neptunethroughout its orbit Murray and Dermott (1999). This torque is related to the orbitalangular velocity of Triton in its orbit. Because energy within the system must be conserved,the sum of the energy in the system is equal to the rotational energy of the planet andthe orbital energy of the system. Thus, the change of energy within the system may bedescribed by two Ordinary Differential Equations which are the governing equations for theorbital evolution model.
9

The eccentricity dampening rate is an important component of this model. The eccen-tricity dampening rate can be described by,
de
dt= −e
63
4
Mn
MN
(
RT
a
)5 uT QT
n, (2)
Where t is the time since orbit circularization, e is the eccentricity, and MT and MN aremasses of Triton and Neptune, respectively. QN is the tidal dissipation factor of Neptuneand n is the orbital frequency of Triton. QN is a dimensionless parameters that measuresthe loss-rate of energy from tides, known as the quality factor (Goldreich and Soter , 1966).The semimajor axis of Triton also changes with time, assuming a small orbital eccentricity,and can be described by,
da
dt= −
3k2
QN
MT
MN
(
RN
a
)5
an, (3)
Where t is time since orbit circularization, k2 is the tidal Love number of Triton, and RN
is the radius of Neptune. The k2 tidal Love number is a dimensionless parameter whichdescribes the deformation of a rigid body due to tidal forces. The values of these variablesmay be found in Table 1 below. Based on Kepler’s third law, we can relate the orbitalfrequency n to the semi-major axis by the relation,
n =
√
GMN
4π2a3, (4)
where G is the gravitational constant.The mechanical energy required to raise the tide is dissipated by variation in the semi-
major axis and orbital frequency. This variation, however, feeds back into the average rateof tidal dissipation, E, through orbital frequency and orbital eccentricity e following
E ∝ e2a5. (5)
Following the orbital evolution of Triton, if Triton’s orbital eccentricity is damped toa near constant value shortly after it’s capture, then I can express the normalized tidaldissipation as a function of time in the following manner,
E(t)
E(0)=
(
a(t)
a(0)
)5
, (6)
where E(0) is the tidal dissipation immediately after circularization, and a(0) is the semi-major axis immediately after circularization. Solving equation 3, I can track the evolutionof the tidal dissipation resulting from Triton’s orbital evolution.
10

In this thesis, I solved the ODE in equation 3 numerically using the Fourth Order Runge-Kutta Method (RK4). I provide an initial condition for the semi-major axis correspondingto the apoapsis at a reference eccentricity e0, as
a(0) = 14CN(1 + e0). (7)
The current value of Triton’s semi-major axis is approximately 14 times Neptune’s radius(14CN) (Cuk and Gladman, 2005), and the initial orbital eccentricity e0 = 0.05. The valueof QN in the governing equations has only recently began to be constrained and may havea range of potential values (Zhang and Hamilton, 2008; Goldreich and Soter , 1966). Thedifferent values of Q will be tested and the correct value for the system be supplied into thecode.
In the following section, I present the method for analyzing errors arising from the nu-merical solution.
Symbol Description Units Reference
CN Radius of Neptune 27764 km McKinnon and Kirk (2007)
a Semimajor axis of Triton 354760 x 103 McKinnon and Leith (1995)
K2T Love number; Triton 0.41 Zhang and Hamilton (2008)
QN Quality factor; Neptune 12000 Zhang and Hamilton (2008)
MT Mass of Triton 2.140 x 10²² kg McKinnon and Kirk (2007)
MN Mass of Neptune 1.0241 x 1026 kg McKinnon and Kirk (2007)
α Moment of inertia factor 2
5
Table 1: Table of constants used in the calculation
2.2 Thermal and structural evolution
Structural and thermal evoltuion are primarily controlled by heat conduction within the iceshell and latent heat of crystillazation. The first PDE I examine is,
11
∂T
∂t= −
k
pcp
∇2T + ψ (8)
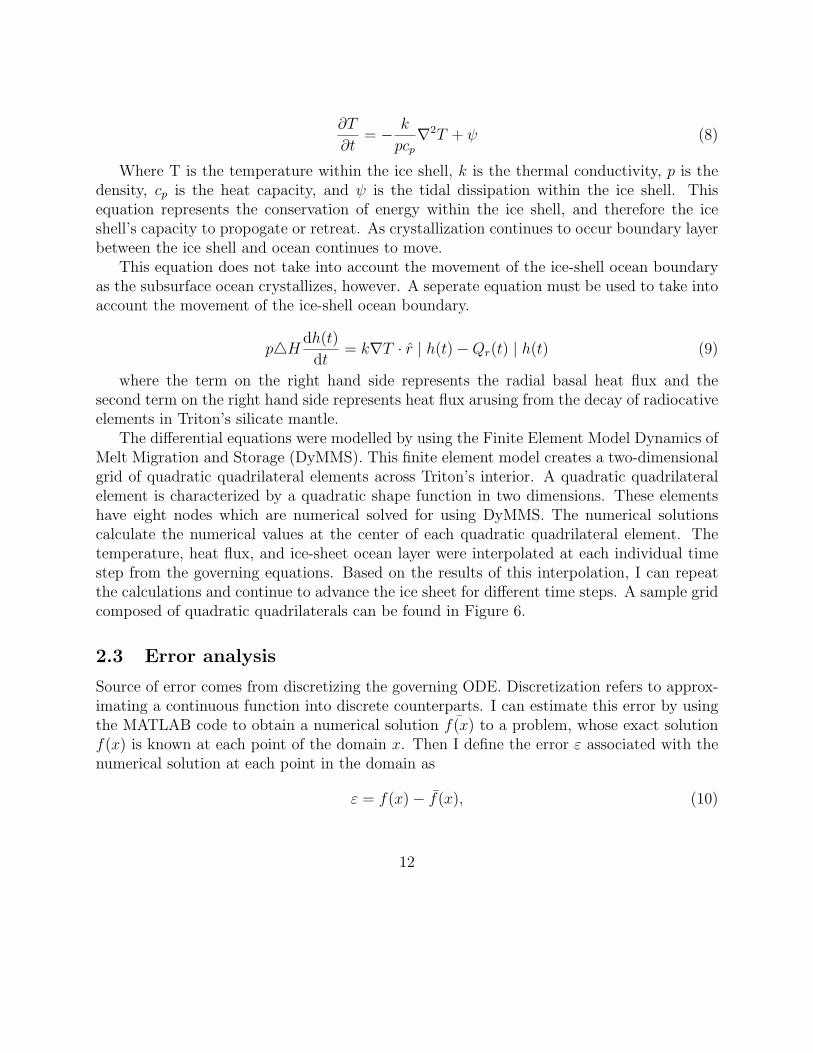
Where T is the temperature within the ice shell, k is the thermal conductivity, p is thedensity, cp is the heat capacity, and ψ is the tidal dissipation within the ice shell. Thisequation represents the conservation of energy within the ice shell, and therefore the iceshell’s capacity to propogate or retreat. As crystallization continues to occur boundary layerbetween the ice shell and ocean continues to move.
This equation does not take into account the movement of the ice-shell ocean boundaryas the subsurface ocean crystallizes, however. A seperate equation must be used to take intoaccount the movement of the ice-shell ocean boundary.
p△Hdh(t)
dt= k∇T · r | h(t) − Qr(t) | h(t) (9)
where the term on the right hand side represents the radial basal heat flux and thesecond term on the right hand side represents heat flux arusing from the decay of radiocativeelements in Triton’s silicate mantle.
The differential equations were modelled by using the Finite Element Model Dynamics ofMelt Migration and Storage (DyMMS). This finite element model creates a two-dimensionalgrid of quadratic quadrilateral elements across Triton’s interior. A quadratic quadrilateralelement is characterized by a quadratic shape function in two dimensions. These elementshave eight nodes which are numerical solved for using DyMMS. The numerical solutionscalculate the numerical values at the center of each quadratic quadrilateral element. Thetemperature, heat flux, and ice-sheet ocean layer were interpolated at each individual timestep from the governing equations. Based on the results of this interpolation, I can repeatthe calculations and continue to advance the ice sheet for different time steps. A sample gridcomposed of quadratic quadrilaterals can be found in Figure 6.
2.3 Error analysis
Source of error comes from discretizing the governing ODE. Discretization refers to approx-imating a continuous function into discrete counterparts. I can estimate this error by usingthe MATLAB code to obtain a numerical solution ¯f(x) to a problem, whose exact solutionf(x) is known at each point of the domain x. Then I define the error ε associated with thenumerical solution at each point in the domain as
ε = f(x) − f(x), (10)
12

Figure 6: Mesh grid composed of quadratic quadrilaterals. Propogation of ice sheet advance-ment was solved using Finite Element Method calculation in DyMMS.
13

0 0.5 10
0.2
0.4
0.6
0.8
1AnalyticalNumerical
0 0.5 10
0.2
0.4
0.6
0.8
1AnalyticalNumerical
0 0.5 10
0.2
0.4
0.6
0.8
1AnalyticalNumerical
Figure 7: Numerical and analytical solutions for the function f(x) = x3 for varying stepsizes. The top left graph has 10 steps, the top right 100, and the bottom center 1000.
Since the numerical solution is obtained over an array of points, it is useful to define theL1, L2, and L∞ norms associated with the error. These norms are defined as,
L1 =N
∑
k=1
∣
∣
∣f(xk) − f(xk)∣
∣
∣ , (11)
L2 =N
∑
k=1
√
∣
∣
∣f(xk) − f(xk)∣
∣
∣
2
, (12)
and
L∞ = max∣
∣
∣f(xk) − f(xk)∣
∣
∣ , (13)
where N is the size of the grid. As the grid size increases, the error arising from discretizationdecreases. The decrease in the error will be depicted by decrease in the associated normswith an increase in the grid size. I can define the following criterion for minimizing the errorassociated with grid size,
∂Lx
∂N→ 0, (14)
where Lx represents one of the norms defined above.To test the errors associated with grid size, I carried out a series of benchmark integrals,
where the numerically computed value of the integral was compared with the known exact
14

0 100 200 300 400 500 600 700 800 900 10000.25
0.3
0.35
n (number of steps)
L1 n
orm
0 100 200 300 400 500 600 700 800 900 10000
0.1
0.2
n (number of steps)
L2 n
orm
0 100 200 300 400 500 600 700 800 900 10000
0.1
0.2
n (number of steps)
Linf
nor
m
Figure 8: A plot of L1, L2, and L∞ norms as a function of grid size for the exact solutionf(x) = x3.
solution. One specific case is demonstrated in the series of plots in Figure 7. In these plots,I compared the numerical value of the integral
∫ x0
3x2dx with the exact value x3 over therange [0,1], for a number of different grid sizes.
The series of plots in Figure 8 display the L1, L2, and L∞ norms as a function of the gridsize for these tests. As the plots indicate, the slopes for all norms become nearly flat for gridsizes above 400. In the simulations, I use a grid size of 1000, well above the the thresholdwhere the criterion outlined in equation 14 is reached.
An additional source of error is the tidal love number k2 and the quality factor, QN . Inmy model, I use a single value for k2
QN
in Equation 3. This, however, is unrealistic because k2
is a nondimensional measure of the rigidity of a planetary body when exposed to tidal forces.As Triton’s ice-shell boundary propogates, the value of k2 will change with time as well. Todetermine the effect that changes in k2
QN
have on eccentricity dampening and semimajor axis,
I constructed a model varying k2
QN
by an order of magnitude. The model was executed for
orders of magnitude ranging for 10−2 to 10−4. The results of this model will be shown in thenext section.
15

0 1 2 3 4 53.5
3.6
3.7
x 105
Time (Ga)
a (k
m)
0 1 2 3 4 51.1
1.2
1.3x 10
−5
Time (Ga)
Fre
quen
cy (
1/s)
0 1 2 3 4 51
1.5
Time (Ga)
E/E
0
Figure 9: A schematic diagram outlining Triton’s capture by Neptune. During stage 1,Triton, one of the objects in the binary, orbits around the Sun. During stage 2, Triton iscaptured by Neptune’s gravity.
3 Results
Triton’s unique retrograde orbit leads it to slowly spiral in towards Neptune. As the plotin the top panel of Figure 9 indicates, over 3.5 Ga, Triton’s semi-major axis decays byapproximately 6%. The slow decay of the orbit leads to an increase in the orbital frequency,following Kepler’s third law. The plot in the middle panel of Figure 9 depict that the orbitalfrequency of Triton increasesr gently, by approximately 8% over this time period.
Despite the relatively modest changes in the semi-major axis and orbital frequency, theaverage tidal dissipation in Triton’s interior changes more substantially. As the plot in thelowermost panel in Figure 9 indicates, the normalized tidal heating E(t)/E(0), defined inequation 6, increases by nearly 50% over the course of time. The large increase in tidaldissipation has a number of important consequences for the structural evolution of Triton.All other parameters remaining constant, an increase in the available tidal heating, whichpartitions into Triton’s icy crust, warms up the crust and slows down the rate of freezing.As a result, this slow spin-up of Triton’s orbit likely enhances the chances of survival of asubsurface ocean.
16

Time (Ma)
0
446
4013
5 x 10⁻⁷ 8 x 10⁻⁵ 1 x 10⁻⁴Orbital
eccentricity
Tidal dissipation (nondimensional)
Figure 10: Variation of tidal dissipation within Triton over time.
This orbital evolution model was then coupled with the structural and thermal evolutionmodels as described by Figure 5. The result of these coupled models are shown in Figures10, 11, and 12 below. In Figure 10 we notice that at low eccentricities, tidal disspiationfalls to zero in 4 Ga. Tidal dissipation continues to be a factor, however, in eccentrictiesof 8x10⁻⁵ or higher. At even higher eccentricities, we notice that tidal dissipation remainsquite strong over time.
Both radial flux and and variation of temperature over time vary similarly to tidal dissi-pation. As by Figures 11 and 12, a subsurface ocean may be sustained at suffieciently loweccentricities. The ice shell-ocean front fails to completely reach the core in all but the lowesteccentricities in both these scenarios.
As previously mentioned in the error section, values of k2 and QN directly affect theorbital evolution (and therefore the structural evolution) of Triton. The outputs of my
17

Time (Ma)
0
446
4013
5 x 10⁻⁷ 8 x 10⁻⁵ 1 x 10⁻⁴Orbital
eccentricity
Radial flux (nondimensional)
Figure 11: Variation of radial flux within Triton over time.
18

Time (Ma)
0
446
4013
5 x 10⁻⁷ 8 x 10⁻⁵ 1 x 10⁻⁴Orbital
eccentricity
Temperature (nondimensional)
Figure 12: Variation of temperature within Triton over time.
19

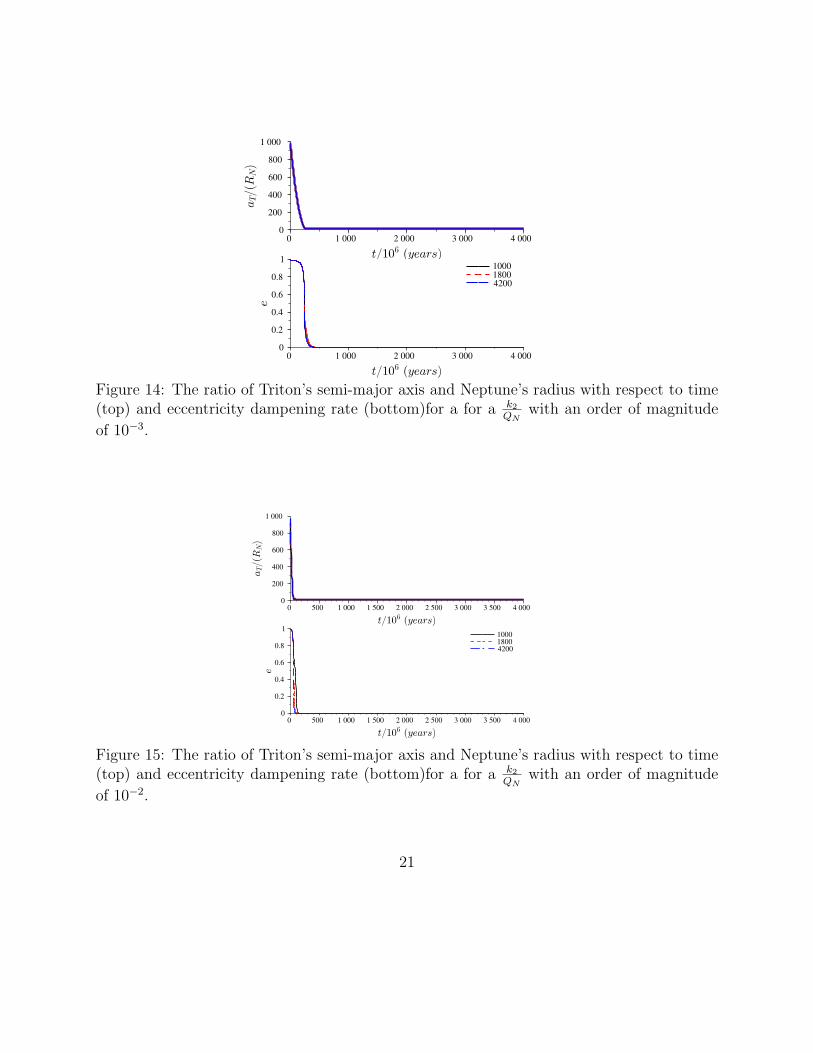
Figure 13: The ratio of Triton’s semi-major axis and Neptune’s radius with respect to time(top) and eccentricity dampening rate (bottom)for a for a k2
QN
with an order of magnitude
of 10−4.
model can be seen in Figures 13, 14, and 15. The different colored lines in these figuresrepresent different gridsizes which allow me to exam the error based on gridsize. The darkblue lines are associated with the highest gridsize and therefore the least amount of error.Figure 13 shows the slowest rate of change of semimajor axis and eccentricity dampeningrate and corresponds to the lowest value of k2
QN
at a magnitude of 10−4. In this scenario,
semi-major axis of Triton reaches its current state in A low value of k2
QN
indicates that Tritonis more rigid. As this value increases in size, the eccentricity dampening rate and rate ofdecrease in semimajor axis increases (Figures 14 and 15).
4 Suggestion for Future Work
At the end of the previous section I examined the affect that a change in k2
QN
may have
on the orbital evolution (and therefore structure) of Triton. For the coupled structuraland orbital evolution models, however, a single value for this parameter was used. Futuremodels should be able to incorporate dynamic values of k2
QN
as it changes with internalstructure. Incorporating this into the coupled structural and orbital evolution model willallow us to understand the potential likelihood of a subsurface ocean. Furthermore, thecurrent k2
QN
value of Triton needs to be better constrained. The magnitudes used in our error
analysis are predminantly based on numerical models. If the current k2
QN
value today can be
20
0 2 000 4 0001 000 3 000
0
1 000
200
400
600
800
0 2 000 4 0001 000 3 000
0
1
0.2
0.4
0.6
0.8
1000
1800
4200
Figure 14: The ratio of Triton’s semi-major axis and Neptune’s radius with respect to time(top) and eccentricity dampening rate (bottom)for a for a k2
QN
with an order of magnitude
of 10−3.
0 2 000 4 0001 000 3 000500 1 500 2 500 3 500
0
1 000
200
400
600
800
0 2 000 4 0001 000 3 000500 1 500 2 500 3 500
0
1
0.2
0.4
0.6
0.8
1000
1800
4200
Figure 15: The ratio of Triton’s semi-major axis and Neptune’s radius with respect to time(top) and eccentricity dampening rate (bottom)for a for a k2
QN
with an order of magnitude
of 10−2.
21

experimentally constrained, it should allow us to better determine the initial value of k2
QN
touse at time of capture.
5 Discussion
In a previous work, Gaeman et al. (2012) demonstrated that tidal heating arising from evenlow constant eccentricities can warm up the base of Triton’s icy shell and slow down therate of freezing. In this analysis, however, both eccentricity and orbital frequency remainedconstant. As the result from this work indicates, the increase in Triton’s orbital frequencyand the corresponding increase in tidal dissipation is nontrivial over geologic time. Suchan increase in tidal dissipation only occurs due to Triton’s unique retrograde orbit. Forexample, in the Earth-Moon system, the Moon recedes from the Earth while the length ofthe day gradually increases on Earth.
In the coupled orbital-structural-thermal evolution model we notice that a the subsurfaceocean fails to crystallize for all but the lowest eccentricities. The effects of tidal blanketing,most prominently visible in Figure 12, show the basal layer of the propogating ice shell at ahigher temperature than the upper portions. This increased basal heating seems to sustainthe subsurface ocean through time. At lower eccentricities, the subsurface ocean completelycrystallizes over time. The presence of a subsurface ocean based on these calculates iscertainly plausible. Specifically, polar oceans become increasingly likely at lower initialeccentricities of Triton post-capture. The effect of tidal blanketing at most eccentricitiesslows down the rate of crystallization drastically. This effect is most prominent in the polarregions.
Based on my current calculations, I conclude that a polar subsurface ocean may exist onTriton today. While a global subsurface ocean is also possible, it remains far less likely thatit is currently present under the outer ice-shell.
22

References
Agnor, C. B., and D. P. Hamilton, Neptune’s capture of its moon triton in a binary-planetgravitational encounter, Nature, 441 , 192–94, 2006.
Cuk, M., and B. J. Gladman, Constraints on the orbital evolution of triton, ASTROPHYS-
ICAL JOURNAL, 626 , L113–L116, 2005.
Gaeman, J. S., S. Hier-Majumder, and J. a. Roberts, Sustainability of a subsurface oceanwithin triton’s interior, Icarus , 220 , 339–447, 2012.
Goldreich, P., and S. Soter, Q in the solar system, Icarus , 5 , 375 – 389, 1966.
Greenberg, R., P. Geissler, G. Hoppa, B. Tufts, D. D. Durda, R. Pappalardo, J. W. Head,R. Greeley, R. Sullivan, and M. H. Carr, Tectonic processes on europa: Tidal stresses,mechanical response, and visible features, Icarus , 135 , 64 – 78, 1998.
McKinnon, W. B., and R. L. Kirk, Encyclopedia of the Solar System, chap. Triton, pp.483–502, Academic Press, 2007.
McKinnon, W. B., and A. C. Leith, Gas drag and the orbital evolution of a captured triton,Icarus , 118 , 392–413, 1995.
Murray, C. D., and S. F. Dermott, Solar System Dynamics , Cambridge University Press,1999.
Prockter, L. M., F. Nimmo, and R. Pappalardo, A shear heating origin for ridges on triton,Geophysical Research Letters , 32 , 2005.
Ross, M. N., and G. Schubert, The coupled orbital and thermal evolution of triton, Geo-
physical Research Letter , 17 , 1749–752, 1990.
Stern, S. A., and W. B. Mckinnon, FLUXES : EVIDENCE FOR SMALL KUIPER BELTOBJECTS AND RECENT GEOLOGICAL ACTIVITY, The Astronomical Journal , 119 ,945–952, 2000.
Zhang, K., and D. P. Hamilton, Orbital resonances in the inner neptunian system:ii. resonanthistory of proteus, larissa, galatea, and despina, Icarus , 193 , 267 – 282, 2008.
23