orbitofrontal cortex lesions attenuate affective biases
TRANSCRIPT
ORBITOFRONTAL CORTEX LESIONS ATTENUATE AFFECTIVE BIASES
IN ECONOMIC DECISION-MAKING
By
Joseph Un Kim
Thesis
Submitted to the Faculty of the
Graduate School of Vanderbilt University
in partial fulfillment of the requirements
for the degree of
MASTER OF ARTS
in
Psychology
December, 2011
Nashville, Tennessee
Approved:
David H. Zald, Ph.D.
Sohee Park, Ph.D.
Bruce D. McCandliss, Ph.D.

ii
ACKNOWLEDGEMENTS
This work was made possible through the generous support of the National Institutes of
Health, grant R01MH074567.
First and foremost, I owe a great debt to my advisor and mentor David Zald for
always keeping me grounded on this project and in my writing with his indispensable
feedback. Without his advice and criticisms, none of this would have been possible.
I am also grateful to have a supportive group of friends and peers in the Zald
Affective Neuroscience Laboratory. I especially thank them for stimulating discussions
and insightful questions that lead me to see the present data from perspectives different
from a narrow frame of mind I call my own.

iii
TABLE OF CONTENTS
Page
ACKNOWLEDGEMENTS ...............................................................................................ii
LIST OF TABLES ............................................................................................................. iv
LIST OF FIGURES ............................................................................................................ v
LIST OF ABBREVIATIONS ........................................................................................... vi
ABSTRACT ...................................................................................................................... vii
Chapter
I. INTRODUCTION .....................................................................................................1
Framing bias in economic decision-making .............................................................1
Significance of OFC function in the emergence of framing bias .............................4
OFC’s affective processing function influences evaluation of reward choices .........6
Current study ...........................................................................................................8
II. METHODS ...............................................................................................................10
Participants ............................................................................................................10
Verification of lesion location using structural MRI ..............................................14
Behavioral measure: framing task ..........................................................................16 III. RESULTS ................................................................................................................22
Catch-trials .............................................................................................................22
Choice-preference: percent gamble in trials overall ..............................................24
Choice preference: percent gamble in each framing type .....................................25
Shifting choice-preference: magnitude of framing bias .........................................26
Shifting choice-preference: choice-preference and amount offered ......................28
Sensitivity to relative monetary values ...................................................................29
No pie-chart vs. pie-chart ......................................................................................32
Reaction time .........................................................................................................35 IV. DISCUSSION ..........................................................................................................37 REFERENCES .................................................................................................................47

iv
LIST OF TABLES
Table Page
1. Means, Standard Deviations and Group Comparison of Demographic Data,
IQ, Memory, and Affect Scores .................................................................................13

v
LIST OF FIGURES
Figure Page
1. Overlap of lesions in OFC lesion patients.................................................................15
2. The financial decision-making task ...........................................................................20
3. Subject performance on catch-trials .........................................................................23
4. Mean proportion of trials chosen to gamble in trials overall ....................................24
5. Proportion of trials chosen to gamble under different frames ..................................26
6A. Framing bias magnitude: group comparison ............................................................27
6B. Framing bias magnitude: individually plotted ...........................................................27
7. Proportion of trials gambled for sure options varied in % of initial amount ............28
8. Comparison of proportion-gambled when sure options across trials offered
different relative value but identical absolute amount .............................................31
9. Linear regression slopes in pie-chart present and pie-chart absent trials .................34
10. Choice-preference patterns in pie-chart present and pie-chart absent trials ............34
11. Time taken to choose between two options under different frame types .................36

vi
LIST OF ABBREVIATIONS
ACC anterior cingulate cortex
ACOM anterior communicating artery
ANOVA analysis-of-variance
BA Brodmann area
BOLD blood oxygen level-dependent
CT computed tomography
DLPFC dorsolateral prefrontal cortex
Fig. figure
fMRI functional magnetic resonance imaging
FOV field of view
FSIQ full scale intelligence quotient
MNI Montreal Neurological Institute
MRI magnetic resonance imaging
ms millisecond
n.s. not significant
OFC orbitofrontal cortex
OMPFC orbitomedial prefrontal cortex
PANAS-X Positive and Negative Affect Schedule –Expanded Form
RT reaction time
SD standard deviation
SE standard error
T Tesla
TE echo time
TR repetition time
VLPFC ventrolateral prefrontal cortex
VMPFC ventromedial prefrontal cortex
VUIIS Vanderbilt University Institute of Imaging Sciences
WAIS-III Wechsler Adult Intelligence Scale – Third Edition
WASI Wechsler Abbreviated Scale of Adult Intelligence
WMS-III Wechsler Memory Scale – Third Edition

vii
ABSTRACT
The orbitofrontal cortex has been speculated to play an important role in the
processes that allow emotional factors to influence decision-making. In recent
neuroimaging studies, orbitofrontal activity patterns have been linked to framing bias
susceptibility in economic choice-behavior. However, it is still unclear whether
orbitofrontal function directly contributes to the emergence of such observed framing bias.
Hence, in the current study, we sought to examine the effect of orbitofrontal cortex
(OFC) lesions on framing bias by investigating economic choice-behavior of twelve OFC
lesion patients using a financial decision-making task. Results showed OFC lesion patients
exhibit marked reduction in framing bias, which indicated OFC lesions disrupt processes
that adapt choice-behavior to contrasting affective contexts. Furthermore, OFC lesion
patients were no more likely than controls to choose the gamble option over the sure
option and vice versa in the task overall, which suggested that their reduced framing bias
was neither due to generalized disinhibition of risk-taking tendencies, nor a broad and
nonspecific shift in choice-preference irrespective of framing manipulations. Critically,
OFC lesion patients revealed deficits in adjusting their choices according to varying
reward magnitude and distinct relative reward values. This study provides key evidence in
support of the hypothesis that the orbitofrontal cortex serves a critical role in guiding
economic decision-making by integrating salient information about the affective context
of potential choices.
1
CHAPTER I
INTRODUCTION
“It is not to be forgotten that what we call rational grounds for our beliefs are
often extremely irrational attempts to justify our instincts.”
- Thomas H. Huxley from Aphorisms and Reflections
Framing bias in economic decision-making
Decision-making is heavily influenced by the emotional context in which the
choices are presented. Cancer treatment options can be made less appealing to patients,
as well as to expert physicians, when the anticipated treatment outcome is presented as
mortality rate rather than survival rate. Individuals are more willing to accept a business
contract under negotiation when the same offer is illustrated as gains rather than losses on
their part. Even moral judgment on an ethical dilemma can be swayed by changing the
word-order and phrasing that are used to describe the available courses of action (McNeil,
Pauker, Sox, & Tversky, 1982; Neale & Bazerman, 1985; and Petrinovich & O’Neill,
1996). This psychological phenomenon, known as the Framing effect, has been repeatedly
demonstrated through a wealth of empirical data generated from a diverse set of

2
experimental paradigms across various domains of human judgment that involves
decision-making (Kühberger, 1998).
Two psychologists, Kahneman and Tversky, recognized such deviation from
rational decision-making as both systematic and pervasive in normative economic choice-
behavior and further integrated this insight as a key tenet in their Prospect Theory
(Kahneman & Tversky, 1979; Tversky & Kahneman, 1981). As an alternative to the
Expected Utility Theory, which assumed individuals to be coolheaded, consistent, and logical
decision-makers, the Prospect Theory acknowledged the counter-utilitarian and
impressionable nature of the human mind and incorporated a behavioral model of
economic choices that more successfully illustrated economic decision-making in the real
world. A key piece of insight from this model was that individuals are more sensitive to
losses than gains, and therefore impose a skewed weighting of importance in their
economic choices by showing a greater degree of bias against choices perceived as losses
compared to those perceived as gains (Tversky & Kahneman, 1992; Novemsky &
Kahneman, 2005). Because attention paid to gains and losses is both inherent and salient
in economic decision-making, it is likely to be particularly susceptible to the influence of
framing biases.
Taking advantage of this knowledge, cognitive neuroscientists have been

3
employing economic decision-making tasks in neuroimaging studies to identify and
elucidate the neural mechanisms from which framing biases originate. Recent
neuroimaging studies have investigated the neural correlates of framing effect in human
subjects, results of which appear to suggest that regions of the orbitofrontal cortex (OFC)
are a key component contributing to the manifestation of framing biases. De Martino and
colleagues (2006) conducted an fMRI study using a binary forced-choice financial
decision-making task in healthy normal subjects to investigate the neural correlates
associated with changes in choice behavior when options with equal mathematical value
are framed as losses or gains (see task description in Methods section). Replicating common
behavioral results associated with Prospect Theory (Tversky & Kahneman, 1992; Kahneman
& Tversky, 1979), they found healthy normal individuals showed greater bias against
economic choices framed as losses compared to choices framed as gains. More
interestingly, the study also found a strong correlation between individual differences in
the degree of framing bias displayed in their behavioral choice-patterns and blood oxygen
level-dependent (BOLD) activation level in the orbitomedial prefrontal cortex (OMPFC).
In particular, individuals who showed greater susceptibility to framing bias in the task
exhibited diminished medial OFC activity (De Martino, Kumaran, Seymour, & Dolan,
2006).

4
Significance of OFC function in the emergence of framing bias
Admittedly, it is still unclear as to what exactly the observed negative correlation
between OFC activation and the framing bias magnitude reported in the De Martino et
al. (2006) study represents with regards to the neurocognitive mechanisms involved.
Nevertheless, one could hypothesize that OFC’s role in framing bias is directly related to
evaluation of potential reward choices. This hypothesis implicates the preexisting
knowledge about the OFC’s function to the emergence of framing bias. From this
perspective, activity patterns in the OFC should reflect its influence on specific processes
associated with valuation of reward choices. Indeed, accumulating evidence from
numerous studies within the most recent decade suggest the OFC’s function in decision-
making as encoding reward value associated with various types of reward choices in both
humans (Plassmann, O’Doherty, & Rangel, 2007; FitzGerald, Seymour, & Dolan, 2009;
Zald, 2009; Chib, Rangel, Shimojo, & O’Doherty, 2009; Kennerley, Behrens, & Wallis,
2011) and in nonhuman primates (Tremblay & Schultz, 1999; Padoa-Schioppa & Assad,
2008).
While OFC appears to be a key structure involved in value-coding of reward
choices, it is worth noting that there are other regions in the brain besides the OFC that
contribute to processing affective information related to economic decision-making. As is
5
the case with other complex behaviors, cognitive processes distributed throughout the
brain work in concert to give rise to economic choice behavior. For instance, the
amygdala and the anterior cingulate cortex (ACC) are two amongst several regions
known to have significant affective processing functions. The amygdala, as already noted
earlier, is thought to bias decision-making by detecting emotional salience of stimuli
(Bechara, Damasio, Damasio, & Lee, 1999). The ACC, especially the dorsal portion, has
been found to be responsive to outcomes considered aversive or signaling reductions in
reward (Bush, Vogt, & Holmes, 2002). Moreover, prefrontal regions other than the OFC,
such as the dorsolateral prefrontal cortex (DLPFC), could contribute to decision-making
by modulating the manner in which affective information is processed in economic
decision-making. However, the OFC is known to have anatomical features fundamentally
distinct from this and other prefrontal regions, resulting in computational capacity
dissimilar from those regions (Zald, 2007). This suggests the possibility that the OFC
could provide functionally distinct contributions to economic decision-making by
mediating the reward valuation process of choice behavior (Padoa-Schioppa, & Assad,
2006, Wallis, 2007; Plassmann et al., 2007).

6
OFC’s affective processing function influences evaluation of reward choices
Reliable prediction and evaluation of reward value is important in decision-
making (Schultz & Dickinson, 2000). By the same token, without a reliable and context
appropriate evaluation of different reward signals, economic decision-making processes
can become very inconsistent (let alone rational). Because the availability of potential
reward options frequently changes in the real world, encoding the relative reward value
associated with the potential options allows for an efficient and flexible comparison of
choices. OFC appears to be contributing to the evaluation of reward in this regard. For
instance, monkey single-cell recording studies have shown increased activity in the OFC
in response to expectation of the preferred reward between two options being compared.
This is true regardless of the physical reward properties, (Tremblay & Schultz, 1999) as
well as for relative preference of both rewarding and aversive outcomes (Hosokawa, Kato,
Inoue, & Mikami, 2007).
Furthermore, the OFC seems to be critical for processes that adjust the value
assigned to available choices based on changing motivational significance of specific
stimuli. Non-human primate studies show monkeys with OFC lesion continue to select
foods that their healthy counterparts would have given up after becoming selectively

7
satiated (Izquierdo, Suda, & Murray, 2004). Comparably, in a human neuroimaging
study, participants who were fed to satiety on one type of food showed selective decrease
in caudal OFC region’s BOLD signal in response to the specific stimuli of the satiated
food. This signal decrease was coupled with subjective reduction in desirability of the
satiated food (Kringelbach, O’Doherty, Rolls, & Andrews, 2003). Non-human primate
lesion studies also appear to confirm the OFC’s key role in determining behavioral
responses to reward-related decision-making. For example, an excitotoxic lesion to a
monkey OFC causes impairment in suppressing previously learned stimulus-reward
association (Dias, Robbins, & Roberts, 1996).
Taken together, the OFC’s activity appears to be sensitive to shifting motivational
values assigned to various rewards and reward predicting signals, depending on the
desirability and the availability of different alternatives. Much research has been done to
elucidate the OFC’s functions in regards to its processing capacity relevant to economic
decision-making, results of which suggest its important contribution to subjective
valuation of reward. These findings suggest that the OFC is a key component for
promoting choice-behavior adjustments in response to altered contingencies between the
reward and reward predicting stimuli. Correlational evidence, however, from human
neuroimaging studies investigating the neural correlates of framing bias may not be

8
sufficient to propose a causal link between the OFC and its hypothesized function in
promoting the emergence of framing biases. Also, given available non-human primate
lesion data, it is not unreasonable to suspect that the OFC may causally influence
affective and motivational aspects of economic decision-making such as framing biases
associated with monetary loss and gain.
Current Study
Here, we investigate to what extent OFC lesions in human subjects influence the
normative patterns of economic decision-making, where choice-preference are flexibly
adjusted according to the affective context in which available monetary reward option are
presented. More specifically, we examined (i) whether OFC lesions undermine the
normal process of reward-choice evaluation by disrupting processes that bias choice-
preference in contrasting affective context (i.e., monetary reward choices framed as losses
or gains) and (ii) whether the putative deviation from normative choice-patterns in OFC
lesion patients reflect generalized disinhibition of risk-taking tendencies and a broad shift
in choice-preference; or more specific alteration associated with sensitivity to reward
magnitudes. To addresses these questions, we used an economic decision-making task
previously used in the De Martino et al. (2007) study.

9
In accordance with prior studies that suggest OFC activity codes for subjective
value of reward choices (Trembley & Schultz, 1999; Tom, Fox, Trepel, & Poldrack, 2007)
we predicted that OFC lesions patients would show less change in response to different
affective contexts in which the monetary reward choices are presented. Specifically, we
predicted that OFC lesion patients would show smaller magnitude of framing bias such
that they would exhibit a lesser degree of choice-preference change in response to being
presented with choices framed as losses versus gains. It was also predicted that lesion
patients would show reduced sensitivity to varying reward magnitude compared to
demographically matched controls.

10
CHAPTER II
METHODS
Participants
OFC lesion patients
Twelve patients with OFC lesion were included in the study. They were recruited
through the Vanderbilt University Medical Center Neurosurgery and Radiology Clinics.
The Medical Center electronic data repository, Star-Panel, was used to identify OFC
patients eligible for participation in the study. Star-Panel’s Neurosurgery and Radiology
clinic databases were queried using OFC-related keywords: e.g., “orbitofrontal”; “inferior
frontal”; “subfrontal”; “gyrus rectus”; “anterior communicating artery”. Relevant
medical records of identified patients were reviewed to determine their eligibility, and
eligible individuals were contacted in writing, to which they could respond their interest
in study participation. All patients had a brain lesion affecting the orbitofrontal cortex
(i.e., ventral surface of the prefrontal cortex that include gyrus rectus; medial orbital
gyrus; anterior and posterior orbital gyri; and lateral orbital gyrus). The site of the lesion
was ascertained by acquiring a brain MRI or CT scan in addition to radiologists’ or

11
neurosurgeons' reports. Exclusion criteria included damage outside the orbitofrontal
cortex, alcohol or drug dependence, and a full-scale intelligence quotient (FSIQ) below a
cut-off of 75 (1 standard deviation below the mean) in the Wechsler Adult Intelligence
Scale – Third Edition (WAIS-III). Five of the patients were male and 7 were female, and
their ages ranged from 26 to 56 years (mean = 42.6 years, SD =10.9 years). The time
between surgery and their taking part in the study ranged from 1 to 12 years. Three had
suffered from ruptured anterior communicating artery aneurysm which was clipped, 2
had suffered from focal head injury, and 7 other patients had undergone resection of
portions of the OFC due to the following: 3 from meningioma, 2 from intractable focal
epilepsy, 1 from cavernous angioma, and 1 from neurofibroma. The study protocol was
approved by the Vanderbilt University Institutional Review Board. A complete
description of the study was provided to all participants, and all subjects provided written
informed consent.
Healthy controls
Twelve demographically matched healthy controls were recruited through
advertisements posted on local craigslist webpage, a high-traffic online community
featuring advertisements and forums. Each control subject was specifically recruited to
match, within a pre-defined margin of difference, the demographics of the OFC lesion

12
patient that they were matched to. Specifically, matched-controls were no more than 3
years younger or older; and within 2 years of difference in formal education level
compared to the patient subject they were matched to. Controls were also matched for
sex. Exclusion criteria included past history of head injury, drug and alcohol dependence,
current use of psychoactive medications, past or current diagnoses of major psychiatric
disorders, and a full-scale intelligence quotient (FSIQ) below a cut-off of 75 (1 standard
deviation below the mean) as measured by the Wechsler Abbreviated Scale of Intelligence
(WASI). Healthy controls were well matched to OFC lesion patient participants’ age
(matched-pairs t11 = - 1.0, p = n.s.), sex (all identical to matched patient), education level
(matched-pairs t11 = 0.65, p = n.s.), full scale IQ (matched-pairs t11 = 1.16, p = n.s.) and
general memory (matched-pairs t11 = 1.62, p = n.s.) from the Wechsler Memory Scale –
Third Edition (WMS-III).
Questionnaire: State affect
Additionally, state (cf., as opposed to trait) measure of mood was assessed using a
24-item version of the Positive and Negative Affect Schedule – Expanded Form (PANAS-
X; Watson & Clark, 1999). The PANAS-X, a well-validated self-report measure of mood,
was administered to all subjects on the day of testing prior to completing the economic
decision-making task. Questions in the PANAS-X was comprised of 24 affectively

13
valenced words that subjects indicate the “extent to which they feel this way, right now”
using a Likert scale from 1 (indicating “Not at all”) to 7 (indicating “Extremely”). For the
present study, we used the total positive affectivity (PANAS-PA) and negative affectivity
(PANAS-NA) scores (defined in Watson & Clark, 1999). There was no between-group
difference in either the positive affect scores (matched-pairs t11 = -0.90, p = n.s.) or in the
negative affect scores (matched-pairs t11 = -1.18, p = n.s.). A summary of demographics
and neuropsychological testing data is shown in Table 1.
Table 1. Means, standard deviations and group comparison of demographic data, IQ,
memory, and affect scores
Variable OFC lesion Healthy controls N Mean SD N Mean SD Age 12 42.6 10.9 12 42.1 11.2
Male/Female 12 5/7 12 5/7
Education (years) 12 15 2.7 12 14.7 3.2
Full Scale IQ (WAIS-III or WASI) †
12 110 * 13 12 116 10
General Memory (WMS-III) 12 108 13 12 117 16
PANAS-PA 12
45.8
2.9
12
43.0
10.6
PANAS-NA
12
27.7
3.9
12
25.2
5.3
* One OFC patient’s FSIQ was estimated from Performance IQ (PIQ) due to incomplete test data.
† WAIS-III was administered to OFC lesion patients and WASI was administered to healthy controls.

14
Verification of Lesion Location using Structural MRI
For each OFC lesion patient, structural brain MRI scans were completed on a 3T
Philips Intera Achieva scanner (The Netherlands) at the Vanderbilt University Institute of
Imaging Sciences (VUIIS). High- resolution T1-weighted structural images (TR = 8.969
ms; TE = 4.6 ms; in-plane resolution = 1 mm2; FOV=24x24cm2; matrix size=256x256;
slice thickness = 1 mm; no gap) were acquired and used to ascertain the presence,
location, and extent of the OFC lesion in each patient subject. Individual MRI scans were
carefully screened to ensure that no lesion was present outside the OFC region. One
subject was excluded from the study due to additional lesion in the parietal lobe. The T1-
weighted structural images for two participants were acquired on a 1.5 T Philips scanner
(in-plane resolution = 1 mm2; slice thickness = 1.2 mm) due to contra-indications for
higher field scanning. The common regions of OFC lesions were determined by creating
an overlay images using the MRIcron image analysis program
(http://www.cabiatl.com/mricro/mricron/; Rorden, Karnarh, & Bonilha, 2007).
Patients with an OFC lesion due to a ruptured ACOM aneurysm – all of whom had
lesions in the posterior portion of the gyrus rectus, right greater than left – were not
included in the overlay image, due to technical difficulties creating an individual lesion
maps (i.e., The nature of their lesion was vascular in origin, hence lesion-mapping

15
method used for surgical resections and focal damage cases did not work on structural
images with ACOM aneurysm). Lesions were overlaid on an MNI template brain map
provided by the MRIcron program. The most common overlap was found in the medial
orbital gyrus, left greater than right (MNI coordinates x = - 12, y = 49, z = - 15, Fig. 1).
Figure 1. Overlap of lesions in OFC lesion patients (n=9), excluding ACOM aneurysm
cases. Heat-map indicates the density of lesion-overlap (i.e., number of patients showing
lesion to the colored area).

16
Behavioral Measure: Framing Task
Task Design
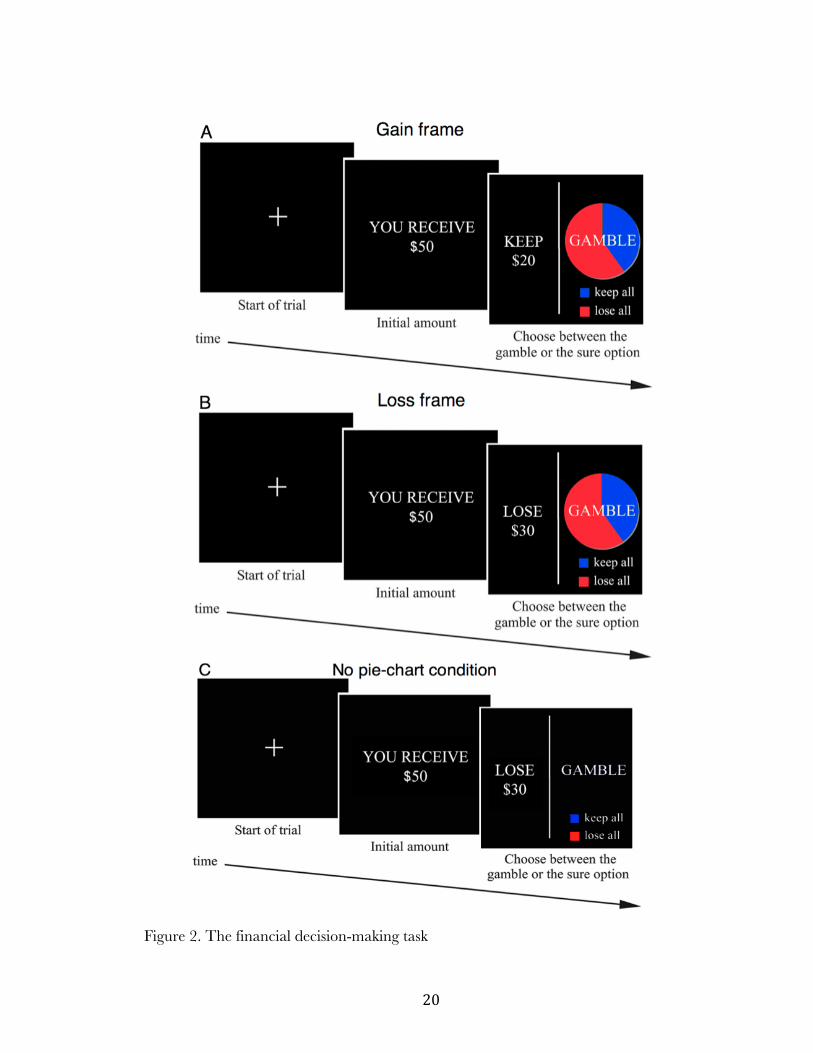
A computerized financial decision-making task adapted from De Martino et al.
(2006) was used to assess the effect of OFC lesions on normative framing biases associated
with economic choices (Fig. 2). In this task, subjects received a cue indicating the amount
of money that they would initially receive in that trial, after which they had to choose
between a sure option and a gamble option presented in the context of two different
frames. In the beginning of each trial, a fixation cross was shown at the center of a
computer display for 2000 ms (“Start of trial”, Fig. 2). Subjects were then presented with,
for 2000 ms, the amount of money they would initially receive in that trial: $50, $75, or
$100, randomized across trials (“Initial amount”, Fig. 2). However, they were not
guaranteed to keep this initial amount received. Rather, in the subsequent screen
(“Choose between the gamble or sure option”, Fig. 2), subjects were asked to choose,
within a 2000 ms window, between the sure option (to keep a portion of the initial
amount with 100% certainty); and the gamble option (to gamble for a chance to keep the
entire initial amount given with a known probability of winning or losing). In case the
subject did not respond within the 2000 ms window, it was recorded as a no-response trial
and excluded from analysis. The proportion of trials with no response was minimal in the

17
OFC lesion group (mean % no response = 0.58%, SD = 0.51) as well as the control
group (mean % no response = 1.25%, SD = 1.29), and there was no difference in the
proportion for trials not responded (matched-pairs t11 = 1.61, p = n.s.). The sure option
was formulated as either the amount of money to “KEEP” from the initial starting
amount (e.g., “KEEP $20” of the $50, gain frame, Fig. 2A) or as the amount of money to
“LOSE” from the initial amount (e.g., “LOSE $30” of the $50; loss frame, Fig. 2B). The
proportion of initial amount offered in sure options was varied such that 20%, 40%, 60%,
or 80% of the initial amount was offered for both framing types. For example, in case $50
was given as the initial amount, monetary gain of $10 (20%), $20 (40%), $30 (60%), or
$40 (80%) appeared as the sure option. The gamble option was identical in both frames
and was represented as a pie-chart depicting the probability of winning (blue), or losing
(red). The probability of winning/losing depicted in a pie-chart was: 20/80, 40/60,
60/40, or 80/20. The expected value of the sure option and the gamble option within a
given trial were matched such that the monetary amount offered through the sure option
was equivalent to the mathematical product between the probability of winning in the
gamble option (as shown via a pie-chart) and the initial amount the subject would win. In
order to examine study subjects’ choice-preference pattern and risk-taking under
uncertainty (i.e., unknown probability), trials where the pie-chart is not present (40% of

18
all trials) were also included in the task (Fig. 2C). Because the pie-charts conveyed to
subjects the probability of winning if they were to choose the gamble option, missing pie-
charts meant unknown risk of not winning any money on that trial (or unknown chance
of winning the entire sum of money).
Catch-trials
In order to gauge the two groups’ ability to make optimal choices based on
numerical comparison of dissimilar expected monetary values, “catch-trials” were
included in the task (De Martino et al., 2006). In this type of trial (20% of the all trials),
the expected value of the sure and gamble option were markedly unbalanced. Two types
of catch trials were used for each: sure weighted - where the sure option was 50% of the
starting amount and the gamble option was a 5% probability of winning the starting
amount; and gamble weighted - where the sure option was 50% of the starting amount and
the gamble option was a 95% probability of winning the starting amount.
Task instruction and administration
Subjects were instructed to press the left arrow key (ß) for the sure option and the
right arrow key (à) for the gamble option as the sure option always appeared on the left
side of the computer display and the gamble option always on the right. After task

19
instructions, all subjects completed a block of 8 practice trials while the experimenter
observed to ensure that subjected comprehended the task instructions given. All subjects
were administered 360 trials in total (144 trials with pie; 144 trials with no-pie, 72 catch-
trials), evenly divided into 6 blocks with 60 trials within each block.
On trials where subjects chose the gamble option, subjects were not given any
feedback about whether or not they won the gamble in individual trials. Instead, subjects
were given a chance to take a brief period of rest after completing each block, during
which they were presented with the total amount they have accumulated so far in the
task, which included earnings from both the sure option as well as the gamble option.
Subjects were informed that they would receive a sum proportional to their total winnings
at the end of the experiment (up to $ 20).
For analyses using between-subjects paired t-tests, each control subject was yoked
to one specific OFC lesion patient subject that they were matched to in terms of
demographic variables.
20
Figure 2. The financial decision-making task

21
Choice-preference slope analysis
Each subject’s sensitivity to varying relative reward magnitude was quantified by
examining the slope of choice-preference change relative to four different proportions
offered for the sure option. For the sure option of a given trial, subjects were offered 20%,
40%, 60%, or 80% of the initially received amount, from which they could choose to
accept this sure option, or alternatively choose to gamble for a chance to keep the entire
amount. For all subjects, proportion of trials chosen to gamble was plotted on a two-
dimensional space for each of the four different relative monetary values (20%, 40%, 60%,
and 80%), by assigning to each point an arbitrary x-axis coordinate that is equidistant
from their adjacent proportion(s) (specifically, 20%: x = - 1.5, 40%: x = - 0.5, 60%: x =
0.5, 80%: x = 1.5). For each subject, a simple linear regression line slope was derived
from these four points on a plane (i.e., coefficient b in the formula y = b x). Linear slopes
for gain and loss framed trials were calculated separately.
22
CHAPTER III
RESULTS
Framing Task Results
Catch-trials
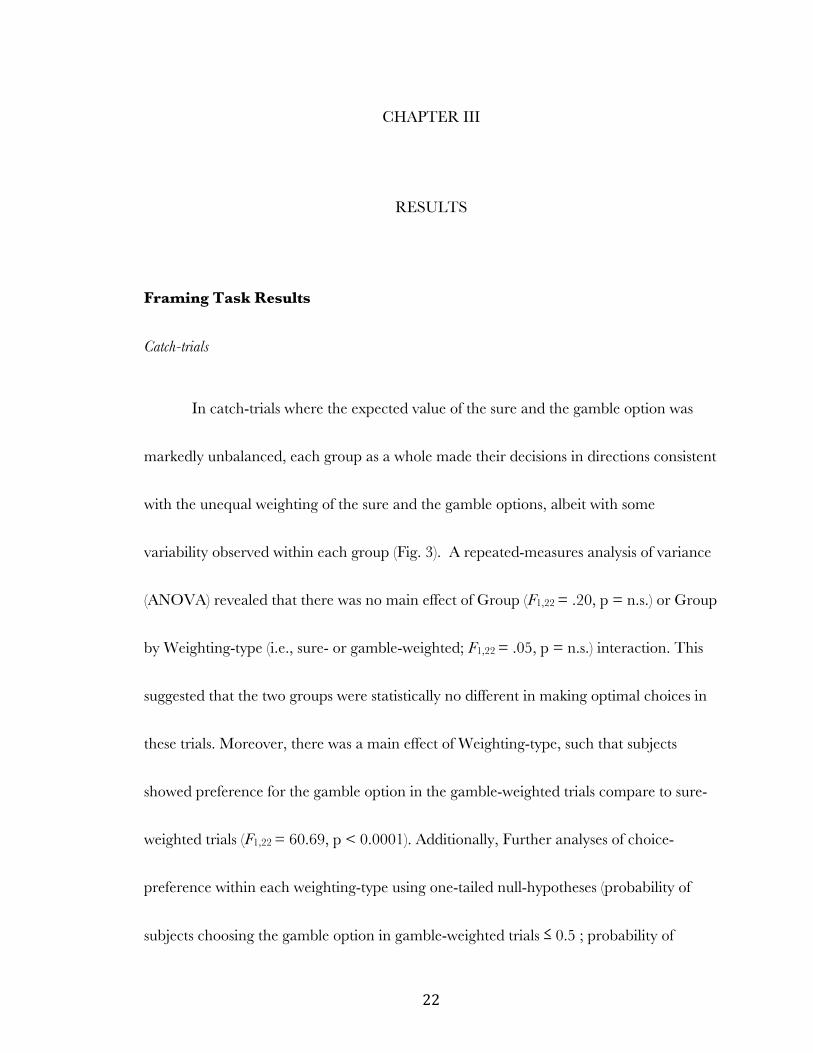
In catch-trials where the expected value of the sure and the gamble option was
markedly unbalanced, each group as a whole made their decisions in directions consistent
with the unequal weighting of the sure and the gamble options, albeit with some
variability observed within each group (Fig. 3). A repeated-measures analysis of variance
(ANOVA) revealed that there was no main effect of Group (F1,22 = .20, p = n.s.) or Group
by Weighting-type (i.e., sure- or gamble-weighted; F1,22 = .05, p = n.s.) interaction. This
suggested that the two groups were statistically no different in making optimal choices in
these trials. Moreover, there was a main effect of Weighting-type, such that subjects
showed preference for the gamble option in the gamble-weighted trials compare to sure-
weighted trials (F1,22 = 60.69, p < 0.0001). Additionally, Further analyses of choice-
preference within each weighting-type using one-tailed null-hypotheses (probability of
subjects choosing the gamble option in gamble-weighted trials ≤ 0.5 ; probability of

23
subjects choosing the gamble option in sure-weighted trials ≥ 0.5) revealed that controls,
irrespective of framing-type, preferred the gamble option in the gamble-weighted trials
(gain-frame: t11 = 2.16, p = 0.0267; loss-frame: t11 = 2.79, p = 0.0088), and preferred the
sure option in sure-weighted trials (gain-frame: t11 = - 13.70, p < 0.0001; loss-frame: t11 =
- 12.22, p < 0.0001). Similarly, OFC lesion patients, irrespective of framing-type,
preferred the gamble option in the gamble-weighted trials (gain-frame: t11 = 1.85, p =
0.0459; loss-frame: t11 = 1.96, p = 0.0379), and preferred the sure option in sure-weighted
trials (gain-frame: t11 = - 5.01, p < 0.0004; loss-frame: t11 = - 4.06, p < 0.0019). This
provided evidence that OFC lesion patients were able to make optimal decisions based on
numerical comparison of expected value associated with potential choices.
Figure 3. Subject performance on catch-trials

24
Choice-preference: percent gamble in trials overall
Patients with OFC lesions were no more likely than controls to choose the gamble
option in trials overall (Fig. 4). On average, OFC lesion patients chose the gamble option
in 43.6% (SD = 20) of all trials, and controls chose the gamble option in 42.9% of all
trials (SD = 14). A matched-pairs t-test revealed that there was no group difference in
proportion of trials chosen to gamble in trials overall (matched-pairs t11 = - 0.09, p = n.s.).
Furthermore, overall choice preference for the gamble option or the sure option was
statistically no different from chance (= 0.5) in either of the two groups (OFC lesion
group: t11 = - 0.69, p = n.s.; control group: t11 = -1.69, p = n.s.). This indicated that the
subjects displayed neither risk-seeking nor risk-aversion bias in their choice-preference.
(Each error bar is constructed using a 95% confidence interval of the mean. Blue dotted
line denotes the hypothetical point of complete ambivalence between two options)
Figure 4. Mean proportion of trials chosen to gamble in trials overall

25
Choice preference: percent gamble in each framing type
Patients with OFC lesion as well as healthy controls were both more likely to
choose the gamble option when the sure option was framed as losses than when it was
framed as gains (Fig. 5). A repeated-measures ANOVA with Group as a between-subjects
factor showed that there was no between-subjects main effect of Group (F1,22 = .27, p =
n.s.). However, there was a significant within-subjects main effect of Framing-type (gain
vs. loss) such that proportion of trials subject chose to gamble in the loss frame was greater
than that in the gain frame (F1,22 = 29.26, p < 0.0001 ). Additionally, a significant
Framing-type by Group interaction was found (F1,22 = 4.9137, p = 0.0373), which
indicated that the degree of increase in proportion gambled in the loss frame relative to
the gain frame was dependent on the group, where the control group showed greater
increase than the OFC lesion patient group.
Within the OFC lesion group, mean percentage of trials chosen to gamble was
42.4% (SD = 21) of the gain frame trials, and this increased to 48.9% (SD = 23) in the
loss frame trials (mean difference of 6.5%; matched-pairs t11 = 2.5, p = 0.0297). Likewise
within the control group, mean percentage of choices for the gamble option was 35.8%
(SD = 17) in the gain frame, whereas this increased to 50.4% (SD = 16) in the loss frame
trials (mean difference of 14.6%; matched-pairs t11 = 4.68, p = 0.0007).

26
matched-pairs t-tests: * p < 0.05, ** p < 0.01, *** p < 0.001
(Each error bar is constructed using a 95% confidence interval of the mean.)
Figure 5. Proportion of trials chosen to gamble under different frames
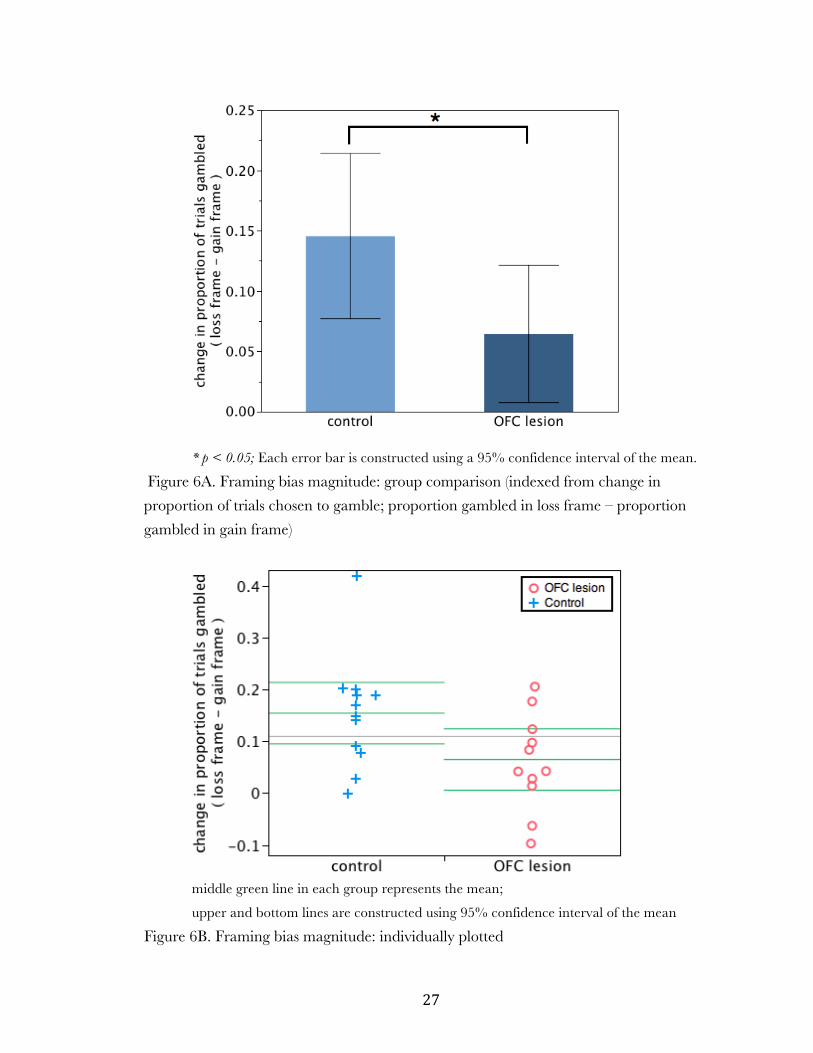
Shifting choice-preference: magnitude of framing bias
The magnitude of the OFC lesion group’s framing bias (mean = 6.5%, SD = 8.9)
was significantly smaller (Fig. 6) than that of the control group’s (mean = 14.6%, SD =
10.8): matched-pairs t11 = 2.45, p = 0.0321. The magnitude of framing bias was
estimated for each individual from the difference in proportion of trials chosen to gamble
between the gain and loss frame conditions (i.e., magnitude of framing bias = % gamble
loss frame - % gamble gain frame).
27
* p < 0.05; Each error bar is constructed using a 95% confidence interval of the mean.
Figure 6A. Framing bias magnitude: group comparison (indexed from change in
proportion of trials chosen to gamble; proportion gambled in loss frame – proportion
gambled in gain frame)
middle green line in each group represents the mean;
upper and bottom lines are constructed using 95% confidence interval of the mean
Figure 6B. Framing bias magnitude: individually plotted

28
Shifting choice-preference: choice-preference and amount offered
OFC lesion patients’ choice pattern in response to varying proportions of initial
amount offered for the sure option indicated their diminished behavioral sensitivity to
variations in monetary value (Fig. 7). Comparison of linear slopes derived from choice
patterns in varying reward magnitudes (see Methods for mathematical derivation used)
indicated that controls exhibited a robust decrease in preference for the gamble option as
the proportion offered from the initial amount increased in the sure option, and these
negative slopes were significantly different from zero (gain frame: mean slope = -17.7, SD
= 12, t11 = - 5.05, p = 0.0004; loss frame: mean slope = -15.4, SD = 14, t11 = - 3.89, p =
0.0025). In contrast, the OFC lesion group’s linear slope was not significantly different
from zero in either of the two framing conditions (gain frame: mean slope = -0.04, SD =
22, t11 = - 0.70, p = n.s.; loss frame: mean slope = -0.004, SD = 21, t11 = - 0.07, p = n.s.).
(Each error bar is constructed using a 95% confidence interval of the mean.)
Figure 7. Proportion of trials gambled for sure options varied in % of initial amount

29
Additionally, the OFC lesion group’s slope was significantly less steep compared
to the control group’s slope. Levene’s test for unequal variances revealed unequal
variances between the two groups (gain frame: F1,12 = 7.84, p = 0.0104; loss frame: F1,12 =
3.46, p = 0.0764), therefore, a direct group comparison of the slopes were completed
using the Welch’s t-test that assumes unequal variances between groups. Based on the a
priori prediction that the OFC lesion patient groups’ reward magnitude sensitivity would
be reduced compared to controls (i.e., slope would be less steep than that of healthy
controls), using one-tailed tests was justified. As predicted, the OFC lesion group’s slope
was less steep in both the gain frame (Welch’s t17.1 = 1.83, 1-tailed p = 0.0426) as well as
the loss frame (Welch’s t18.8 = 2.05, 1-tailed p = 0.0274).
Sensitivity to relative monetary values
OFC lesion patients displayed blunted sensitivity to differences in the relative
value of monetary offers. Across a subset of trials in the task, the relative monetary value
of the sure option was varied while the absolute monetary amount offered as earnings for
the sure option was held constant. For example, a trial offering $20 from the initial
amount of $100 as the sure option and another trial offering $20 from the initial amount
of $50 as the sure option in principle offered the same amount of money. However, the
two sure options each represented monetary offers of distinct relative value. In the former,
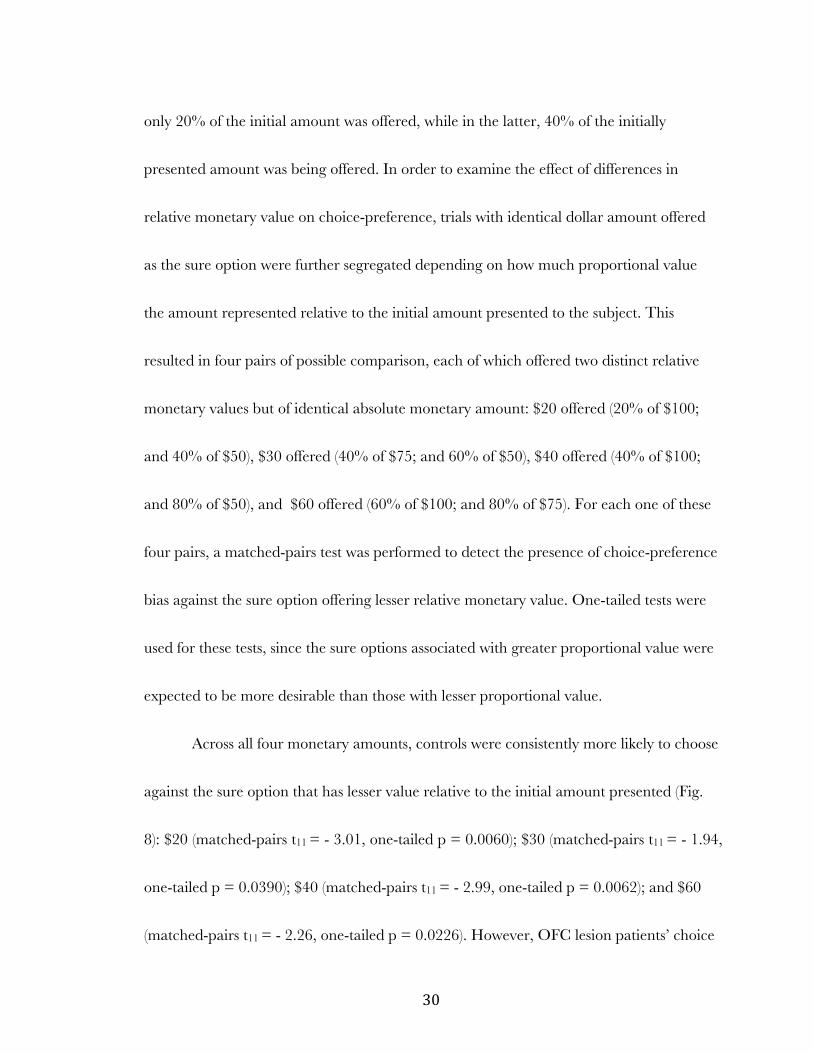
30
only 20% of the initial amount was offered, while in the latter, 40% of the initially
presented amount was being offered. In order to examine the effect of differences in
relative monetary value on choice-preference, trials with identical dollar amount offered
as the sure option were further segregated depending on how much proportional value
the amount represented relative to the initial amount presented to the subject. This
resulted in four pairs of possible comparison, each of which offered two distinct relative
monetary values but of identical absolute monetary amount: $20 offered (20% of $100;
and 40% of $50), $30 offered (40% of $75; and 60% of $50), $40 offered (40% of $100;
and 80% of $50), and $60 offered (60% of $100; and 80% of $75). For each one of these
four pairs, a matched-pairs test was performed to detect the presence of choice-preference
bias against the sure option offering lesser relative monetary value. One-tailed tests were
used for these tests, since the sure options associated with greater proportional value were
expected to be more desirable than those with lesser proportional value.
Across all four monetary amounts, controls were consistently more likely to choose
against the sure option that has lesser value relative to the initial amount presented (Fig.
8): $20 (matched-pairs t11 = - 3.01, one-tailed p = 0.0060); $30 (matched-pairs t11 = - 1.94,
one-tailed p = 0.0390); $40 (matched-pairs t11 = - 2.99, one-tailed p = 0.0062); and $60
(matched-pairs t11 = - 2.26, one-tailed p = 0.0226). However, OFC lesion patients’ choice

31
patterns indicated that they did not discriminate between distinct relative values
associated with sure options: $20 (matched-pairs t11 = - 1.14, one-tailed p = n.s.); $30
(matched-pairs t11 = 0.06, one-tailed p = n.s.); $40 (matched-pairs t11 = 0.14, one-tailed p
= n.s.); and $60 (matched-pairs t11 = 0.56, one-tailed p = n.s.).
* p < 0.05, ** p < 0.01; Each error bar is constructed using a 95% confidence interval of the mean.
Figure 8. Comparison of proportion-gambled when sure options across trials offered
different relative value (relative to initial amount shown) but identical absolute amount

32
No Pie-chart vs. Pie-chart
Comparison of trials presented with and without a pie-chart for the gamble option
indicated that in both groups, absence of a pie-chart (as compared to the presence of it)
enhanced differentiation of choice-preference in regards to the variation in relative (i.e.,
proportional) monetary values of the sure option. A repeated-measures ANOVA, with
Group as a between-subjects factor; Pie-chart-presence as a within-subjects factor; and
linear slope derived from proportion gambled in response to variation in reward
magnitude as a dependent measure was conducted for each frame-type. In the gain
frame, there was no between-subjects main effect of Group (F1,22 = 3.58, p = n.s.), or
Group by Pie-chart-presence interaction (F1,22 = 0.21, p = n.s.). However, a main effect of
Pie-chart-presence was observed such that subjects were more sensitive to reward
magnitude change in trials where the gamble option did not provide information about
the probability of winning (F1,22 = 20.58, p = 0.0002). Results were similar in the loss
frame. There was no between-subjects main effect of Group (F1,22 = 2.41, p = n.s.), or
Group by Pie-chart-presence interaction (F1,22 = 2.37, p = n.s.). But a main effect of Pie-
chart-presence was observed such that subjects were more sensitive to reward magnitude
change in trials with no pie-chart present (F1,22 = 19.20, p = 0.0002).
Further analyses indicated that, for each framing-types, steeper choice-preference

33
changes were observed in trials without a pie-chart compared to trials with a pie-chart
(Fig. 9) for both the OFC lesion group (gain frame: matched-pairs t11 = - 2.75, p =
0.0189, loss frame: matched-pairs t11 = -3.39, p = 0.006); and the control group (gain
frame: matched-pairs t11 = - 4.89, p = 0.0005, loss frame: matched-pairs t11 = -2.91 , p =
0.0143).
When the reward magnitude sensitivity (linear slopes) of OFC lesion patients and
controls were directly compared, the two groups were not different in their sensitivity to
reward magnitude change in no pie-chart trials, as evidenced by no group difference
between mean slope coefficients: gain frame (matched-pairs t11 = - 1.53, p = n.s.), loss
frame (matched-pairs t11 = - 1.30, p = n.s.). This result showed that OFC lesion patients’
choice-preference pattern in the no pie-chart trials were similar to that of healthy
controls, in contrast to their choice-behavior in trials presented with a pie-chart which
showed clear difference from controls (Fig. 10).

34
matched-pairs t-tests: p < 0.05, ** p < 0.01, *** p < 0.001
(Each error bar is constructed using a 95% confidence interval of the mean.)
Figure 9. Linear regression slopes in pie-chart present and pie-chart absent trials
Figure 10. Choice-preference patterns in pie-chart present and pie-chart absent trials

35
Reaction time (RT)
A repeated-measures ANOVA showed that there was no main effect of group
(F1,22 = 1.04, p = n.s.). However, there was a significant main effect of frame (gain vs. loss)
such that time taken to reach a decision in the loss frame was significantly slower that that
in the gain frame (F1,22 = 7.27, p = 0.0132). Additionally, a significant frame by group
interaction was found (F1,22 = 5.12, p = 0.0339) which indicated that the degree of change
in reaction time was dependent on the group. Further analysis indicated that there was no
group difference in median reaction time for either of the two framing types (gain frame:
matched-pairs t11 = 0.73, p = n.s.; loss frame: matched-pairs t11 = 1.64, p = n.s.).
However, within-group analysis revealed that the control group subjects took significantly
more time to reach a decision in loss-framed trials (mean of median RT = 1613 ms, SD =
368 ms) than in gain-framed trials (mean of median RT = 1502 ms, SD = 350 ms) with a
difference of 111 ms (matched-pairs t11 = 3.69, p = 0.0036, see Fig. 11). This was not the
case for the OFC lesion group, as their performance indicated that there was no reaction
time difference (matched-pairs t11 = 0.29, p = n.s.) between the two framing types: gain
frame (mean of median RT = 1395 ms, SD = 400 ms); loss frame (mean of median RT =
1405 ms, SD = 429 ms).

36
matched-pairs t-test: ** p < 0.01
Each error bar is constructed using a 95% confidence interval of the mean.
Figure 11. Time taken to choose between two options under different frame types

37
CHAPTER IV
DISCUSSION
The current study found that individuals with OFC lesions display attenuated
choice-preference adjustment to contrasting affective context. Specifically, it was shown
that OFC lesion patients’ framing bias magnitude – as measured by the difference in
proportion of trials chosen to gamble between trials with financial choices framed as loss
versus gain – was smaller than that of healthy controls. OFC lesion patient subjects’
choice-patterns in catch-trials as well as no-pie chart trials indicated that they were able to
make the numerical comparison and appropriately weigh the value of two potential
choices. Nevertheless they showed marked reduction in sensitivity to the affective context
within which the potential monetary reward choices were embedded in (e.g., framing of
potential choices as gains versus losses; potential choices offering different proportion of
initial amount or different relative value). This is the first demonstration to our knowledge
of human subjects with OFC lesion exhibiting reduced framing bias in an economic
decision-making task. This extends previous work in human neuroimaging studies that
suggest possible involvement of the medial OFC region in contributing to the emergence

38
of framing biases (Deppe et al., 2005; De Martino et al., 2006; Tom et al., 2007).
De Martino et al. (2006)’s pioneering fMRI study using the same behavioral task
as the current study found that higher OFC activity was associated with reduced framing
bias, which can be speculated as evidence in support of the OFC as a neural substrate
that contributes to reducing susceptibility to framing bias. Based on this notion, one
would predict increased framing bias in individuals with OFC lesion. However, this was
not the case in the present study. Rather, we found the exact opposite results, with OFC
lesion patients showing more “rational” or “description-invariant” pattern of choice-
behavior. While diminished influence of framing manipulations on choice-behavior may
be considered more “rational” in the context of the decision-making task we used in the
study, this pattern of choice-behavior may be far from adaptive decision-making in real
life. It has been speculated that human emotion has been developed as a mechanism to
more efficiently guide behavior (Damasio, 1994). In this sense, framing bias manifested by
healthy normal subjects can be considered as a process that enables expedient
adjustments of choice-behavior to meet the needs of the contexts within which decision-
making takes place.
This notion of the OFC as a critical component in affectively guided decision-
making is partially supported by evidence from a previous neuroimaging study that

39
demonstrated OFC’s activation patterns share a remarkably similar trajectory with
behavioral pattern of choice-preference that reflect greater magnitude of subjective value
assigned to financial options framed as gains compared to those framed as losses (Tom, et
al., 2007). In their study, authors illustrated that patterns of “neural-loss-aversion”
(defined as difference between the slope of decreased regional brain activity in response to
increasing loss and the slope of increased regional brain activity in response to increasing
gain) was observed in ventromedial prefrontal cortex (VMPFC) activity such that greater
magnitude discrepancy in VMPFC BOLD signal change between increasing loss (which
resulted in VMPFC signal decrease) and increasing gain (which resulted in VMPFC
signal increase) was associated with greater degree of behavioral loss aversion. This
finding suggests that the ventro-medial region of the OFC activity patterns may
contribute to choices that individuals make under the perceived context of decision-
making. Findings from our study support this view and further suggest the general role of
the medial regions of the OFC as a neural substrate that guides choice-behavior by
integrating affectively relevant contextual information such as framing of financial choices
that suggests potential gains or losses and variation in the subjective and relative value of
monetary reward offered.
Results from the current study additionally offer new insight into the original

40
findings reported by De Martino et al. (2006). In their study, authors reported that
greater activity in the medial and central OFC regions were associated with decreased
susceptibility to loss aversion related framing bias in economic decision-making. The
authors speculated that, subjects with greater OFC activity associated with framing may
have had more refined neural representation of their own emotional biases, thus allowing
them to make their decisions more rationally. Based on this interpretation, we would have
expected to see greater framing biases in lesion patients compared to controls. However,
we found the opposite result of OFC lesion patients exhibiting attenuation of affective
biases in decision-making. Our findings directly challenge the original interpretation by
De Martino et al. (2006), and further suggest that functions of the OFC associated with
representing affective significance of potential choices may subserve and promote the
emergence of framing biases. It is possible that the correlation observed between framing
susceptibility and OFC activity in the De Martino et al. (2006) study was due to
asymmetric brain activity patterns elicited in response to choices framed as losses versus
those framed as gains (Tom et al., 2007).
Importantly, OFC lesion patients did not manifest a general pattern of increased
risk-seeking or risk-aversion in their choice-preference. This was reflected in their rate of
choosing the gamble option in trials overall, which was comparable to that of controls.

41
This finding provides support for the idea that OFC damage may not necessarily lead to
generalized disinhibition of risk-seeking. Our finding, however, must be understood from
a context distinct from a previous report of left orbitofrontal lesion patients showing
greater risk-seeking tendencies in a probabilistic gambling task (Floden, Alexander, Kubu,
Katz, & Stuss, 2008). In contrast to the lack of trial-by-trial feedback in the economic
decision-making task utilized in our study, the task used by Floden et al. (2008) provided
specific feedback to subjects about the outcome of their choice in each trial, which could
significantly alter the property of gambling behaviors in the task over time. Hence, their
left OFC lesion patients’ increased rate of choosing risky choices may reflect more of the
patients’ inability to appropriately incorporate task feedback to adjust their choices rather
than a general mechanism of disinhibited risk-seeking.
The present study also found support for OFC as a neural substrate that enables
adaptable choice-preference differentiation in value-based decision-making. Healthy
controls showed a robust decline in their tendency to choose the gamble option when the
alternative, the sure option, offered increasingly greater proportion of initially received
amount. This clearly demonstrated that controls were able to differentiate their choice-
preference in accordance with varying relative reward magnitude of the potential choice
presented to them. However this was not the case with OFC lesion patients, as their

42
choice-preference patterns were essentially invariant across different proportions of
monetary reward offered, indicating their diminished sensitivity to using relative reward
magnitude information to guide their choice-behavior. OFC lesion patients also exhibited
diminished sensitivity to differences in the relative value of monetary reward. This was
apparent from comparing choice-patterns in trials with sure options of equal absolute
amount that are different in their relative value (when compared to the initial amount
offered). These results extend evidence from non-human primate single-cell recording
studies that show OFC’s crucial function of coding for the relative preference of
rewarding (Tremblay & Schultz, 1999) as well as aversive outcomes (Hosokawa, Kato,
Inoue, & Mikami, 2007). In our study, financial choices framed as losses never truly
resulted in tangible monetary losses. However, when contrasted with other trials with the
sure option framed as gains, choices framed as losses were subjectively an aversive
outcome to subjects engaged in the task. Hence, our data may suggest that OFC lesions
lead to disruption not only in the processing the emotional significance of potentially
rewarding choices but also of potentially aversive ones.
The current study also found that when the reward value of the probabilistic
option (i.e., gamble option) is uncertain, patients and controls show greater sensitivity to
variation in values associated with the sure option. In other words, when subjects lacked

43
information about the probability of winning for the gamble option, (note that this
effectively converts the gamble option to a psychologically ambiguous choice where
individuals assume a 50/50 chance of winning), patients as well as controls showed
greater degrees of differentiation among different relative reward values presented in the
sure option. More importantly, OFC lesion patients’ sensitivity to variation in reward
values was not different from that of controls in these trials. In contrast, patient subjects
were less sensitive to change in monetary reward magnitude variation compared to
controls in trials with known probability of winning for the gamble option (i.e., trials with
a pie-chart present). This showed that OFC lesion patients have an intact ability to
process numerical value-related information, which further suggests that their diminished
sensitivity to varied reward magnitude in the pie-chart present conditions do not reflect a
general deficit in value comparison.
Our observation of control subjects showing increased reaction time in the loss-
framed trials, as compared to the gain-frame trials is consistent with other studies that
report similar findings of slower reaction time observed in negative compared with
positive framings (Payne, Bettman, & Johnson, 1993 Gonzalez, Danda, Koshino, & Just,
2005). This may potentially reflect an extra step required to avoid the loss framed option
and then consider the alternative option (gamble) than to just directly choose the certain

44
(gain). The finding of no difference in reaction time for the patient group demands further
clarification. However, our finding suggests that OFC lesion patients may not be
processing the gain and loss framed choices in a very different manner judging from the
reaction time data as well as our results showing significant attenuation in their framing
bias.
Our results raise further questions to be answered involving the specific affective
processing functions associated with sub-regions of the OFC. In the present study, the
common area of lesion was identified as the left medial OFC, near the medial orbital
gyrus and gyrus rectus. Interestingly, it has been demonstrated that lateral regions of the
OFC responds in a different manner compared to medial regions of the OFC. For
example, in an fMRI study where subjects were asked to consume highly palatable food
such as chocolate beyond satiety, the medial OFC activity showed commensurate
decreased after satiety, in keeping with the diminishing reward value of the chocolate they
were asked to consume, but activity in the lateral OFC increased showing the opposite
pattern to the medial OFC activity (Small, Zatorre, Dagher, Evans, & Jones-Gotman,
2001). This and other studies have suggested that while medial regions of the OFC serve
the function of coding for subjective reward values, the lateral portion of the OFC seems
to be more involved in suppressing or overriding previously acquired stimuli-reward
45
contingencies. (O’Doherty, Kringelbach, Rolls, Hornak, & Andrews, 2001; Kringelbach,
2005). Observation of distinct activity patterns in the lateral OFC raises further questions
about the involvement of other sub-regions of the OFC and the nearby frontal cortex
region.
It is worth noting that the current study’s OFC patients showed significant lesion
overlap in the left hemisphere (see Figure 1). In the De Martino et al. (2006) study, OFC
activity associated with individual differences in framing bias was found more in the right
than the left. This particular finding of framing-bias-associated OFC activity being more
lateralized to the right hemisphere was not explicitly addressed by the authors. However,
another previous fMRI study using an economic decision-making task, not specifically
related to framing bias, has reported similar patterns of right-sided OFC activity when
subjects were exposed to financial outcome of gains versus losses (Kuhnen & Knutson,
2005). Assuming a greater role of the right OFC function in promoting framing bias, it is
possible that potential OFC lesion patients with more right sided OFC lesion show
greater attenuation of framing biases.
Moreover, correlational evidence from neuroimaging studies provide support for
the involvement of posterior regions of the ventro-lateral prefrontal cortex (VLPFC, BA
47/12) in down-regulating amygdalar activity (Ray & Zald, in press). While amygdalar
46
activity was not a determinant of inter-subject variability in framing bias in the De
Martino et al. (2006) study, it did predict within-subject choices that are in accordance
with framing manipulations. Hence, it is possible to speculate that VLPFC exerts
inhibitory influence on framing biases. Future research addressing such questions about
the laterality of OFC’s contribution to framing bias and clarifying possible involvement of
other frontal regions near the medial OFC can further augment the finding from the
current study.
The present study provides distinct contribution to our understanding of the
OFC’s role in framing effect and value-based decision-making. The current study
additionally demonstrates how behavioral economics can be applied in lesion studies to
test hypotheses relevant to the functional significance of neural substrates being studied.
Moreover, in comparison to previous neuroimaging studies that provide correlational
evidence, the present study offers a more direct examination of the medial OFC’s
contribution to affective biases involved in decision-making processes. Future lesion
studies could augment findings from the current study by further investigating the
involvement of other sub-regions of the OFC in context dependent and value-based
decision-making.

47
REFERENCES
Bechara, A., Damasio, H., Damasio, A. R., & Lee, G. P. (1999). Different contributions
of the human amygdala and ventromedial prefrontal cortex to decision-making.
Journal of Neuroscience, 19, 5473-5481.
Bush, G., Vogt, B. A., Holmes, J., Dale, A. M., Greve, D., Jenike, M. A., Rosen, B. R.
(2002). Dorsal anterior cingulate cortex: a role in reward-based decision making.
Proceedings of the National Academy of Sciences. 99, 523-528.
Chib,V. S., Rangel, A., Shimojo, S., O’Doherty, J. P. (2009). Evidence for a common
representation of decision values for dissimilar goods in human ventromedial
prefrontal cortex. Journal of Neuroscience, 29,12315-12320.
Damasio, A. R. (1994). Descarte’s Error: Emotion, Reason, and the Human Brain. New York:
Gosset/Putnam.
De Martino, B., Kumaran, D., Seymour, B., & Dolan, R. J. (2006). Frames, biases, and
rational decision-making in the human brain. Science, 313(5787), 684-7.
Deppe, M., Schwindt, W., Krämer, J., Kugel, H., Plassmann, H., Kenning, P., &
Ringelstein, E. B. (2005). Evidence for a neural correlate of a framing effect: bias-
specific activity in the ventromedial prefrontal cortex during credibility judgments.
Brain Research Bulletin, 67(5), 413-21.
Dias, R., Robbins, T. W., Roberts, A. C. (1996). Dissociation in prefrontal cortex of
affective and attentional shifts. Nature, 380, 69-72
FitzGerald, T. H. B., Seymour, B., & Dolan, R. J. (2009). The role of human
orbitofrontal cortex in value comparison for incommensurable objects. Journal of
Neuroscience, 29(26), 8388-95.
Floden, D., Alexander, M. P., Kubu, C. S., Katz, D., & Stuss, D. T. (2008). Impulsivity
and risk-taking behavior in focal frontal lobe lesions. Neuropsychologia, 46(1), 213-23.

48
Gonzalez, C., Danda, J., Koshino, H., & Just, M. (2005). The framing effect and risky
decisions: Examining cognitive functions with fMRI. Journal of Economic Psychology, 26,
1-20.
Izquierdo, A., Suda, R. K. & Murray, E. A. (2004). Bilateral orbital prefrontal cortex
lesions in rhesus monkeys disrupt choices guided by both reward value and reward
contingency. Journal of Neuroscience. 24, 7540-7548.
Kahneman, D., & Tversky, A. (1979). Prospect theory: an analysis of decision under risk.
Econometrica, 47, 263-291.
Kennerley, S. W., Behrens, T. E. J., Wallis, J. D. (2011). Double dissociation of value
computations in orbitofrontal and anterior cingulate neurons. Nature Neuroscience, 14,
1581-1589.
Kringelbach, M. L., O’Doherty, J., Rolls, E. T., & Andrews, C. (2003). Activation of the
human orbitofrontal cortex to a liquid food stimulus is correlated with its subjective
pleasantness. Cerebral Cortex, 13(10), 1064-71.
Kringelbach, M. L. (2005). The human orbitofrontal cortex: linking reward to hedonic
experience. Nature Reviews Neuroscience, 6(9), 691-70.
Kuhnen, C. M., & Knutson, B. (2005). The neural basis of financial risk taking. Neuron,
47(5), 763-70.
Kühberger, A. (1998). The Influence of Framing on Risky Decisions: A Meta-analysis.
Organizational Behavior and Human Decision Processes, 75(1), 23-55.
McNeil, B., Pauker, S., Sox, H., Jr., & Tversky, A. (1982). On the elicitation of preference
ofr alternative therapies. New England Journal of Medicine, 306, 1259-1262.
Neale, M. A., & Bazerman, M. H. (1985). The effects of framing and negotiator
overconfidence on bargaining behaviors and outcomes. Management, 28(1), 34-49.
Payne, J. W., Bettman, J. R., & Johnson, E. (1993). The adaptive decisionmaker.
Cambridge, England: Cambridge University Press.

49
Petrinovich, L. & O’Neill, P. (1996). Influence of wording and framing effects on moral
intuitions. Ethology & Sociobiology, 171, 145-171.
Novemsky, N., & Kahneman, D. (2005). How do intentions affect loss aversion? Journal of
Marketing Research, 42(2), 139-140.
O’Doherty, J., Kringelbach, M. L., Rolls, E. T., Hornak, J., & Andrews, C. (2001).
Abstract reward and punishment representations in the human orbitofrontal cortex.
Nature Neuroscience, 4(1), 95-102.
Padoa-Schioppa, C., Assad, J. A. (2006). Neurons in the orbitofrontal cortex encode
economic value. Nature, 441, 223–26
Padoa-Schioppa, C., Assad, J. A. (2008). The representation of economic value in the
orbitofrontal cortex is invariant for changes of menu. Nature Neuroscience, 11, 95-102.
Plassmann, H., O’Doherty, J. & Rangel, A. (2007) Orbitofrontal cortex encodes
willingness to pay in everyday economic transactions. Journal of Neuroscience, 27,
9984–9988.
Ray, R., & Zald, D. H. (in press). Anatomical insights into the interaction of emotion and
cognition in the prefrontal cortex. Neuroscience & Biobehavioral Reviews, 36(1), 479-501.
Rorden, C., Karnath, H., Bonilha, L. (2007). Improving lesion-symptom mapping.
Journal of
Cognitive Neuroscience, 19, 1081-1088.
Hosokawa, T., Kato, K., Inoue, M., & Mikami, A. (2007). Neurons in the macaque
orbitofrontal cortex code relative preference of both rewarding and aversive
outcomes. Neuroscience Research, 57(3), 434-445.
Huxely, T. H. (1908). Aphorisms & Reflections. St. Martin’s Street, London: Macmillan &
Co. Limited. (pp. 161)
Schultz, W. & Dickinson, A. (2000). Neuronal coding of prediction errors. Annual Review of
Neuroscience. 23, 473–500.

50
Small, D. M., Zatorre, R. J., Dagher, A., Evans, A. C., & Jones-Gotman, M. (2001).
Changes in brain activity related to eating chocolate: from pleasure to aversion.
Brain, 124(9), 1720-33.
Tom, S. M., Fox, C. R., Trepel, C., & Poldrack, R. A. (2007). The neural basis of loss
aversion in decision-making under risk. Science, 315(5811), 515-8.
Tremblay, L., & Schultz, W. (1999). Relative reward preference in primate orbitofrontal
cortex. Nature, 398, 704–708.
Tversky, A., & Kahneman, D. (1981). The framing of decisions and the psychology of
choice. Science, 211, 453-458.
Tversky, A., & Kahneman, D. (1992). Advances in prospect theory: Cumulative
representation of uncertainty. Journal of Risk and Uncertainty, 5(4), 297-323.
Wallis, J. D. (2007). Orbitofrontal cortex and its contribution to decision-making. Annual
Review of Neuroscience. 30, 31–56.
Watson, D., & Clark, L. A. (1999). The PANAS-X: Manual for the Positive and Negative Affect
Schedule-Expanded Form. Ames: The University of Iowa.
Wechsler, D. (1997). Wechsler Abbreviated Scale of Intelligence®. San Antonio, TX:
The Psychological Corporation.
Wechsler, D. (1997). Wechsler Adult Intelligence Scale®-Third Edition. San Antonio,
TX: The Psychological Corporation.
Wechsler, D. (1997). Wechsler Memory Scale®-Third Edition. San Antonio, TX: The
Psychological Corporation.
Zald, D. H. (2007). Orbital versus dorsolateral prefrontal cortex: anatomical insights into
content versus process differentiation models of the prefrontal cortex. Annals of the New
York Academy of Sciences, 1121, 395-406.
Zald, D. H. (2009). Orbitofrontal cortex contributions to food selection and decision
making. Annals of Behavioral Medicine, 38 (Suppl 1), S18-24.