orchard tree modeling for advanced sprayer control and
TRANSCRIPT
Orchard Tree Modeling for Advanced Sprayer Control and AutomaticTree Inventory
Carl Wellington1, Joan Campoy1, Lav Khot2, and Reza Ehsani2
Abstract— This paper describes two related precision agri-culture applications within an orchard environment that areenabled by building models of the trees using a vehicle-mountedladar sensor. First, we describe an advanced spray controlapplication. Ladar data is fused with GPS to build a local3D map of the trees. Then, using a Markov random fieldprobabilistic ground model to separate trees from the ground,and tree density estimates computed from the ratio of ladarhits and pass-throughs, we control the flow rate of individualnozzles and the amount of air-assist on a modified sprayer. Thisimproves the effectiveness of the spray, reduces the amountof chemical used, and reduces chemical drift. Second, wedescribe an automated tree inventory method that can countindividual trees both when the boundaries between trees arevisible and when presented with a wall of trees where thecanopies all blend together. We use a hidden semi-Markovmodel to probabilistically combine ladar data of the trees witha prior on the expected tree spacing to generate a map of treelocations and size estimates. Both of these applications leverageprobabilistic tree modeling strategies to incorporate contextualinformation to better interpret sensor data of the trees, andthese approaches have been experimentally validated duringfield testing in a Florida citrus orchard.
I. INTRODUCTIONWithin the broader domain of outdoor robotics, agri-
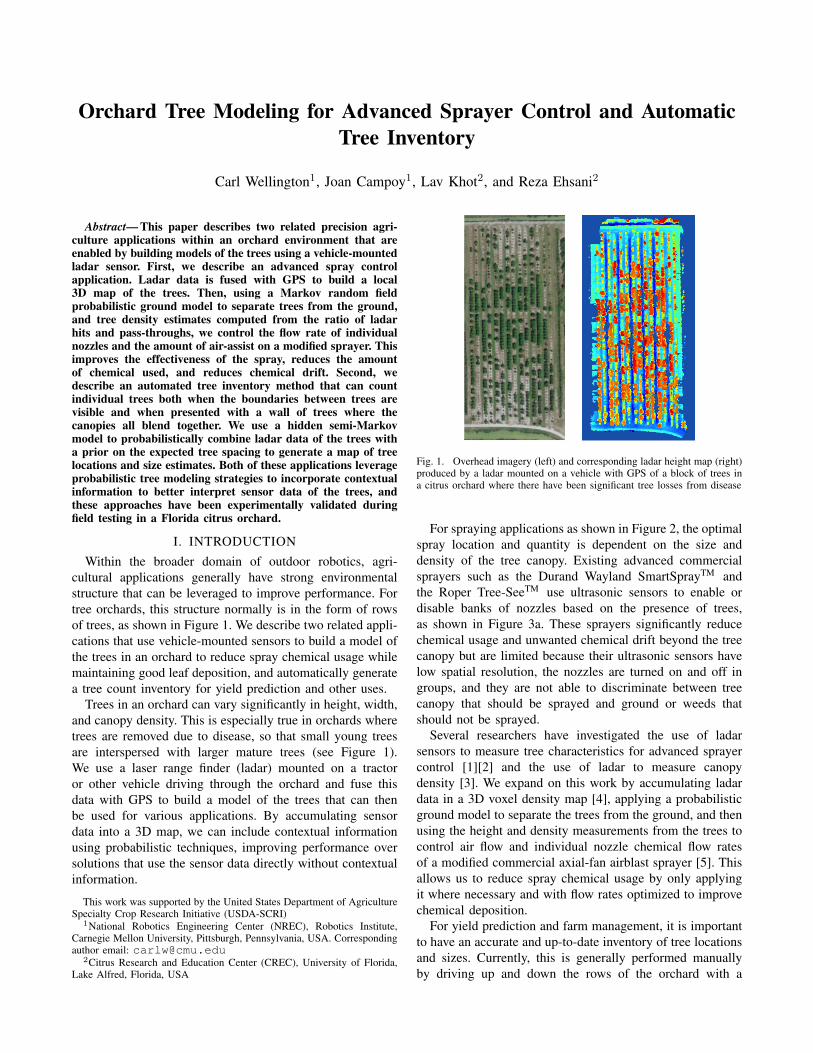
cultural applications generally have strong environmentalstructure that can be leveraged to improve performance. Fortree orchards, this structure normally is in the form of rowsof trees, as shown in Figure 1. We describe two related appli-cations that use vehicle-mounted sensors to build a model ofthe trees in an orchard to reduce spray chemical usage whilemaintaining good leaf deposition, and automatically generatea tree count inventory for yield prediction and other uses.
Trees in an orchard can vary significantly in height, width,and canopy density. This is especially true in orchards wheretrees are removed due to disease, so that small young treesare interspersed with larger mature trees (see Figure 1).We use a laser range finder (ladar) mounted on a tractoror other vehicle driving through the orchard and fuse thisdata with GPS to build a model of the trees that can thenbe used for various applications. By accumulating sensordata into a 3D map, we can include contextual informationusing probabilistic techniques, improving performance oversolutions that use the sensor data directly without contextualinformation.
This work was supported by the United States Department of AgricultureSpecialty Crop Research Initiative (USDA-SCRI)
1National Robotics Engineering Center (NREC), Robotics Institute,Carnegie Mellon University, Pittsburgh, Pennsylvania, USA. Correspondingauthor email: [email protected]
2Citrus Research and Education Center (CREC), University of Florida,Lake Alfred, Florida, USA
Fig. 1. Overhead imagery (left) and corresponding ladar height map (right)produced by a ladar mounted on a vehicle with GPS of a block of trees ina citrus orchard where there have been significant tree losses from disease
For spraying applications as shown in Figure 2, the optimalspray location and quantity is dependent on the size anddensity of the tree canopy. Existing advanced commercialsprayers such as the Durand Wayland SmartSprayTM andthe Roper Tree-SeeTM use ultrasonic sensors to enable ordisable banks of nozzles based on the presence of trees,as shown in Figure 3a. These sprayers significantly reducechemical usage and unwanted chemical drift beyond the treecanopy but are limited because their ultrasonic sensors havelow spatial resolution, the nozzles are turned on and off ingroups, and they are not able to discriminate between treecanopy that should be sprayed and ground or weeds thatshould not be sprayed.
Several researchers have investigated the use of ladarsensors to measure tree characteristics for advanced sprayercontrol [1][2] and the use of ladar to measure canopydensity [3]. We expand on this work by accumulating ladardata in a 3D voxel density map [4], applying a probabilisticground model to separate the trees from the ground, and thenusing the height and density measurements from the trees tocontrol air flow and individual nozzle chemical flow ratesof a modified commercial axial-fan airblast sprayer [5]. Thisallows us to reduce spray chemical usage by only applyingit where necessary and with flow rates optimized to improvechemical deposition.
For yield prediction and farm management, it is importantto have an accurate and up-to-date inventory of tree locationsand sizes. Currently, this is generally performed manuallyby driving up and down the rows of the orchard with a
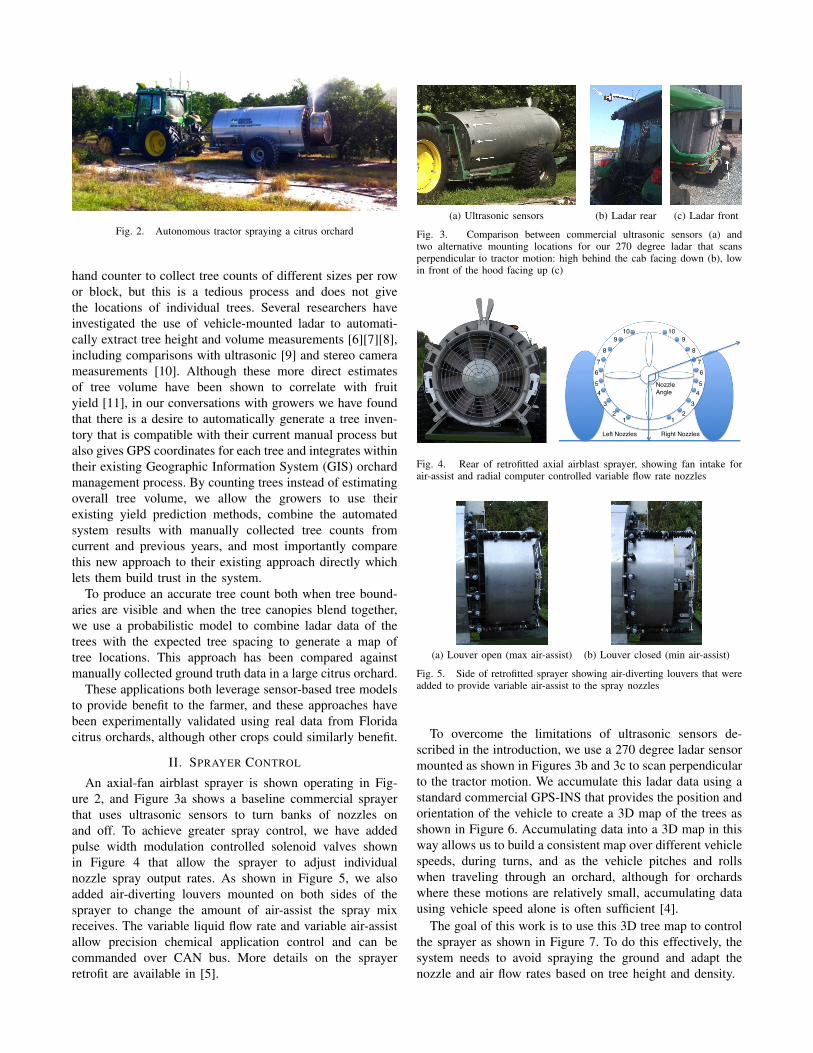
Fig. 2. Autonomous tractor spraying a citrus orchard
hand counter to collect tree counts of different sizes per rowor block, but this is a tedious process and does not givethe locations of individual trees. Several researchers haveinvestigated the use of vehicle-mounted ladar to automati-cally extract tree height and volume measurements [6][7][8],including comparisons with ultrasonic [9] and stereo camerameasurements [10]. Although these more direct estimatesof tree volume have been shown to correlate with fruityield [11], in our conversations with growers we have foundthat there is a desire to automatically generate a tree inven-tory that is compatible with their current manual process butalso gives GPS coordinates for each tree and integrates withintheir existing Geographic Information System (GIS) orchardmanagement process. By counting trees instead of estimatingoverall tree volume, we allow the growers to use theirexisting yield prediction methods, combine the automatedsystem results with manually collected tree counts fromcurrent and previous years, and most importantly comparethis new approach to their existing approach directly whichlets them build trust in the system.
To produce an accurate tree count both when tree bound-aries are visible and when the tree canopies blend together,we use a probabilistic model to combine ladar data of thetrees with the expected tree spacing to generate a map oftree locations. This approach has been compared againstmanually collected ground truth data in a large citrus orchard.
These applications both leverage sensor-based tree modelsto provide benefit to the farmer, and these approaches havebeen experimentally validated using real data from Floridacitrus orchards, although other crops could similarly benefit.
II. SPRAYER CONTROL
An axial-fan airblast sprayer is shown operating in Fig-ure 2, and Figure 3a shows a baseline commercial sprayerthat uses ultrasonic sensors to turn banks of nozzles onand off. To achieve greater spray control, we have addedpulse width modulation controlled solenoid valves shownin Figure 4 that allow the sprayer to adjust individualnozzle spray output rates. As shown in Figure 5, we alsoadded air-diverting louvers mounted on both sides of thesprayer to change the amount of air-assist the spray mixreceives. The variable liquid flow rate and variable air-assistallow precision chemical application control and can becommanded over CAN bus. More details on the sprayerretrofit are available in [5].
(a) Ultrasonic sensors (b) Ladar rear (c) Ladar front
Fig. 3. Comparison between commercial ultrasonic sensors (a) andtwo alternative mounting locations for our 270 degree ladar that scansperpendicular to tractor motion: high behind the cab facing down (b), lowin front of the hood facing up (c)
12
3456
7
89
10
NozzleAngle
12
34
567
89
10
Left Nozzles Right Nozzles
Fig. 4. Rear of retrofitted axial airblast sprayer, showing fan intake forair-assist and radial computer controlled variable flow rate nozzles
(a) Louver open (max air-assist) (b) Louver closed (min air-assist)
Fig. 5. Side of retrofitted sprayer showing air-diverting louvers that wereadded to provide variable air-assist to the spray nozzles
To overcome the limitations of ultrasonic sensors de-scribed in the introduction, we use a 270 degree ladar sensormounted as shown in Figures 3b and 3c to scan perpendicularto the tractor motion. We accumulate this ladar data using astandard commercial GPS-INS that provides the position andorientation of the vehicle to create a 3D map of the trees asshown in Figure 6. Accumulating data into a 3D map in thisway allows us to build a consistent map over different vehiclespeeds, during turns, and as the vehicle pitches and rollswhen traveling through an orchard, although for orchardswhere these motions are relatively small, accumulating datausing vehicle speed alone is often sufficient [4].
The goal of this work is to use this 3D tree map to controlthe sprayer as shown in Figure 7. To do this effectively, thesystem needs to avoid spraying the ground and adapt thenozzle and air flow rates based on tree height and density.
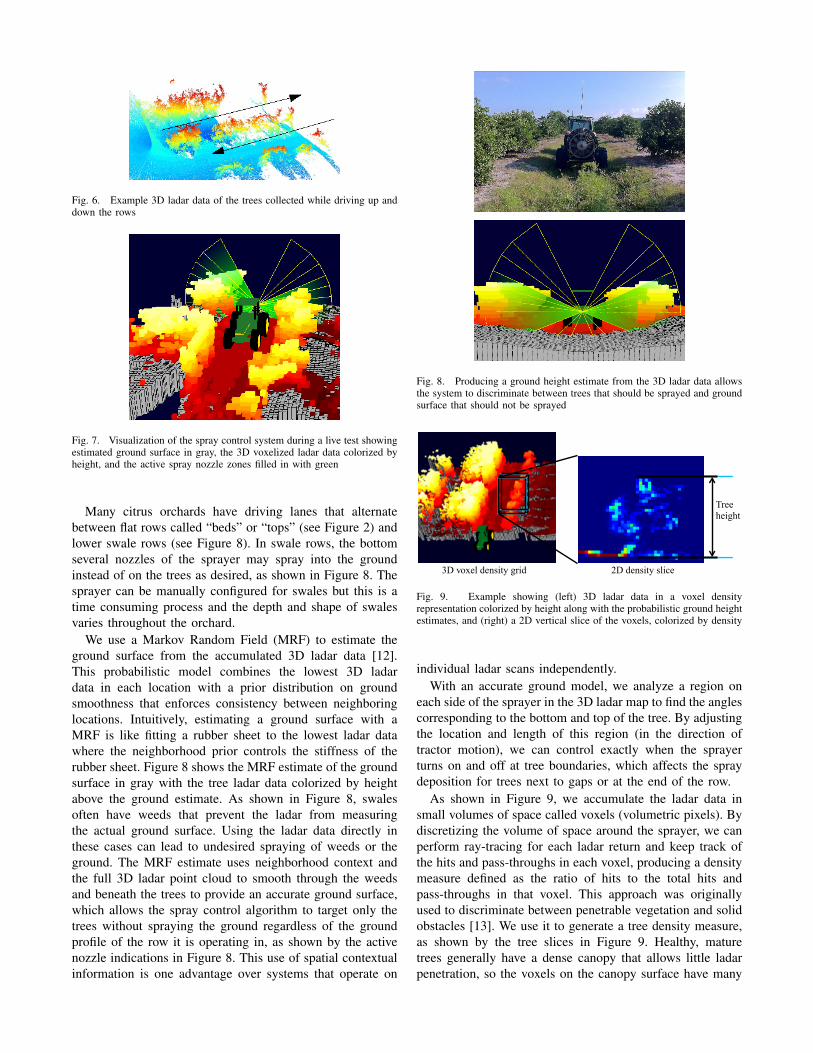
Fig. 6. Example 3D ladar data of the trees collected while driving up anddown the rows
Fig. 7. Visualization of the spray control system during a live test showingestimated ground surface in gray, the 3D voxelized ladar data colorized byheight, and the active spray nozzle zones filled in with green
Many citrus orchards have driving lanes that alternatebetween flat rows called “beds” or “tops” (see Figure 2) andlower swale rows (see Figure 8). In swale rows, the bottomseveral nozzles of the sprayer may spray into the groundinstead of on the trees as desired, as shown in Figure 8. Thesprayer can be manually configured for swales but this is atime consuming process and the depth and shape of swalesvaries throughout the orchard.
We use a Markov Random Field (MRF) to estimate theground surface from the accumulated 3D ladar data [12].This probabilistic model combines the lowest 3D ladardata in each location with a prior distribution on groundsmoothness that enforces consistency between neighboringlocations. Intuitively, estimating a ground surface with aMRF is like fitting a rubber sheet to the lowest ladar datawhere the neighborhood prior controls the stiffness of therubber sheet. Figure 8 shows the MRF estimate of the groundsurface in gray with the tree ladar data colorized by heightabove the ground estimate. As shown in Figure 8, swalesoften have weeds that prevent the ladar from measuringthe actual ground surface. Using the ladar data directly inthese cases can lead to undesired spraying of weeds or theground. The MRF estimate uses neighborhood context andthe full 3D ladar point cloud to smooth through the weedsand beneath the trees to provide an accurate ground surface,which allows the spray control algorithm to target only thetrees without spraying the ground regardless of the groundprofile of the row it is operating in, as shown by the activenozzle indications in Figure 8. This use of spatial contextualinformation is one advantage over systems that operate on
Fig. 8. Producing a ground height estimate from the 3D ladar data allowsthe system to discriminate between trees that should be sprayed and groundsurface that should not be sprayed
Treeheight
3D voxel density grid 2D density slice
Fig. 9. Example showing (left) 3D ladar data in a voxel densityrepresentation colorized by height along with the probabilistic ground heightestimates, and (right) a 2D vertical slice of the voxels, colorized by density
individual ladar scans independently.With an accurate ground model, we analyze a region on
each side of the sprayer in the 3D ladar map to find the anglescorresponding to the bottom and top of the tree. By adjustingthe location and length of this region (in the direction oftractor motion), we can control exactly when the sprayerturns on and off at tree boundaries, which affects the spraydeposition for trees next to gaps or at the end of the row.
As shown in Figure 9, we accumulate the ladar data insmall volumes of space called voxels (volumetric pixels). Bydiscretizing the volume of space around the sprayer, we canperform ray-tracing for each ladar return and keep track ofthe hits and pass-throughs in each voxel, producing a densitymeasure defined as the ratio of hits to the total hits andpass-throughs in that voxel. This approach was originallyused to discriminate between penetrable vegetation and solidobstacles [13]. We use it to generate a tree density measure,as shown by the tree slices in Figure 9. Healthy, maturetrees generally have a dense canopy that allows little ladarpenetration, so the voxels on the canopy surface have many
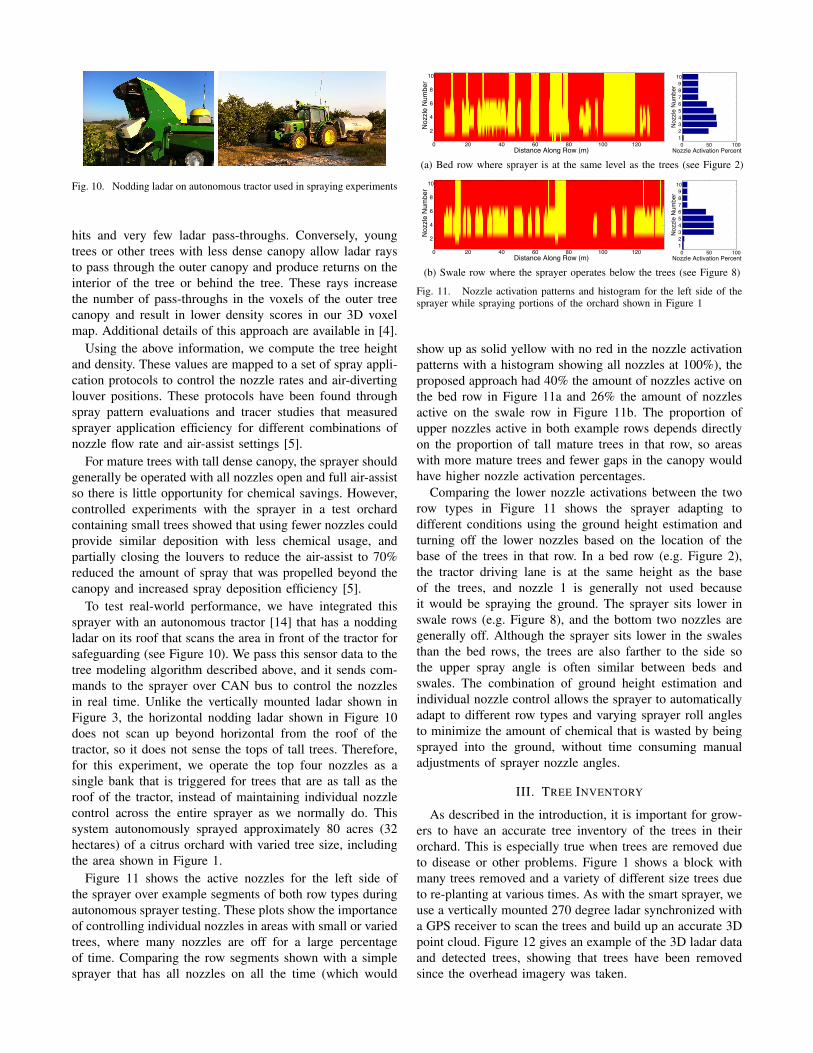
Fig. 10. Nodding ladar on autonomous tractor used in spraying experiments
hits and very few ladar pass-throughs. Conversely, youngtrees or other trees with less dense canopy allow ladar raysto pass through the outer canopy and produce returns on theinterior of the tree or behind the tree. These rays increasethe number of pass-throughs in the voxels of the outer treecanopy and result in lower density scores in our 3D voxelmap. Additional details of this approach are available in [4].
Using the above information, we compute the tree heightand density. These values are mapped to a set of spray appli-cation protocols to control the nozzle rates and air-divertinglouver positions. These protocols have been found throughspray pattern evaluations and tracer studies that measuredsprayer application efficiency for different combinations ofnozzle flow rate and air-assist settings [5].
For mature trees with tall dense canopy, the sprayer shouldgenerally be operated with all nozzles open and full air-assistso there is little opportunity for chemical savings. However,controlled experiments with the sprayer in a test orchardcontaining small trees showed that using fewer nozzles couldprovide similar deposition with less chemical usage, andpartially closing the louvers to reduce the air-assist to 70%reduced the amount of spray that was propelled beyond thecanopy and increased spray deposition efficiency [5].
To test real-world performance, we have integrated thissprayer with an autonomous tractor [14] that has a noddingladar on its roof that scans the area in front of the tractor forsafeguarding (see Figure 10). We pass this sensor data to thetree modeling algorithm described above, and it sends com-mands to the sprayer over CAN bus to control the nozzlesin real time. Unlike the vertically mounted ladar shown inFigure 3, the horizontal nodding ladar shown in Figure 10does not scan up beyond horizontal from the roof of thetractor, so it does not sense the tops of tall trees. Therefore,for this experiment, we operate the top four nozzles as asingle bank that is triggered for trees that are as tall as theroof of the tractor, instead of maintaining individual nozzlecontrol across the entire sprayer as we normally do. Thissystem autonomously sprayed approximately 80 acres (32hectares) of a citrus orchard with varied tree size, includingthe area shown in Figure 1.
Figure 11 shows the active nozzles for the left side ofthe sprayer over example segments of both row types duringautonomous sprayer testing. These plots show the importanceof controlling individual nozzles in areas with small or variedtrees, where many nozzles are off for a large percentageof time. Comparing the row segments shown with a simplesprayer that has all nozzles on all the time (which would
Noz
zle
Num
ber
Distance Along Row (m)0 20 40 60 80 100 120
2
4
6
8
10
0 50 100123456789
10
Nozzle Activation Percent
Noz
zle
Num
ber
(a) Bed row where sprayer is at the same level as the trees (see Figure 2)
Noz
zle
Num
ber
Distance Along Row (m)0 20 40 60 80 100 120
2
4
6
8
10
0 50 100123456789
10
Nozzle Activation Percent
Noz
zle
Num
ber
(b) Swale row where the sprayer operates below the trees (see Figure 8)
Fig. 11. Nozzle activation patterns and histogram for the left side of thesprayer while spraying portions of the orchard shown in Figure 1
show up as solid yellow with no red in the nozzle activationpatterns with a histogram showing all nozzles at 100%), theproposed approach had 40% the amount of nozzles active onthe bed row in Figure 11a and 26% the amount of nozzlesactive on the swale row in Figure 11b. The proportion ofupper nozzles active in both example rows depends directlyon the proportion of tall mature trees in that row, so areaswith more mature trees and fewer gaps in the canopy wouldhave higher nozzle activation percentages.
Comparing the lower nozzle activations between the tworow types in Figure 11 shows the sprayer adapting todifferent conditions using the ground height estimation andturning off the lower nozzles based on the location of thebase of the trees in that row. In a bed row (e.g. Figure 2),the tractor driving lane is at the same height as the baseof the trees, and nozzle 1 is generally not used becauseit would be spraying the ground. The sprayer sits lower inswale rows (e.g. Figure 8), and the bottom two nozzles aregenerally off. Although the sprayer sits lower in the swalesthan the bed rows, the trees are also farther to the side sothe upper spray angle is often similar between beds andswales. The combination of ground height estimation andindividual nozzle control allows the sprayer to automaticallyadapt to different row types and varying sprayer roll anglesto minimize the amount of chemical that is wasted by beingsprayed into the ground, without time consuming manualadjustments of sprayer nozzle angles.
III. TREE INVENTORY
As described in the introduction, it is important for grow-ers to have an accurate tree inventory of the trees in theirorchard. This is especially true when trees are removed dueto disease or other problems. Figure 1 shows a block withmany trees removed and a variety of different size trees dueto re-planting at various times. As with the smart sprayer, weuse a vertically mounted 270 degree ladar synchronized witha GPS receiver to scan the trees and build up an accurate 3Dpoint cloud. Figure 12 gives an example of the 3D ladar dataand detected trees, showing that trees have been removedsince the overhead imagery was taken.
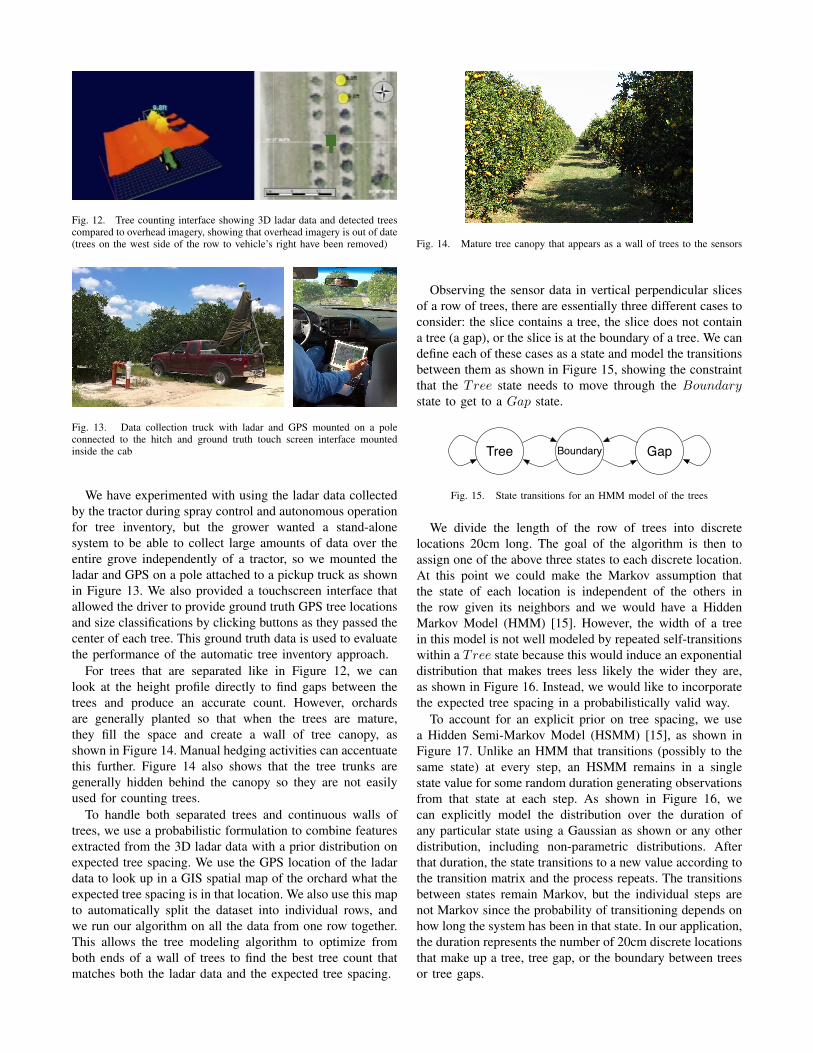
Fig. 12. Tree counting interface showing 3D ladar data and detected treescompared to overhead imagery, showing that overhead imagery is out of date(trees on the west side of the row to vehicle’s right have been removed)
Fig. 13. Data collection truck with ladar and GPS mounted on a poleconnected to the hitch and ground truth touch screen interface mountedinside the cab
We have experimented with using the ladar data collectedby the tractor during spray control and autonomous operationfor tree inventory, but the grower wanted a stand-alonesystem to be able to collect large amounts of data over theentire grove independently of a tractor, so we mounted theladar and GPS on a pole attached to a pickup truck as shownin Figure 13. We also provided a touchscreen interface thatallowed the driver to provide ground truth GPS tree locationsand size classifications by clicking buttons as they passed thecenter of each tree. This ground truth data is used to evaluatethe performance of the automatic tree inventory approach.
For trees that are separated like in Figure 12, we canlook at the height profile directly to find gaps between thetrees and produce an accurate count. However, orchardsare generally planted so that when the trees are mature,they fill the space and create a wall of tree canopy, asshown in Figure 14. Manual hedging activities can accentuatethis further. Figure 14 also shows that the tree trunks aregenerally hidden behind the canopy so they are not easilyused for counting trees.
To handle both separated trees and continuous walls oftrees, we use a probabilistic formulation to combine featuresextracted from the 3D ladar data with a prior distribution onexpected tree spacing. We use the GPS location of the ladardata to look up in a GIS spatial map of the orchard what theexpected tree spacing is in that location. We also use this mapto automatically split the dataset into individual rows, andwe run our algorithm on all the data from one row together.This allows the tree modeling algorithm to optimize fromboth ends of a wall of trees to find the best tree count thatmatches both the ladar data and the expected tree spacing.
Fig. 14. Mature tree canopy that appears as a wall of trees to the sensors
Observing the sensor data in vertical perpendicular slicesof a row of trees, there are essentially three different cases toconsider: the slice contains a tree, the slice does not containa tree (a gap), or the slice is at the boundary of a tree. We candefine each of these cases as a state and model the transitionsbetween them as shown in Figure 15, showing the constraintthat the Tree state needs to move through the Boundarystate to get to a Gap state.
Boundary GapTree
Fig. 15. State transitions for an HMM model of the trees
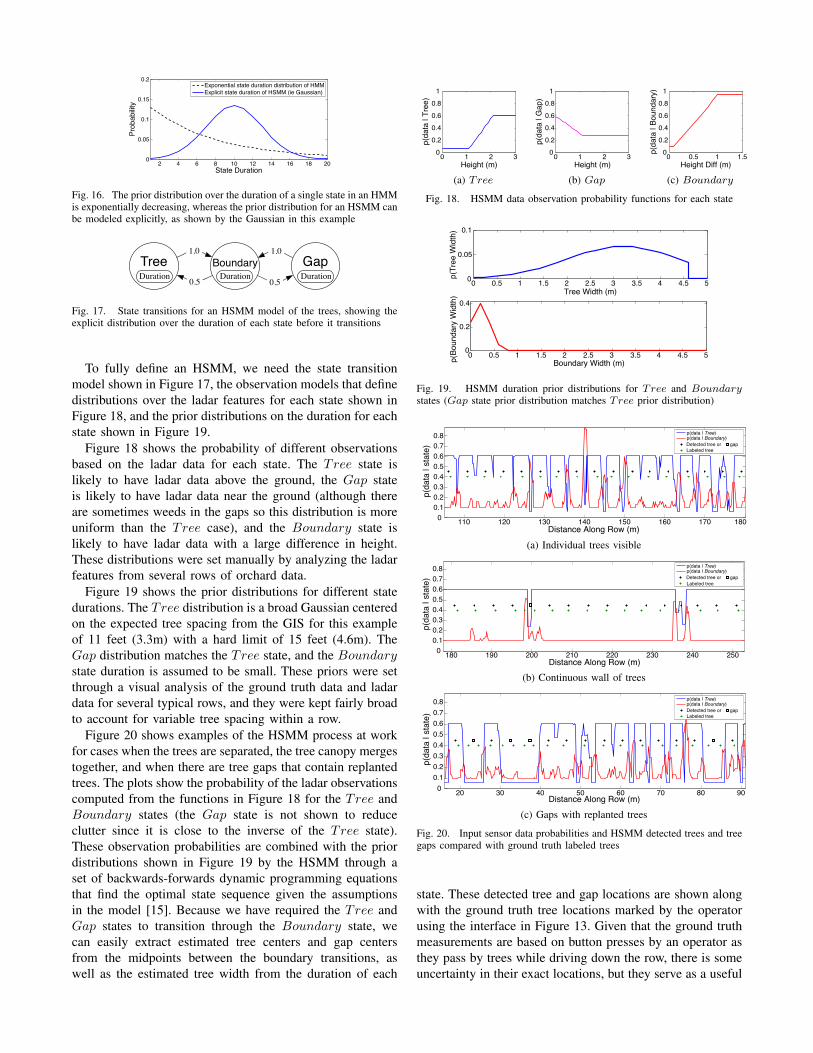
We divide the length of the row of trees into discretelocations 20cm long. The goal of the algorithm is then toassign one of the above three states to each discrete location.At this point we could make the Markov assumption thatthe state of each location is independent of the others inthe row given its neighbors and we would have a HiddenMarkov Model (HMM) [15]. However, the width of a treein this model is not well modeled by repeated self-transitionswithin a Tree state because this would induce an exponentialdistribution that makes trees less likely the wider they are,as shown in Figure 16. Instead, we would like to incorporatethe expected tree spacing in a probabilistically valid way.
To account for an explicit prior on tree spacing, we usea Hidden Semi-Markov Model (HSMM) [15], as shown inFigure 17. Unlike an HMM that transitions (possibly to thesame state) at every step, an HSMM remains in a singlestate value for some random duration generating observationsfrom that state at each step. As shown in Figure 16, wecan explicitly model the distribution over the duration ofany particular state using a Gaussian as shown or any otherdistribution, including non-parametric distributions. Afterthat duration, the state transitions to a new value according tothe transition matrix and the process repeats. The transitionsbetween states remain Markov, but the individual steps arenot Markov since the probability of transitioning depends onhow long the system has been in that state. In our application,the duration represents the number of 20cm discrete locationsthat make up a tree, tree gap, or the boundary between treesor tree gaps.
2 4 6 8 10 12 14 16 18 200
0.05
0.1
0.15
0.2
State Duration
Prob
abilit
y
Exponential state duration distribution of HMMExplicit state duration of HSMM (ie Gaussian)
Fig. 16. The prior distribution over the duration of a single state in an HMMis exponentially decreasing, whereas the prior distribution for an HSMM canbe modeled explicitly, as shown by the Gaussian in this example
Boundary1.0
0.5 0.5
1.0
DurationDuration DurationGapTree
Fig. 17. State transitions for an HSMM model of the trees, showing theexplicit distribution over the duration of each state before it transitions
To fully define an HSMM, we need the state transitionmodel shown in Figure 17, the observation models that definedistributions over the ladar features for each state shown inFigure 18, and the prior distributions on the duration for eachstate shown in Figure 19.
Figure 18 shows the probability of different observationsbased on the ladar data for each state. The Tree state islikely to have ladar data above the ground, the Gap stateis likely to have ladar data near the ground (although thereare sometimes weeds in the gaps so this distribution is moreuniform than the Tree case), and the Boundary state islikely to have ladar data with a large difference in height.These distributions were set manually by analyzing the ladarfeatures from several rows of orchard data.
Figure 19 shows the prior distributions for different statedurations. The Tree distribution is a broad Gaussian centeredon the expected tree spacing from the GIS for this exampleof 11 feet (3.3m) with a hard limit of 15 feet (4.6m). TheGap distribution matches the Tree state, and the Boundarystate duration is assumed to be small. These priors were setthrough a visual analysis of the ground truth data and ladardata for several typical rows, and they were kept fairly broadto account for variable tree spacing within a row.
Figure 20 shows examples of the HSMM process at workfor cases when the trees are separated, the tree canopy mergestogether, and when there are tree gaps that contain replantedtrees. The plots show the probability of the ladar observationscomputed from the functions in Figure 18 for the Tree andBoundary states (the Gap state is not shown to reduceclutter since it is close to the inverse of the Tree state).These observation probabilities are combined with the priordistributions shown in Figure 19 by the HSMM through aset of backwards-forwards dynamic programming equationsthat find the optimal state sequence given the assumptionsin the model [15]. Because we have required the Tree andGap states to transition through the Boundary state, wecan easily extract estimated tree centers and gap centersfrom the midpoints between the boundary transitions, aswell as the estimated tree width from the duration of each
0 1 2 300.20.40.60.8
1
Height (m)
p(da
ta |
Tree
)
(a) Tree
0 1 2 300.20.40.60.8
1
Height (m)
p(da
ta |
Gap
)
(b) Gap
0 0.5 1 1.500.20.40.60.8
1
Height Diff (m)
p(da
ta |
Boun
dary
)
(c) Boundary
Fig. 18. HSMM data observation probability functions for each state
0 0.5 1 1.5 2 2.5 3 3.5 4 4.5 50
0.05
0.1
Tree Width (m)
p(Tr
ee W
idth
)
0 0.5 1 1.5 2 2.5 3 3.5 4 4.5 50
0.2
0.4
Boundary Width (m)p(Bo
unda
ry W
idth
)
Fig. 19. HSMM duration prior distributions for Tree and Boundarystates (Gap state prior distribution matches Tree prior distribution)
110 120 130 140 150 160 170 18000.10.20.30.40.50.60.70.8
Distance Along Row (m)
p(da
ta |
stat
e)
Labeled tree
p(data | Tree)p(data | Boundary)Detected tree or gap
(a) Individual trees visible
180 190 200 210 220 230 240 25000.10.20.30.40.50.60.70.8
Distance Along Row (m)
p(da
ta |
stat
e)
p(data | Tree)p(data | Boundary)Detected tree or gapLabeled tree
(b) Continuous wall of trees
20 30 40 50 60 70 80 9000.10.20.30.40.50.60.70.8
Distance Along Row (m)
p(da
ta |
stat
e)
Detected tree orLabeled tree
p(data | Tree)p(data | Boundary)
gap
(c) Gaps with replanted trees
Fig. 20. Input sensor data probabilities and HSMM detected trees and treegaps compared with ground truth labeled trees
state. These detected tree and gap locations are shown alongwith the ground truth tree locations marked by the operatorusing the interface in Figure 13. Given that the ground truthmeasurements are based on button presses by an operator asthey pass by trees while driving down the row, there is someuncertainty in their exact locations, but they serve as a useful
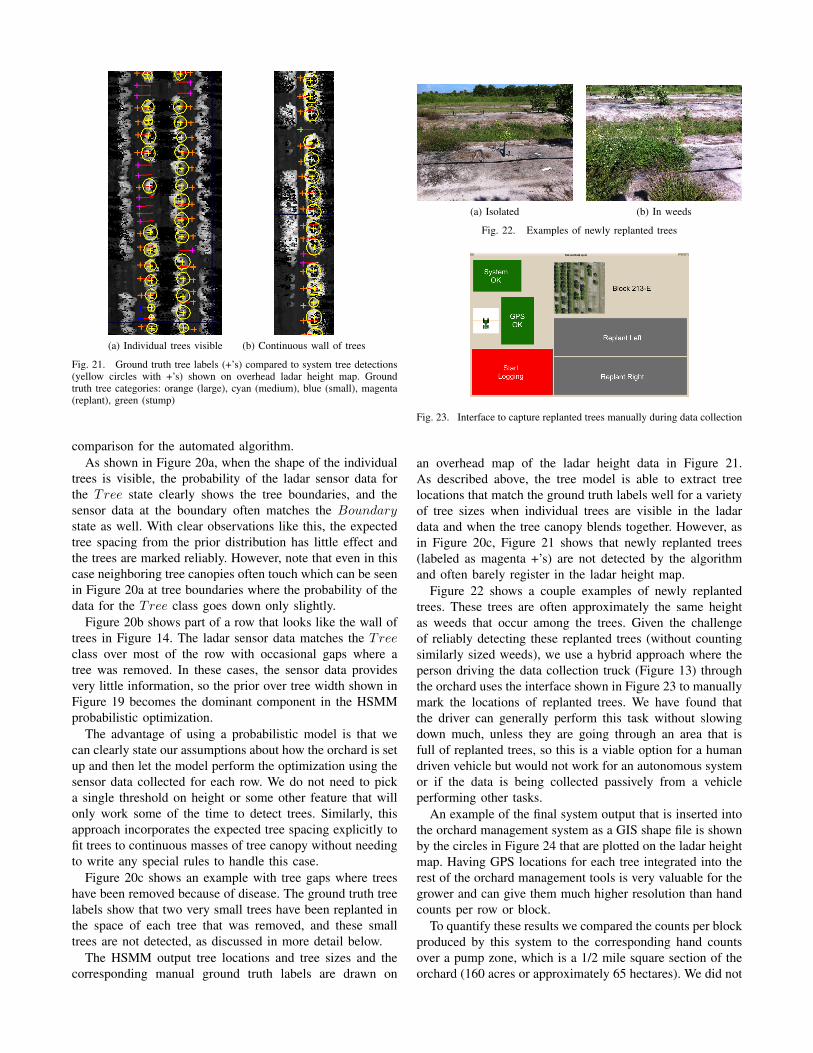
(a) Individual trees visible (b) Continuous wall of trees
Fig. 21. Ground truth tree labels (+’s) compared to system tree detections(yellow circles with +’s) shown on overhead ladar height map. Groundtruth tree categories: orange (large), cyan (medium), blue (small), magenta(replant), green (stump)
comparison for the automated algorithm.As shown in Figure 20a, when the shape of the individual
trees is visible, the probability of the ladar sensor data forthe Tree state clearly shows the tree boundaries, and thesensor data at the boundary often matches the Boundarystate as well. With clear observations like this, the expectedtree spacing from the prior distribution has little effect andthe trees are marked reliably. However, note that even in thiscase neighboring tree canopies often touch which can be seenin Figure 20a at tree boundaries where the probability of thedata for the Tree class goes down only slightly.
Figure 20b shows part of a row that looks like the wall oftrees in Figure 14. The ladar sensor data matches the Treeclass over most of the row with occasional gaps where atree was removed. In these cases, the sensor data providesvery little information, so the prior over tree width shown inFigure 19 becomes the dominant component in the HSMMprobabilistic optimization.
The advantage of using a probabilistic model is that wecan clearly state our assumptions about how the orchard is setup and then let the model perform the optimization using thesensor data collected for each row. We do not need to picka single threshold on height or some other feature that willonly work some of the time to detect trees. Similarly, thisapproach incorporates the expected tree spacing explicitly tofit trees to continuous masses of tree canopy without needingto write any special rules to handle this case.
Figure 20c shows an example with tree gaps where treeshave been removed because of disease. The ground truth treelabels show that two very small trees have been replanted inthe space of each tree that was removed, and these smalltrees are not detected, as discussed in more detail below.
The HSMM output tree locations and tree sizes and thecorresponding manual ground truth labels are drawn on
(a) Isolated (b) In weeds
Fig. 22. Examples of newly replanted trees
Fig. 23. Interface to capture replanted trees manually during data collection
an overhead map of the ladar height data in Figure 21.As described above, the tree model is able to extract treelocations that match the ground truth labels well for a varietyof tree sizes when individual trees are visible in the ladardata and when the tree canopy blends together. However, asin Figure 20c, Figure 21 shows that newly replanted trees(labeled as magenta +’s) are not detected by the algorithmand often barely register in the ladar height map.
Figure 22 shows a couple examples of newly replantedtrees. These trees are often approximately the same heightas weeds that occur among the trees. Given the challengeof reliably detecting these replanted trees (without countingsimilarly sized weeds), we use a hybrid approach where theperson driving the data collection truck (Figure 13) throughthe orchard uses the interface shown in Figure 23 to manuallymark the locations of replanted trees. We have found thatthe driver can generally perform this task without slowingdown much, unless they are going through an area that isfull of replanted trees, so this is a viable option for a humandriven vehicle but would not work for an autonomous systemor if the data is being collected passively from a vehicleperforming other tasks.
An example of the final system output that is inserted intothe orchard management system as a GIS shape file is shownby the circles in Figure 24 that are plotted on the ladar heightmap. Having GPS locations for each tree integrated into therest of the orchard management tools is very valuable for thegrower and can give them much higher resolution than handcounts per row or block.
To quantify these results we compared the counts per blockproduced by this system to the corresponding hand countsover a pump zone, which is a 1/2 mile square section of theorchard (160 acres or approximately 65 hectares). We did not
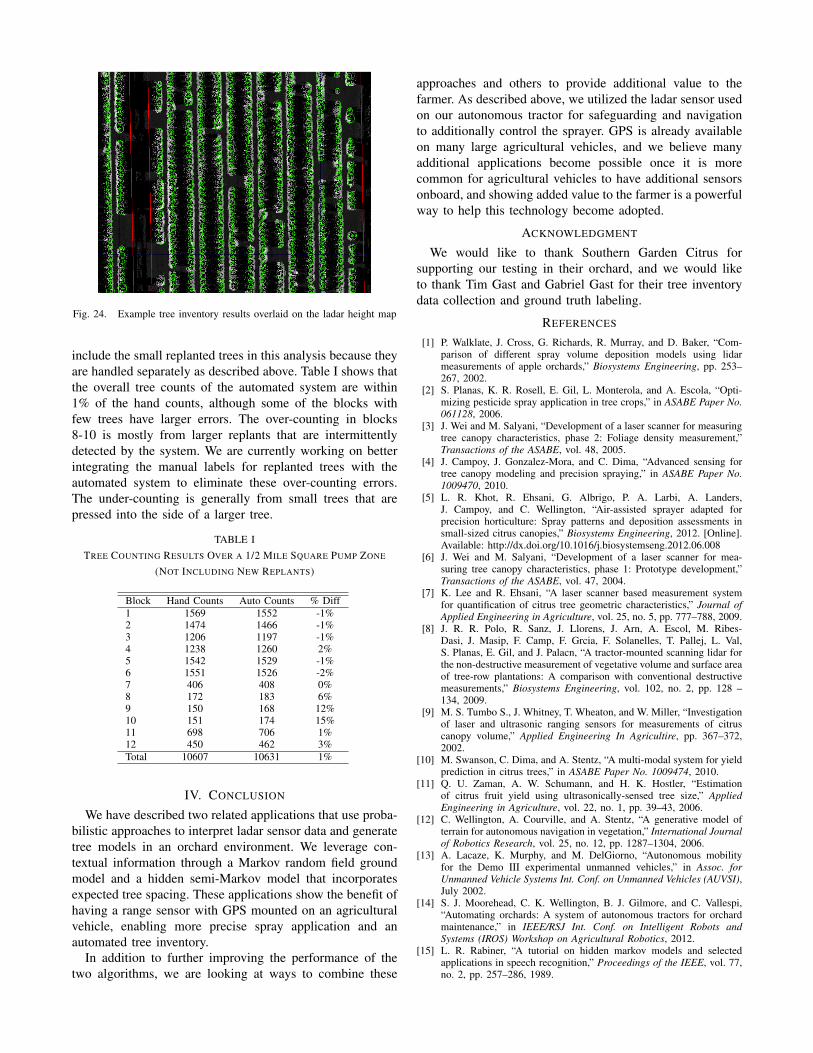
Fig. 24. Example tree inventory results overlaid on the ladar height map
include the small replanted trees in this analysis because theyare handled separately as described above. Table I shows thatthe overall tree counts of the automated system are within1% of the hand counts, although some of the blocks withfew trees have larger errors. The over-counting in blocks8-10 is mostly from larger replants that are intermittentlydetected by the system. We are currently working on betterintegrating the manual labels for replanted trees with theautomated system to eliminate these over-counting errors.The under-counting is generally from small trees that arepressed into the side of a larger tree.
TABLE ITREE COUNTING RESULTS OVER A 1/2 MILE SQUARE PUMP ZONE
(NOT INCLUDING NEW REPLANTS)
Block Hand Counts Auto Counts % Diff1 1569 1552 -1%2 1474 1466 -1%3 1206 1197 -1%4 1238 1260 2%5 1542 1529 -1%6 1551 1526 -2%7 406 408 0%8 172 183 6%9 150 168 12%10 151 174 15%11 698 706 1%12 450 462 3%Total 10607 10631 1%
IV. CONCLUSION
We have described two related applications that use proba-bilistic approaches to interpret ladar sensor data and generatetree models in an orchard environment. We leverage con-textual information through a Markov random field groundmodel and a hidden semi-Markov model that incorporatesexpected tree spacing. These applications show the benefit ofhaving a range sensor with GPS mounted on an agriculturalvehicle, enabling more precise spray application and anautomated tree inventory.
In addition to further improving the performance of thetwo algorithms, we are looking at ways to combine these
approaches and others to provide additional value to thefarmer. As described above, we utilized the ladar sensor usedon our autonomous tractor for safeguarding and navigationto additionally control the sprayer. GPS is already availableon many large agricultural vehicles, and we believe manyadditional applications become possible once it is morecommon for agricultural vehicles to have additional sensorsonboard, and showing added value to the farmer is a powerfulway to help this technology become adopted.
ACKNOWLEDGMENT
We would like to thank Southern Garden Citrus forsupporting our testing in their orchard, and we would liketo thank Tim Gast and Gabriel Gast for their tree inventorydata collection and ground truth labeling.
REFERENCES
[1] P. Walklate, J. Cross, G. Richards, R. Murray, and D. Baker, “Com-parison of different spray volume deposition models using lidarmeasurements of apple orchards,” Biosystems Engineering, pp. 253–267, 2002.
[2] S. Planas, K. R. Rosell, E. Gil, L. Monterola, and A. Escola, “Opti-mizing pesticide spray application in tree crops,” in ASABE Paper No.061128, 2006.
[3] J. Wei and M. Salyani, “Development of a laser scanner for measuringtree canopy characteristics, phase 2: Foliage density measurement,”Transactions of the ASABE, vol. 48, 2005.
[4] J. Campoy, J. Gonzalez-Mora, and C. Dima, “Advanced sensing fortree canopy modeling and precision spraying,” in ASABE Paper No.1009470, 2010.
[5] L. R. Khot, R. Ehsani, G. Albrigo, P. A. Larbi, A. Landers,J. Campoy, and C. Wellington, “Air-assisted sprayer adapted forprecision horticulture: Spray patterns and deposition assessments insmall-sized citrus canopies,” Biosystems Engineering, 2012. [Online].Available: http://dx.doi.org/10.1016/j.biosystemseng.2012.06.008
[6] J. Wei and M. Salyani, “Development of a laser scanner for mea-suring tree canopy characteristics, phase 1: Prototype development,”Transactions of the ASABE, vol. 47, 2004.
[7] K. Lee and R. Ehsani, “A laser scanner based measurement systemfor quantification of citrus tree geometric characteristics,” Journal ofApplied Engineering in Agriculture, vol. 25, no. 5, pp. 777–788, 2009.
[8] J. R. R. Polo, R. Sanz, J. Llorens, J. Arn, A. Escol, M. Ribes-Dasi, J. Masip, F. Camp, F. Grcia, F. Solanelles, T. Pallej, L. Val,S. Planas, E. Gil, and J. Palacn, “A tractor-mounted scanning lidar forthe non-destructive measurement of vegetative volume and surface areaof tree-row plantations: A comparison with conventional destructivemeasurements,” Biosystems Engineering, vol. 102, no. 2, pp. 128 –134, 2009.
[9] M. S. Tumbo S., J. Whitney, T. Wheaton, and W. Miller, “Investigationof laser and ultrasonic ranging sensors for measurements of citruscanopy volume,” Applied Engineering In Agricultire, pp. 367–372,2002.
[10] M. Swanson, C. Dima, and A. Stentz, “A multi-modal system for yieldprediction in citrus trees,” in ASABE Paper No. 1009474, 2010.
[11] Q. U. Zaman, A. W. Schumann, and H. K. Hostler, “Estimationof citrus fruit yield using ultrasonically-sensed tree size,” AppliedEngineering in Agriculture, vol. 22, no. 1, pp. 39–43, 2006.
[12] C. Wellington, A. Courville, and A. Stentz, “A generative model ofterrain for autonomous navigation in vegetation,” International Journalof Robotics Research, vol. 25, no. 12, pp. 1287–1304, 2006.
[13] A. Lacaze, K. Murphy, and M. DelGiorno, “Autonomous mobilityfor the Demo III experimental unmanned vehicles,” in Assoc. forUnmanned Vehicle Systems Int. Conf. on Unmanned Vehicles (AUVSI),July 2002.
[14] S. J. Moorehead, C. K. Wellington, B. J. Gilmore, and C. Vallespi,“Automating orchards: A system of autonomous tractors for orchardmaintenance,” in IEEE/RSJ Int. Conf. on Intelligent Robots andSystems (IROS) Workshop on Agricultural Robotics, 2012.
[15] L. R. Rabiner, “A tutorial on hidden markov models and selectedapplications in speech recognition,” Proceedings of the IEEE, vol. 77,no. 2, pp. 257–286, 1989.