orchid: piloting climate risk screening in dfid bangladesh · 2.2 bangladesh national policies and...
TRANSCRIPT
1
1 Institute of Development Studies (IDS), University of Sussex, UK 2 CEGIS – Center for Environmental and Geographic Information Services, Bangladesh 3 Bangladesh Institute of Development Studies (BIDS), Bangladesh 4 School of Development Studies-Overseas Development Group, University of East Anglia, UK 5 Tyndall Centre for Climate Research, University of East Anglia, UK 6 International Institute of Applied Systems Analysis (IIASA), Austria 7 Bangladesh Unnayan Parishad (BUP), Bangladesh 8 Bangladesh Centre for Advanced Studies (BCAS), Bangladesh
For further information and related reports: www.ids.ac.uk/climatechange
ORCHID: Piloting Climate Risk Screening in DFID Bangladesh
Detailed Research Report April 2007
Thomas Tanner1, Ahmadul Hassan2, KM Nabiul Islam3, Declan Conway4,5, Reinhard Mechler6, Ahsan Uddin Ahmed7, and Mozaharul Alam8.

2
ACKNOWLEDGEMENTS Advice and support by the following people and institutions is gratefully acknowledged: • Yolande Wright, Michael Scott, Sayeeda Tauhid, Najir Khan, Penny Davies and other staff at
DFID-Bangladesh, Jessica Troni DFID UK • Suraje Dessai and Patricia O’Mahony of School of Environmental Sciences, University of East
Anglia, UK for additional text and data preparation of scientific inputs. • Dr. Jelle van Gijn and others at Transport Sector Management Reform (TSMR), Dhaka • Engr. Iftekhar Ahmed Khan and Engr. Aminul Islam, RHD • Mr. Mosharaf Hossain, Social Development Officer, Mr. Zubair Haque, Infrastructure
Development Manager, Mr. M A Sekendar, Senior Infrastructure Engineering Advisor, Mr. Abdul Momin, Contacts Manager, Chars Livelihoods Programme (CLP)
• CLP beneficiaries including key-informants • Dr Tom Mitchell (IDS) and Dr Saleemul Huq (IIED) for advice and support SUGGESTED CITATION: Tanner TM, Hassan A, Islam KMN, Conway, D, Mechler R, Ahmed AU, and Alam, M (2007)
ORCHID: Piloting Climate Risk Screening in DFID Bangladesh. Detailed Research Report. Institute
of Development Studies, University of Sussex, UK.
RELATED REPORTS: Tanner TM, Hassan A, Islam KMN, Conway, D, Mechler R, Ahmed AU, and Alam, M (2007)
ORCHID: Piloting Climate Risk Screening in DFID Bangladesh. Summary Research Report.
Institute of Development Studies, University of Sussex, UK.
Islam KMN, and Mechler R (2007) ORCHID: Piloting Climate Risk Screening in DFID Bangladesh.
An Economic and Cost Benefit Analysis of Adaptation Options. Institute of Development
Studies, University of Sussex, UK

OVERVIEW OF THE REPORT
This report details a process to screen the DFID Bangladesh bilateral aid portfolio for climate risks. It pilots a methodological process for screening and assessment of adaptation options, explained in section 1. In section 2, a strategic review provides a brief analysis of the way that climate change has been and could be tackled through national policies and programmes. It then assesses the emerging challenges in relation to DFID’s policy context and its strategy and programming in Bangladesh.
Section 3 and 4 summarise the state of knowledge on future scenarios of climate change and present a set of revised data based on data from a range of models. Section 5 then assesses the secondary impacts of these changing climatic conditions through their effect on existing climate-related hazards.
Section 6 looks into the implications of climate-hazards for the economy, and summarises the damages from major existing hazards, particularly flooding. It presents a range of potential indicators of human vulnerability to climatic hazards that might be employed in order to assess resilience and identify hot-spot areas where capacity to cope with and adapt to climate shocks and stresses is low.
Section 7 then outlines the recommended adaptation and risk reduction options for the high priority programmes resulting from the screening exercise.
TABLE OF CONTENTS Section 1: Risk Screening Process and Assessment of Adaptation Options ................................................... 2
1.1 SUMMARY ....................................................................................................................................................2 1.2 RATIONALE FOR ACTION ...........................................................................................................................2 1.3 APPROACH: PORTFOLIO SCREENING AND CLIMATE RISK MANAGEMENT .......................................4 1.4 ORCHID: PILOTING A CLIMATE RISK SCREENING PROCESS IN BANGLADESH ................................5 1.5 THE INITIAL PORTFOLIO SCREENING METHODOLGY............................................................................8 1.6 RESULTS OF INITIAL SCREENING OF DFID-B’S PORTFOLIO...............................................................10
Section 2: Strategic Review of DFID Bangladesh and Climate Change ........................................................... 17 2.1 SUMMARY ..................................................................................................................................................17 2.2 BANGLADESH NATIONAL POLICIES AND CLIMATE CHANGE............................................................18 2.3 RECENT ADAPTATION POLICY DEVELOPMENTS IN BANGLADESH .................................................20 2.4 DFID POLICY CONTEXT............................................................................................................................23 2.5 DFID BANGLADESH – PORTFOLIO AND STRATEGY............................................................................24 2.6 STRATEGIC CONSIDERATIONS ..............................................................................................................25 2.7 SECTION 2 REFERENCES ........................................................................................................................28
Section 3: Review of Existing Climate Scenarios for Bangladesh.................................................................... 31 3.1 SUMMARY ..................................................................................................................................................31 3.2 CLIMATE CHANGE SCENARIOS FOR BANGLADESH...........................................................................32 3.3 FUTURE SEA LEVEL RISE........................................................................................................................34 3.4 FUTURE CYCLONE ACTIVITY IN THE BAY OF BENGAL.......................................................................35 3.5 SECTION 3 REFERENCES ........................................................................................................................35
Section 4: Development of New Climate Scenarios ........................................................................................... 37 4.1 SUMMARY ..................................................................................................................................................37 4.2 CLIMATE CHANGE SCENARIOS FOR BANGLADESH...........................................................................39 4.3 UNCERTAINTIES IN FUTURE CLIMATE CHANGE SCENARIOS ...........................................................43 4.4 PRESENTING UNCERTAINTIES IN CLIMATE CHANGE SCENARIOS AS PROBABILITIES................44 4.5 SECTION 4 REFERENCES ........................................................................................................................47
Section 5: Secondary Impacts of Climate Change in Bangladesh.................................................................... 48 5.1 SUMMARY ..................................................................................................................................................48 5.2 RIVER FLOWS AND FLOODING...............................................................................................................51 5.3 RELATING RIVER FLOWS TO AREA FLOODED......................................................................................57 5.4 FUTURE IMPACTS ON POTENTIAL FLOODED AREA AND DEPTH .....................................................59 5.5 SEA LEVEL RISE, COASTAL INUNDATION AND SALINITY INTRUSION .............................................64 5.6 CLIMATE CHANGE IMPACT ON CYCLONES AND STORM SURGES IN BANGLADESH ....................64 5.7 THE IMPACT OF FLOODING ON AGRICULTURAL YIELDS...................................................................69 5.8 IMPACTS OF DROUGHT ON CROP PRODUCTION ................................................................................73 5.9 THE EFFECTS OF EL NINO-SOUTHERN OSCILLATION (ENSO) EVENTS IN BANGLADESH............75 5.10 SECTION 5 REFERENCES ......................................................................................................................76
Section 6: Economic and Cost Benefit Analysis of Adaptation ........................................................................ 78 6.1 EXECUTIVE SUMMARY..............................................................................................................................78 6.2 CBA FOR CLIMATE AND DISASTER RISK...............................................................................................81 6.3 BACKWARD-LOOKING APPROACH AND ASSESSING RISK ................................................................88 6.4 CBAS OF SELECTED ADAPTATION OPTIONS USING A FORWARD-LOOKING FRAMEWORK.........95
6.4.1 Option 1: Flood-proofing of roads and highways ...........................................................................96 6.4.2 Option 2: Flood-proofing of individual homesteads in the Chars ..............................................104
6.5 CONCLUSIONS .......................................................................................................................................111 6.6 SECTION 6 REFERENCES ......................................................................................................................115
Section 7: Adaptation Options Assessment ..................................................................................................... 118 7.1 SUMMARY INTRODUCTION....................................................................................................................118 7.2 CHARS LIVELIHOODS PROGRAMME ...................................................................................................119 7.3 ECONOMIC EMPOWERMENT OF THE POOREST CHALLENGE FUND (EEP) ...................................128 7.4 TRANSPORT SECTOR MANAGEMENT REFORM PROGRAMME OF THE ROADS AND HIGHWAYS DEPARTMENT (RHD)......................................................................................................................................132 7.5 PRIVATE SECTOR DEVELOPMENT SUPPORT PROJECT (PSDSP) - NOW RISE .............................137 7.6 PROMOTING FINANCIAL SERVICES FOR POVERTY REDUCTION (PROSPER)...............................142 7.7 PHASE II, RURAL INFRASTRUCTURE IMPROVEMENT PROJECT (RIIP2).........................................146 7.8 SECOND PRIMARY EDUCATION DEVELOPMENT PROGRAMME (PEDP II)......................................149 7.9 SECOND URBAN PRIMARY HEALTH CARE PROJECT (UPHCP-II) ....................................................152 7.10 ENGLISH IN ACTION (EIA) ....................................................................................................................156

Section 1: Risk Screening Process
Section 1: Risk Screening Process and Assessment of Adaptation Options This section is authored by Thomas Tanner1 and Declan Conway2
1 Institute of Development Studies, University of Sussex 2 School of Development Studies-Overseas Development Group and Tyndall Centre for Climate Research, University of East Anglia 1.1 SUMMARY This section describes the rational, approach, design, and results of applying the initial stage of ORCHID climate risk screening process. The process is designed as a rapid assessment of potential risks and opportunities for integrating climate risk reduction and adaptation measures into DFID interventions. It aimed to minimise disruption to DFID programme staff by providing a ‘light touch’ initial screen to rule out interventions that have low climate sensitivity or mark them as high priority for follow-up later on.
This initial step of the screening process was designed to help DFID Bangladesh identify areas of its portfolio where either: a) Programme goals are directly at risk from impacts associated with climate-related
hazards; or b) Programme activities could inadvertently increase vulnerability to climate-related
hazards; or c) Programme activities could contribute to increasing the ability of poor people to
cope with and adapt to climate-related hazards; and d) Entry points exist to alter interventions to address the above.
Nine interventions were screened as high priority for follow-up and assessment of potential adaptation and risk reduction options
1.2 RATIONALE FOR ACTION
Bangladesh is among the most disaster prone countries in the world. It has suffered 170 large scale disasters between 1970 and 1998. The frequency of flooding episodes is growing, with catastrophic ‘once in a generation’ floods occurring more regularly. This includes eight major floods between 1974 and 2004, many of which are considered by hydrologists to be at a size expected only once in every 20 yearsi.
Many of the impacts associated with climate change are likely to alter and in some cases exacerbate the effects of climate variability, including those associated with droughts, floods and other extreme events. Climate change also brings new hazards such as global sea level rise. Although single events cannot be attributed directly to climate change, extreme events are expected to become more frequent over the twenty-first century, as a result of a globally changing climate. For Bangladesh, this means coping with the impacts of floods, droughts, cyclones, and extreme temperatures on a more regular basis.
These impacts have significant costs to human and natural systems. In the 1990s, global disaster costs were $652 billion in material losses, 15 times higher than in the 1950s. In Bangladesh, the 1998 flood affected more than 30 million people and caused economic losses of more than $3 billion, equivalent to 8% of the country’s GDP. However, impacts are not evenly distributed: The poorest nations of the world and the poorest people in developed countries are likely to be hardest hit by the effects of climate change because they:

Section 1: Risk Screening Process
3
o rely heavily on climate-sensitive sectors such as agriculture and fisheries;
o are less able to respond due to limited human, institutional and financial capacity;
o tend to be located geographically in more exposed or marginal areas, such as flood plains or on nutrient-poor soils.
Within developing countries themselves, poorer groups are most vulnerable to climate shocks and stresses. In Bangladesh, close to 56 million people still earn less than one dollar a day. Close to one out of every two rural Bangladeshis is poor and their livelihoods tend to be more dependent on the natural environment, but urban poverty is also high, at just under one out of four people. The existing frequency of hazards with disastrous consequences in Bangladesh and their impact on poor people’s lives and livelihoods are a compelling rationale for action to reduce the risks they pose.
With the poor most affected and the burden of hazards increasing, climate change threatens the objectives of national and international efforts to reduce poverty. It could compromise the effectiveness of aid investments and the achievement of the Millennium Development Goals. The distributional impacts of climate change also present a case for action based on justice and equity; the poorer nations, who have done least to contribute to human-induced climate change through their emissions of greenhouse gases, are likely to be hardest hit and least able to adapt to impactsii.
DFID has prioritised climate change as an issue not only because of its distributional impacts but also because of its urgency. Enabling adaptation is also an urgent need, as the climate system is already bound into a certain amount of change by existing atmospheric greenhouse gases; even if current emissions targets are met, concentrations would not be stabilised.
From a poverty reduction perspective, adaptation is already necessary as people’s lives and livelihoods face an increasing burden of broader shocks and stresses. As climate factors become an increasing part of the burden in many areas, development programmes will increasingly need to focus on reducing exposure and enhancing coping capacities of poor people, as well as ensuring others do not fall into poverty. The Stern Review highlights an economic case for action, based on lessons from the disaster risk reduction community, and suggests that while incurring some costs, inaction is likely to be far more costly than action on adaptation in the long run.
There is therefore a strong case for ensuring that development assistance manages risks posed by climatic factors. Risks can be direct threats to a project’s investment (e.g., the effects of extreme weather events on infrastructure), the underperformance of investments (e.g., irrigation investments that fail to pay off when rainfall decreases), or from investments that inadvertently increase vulnerability (known as mal-adaptation, e.g. when economic development triggers more vulnerability in high risk areas iii ). Based on a broad-brush screening of development cooperation in climate-sensitive sectors, the OECD estimates that as much as 53% of total donor expenditure in Bangladesh will be affected by climate impacts.
The impetus for integrating actions to facilitate adaptation within the context of development cooperation is reinforced by industrialised country commitments under the United Nations Framework Convention on Climate Change (UNFCCC) to provide resources to developing countries to assist in adapting to the impacts of climate change. A political declaration in 2001 agreed to minimum levels of additional financing for climate change adaptation activities, including through contributions to specific climate change funds and activities under additional ODA.
Section 1: Risk Screening Process
4
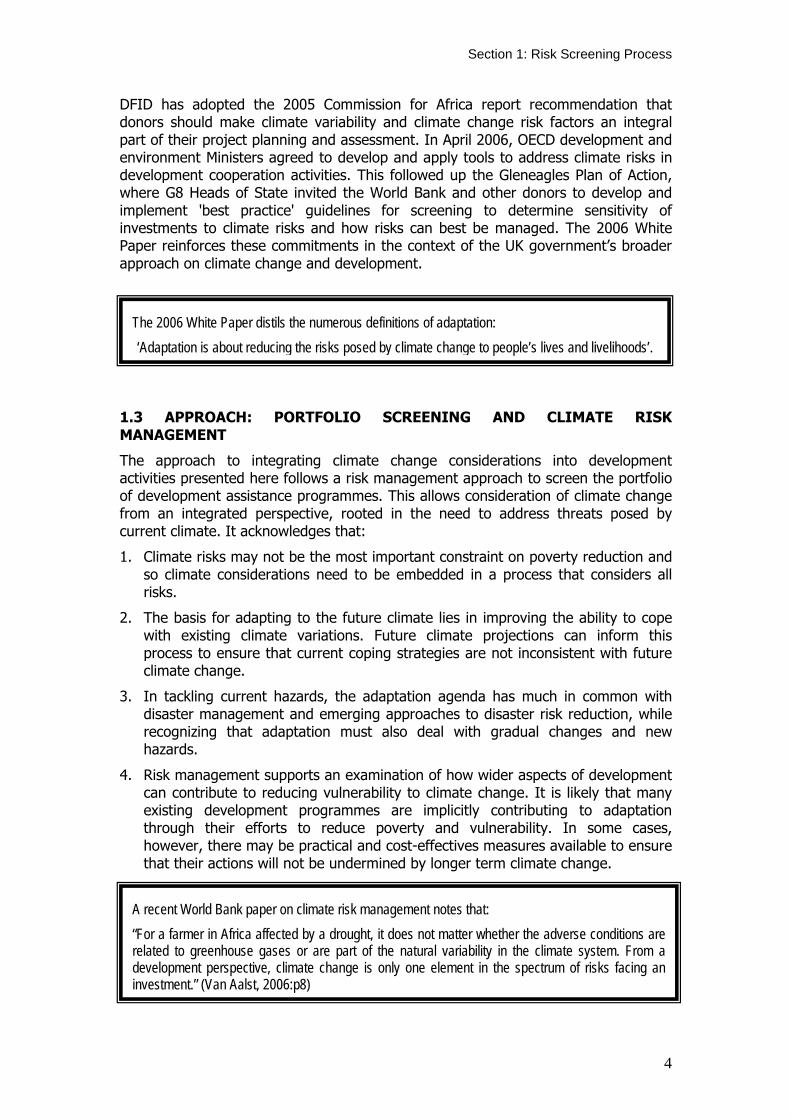
DFID has adopted the 2005 Commission for Africa report recommendation that donors should make climate variability and climate change risk factors an integral part of their project planning and assessment. In April 2006, OECD development and environment Ministers agreed to develop and apply tools to address climate risks in development cooperation activities. This followed up the Gleneagles Plan of Action, where G8 Heads of State invited the World Bank and other donors to develop and implement 'best practice' guidelines for screening to determine sensitivity of investments to climate risks and how risks can best be managed. The 2006 White Paper reinforces these commitments in the context of the UK government’s broader approach on climate change and development.
1.3 APPROACH: PORTFOLIO SCREENING AND CLIMATE RISK MANAGEMENT
The approach to integrating climate change considerations into development activities presented here follows a risk management approach to screen the portfolio of development assistance programmes. This allows consideration of climate change from an integrated perspective, rooted in the need to address threats posed by current climate. It acknowledges that:
1. Climate risks may not be the most important constraint on poverty reduction and so climate considerations need to be embedded in a process that considers all risks.
2. The basis for adapting to the future climate lies in improving the ability to cope with existing climate variations. Future climate projections can inform this process to ensure that current coping strategies are not inconsistent with future climate change.
3. In tackling current hazards, the adaptation agenda has much in common with disaster management and emerging approaches to disaster risk reduction, while recognizing that adaptation must also deal with gradual changes and new hazards.
4. Risk management supports an examination of how wider aspects of development can contribute to reducing vulnerability to climate change. It is likely that many existing development programmes are implicitly contributing to adaptation through their efforts to reduce poverty and vulnerability. In some cases, however, there may be practical and cost-effectives measures available to ensure that their actions will not be undermined by longer term climate change.
The 2006 White Paper distils the numerous definitions of adaptation: ‘Adaptation is about reducing the risks posed by climate change to people’s lives and livelihoods’.
A recent World Bank paper on climate risk management notes that: “For a farmer in Africa affected by a drought, it does not matter whether the adverse conditions are related to greenhouse gases or are part of the natural variability in the climate system. From a development perspective, climate change is only one element in the spectrum of risks facing an investment.” (Van Aalst, 2006:p8)

Section 1: Risk Screening Process
5
The Stern Review on the Economics of Climate Change notes that adaptation needs to build on good development practice and progress can make in assisting these processes, noting that:
“If individuals and communities are empowered by development and rendered less vulnerable overall, they will be better able to adapt to climate change.’iv
DFID-funded development programmes therefore have a key role to play both in creating an enabling environment in which managing climate risks becomes part of regular decision-making at all scales, and in supporting broader development processes that reduce vulnerability to climate shocks and stresses. In order to facilitate this role, DFID has initiated climate risk screening of bilateral development assistance portfolios at country level.
The development of a method for climate risk assessment of DFID portfolios recognised the need to strike a balance between rigour and demands on DFID staff time. The approach has therefore recognised that: − The method should be simple enough for programme officers and advisors to
work through the checklist − The method should act as a tool for increasing awareness of climate change
impacts − The process of identifying adaptation options in partnership with programme
staff is important to the process − The work and any final method needs to be easily understandable and a ‘light
touch’ on staff time.
1.4 ORCHID: PILOTING A CLIMATE RISK SCREENING PROCESS IN BANGLADESH
As a country with significant levels of poverty and where existing variations in climate and extreme events significantly affect development patterns, Bangladesh represents a priority for assessing and managing climate risks in the context of UK development assistance. The portfolio screening process outlined here acts as an early testing ground to inform work elsewhere, but also as a means of facilitating the integration of adaptation and risk reduction within the current and planned range of development activities.
ORCHID (Opportunities and Risks of Climate Change and Disasters) was designed as an iterative approach to climate risk screening. ORCHID works to enhance adaptation as a process rather than a set of discrete inputs and outputs. As such, it emphasises the need to raise awareness of current hazards, of climate change threats and of opportunities to reduce risks and how these are linked to policies, objectives and activities.
The process accepts from the outset that it will not be feasible to reduce all risks and that decisions on risk reduction will involve judgements and trade-offs, particularly in the face of uncertainty about future changes. Nor does it promote across the board prioritisation of climate change issues. Instead, it aims to enable a systematic consideration of climate risks in the context of aid programmes, highlighting where climate factors night need to be taken into account. The key objectives of the process are outlined in the box below.
Section 1: Risk Screening Process
6
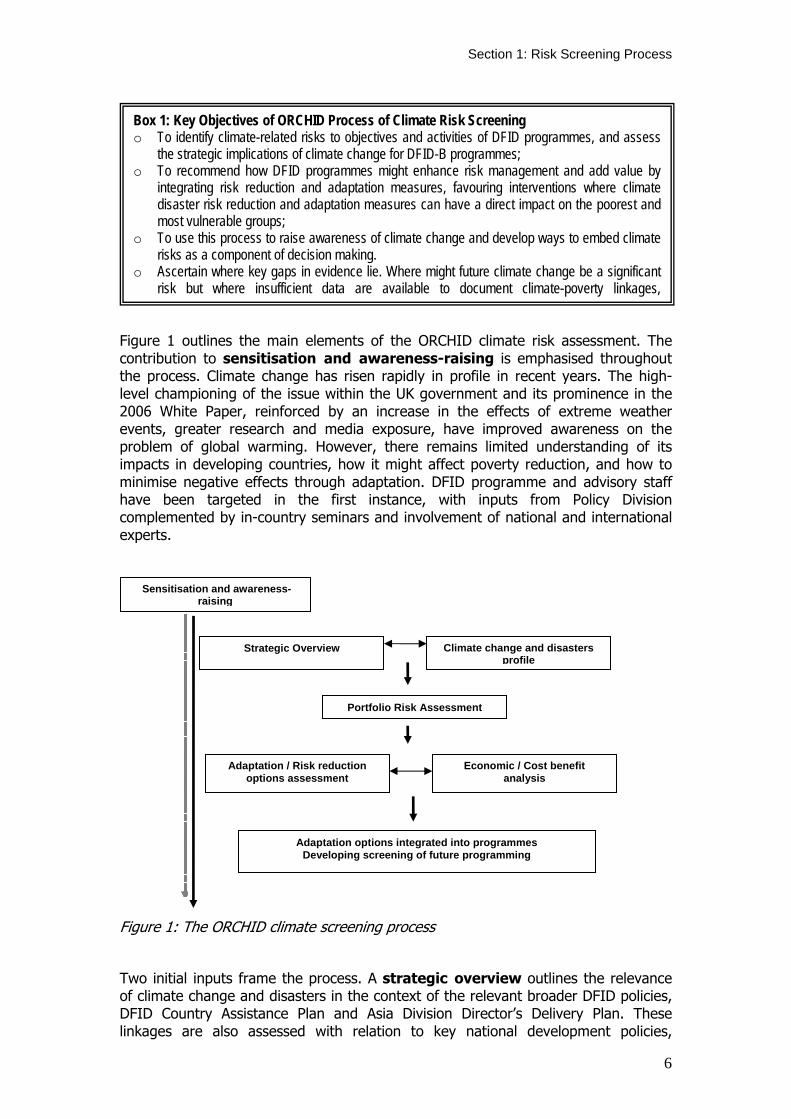
Figure 1 outlines the main elements of the ORCHID climate risk assessment. The contribution to sensitisation and awareness-raising is emphasised throughout the process. Climate change has risen rapidly in profile in recent years. The high-level championing of the issue within the UK government and its prominence in the 2006 White Paper, reinforced by an increase in the effects of extreme weather events, greater research and media exposure, have improved awareness on the problem of global warming. However, there remains limited understanding of its impacts in developing countries, how it might affect poverty reduction, and how to minimise negative effects through adaptation. DFID programme and advisory staff have been targeted in the first instance, with inputs from Policy Division complemented by in-country seminars and involvement of national and international experts.
Figure 1: The ORCHID climate screening process
Two initial inputs frame the process. A strategic overview outlines the relevance of climate change and disasters in the context of the relevant broader DFID policies, DFID Country Assistance Plan and Asia Division Director’s Delivery Plan. These linkages are also assessed with relation to key national development policies,
Sensitisation and awareness-raising
Strategic Overview
Portfolio Risk Assessment
Climate change and disasters profile
Adaptation options integrated into programmes Developing screening of future programming
Adaptation / Risk reduction options assessment
Economic / Cost benefit analysis
Box 1: Key Objectives of ORCHID Process of Climate Risk Screening o To identify climate-related risks to objectives and activities of DFID programmes, and assess
the strategic implications of climate change for DFID-B programmes; o To recommend how DFID programmes might enhance risk management and add value by
integrating risk reduction and adaptation measures, favouring interventions where climate disaster risk reduction and adaptation measures can have a direct impact on the poorest and most vulnerable groups;
o To use this process to raise awareness of climate change and develop ways to embed climate risks as a component of decision making.
o Ascertain where key gaps in evidence lie. Where might future climate change be a significant risk but where insufficient data are available to document climate-poverty linkages,

Section 1: Risk Screening Process
7
including PRS, sectoral and regional policies, particularly those which tackle disasters and climate change policy directly such as National Adaptation Programmes of Action (NAPAs). This is revisited towards the end of the screening in order to highlight strategic issues and opportunities for integrating climate change adaptation and disaster risk reduction into DFID programmes. Results are presented in Section 2 of this report.
A disasters and climate change profile complements this overview. Drawing extensively on existing literature, this profile summarises the main climate shocks and stresses experienced in the country and outlines the implications of climate change projections for this hazard burden and in creating new hazards such as sea-level rise. This work is later revisited to provide inputs relevant to regions and sectors for the risk assessment related to screened interventions. Sections 3, 4 of this report summarise future climate change projections and secondary impacts are presented in section 5.
The portfolio assessment builds on these inputs to undertake an initial portfolio screening to classify projects within the DFID country office into high, medium or low priority for further assessment. This classification is carried out in collaboration with relevant programme staff using a checklist of criteria that can be varied according to specific country requirements and objectives. These criteria are likely to include identifying areas of its portfolio where goals or activities are sensitive to the impacts of climate-related hazards, where activities could significantly alter the capacity to cope with climate-related hazards, the extent of existing risk management practices, project budgets and life-spans. It can also take into account pragmatic considerations such as data availability, partnerships, opportunities to influence programmes and practical entry-points. This stage of the process is presented later in this section of the report (section 1.5).
Drawing on more detailed project documents, these priority interventions then undergo a climate risk assessment. Through use of the science inputs and a more detailed examination of project objectives and activities, risks are assessed in terms of hazard intensity, change and certainty of change, and the sensitivity and exposure of target systems. The analysis also highlights potential entry-points and opportunities for integrating disaster risk reduction and climate change adaptation within the context of programme activities or design. A range of potential adaptation options is based on this assessment, drawing on previous studies, government reports to the UNFCCC, and national policy priorities elaborated in the NAPA.
These are worked through with programme and advisory staff using guiding criteria to perform an adaptation options assessment. Both the options and criteria are developed and discussed in consultation with both staff and national climate change experts. For selected options a cost benefit analysis is undertaken to demonstrate the economic efficiency of proposed measures. This economic analysis is also used to provide estimates of future climate change impacts with and without adaptive responses across the whole economy. A methodology for cost benefit analysis and economic analysis, and two adaptation option examples is presented in section 6 of this report. A summary of the adaptation options resulting from the risk assessment are shown in Section 7.
Aside from awareness-raising and sensitisation functions, the end point for the exercise is to facilitate the integration of risk reduction and adaptation within DFID programmes. It also provides lessons as to how such screening might be integrated into regular processes of programme development as part of the project cycle and strategic development.

Section 1: Risk Screening Process
8
1.5 THE INITIAL PORTFOLIO SCREENING METHODOLGY
Information and data requirements for the initial screening exercise
As a first step in the process, DFID officers provided researchers with details of current and planned interventions in the portfolio. A table was generated as simply as possible from PRISM containing as a minimum the information shown in the headings of Table 1, below. Inclusion of additional information is at the discretion of the country office.
Table 1: Example of data sheet provided by DFID-B Growth team.
3. Preparatory screening carried out by researchers The researchers use this information to initially screen out programmes that either:
a. Have less than 2 years to run; or b. Have a budget allocation of less than £1 million.
These interventions matching either of these criteria will not be considered for climate risk assessment in order to give priority to those with the greatest potential for alterations to the intervention to reduce risk. The £1 million cut off reflects the level at which DFID Environmental Screening is required. 4. Initial screening by DFID staff and researchers
The screening a general introduction to the whole office in order to explain the purpose and the objectives of the screening exercise, methods and to provide a short explanation of key climatic hazards and future climate change impacts in the region of interest. This was followed up by meetings between researchers and DFID staff such as advisers and programme officers.
This first step uses a checklist screening tool, which allows researchers and staff to make an informed rating of the priority for undertaking a more detailed risk assessment. It is not intended to comprehensively assess risks, but rather provides a means of rapidly identifying those areas of the portfolio that are more likely to be high risk or with greater potential for risk reduction measures. In this way, programmes that are not sensitive to climate impacts, are less likely to contribute to changing vulnerability to these impacts, or are not practical, are left aside in favour of more climate-sensitive, vulnerability-related, and pragmatic areas of the portfolio.
The checklist starts with basic information on the intervention such as identifier code, budget, duration and activities. After discussion and testing we settled on just five questions listed below that cover vulnerability of the intervention sector/region and objectives to existing hazards, existing arrangements for risk 1 , practical considerations and a final recommendation. Each question is followed by space for comments to explain the answer where appropriate. During testing it was found that a clear explanation of intervention activities was vital to the process, particularly for
1 Note that the present DFID environment screening note could possibly form an appropriate entry point for implementing a climate risk screening procedure across DFID.
Purpose Scoring
Project period
Inter-vention name
Last year
This year
MIS Code
Allocation
£ million Start End
Core DFID Team Advisers, Pos
Other Funding Partners

Section 1: Risk Screening Process
9
making the final decision. On average the initial screening took between 5-15 minutes per intervention.
The initial screening tool questions Vulnerability to existing hazards: Q1. Is the programme sector or regional focus vulnerable to variations in climate? Tick as appropriate (this list could be altered for different countries) Hazard
River floods
Flash floods
Riverbank erosion
Drought
Cyclone / storm surge
Heatwaves / cold spells
Sea-level rise
Groundwater salinity
This question is aided by the use of national maps showing key natural hazards and vulnerability profiles.
Q2. Are the intervention’s objectives vulnerable to variations in climate? Existing risk management: Q3. Does the intervention already take climate hazards into consideration? Practical considerations: Q4. What other factors might influence the intervention’s suitability for more detailed risk assessment? Examples are provided such as;
Partnership considerations with other donors / agencies Intervention activities still in design phase
Final recommendation on follow-up: Q5. In light of the above, please rate the priority of the intervention for follow-up risk assessment: Some guidance is given at this stage to discuss considerations in the ranking process which involves screening for one of three outcomes; Guidance: In assessing the priority rating, greatest weight should be given to threats to programme objectives and practical considerations for incorporating disaster risk reduction and adaptation.
Red = Further risk assessment recommended as high priority: Significant climate sensitivity / opportunities for reducing risks
Orange = Further risk assessment medium priority for DFID office: Some climate sensitivity / opportunities for reducing risks

Section 1: Risk Screening Process
10
Yellow = Further risk assessment low priority for DFID office: Low climate sensitivity / opportunities for reducing risks
1.6 RESULTS OF INITIAL SCREENING OF DFID-B’S PORTFOLIO Existing and pipeline (design phase) interventions in the three teams of DFID-B were screened and the results are listed in Tables 2 and 3. Out of a total 52 interventions 10 were screened red, indicating further risk assessment, seven were screened orange (medium priority, potential for follow-up) and 35 screened yellow and therefore deemed low priority and to require no further action. Table 2. Summary of screening outcomes DFID-B portfolio – three teams.
Team Portfolio Red
(High priority)
Orange
(Medium priority)
Yellow
(Low priority)
Growth 5 2 16
Human Development
3 4 7
Governance 2 1 12
Red = Further risk assessment recommended as high priority: Significant climate sensitivity / opportunities for reducing risks Orange = Further risk assessment medium priority for DFID office: Some climate sensitivity / opportunities for reducing risks Yellow = Further risk assessment low priority for DFID office: Low climate sensitivity / opportunities for reducing risks. It was clear during discussions that many interventions in Bangladesh have a background exposure to climate change because of the potentially extensive effects of flooding and sea level rise. Not all these interventions are screened red (as there may be no direct threat to objectives) and therefore there is a need to ensure that some feedback occurs (perhaps at the national strategic level) to raise awareness of this background risk and its implications for poverty reduction/infrastructure. This could include greater DFID emphasis on implementing agencies and B-Government ensuring compliance with building regulations and disaster management (or even to initiate pressure to improve standards in the light of future climate change impacts).
Section 1: Risk Screening Process
11
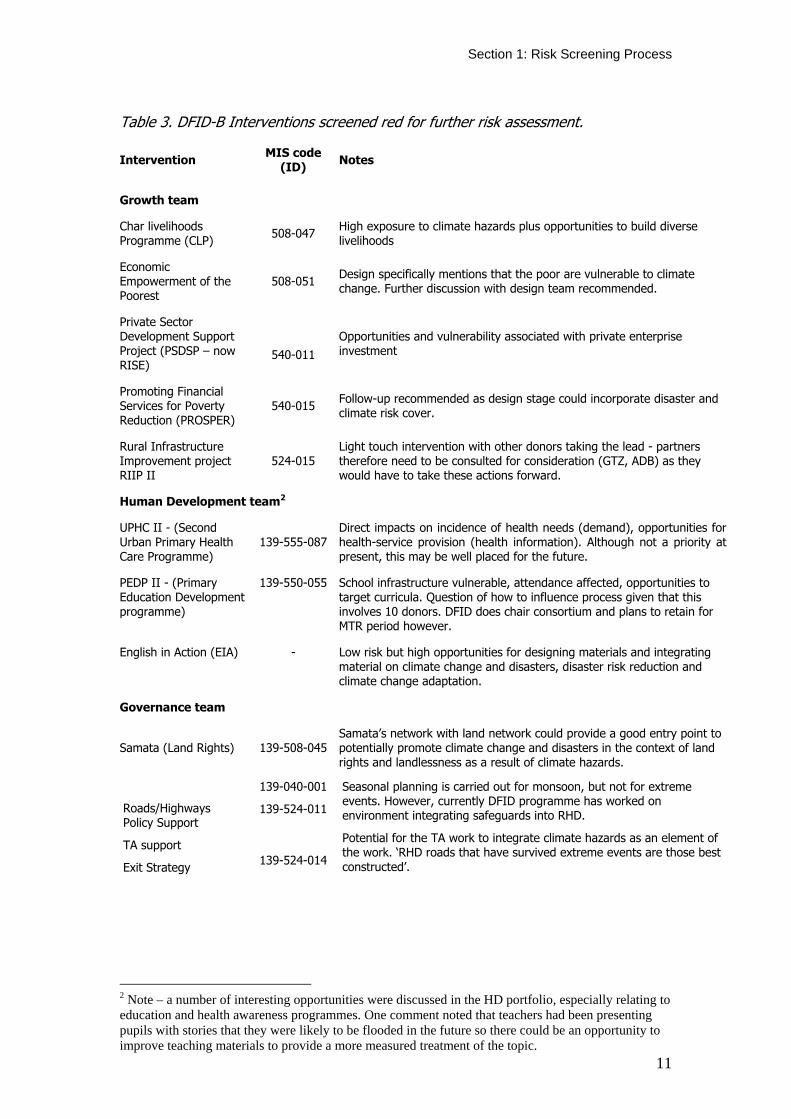
Table 3. DFID-B Interventions screened red for further risk assessment.
Intervention MIS code (ID) Notes
Growth team
Char livelihoods Programme (CLP) 508-047 High exposure to climate hazards plus opportunities to build diverse
livelihoods
Economic Empowerment of the Poorest
508-051 Design specifically mentions that the poor are vulnerable to climate change. Further discussion with design team recommended.
Private Sector Development Support Project (PSDSP – now RISE)
540-011 Opportunities and vulnerability associated with private enterprise investment
Promoting Financial Services for Poverty Reduction (PROSPER)
540-015 Follow-up recommended as design stage could incorporate disaster and climate risk cover.
Rural Infrastructure Improvement project RIIP II
524-015 Light touch intervention with other donors taking the lead - partners therefore need to be consulted for consideration (GTZ, ADB) as they would have to take these actions forward.
Human Development team2
UPHC II - (Second Urban Primary Health Care Programme)
139-555-087 Direct impacts on incidence of health needs (demand), opportunities for health-service provision (health information). Although not a priority at present, this may be well placed for the future.
PEDP II - (Primary Education Development programme)
139-550-055 School infrastructure vulnerable, attendance affected, opportunities to target curricula. Question of how to influence process given that this involves 10 donors. DFID does chair consortium and plans to retain for MTR period however.
English in Action (EIA) - Low risk but high opportunities for designing materials and integrating material on climate change and disasters, disaster risk reduction and climate change adaptation.
Governance team
Samata (Land Rights) 139-508-045 Samata’s network with land network could provide a good entry point to potentially promote climate change and disasters in the context of land rights and landlessness as a result of climate hazards.
139-040-001
139-524-011 Roads/Highways Policy Support
TA support
Exit Strategy 139-524-014
Seasonal planning is carried out for monsoon, but not for extreme events. However, currently DFID programme has worked on environment integrating safeguards into RHD.
Potential for the TA work to integrate climate hazards as an element of the work. ‘RHD roads that have survived extreme events are those best constructed’.
2 Note – a number of interesting opportunities were discussed in the HD portfolio, especially relating to education and health awareness programmes. One comment noted that teachers had been presenting pupils with stories that they were likely to be flooded in the future so there could be an opportunity to improve teaching materials to provide a more measured treatment of the topic.

Section 1: Risk Screening Process
12
Growth Team – summary table of initial screening for climate risk
Intervention period Intervention MIS code
(ID) Budget
Start End
Recommendation Notes
Bhairab Bridge 524-008
030-001
3,940,000 (TA)
17,800,000 (FA)
Oct-00 Complete Yellow
Project completion report finalised. Only 40,000 technical assistance remaining until 2008 (ops and maintenance)
Bridge Replacement Project (BRP)
BRP
524-009
031-001
2,500,000 (TA)
9,500,000 (FA)
Feb-00 Jul-07 Yellow Project complete
BRAC CFPR 508-043 16,200 Jan-02 Dec-06 Yellow Project end < 2 years
Consolidation of Institutional Development component
524-006 22,370,000 Nov-98 Mar-06 Yellow Project end < 2 years
Care Income III 542-011D 5,000,000 Dec-00 Dec 06 Yellow Project end < 2 years
CBFM 504-040 1,200000 Sep-01 Mar-07 Yellow Project end < 2 years
Char livelihoods Programme (CLP) 508-047 50,662,000 Oct-02 Oct-10 Red
High exposure to climate hazards plus opportunities to build diverse livelihoods
Comprehensive Disaster Management Programme (CDMP)
542-067 6,006,870 Mar-04 Feb-09 Yellow
All project activities contribute directly or indirectly to climate risk education.
Local disaster risk reduction facility exists to help enhance community resilience to current and long term risks.
Development Business Service Minute (DBSM)
540-010 8,808,000 Oct-02 Sept-07 Yellow Project end < 2 years
Enterprise Growth & Bank Modernisation (EGBM)
540-014 54,150,000 Jul 04 Jun-09 Yellow
Intervention deals with downsizing state owned enterprises and supporting retrenched workers. No further follow-up required.
Elimination Worst forms of Child Labour (ILO)
542-063 910,000 Sep-02 Mar-06 Yellow Project end < 2 years
LGED Portable Steel Bridging
043-001 FA
524-013 TA
6,950,000
50,000 Apr 06 Mar-07 Yellow Project end < 2 years
Policy Dev. Funds (PDF) 599-070 0.500 May-04 April-07 Yellow Project end < 2 years
Remittances (RPP) 540-016 7,500,000 Feb-06 Mar-09 Yellow Project end < 2 years
Rural Electrification Development
540-012 TA
2,200,000 48,000,000 Jan 06 Dec 10 Orange Infrastructure component will be
vulnerable in the future

Section 1: Risk Screening Process
13
Programme (REDP)
041-001 FA
South Asia Enterprise Development facilities (SEDF)
540-009 3,795,000 April-02 Mar—07 Yellow Project end < 2 years
Vulnerable Group Development (VGD)
559-002 7,500,000 Nov- 05 Aug 06 Yellow Project end < 2 years
WFP Partnership 542-068 70,00,000 Mar 04 Feb- 10 Yellow Project end < 2 years
Interventions Design and PCN stage
Economic Empowerment of the Poorest
508-051 50,000,000 Mar-06 - Red
Design specifically mentions that the poor are vulnerable to climate change. Further discussion with design team recommended.
UPPR (LPUPAP-UN Habitat) 546-005 60,100,000 May-06 - Orange
Note that adaptation options cannot be assessed until proposals are developed. Further discussion with design team recommended (environment specialist to be included).
Private Sector Development Support Project (PSDSP – now RISE)
540-011 40,300,000 Jun-06 - Red
Opportunities and vulnerability associated with private enterprise investment
Promoting Financial Services for Poverty Reduction (PROSPER)
540-015 25,150,000 Mar-06 - Red Follow-up recommended as design stage could incorporate disaster and climate risk cover.
Other plans
Rural Infrastructure Improvement project RIIP II
524-015 35,000,000 - - Red
Light touch intervention with other donors taking the lead - partners therefore need to be consulted for consideration (GTZ, ADB) as they would have to take these actions forward.
Private Sector Instrument (PSI)/Diaspora Bond
- 25,000,000 Aug. 06 June 09
Total interventions = 24 Red = 5, Orange = 2, Yellow = 16

Section 1: Risk Screening Process
14
Human Development Team – summary table of initial screening for climate risk
Intervention period Intervention MIS code
(ID) Budget
Start End
Recommendation Notes
Strategic Investment HIV/AIDS Prevention and Control
139-036-001 4,450 Mar-01 Oct-06 Yellow Project end < 2 years
Polio Eradication 139-555-077 7,000 Jul-00 Dec-06 Yellow Project end < 2 years
UPHC II - (Second Urban Primary Health Care Programme)
139-555-087 15,400 Jul-05 Dec-11 Red
Direct impacts on incidence of health needs (demand), opportunities for health-service provision (health information). Although not a priority at present, this may be well placed for the future.
HNPSP - (Health Nutrition and Population Sector Programme)
139-044-001 100,000 Jan-06 Jun-10 Orange
Sector-wide approach but includes emergency preparedness and relief (with related opp.s). However, given multiple donor set-up, and other concerns there is limited potential at this point.
PEDP II - (Primary Education Development programme)
139-550-055 100,000 Jan-04 Dec-09 Red
School infrastructure vulnerable, attendance affected, opportunities to target curricula. Question of how to influence process given that this involves 10 donors. DFID does chair consortium and plans to retain for MTR period however.
BEP IV - (BRAC Education Programme)
139-550-056 32,000 Jul-04 Jun-09 Orange
Some potential to share information with BRAC.
National curriculum would influence programme delivery. School attendance affected by hazard events
UCEP- (Underprivileged Child Education Programme)
139-550-022 6,448 Aug-94 Jun-07 Yellow Project end < 2 years
FIVDP - (Friends in Village Development)
139-550-052 2,110 Jan-99 Jun-06
PLCE - (Post Literacy and Continuing Education)
139-037-001 9,000 Mar-02 Feb-08 Yellow Project end < 2 years
SHEWA-B - (New Phase)
Sanitation, hygiene education and water supply
139-034-001 27,250 Apr-00 Dec-05 Orange
Already quite responsive to shorter term issues and project too close to completion to provide a good opportunity.
Section 1: Risk Screening Process
15
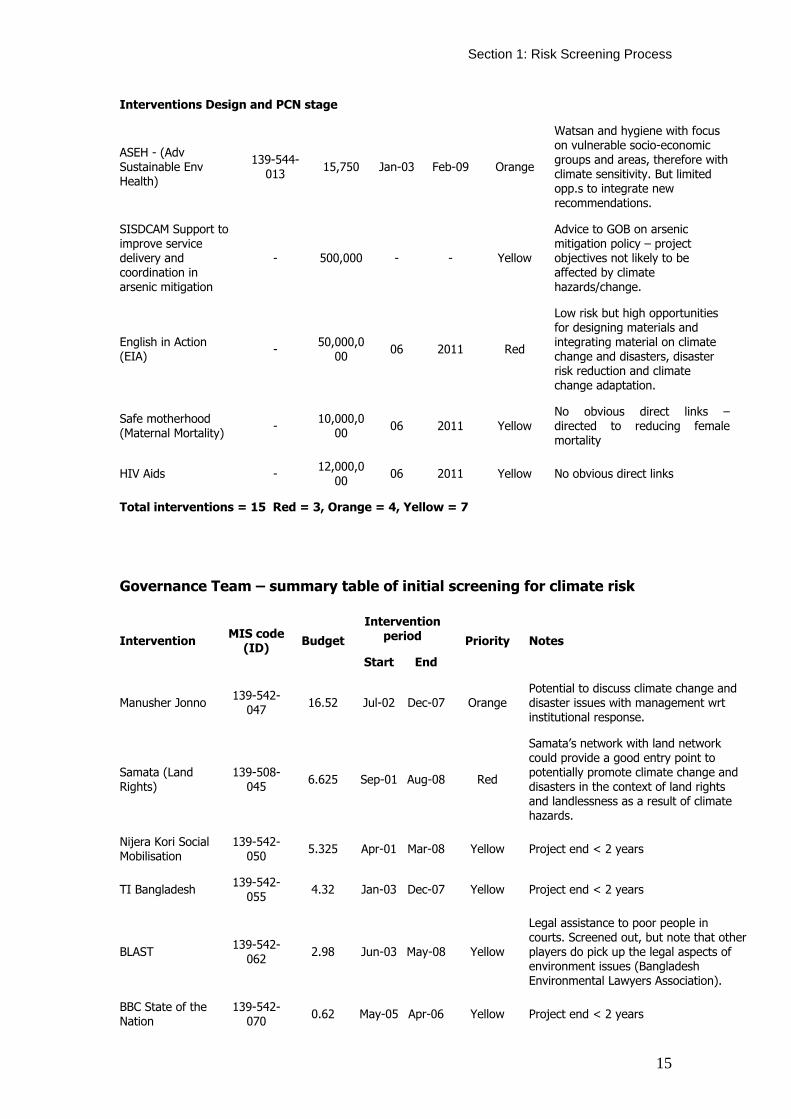
Interventions Design and PCN stage
ASEH - (Adv Sustainable Env Health)
139-544-013 15,750 Jan-03 Feb-09 Orange
Watsan and hygiene with focus on vulnerable socio-economic groups and areas, therefore with climate sensitivity. But limited opp.s to integrate new recommendations.
SISDCAM Support to improve service delivery and coordination in arsenic mitigation
- 500,000 - - Yellow
Advice to GOB on arsenic mitigation policy – project objectives not likely to be affected by climate hazards/change.
English in Action (EIA) - 50,000,0
00 06 2011 Red
Low risk but high opportunities for designing materials and integrating material on climate change and disasters, disaster risk reduction and climate change adaptation.
Safe motherhood (Maternal Mortality) - 10,000,0
00 06 2011 Yellow No obvious direct links – directed to reducing female mortality
HIV Aids - 12,000,000 06 2011 Yellow No obvious direct links
Total interventions = 15 Red = 3, Orange = 4, Yellow = 7
Governance Team – summary table of initial screening for climate risk
Intervention period Intervention MIS code
(ID) Budget
Start End
Priority Notes
Manusher Jonno 139-542-047 16.52 Jul-02 Dec-07 Orange
Potential to discuss climate change and disaster issues with management wrt institutional response.
Samata (Land Rights)
139-508-045 6.625 Sep-01 Aug-08 Red
Samata’s network with land network could provide a good entry point to potentially promote climate change and disasters in the context of land rights and landlessness as a result of climate hazards.
Nijera Kori Social Mobilisation
139-542-050 5.325 Apr-01 Mar-08 Yellow Project end < 2 years
TI Bangladesh 139-542-055 4.32 Jan-03 Dec-07 Yellow Project end < 2 years
BLAST 139-542-062 2.98 Jun-03 May-08 Yellow
Legal assistance to poor people in courts. Screened out, but note that other players do pick up the legal aspects of environment issues (Bangladesh Environmental Lawyers Association).
BBC State of the Nation
139-542-070 0.62 May-05 Apr-06 Yellow Project end < 2 years

Section 1: Risk Screening Process
16
Gov. Policy Dev. Fund
139-599-071 0.5 Jun-04 Yellow Project end < 2 years
Enhancing Voice of Women (NUK)
139-542-066 0.45 Apr-05 May-06 Yellow Project end < 2 years
DRC Chronic Poverty
139-542-061 0.43 Nov-01 Oct-06 Yellow Project end < 2 years
PRSP Support fund
139-542-054 0.30 May-01 Jun-07 Yellow Project end < 2 years
Financial Reform - FMRP
139-542-052 18.85 Mar-03 Mar-08 Yellow Project end < 2 years
Public Service Capacity Building-MATT-2
139-542-065 15.203 May-06 Mar-11 Yellow No major climate risks to sector
Revenue Reform (RIRA)
139-542-051 8.25 Feb-02 Jun-07 Yellow Project end < 2 years
Police Reform Project
139-542-069 5.85 Jan-04 Jun-07 Yellow Project end < 2 years
Roads/Highways Policy Support
139-040-001 36.0 Sep-04 Aug-09
Roads/Highways Policy Support TA
139-524-011 4.0 Sep-04 Aug-09
Roads/Highways Exit Strategy
139-524-014 3.5 Apr-06 Mar-09
Red
Seasonal planning is carried out for monsoon, but not for extreme events. However, currently DFID programme has worked on environment integrating safeguards into RHD.
Potential for the TA work to integrate climate hazards as an element of the work. ‘RHD roads that have survived extreme events are those best constructed’.
Total interventions = 15(2) Red = 2(2), Orange = 1, Yellow = 12

Section 2: Strategic review
Section 2: Strategic Review of DFID Bangladesh and Climate Change This section is authored by Thomas Tanner1 and Ahsan Uddin Ahmed2
1 Institute of Development Studies, University of Sussex 2 Bangladesh Unnayan Parishad (BUP), Dhaka
2.1 SUMMARY
In spite of the fact that the country is highly vulnerable to the impacts climate change, only one sectoral policy, that for the Coastal Zone, has considered climate change. At the same time, a wide variety of measures implemented as part of key policies in Bangladesh have the potential to reduce vulnerability to climate change.
Climate change issues are supported in the Government of Bangladesh by a recently established Climate Change Cell, supported by DFID through the Comprehensive Disaster Management Programme (CDMP). However, given its size and location in the relatively un-influential Department of Environment, its ability to influence work across other sectors and outside government remain limited at present.
The Bangladesh Poverty Reduction Strategy (PRS) raises climate change as a concern and calls broadly for mainstreaming, but fails to integrate its consideration within poverty reduction planning in key climate sensitive sectors. DFID aid strategy in Bangladesh is based on PRS priorities but now also includes overarching priorities of reduced extreme poverty and vulnerability from disasters and climate change.
The PRS does call for implementation of the recently completed National Adaptation Programme of Action (NAPA) as a means of targeting adaptation priorities. The NAPA provides a nationally-defined evaluation of urgent and immediate needs and details priority adaptation projects. To be most effective, these project concepts will need to be integrated within existing activities in key sectors.
Policy commitments for climate risk screening of DFID programmes are based primarily on the need to ensure aid effectiveness given potential impacts of climate change on poor people and on poverty reduction goals. Recent high level championing on climate change and its prioritisation in the 2006 International Development White Paper have put it firmly in the spotlight. Linking climate change adaptation with disaster risk reduction in terms of communities of policy and practice remains a crucial step.
The DFID strategy and portfolio has until now dealt with climate change adaptation and disasters risk reduction through specific interventions. Specific vulnerability to climate change has not been taken account in setting priorities, although climate-related hazards such as flooding are very strongly correlated with poverty levels in Bangladesh. Future interventions may therefore need to consider how their programmes might target particularly vulnerable regions, such as the southwest, or sectors, such as agriculture, fisheries and water resources management. The 2006-9 strategic document, the Country Assistance Plan (CAP), provides the basis for improving the impact of UK development cooperation, but will need to incorporate climate-related indicators to help evaluate who is vulnerable to which hazards, how this vulnerability can be reduced, and ensure that programmes contribute to reduced vulnerability across the board.
Climate change also As a country office, DFID Bangladesh will have to address scenarios of future change that raise complex and often highly political questions. The key to tackling future potential migration, transboundary issues, collapse of food production systems, or mass displacement will be to begin to tackle areas where

Section 2: Strategic review
18
these issues are already stretching coping capacities, such as diversifying livelihoods and improvements to urban services provisions for the poor.
Tackling some of these more complex questions will require an international response and make the development of a joined up approach an urgent priority, both across UK government departments in Bangladesh and in neighbouring countries. It will also entail improving knowledge in the future on impacts of climate-related hazards, particularly through improved disaster assessment exercises and disaggregated across affected groups, regions and sectors.
2.2 BANGLADESH NATIONAL POLICIES AND CLIMATE CHANGE
Bangladesh has been identified as one of the countries with the highest level of vulnerability to climate change. Literature on impacts of climate change for the country suggest that current water-related variations and extremes will be further accentuated by climate change, implying that it is more likely to face high-intensity extreme weather/climatic conditions such as floods, droughts, cyclones, and associated storm surges (Huq et al., 1998; World Bank, 2000). In addition, more creeping impacts are projected due to sea-level rise and rising average temperatures. Sea-level rise will compound both flood impacts, drainage problems, and enhance the intrusion of saline waters and soils in coastal areas. Such secondary impacts of climate change frame this strategic review, and further analysis of these impacts is detailed in sections 3-5 of this report.
Major socio-economic impacts include:
• Severe health related risks due to general warming (particularly in April and August), especially for the children and old people (World Bank, 2000);
• Increased extreme weather events such as severe and prolonged flooding, cyclonic storm surges, tornadoes, and riverbank erosion, leading to related socio-economic disasters and impacts on human settlement (Asaduzzaman et al., 2005; Ahmed, 2006);
• High risks for crop agriculture (floods, droughts, and intrusion of saline water – all of which are threatening currently preferred crops). Fisheries and livestock sector development also potentially negatively affected (Agrawala et al., 2003).
• National food security will be at risk (Karim et al., 1998; Habibullah et al., 1998; Ahmed, 2000);
• Loss of livelihoods and knock-on mass-scale out-migration, particularly from rural areas (Ahmad and Ahmed, 2000);
• Increased hardship on the poor and women (including people with special needs) (Choudhury et al., 2003) complicating achievement of MDG targets;
• The Sundarbans ecosystem will be at risk due to increased salinity, which in turn will affect forest biodiversity and population depending on its resources (Ahmed et al., 1998b; CEGIS, 2006);
• National infrastructure will also be adversely affected due to extreme events (DOE, 2005);
• National development will face increased hardships due to frequent diversion of development budget to facilitate post-disaster rehabilitations (Ahmed, 2005).
The impacts of future climate-related hazards are overlaid on an existing vulnerability to climate-related hazards due to prevailing climatic conditions and geographical location, high population densities, high incidence of poverty, and a rural economy based on natural resources. Crucially therefore, the burden of current geo-physical and socio-economic risks is likely to enhance climate change impacts, leading to more dramatic adverse effects. Equally, wider changes in these prevailing conditions,

Section 2: Strategic review
19
particularly through development and poverty reduction, have the capacity to reduce the negative impacts of future hazards.
Since its independence the development policy framework in Bangladesh has revolved around Five Year Planning Documents (MOP, 1997). Since the early 1990s, sector-specific policies have been dominant, with poverty reduction goals framed by a Poverty Reduction Strategy (PRS). A full PRS, the National Strategy for Accelerated Poverty Reduction (PC, 2005), is now in place, integrating this sectoral development approach under a three-year evolving planning mechanism.
The PRS does acknowledge the future threat of climate change impacts to the development processes and the imperative of reducing current disaster risks. It signals the need for integration/mainstreaming of adaptation measures into other policy areas, and the implementation of priority adaptation projects identified in the National Adaptation Programme of Action (NAPA – see later in this section).
Despite this however, the PRS does not indicate which the means for integrating adaptation into other sectors, nor which are the key sectors to target. Importantly, climate change concerns are included only within environment sections of the PRSP, rather than appearing in those relevant to the relevant sectors themselves such as agriculture or health. This compartmentalising presents climate change as an environmental add-on rather than an acknowledgement of the central role of managing the risks of climate-related hazards in the success or failure of poverty reduction efforts, both now and in the future.
Since the 1990s, the Government of Bangladesh has developed a number of Policy Guidelines addressing the management needs of various economic and natural resources sectors. However, no policy has so far been adopted to provide development guidelines to combat climate change. Other than the recent Coastal Zone policy, no sectoral policy has considered climate change impacts and adapting to those impacts. Indeed, national policy documents have largely ignored climate change as an issue. An exception is the 2001 National Water Management Plan which identifies climate change issues as a knowledge gap. A currently ongoing process to update this plan will give greater attention to climate change and its possible impacts on development.
The general failure in integrating climate change issues in development thinking has previously been analysed through the identification of a ‘missed opportunities’ for poverty reduction (Ahmed, 2004a, Ahmed, 2004b, Ahmed, 2005a). Perhaps equally important is the low priority afforded to reducing the risks associated with the existing burden of disaster events. Improvement of ability to manage risks from existing hazards is a crucial first step to building resilience for future change, and the absence of disaster risk management from key sectoral policies indicates a deficit in terms of current as well as future climate risks.
Even without specific policy guidelines on climate change therefore, a number of key sectoral development policies provide ample scope to reduce vulnerability and promote adaptation to climate change. These relate not only to specific measures, but also to increasing broader societal resilience at different scales. In previous analysis, the National Water Policy (NWP) (MOWR, 1999), the National Agriculture Policy (NAP) (MOA, 1999) and the Coastal Zone Policy (CZP) (MOWR, 2005a) have been judged the most important policy documents in Bangladesh with the potential for promoting adaptation (Ahmed, 2005a). To these sector policies should be added the PRS, discussed above, as well as some key development programmes as reflections of sector-specific policies, including: (a) the National Water Management Plan (NWMP) (MOWR, 2005b); (b) the Coastal Development Strategy (CDS) (MOWR,

Section 2: Strategic review
20
2005c); (c) the Corporate Plan of the Ministry of Food and Disaster Management (CP-MOFDM) (MOFDM, 2005).
From this range of policy documents, it is possible to disaggregate elements which would improve the ability to reduce vulnerability to variations in climate, both during the year (climate variability) and year on year (climate change). Table 2.1 highlights a few of these policy elements.
Table-2.1: Selected example policy elements with potential contribution to adaptation
Policy elements NWP/
NWMP CZP/ CDS
NAP CP- MoFDM
PRS
Improvement in early warning system for floods, flash floods and cyclonic hazards.
X X X
Increasing freshwater flow (to tackle the salinity issue) for the South-western parts of Bangladesh.
X
Addressing drainage congestion to reduce flood susceptibility.
X X X
Promotion of combined use of water (reducing pressure on groundwater tables).
X
Crop diversification to reduce extreme dependence on rice based productive system.
X X
Enhance the ‘Cyclone Preparedness Programme’ by improved and new multi-purpose cyclone shelters.
X X
Building a community-based greenbelt along the coastal belt to reduce damage to cyclonic hazards.
X X
Development of crop seeds with increasing resistance to droughts and salinity.
X
Regional cooperation to agree water sharing with co-riparian countries.
X
Enhanced risk reduction and preparedness for disasters, rather than relief based approaches.
X X
Promotion of community-based approaches to deal with local-level climatic hazards.
X X
Extending ‘safety nets’ in order to serve disaster affected people.
X X
Improved water and agricultural resource management to safeguard livelihoods.
X X X X
2.3 RECENT ADAPTATION POLICY DEVELOPMENTS IN BANGLADESH
Despite significant efforts to date by sustainable development NGOs and aid donors nationally and internationally to raise awareness on the threats posed by climate change, to date it has gained very limited attention among the policy-making communities in Bangladesh (Ahmed, 2004; Huq et al., 2003). Their limited integration into policy can be explained by a variety of factors, but key among them is simply their relative infancy and a lack of basic awareness over the processes and impacts of global warming (Huq et al., 2003; Mitchell and Tanner, 2006). In a developing country such as Bangladesh, where the immediate policy thrust is necessarily to fight widespread poverty and malnutrition, and ensure peace and security, planning for a longer-term adaptation to climate change may also appear somewhat irrelevant to policy-makers.
In tackling the presentation of climate change impacts as long term issues, adaptation has therefore been framed in a disasters and risk management context. In this approach, adaptation aims to enhance people’s ability to cope with today’s

Section 2: Strategic review
21
climate-related hazards and simultaneously build resilience to future impacts (Burton and van Aalst, 2004; Adger et al, 2005). In addition, it has been argued that such adaptations can bring additional development benefits to the society by preparing citizens for uncertain futures more generally and increasing social cohesion (Munasinghe and Swart, 2000). More recently, an economic efficiency case has been made for risk reduction and adaptation measures. Timely incremental investments for planned adaptation are thereby evaluated as economically worthwhile and with favourable returns due to their potential to reduce much greater losses from climate-related impacts in the future (Stern, 2006).
It is evident from past analyses of responses to water-related extreme events that preparedness at an individual level has limited potential to reduce climate related vulnerability, since it tends to support survival coping only (Ahmed, 2005b). Local level initiatives therefore need to be strengthened to facilitate adaptation for large-scale population. Collective activities have already been identified which a flood- vulnerable community can undertake in each stage of a flood event to reduce impacts: before incidence, during the flood, and following the event (Ahmed and Karim, 2004). The local government at its lowest tier can effectively facilitate these community based flood management activities.
Increasingly, local level micro-planning and initiatives are being given greater attention in facilitating adaptation to flooding and other hazards expected to be enhanced by climate change. Instead of focusing on after-the-event relief, resilience-building activities are stressed, be it through the official channels, or by involving community based organizations. Offering soft-term credits for the poor to enhance resilience of housing for example, particularly for flood-proofing, can greatly help adapt to increased risks from flooding associated with climate change (Ahmed, 2004a). Such concepts have recently incorporated into the corporate focus of the Ministry of Food and Disaster Management (MOFDM, 2005). Again, the PRSP has attached high priority to use such modalities for the benefit of the poor (PC, 2005).
In 2004, the Government established a ‘climate change cell (CCC)’ to build capacity and to mainstream climate change issues to promote climate-resilient development in Bangladesh. This was undertaken as part of a shift in disaster management practices towards preparedness and risk reduction rather than relief efforts, established under the Comprehensive Disaster Management Programme (CDMP). It is housed within the Department of Environment (DOE) – the technical arm of the National Focal Point on climate change issues, namely the Ministry of Environment and Forest (MOEF), which facilitates their mission to mainstream its agenda. Since inception, the CCC has established links among sectoral agencies as well as integrated NGO efforts to develop a common knowledge base on CC related issues. The CCC has now taken a coordination role to establish ‘focal points’ in each development sector (including ministries and their respective technical/planning and implementing agencies). The focus is on promoting ‘climate resilient’ development, consistent with recommendations of the scientific community and the NAPA (Ahmed, 2004a; GOB-UNDP, 2005).
Under a recently completed community-based adaptation project “Reducing Vulnerability to Climate Change (RVCC)”, a methodology of analysis / assessment, ‘climate risk assessment (CRA)’, was developed and tested (Schaerer and Ahmed, 2004). It involves a modified analytical framework to assess poverty, identify climate-related hot spots and involve local people at risk of climate related vulnerability. Based on this experience, the CCC is now developing related guidelines for the emerging Community Risk Assessment process developed under the CDMP (CDMP, 2006). The aim is to develop a uniform methodology for all vulnerable areas and to complete resulting bottom-up Climate Change Risk Reduction Plans (CCRRP).
Section 2: Strategic review
22
This will enable development efforts at the lowest tier of the Government to be integrated with efforts to tackle climate change.
With funding through the UN Climate Change Convention (UNFCCC), the Government has developed a National Adaptation Programme of Action (NAPA) document. Working groups and sectoral reports were created covering a wide range of vulnerability profile and adaptation options in areas of:
• Water, Coastal Areas, Natural Disaster and Health
• Agriculture, Fisheries and Livestock
• Biodiversity, Forestry and Land use
• Industry and Infrastructure
• Food Security, Livelihood, Gender and Local Governance
• Policies and Institutes
Reports from each of these areas were then compiled into the NAPA report, which details urgent and immediate adaptation needs, including a list of 15 prioritized projects which would enhance national level adaptation capability (GOB-UNDP, 2005). These projects can be divided broadly into measures for direct intervention and those designed to facilitate adaptation through enhancements to the enabling environment. These concepts have received endorsement of the Government of Bangladesh and are primarily based on existing coping mechanisms and practices, as well as ‘needs based suggestions’ forwarded from public consultations and from national experts in relevant fields and sectors (Ahmed, 2006).
The prioritised measures are summarised below and are still awaiting implementation. The highest priority project, on coastal afforestation, has been approved for funding through UNFCCC via the Global Environment Facility (GEF). Others, such as mainstreaming adaptation to climate change into sectoral policies and programmes are being targeted through existing initiatives such as the DFID-funded Climate Change Cell of the Comprehensive Disaster Management Programme.
Intervention Measures • Reduction of climate change impacts through community-based coastal
afforestation. • Promoting adaptation to increased salinity through maize production under Wet
Bed No-tillage Method and Sorjan systems of cropping in tidally flooded coastal agro-ecosystems.
• Adaptation to agriculture systems in flash flood areas of the Northeast and Central Regions through no-tillage potato cultivation under water hyacinth mulch in wet sown condition, and vegetable cultivation on floating beds.
• Promoting adaptation to coastal fisheries through culture of salt tolerant fish. • Adaptive and diversified fish culture practices in areas prone to enhanced
flooding in Northeast and Central Regions. • Construction of flood shelter, and information and assistance centre to cope with
enhanced recurrent floods in major floodplains. • Providing drinking water to coastal communities to combat enhanced salinity due
to sea level rise and drought. • Enhancing resilience of urban infrastructure and industries to impacts of climate
change including floods and cyclone.
Facilitating Measures
Section 2: Strategic review
23
• Capacity building for integrating climate change into planning, infrastructure design, conflict management and land-water zoning for water management institutions.
• Exploring options for insurance and other emergency preparedness measures to cope with enhanced climatic disasters (e. g. flood, cyclones and drought).
• Mainstreaming adaptation to climate change into sectoral policies and programmes (disaster management, water, agriculture, health and industry).
• Inclusion of climate change issues in curriculum at secondary and tertiary educational institutions.
• Climate change and adaptation information dissemination to vulnerable communities to raise awareness of risks and risk management practices.
• Promotion of research on drought, flood and saline tolerant varieties of crops to facilitate adaptation in the future.
• Development of eco-specific adaptive knowledge (including indigenous knowledge) on adaptation to climate variability to enhance adaptive capacity for future climate change.
This analysis of national policies in the main climate sensitive sectors quickly demonstrates that climate change issues are neither assessed nor tackled in a strategic or routine manner. A variety of factors might explain this, including the relatively recent emergence of climate change issues, low levels of scientific capacity and awareness about climate change processes and impacts in Bangladesh, an international focus on greenhouse gas emissions reduction rather than adaptation to the impacts of climate change, its treatment as a predominantly environmental issue, and the long timescales used in the analysis of impacts. have referred to this as an adaptation deficit.
While these factors may help to explain the ‘adaptation deficit’ (May and Burton, 2004) for impacts related to future climate change, the analysis also shows that policies commonly fail to account for current climate-related shocks and stresses. This double deficit is perhaps surprising in a country that has experienced regular and significant disaster events in past years. Nevertheless, it also demonstrates the importance of the threat of climate change in providing an impetus for improved assessment and management of current weather-related risks as well as those related to future climate change.
2.4 DFID POLICY CONTEXT
DFID’s efforts to pilot a screening approach for climate risks to its bilateral portfolio are based on a growing awareness of the disproportionate impacts of climate change on poor people. Following a study into the potential impacts of climate change on the Millennium Development Goals (ERM, 2002), DFID initiated efforts to inform and raise awareness on climate change issues. A joint position paper of a number of donors, including DFID, highlighted these connections, as well as the urgent need for adaptation to be integrated into the development process (AfDB et al, 2002). The publication of a set of informational key-sheets (DFID, 2004) introduced climate change, placed it in the context of key development sectors and geographical regions, and outlined practical steps to help development policies and practices build in resilience to climate risks.
In these efforts, climate change was acknowledged for its potential to compromise aid effectiveness. Crucially, adaptation practice was also demonstrating that these impacts could be reduced, particularly where the existing climatic variations already regularly outstrip local coping capacities. The need for risk management through screening of development cooperation was given impetus by the EU Strategy on

Section 2: Strategic review
24
Climate Change in the Context of Development Cooperation (EC, 2004). DFID then took up the Commission for Africa Report recommendation that ‘from 2008 donors should make climate variability and climate change risk factors an integral part of their project planning and assessment’ (Commission for Africa Report, 2005;p51).
These foundations combined with a high level championing of climate change issues during the UK’s Presidencies of the EU and G8 in 2005, culminating in the G8 Gleneagles Plan of Action (2005:para35) in which G8 countries invited the World Bank to: ‘develop and implement best practice guidelines for screening their investments in climate-sensitive sectors to determine how their performance could be affected by climate risks as well as how those risks can be best managed in consultation with host governments and local communities’. The Plan also urges other bilateral donors to either adopt the World Bank’s screening guidelines or develop their own. More recently, this political impetus was strengthened by a meeting of OECD Development and Environment Ministers, who pledged that ‘they will work to better integrate climate change adaptation in development planning and assistance, both within their own governments and in activities undertaken with partner countries’ (OECD, 2006).
Within DFID, tackling climate change was given significant prominence within their Third White Paper on International Development (DFID, 2006a). Framing a commitment to help developing countries adapt, it argues for reducing the risks posed by climate change to people’s lives and livelihoods. It commits the UK Government to implementation of the Gleneagles Plan of Action and to developing guidance with the multi-lateral development banks by 2008 to screen all development investments for the effects of climate change. Importantly, it also provides high-level policy direction and guidance around climate change issues across DFID. The White Paper also linked climate change adaptation actions to the complementary policy and practice of disaster risk reduction, which has received greater attention since the internationally agreed World Conference on Disaster Reduction and related Hyogo Framework for Action in 2005. Given even greater salience by the Asian tsunami, this led to a DFID policy paper on disaster risk reduction (DFID, 2006b), which notes that climate change is contributing to increased disaster risk and calls for the incorporation of future as well as current climate risks in risk reduction efforts.
2.5 DFID BANGLADESH – PORTFOLIO AND STRATEGY
Despite these international commitments, high level championing, and supportive policy framework outlined above, the mainstreaming of climate change and disaster risk reduction within most development cooperation programmes to date has been only incremental (Klein et al, 2007). Significant barriers remain to the incorporation of climate risk management within DFID’s work (White et al, 2004; Mitchell and Tanner, 2006a, 2006b). Nevertheless, as a highly vulnerable country already affected by multiple disaster events, Bangladesh is perhaps better positioned than many other country offices, particularly as major flood episodes during the 2004 monsoon and post-monsoon season caused widespread disruption to DFID-B programmes.
The current DFID bilateral aid programme in Bangladesh tackles climate risks chiefly through a specific intervention. The Comprehensive Disaster Management Programme (CDMP) has been in place since 2002 with the aim of assisting the Government of Bangladesh in its efforts to manage climate risks (current and future) across all sectors of government. While the CDMP has initial hurdles around changing disaster practice from relief and recovery towards preparedness and risk reduction, and simply in raising awareness of climate change processes and impacts, even
Section 2: Strategic review
25
when fully functioning it will not necessarily ensure that DFID’s portfolio incorporates climate risk management practices. This screening exercise should therefore be seen as complimentary to the CDMP, and CDMP staff have been involved and provided inputs at all stages in the process.
The DFID Bangladesh portfolio of aid interventions is increasingly focused on large programmatic approaches based on multiple donor partnerships and implemented across the country. In recent years, the strategic approach for DFID development assistance in Bangladesh has followed the priorities identified in the national PRS. Climate change is referred to briefly in the strategic Country Assistance Plan (CAP) document for 2003-6, but principally in order to flag its potential as a risk to the achievement and sustainability of poverty reduction efforts in future.
The 2006-9 Country Assistance Plan continues the trend in mirroring the PRS by targeting accelerated pro-poor economic growth, promoting human development through improved service provision, and improving governance and security. However, it also adds a fourth priority area on reducing extreme poverty, particularly among women and girls, and reducing vulnerability to disasters and climate change. While consistent with the broader aims and stated objectives of the PRS, this is also reflective of a heightened awareness of the potential impacts of climate change on investments aimed at poverty reduction.
Climate change is noted in the CAP as one of five major challenge to development, with increasing numbers of people are at risk of being driven deeper into poverty by resulting increases in the intensity, frequency and impact of natural disasters. The CAP states that support to the CDMP will continue to form an important part of its portfolio, along with potential support to priorities identified in the NAPA document.
The CAP also demonstrates an awareness of the interconnected nature of development blockages and solutions in Bangladesh. In the same way that it highlights how poverty reduction and opportunity itself is presented as the driver of security in the country, successful adaptation will be underpinned by better health and education, greater access to employment, democratic accountability, and improved governance at all levels.
2.6 STRATEGIC CONSIDERATIONS
This analysis highlights a number of key strategic considerations for the DFID development assistance programme in Bangladesh in the context of climate change.
Contributing to improved impacts of DFID interventions:
There is a firm emphasis in the CAP document on improving the impact of UK development cooperation, particularly through improving standards, targets and evaluation. Given the stated importance of climate change and disasters, it will be crucial to incorporate climate-related indicators within these measures. This will enable DFID to:
(a) Evaluate how different sectors or groups are impacted by and vulnerable to climatic shocks and stresses
(b) Assess which strategies are effective in reducing vulnerability to climatic hazards. (c) Ensure that a broader range of DFID-funded interventions contribute to
improved resilience and coping capacity rather than increasing vulnerability. Geographic and sectoral vulnerability:
Although significant pockets of poverty exist in all regions of Bangladesh, certain areas of the country have markedly higher incidence of poverty. The coastal zone,
Section 2: Strategic review
26
central region and northwest region are notable in this regard, while the northeast region is notable in its relatively lower poverty levels. The poverty focus of the CAP means that this currently provides guidance for geographical targeting of DFID programming. However, given the current and future potential of extreme weather events and other impacts likely due to global climate change, the CAP may increasingly need to integrate regional differences in climate change vulnerability into its assessments of how to allocate resources.
A rigorous multi-criteria analysis undertaken under a previous study highlighted that the southwestern parts of the country will be the most vulnerable area (BCAS-RA-Approtech, 1994). The projected increase in monsoon rainfall will increase flood vulnerability of the area, while dry-season low-flow conditions – already marked by low and diminishing rainfall - would enhance possibility for increasing drought vulnerability and salinity ingress along the coastal river systems (Ahmed et al., 1998a). Simultaneously, inundation of low-lying unprotected coastal areas, due to a combined effect of gradual subsidence and a rise in sea level, enhances the potential for saline waterlogging throughout the South-western areas. All these adverse impacts would not only impede agricultural system, also severely affect sustenance of the Sundarbans ecosystem (Ahmed et al., 1998b).
As well as regional targeting, certain sectors are by definition more vulnerable to the impacts of a changing climate. Those reliant on land and water resources are particularly sensitive to climatic impacts, and despite recent increases in manufacturing and services employment, they still constitute the dominant livelihood for significant numbers of poor people in rural areas of Bangladesh. the additional pressures of climate change on poor people’s natural resource-based livelihoods may merit greater attention in donor strategy. Support to private enterprise and diversification into other sectors may be part of the solution but agricultural activities may require increased support to help them adapt to a changing climate. While recognising this vulnerability as a challenge to agriculture, the 2006-9 CAP currently makes no mention of natural resources, and does not include either water, natural resources, or agriculture in its key strategic priorities.
Strategic planning to consider potential limits to adaptation:
The CAP adopts an incremental approach to tackling climate risks in Bangladesh, by incorporating adaptation across its programmes. While this may be able to manage some of the risks associated with climatic hazards, there may also be limits to the ability to adapt a system (human or natural) to new conditions. Climate change therefore raises major concerns about the sustainability of poverty reduction gains of recent years. These include far more frequent disaster events, the more regular or permanent displacement of large numbers of people, catastrophic sea-level rise, or the enhanced salinisation of water and soils. Agriculture may become less and less viable as a mean of supporting the livelihoods of the majority of the population. Stretching coping capacities to the limit, these impacts might lead to enhanced internal and external migration, conflict, transboundary arrangements for water-sharing. Strategic scenario planning and visioning exercises may therefore be necessary to consider the role that DFID might play in dealing with a range of projected longer term impacts and risks.
Matching strategy with current development stresses:
Crucial to an assessment of DFID’s role will be to base these longer term scenarios on current development stresses and existing areas where coping capacity is being regularly breached and where climate change is reinforcing existing pressures. This will enable development of win-win actions that are beneficial independent of the extent of future climate change. This has much in common with the linkages to
Section 2: Strategic review
27
disaster risk reduction and will be crucial in avoiding the contention that climate change is not relevant on standard political timescales.
Concrete examples include facilitating pro-poor economic migration within the country, which is already a major strategy for coping with shocks and stresses. Improved urban services, including smaller centres as well as large cities will support this movement and are already under significant strain, while improved organisation of overseas workers and remittance schemes can also have current as well as future benefits. Similarly, improved judicial transparency and accountability can promote better dispute resolution. Land-use zoning and planning is also already an existing pressure and can incorporate climate change projections (CEGIS, 2006), and water management needs tackle the human as well as climatic causes of droughts and floods, including upstream management in Bangladesh and outside its borders. Livelihoods diversification is also good development practice in itself that reduces vulnerability to a wide range of shocks and stresses.
While such practices may be demonstrated by the range of DFID-funded interventions, these linkages are not made explicit in the strategic CAP.
Adding value through international action:
Given the trans-boundary nature of climate change impacts due to the three main international river basins which pass through Bangladesh, DFID and other international agencies may have a crucial role in facilitating international action. Ensuring that water use and management in upstream countries, including India, Bhutan, Nepal, and China, does not prejudice the livelihoods of downstream citizens of Bangladesh. Equally, there is potential at the international level to work more closely with the Government of Bangladesh over around negotiations of the climate change Convention (UNFCCC), Kyoto Protocol and its successor after 2012 are directed at reducing vulnerability of the extreme poor both through significant cuts in greenhouse gas emissions and through adaptation support that targets poverty.
The CAP already notes that UK departments will be drafting a joint strategy on climate change support to Bangladesh in 2007. This will need to tackle international dimensions of the problem and consider where its activities outside Bangladesh can play a role (for example through DFID support to West Bengal state in India). The need for international diplomacy also suggests a prominent role for the Foreign and Commonwealth Office.
Improving climate impacts assessments, current and future:
Undertaking the climate risk screening exercise has demonstrated the paucity of much data on current, as well as future impacts of climate-hazards. Modelling of future impacts will only be possible with an improved understanding of how climate shocks and stresses affect natural and human systems in Bangladesh at present. Equally, more rigorous disaster assessments are also a pre-requisite for improving the ability to reduce existing disaster risks. This information is urgently required across sectors and regions. Without knowledge of the impacts of hazards of a given size, our ability to project impacts of future climate scenarios is seriously reduced. Similarly, without greater understanding of how to characterise the processes and activities that foster adaptation, we will remain unable to match future hazards with estimates of future resilience.

Section 2: Strategic review
28
2.7 SECTION 2 REFERENCES
AfDB et al, 2003: Poverty and Climate Change—Reducing the Vulnerability of the Poor through Adaptation. AfDB, ADB, DFID, EC DG Development, BMZ, DGIS, OECD, UNDP, UNEP and the World Bank, Washington, DC, USA, xii+43 pp.
Agrawala, S., T. Ota, Ahmed, A.U., Smith, J. and van Aalast, M., 2003. Development and Climate Change in Bangladesh: Focus on Coastal Flooding and the Sundarbans. Organisation for Economic Co-operation and Development (OECD), Paris, pp. 70.
Ahmad, Q.K. and Ahmed, A.U., 2000. Social Sustainability, Indicators and Climate Change, in M. Munasinghe and R. Swart (eds.), Climate Change and Its Linkages with Development, Equity and Sustainability, Jointly published by LIFE, RIVM and World Bank for IPCC, Geneva, pp. 95-108.
Ahmad, Q.K. and Ahmed, A.U., 2002. Bangladesh: Citizens Perspectives on Sustainable Development, Bangladesh Unnayan Parishad (BUP), Dhaka.
Ahmed, A.U. and Karim, Z., 2004. Manual for Community Based Flood Management, Bangladesh Unnayan Parishad (BUP), Dhaka.
Ahmed, A.U. and Schaerer, C., 2004. Sustaining Livelihoods Opportunities for the Coastal Poor Under Climate Change: A Case Study from Bangladesh, Proceedings of Coastal Zone Asia Pacific, Brisbane, 7-9 September 2004.
Ahmed, A.U., 2000. Adaptability of Bangladesh's Crop Agriculture to Climate Change: Possibilities and Limitations, Asia Pacific Journal on Environment and Development, Volume 7, No. 1, pp. 71-93.
Ahmed, A.U., 2004a. A Review of the Current Policy Regime in Bangladesh in Relation to Climate Change Adaptation, Reducing Vulnerability to Climate Change Project, CARE Bangladesh, Khulna, 58 p.
Ahmed, A.U., 2005a. ‘Toward Integrating Adaptation to Climate Change in Current Policy Regime: Perspectives on Bangladesh’s Water Resources and Associated Sectors’, Asia Pacific Journal on Environment and Development, 12(1): 35-54.
Ahmed, A.U., 2005b. ‘Adaptation Options for Managing Water Related Extreme Events Under Climate Change Regime: Bangladesh perspectives’, in M.M.Q. Mirza and Q.K. Ahmad (eds.), Climate Change and Water Resources in South Asia, Balkema Press, Leiden, pp. 255-278.
Ahmed, A.U., 2006. Bangladesh: Climate Change Impacts and Vulnerability – A Synthesis, Climate Change Cell, Department of Environment, Ministry of Environment and Forests, Government of the People’s Republic of Bangladesh, Dhaka.
Ahmed, A.U., M. Alam and Rahman, A.A., 1998a. Adaptation to Climate Change in Bangladesh: Future Outlook, in S. Huq, Z. Karim, M. Asaduzaman, and F. Mahtab (eds.), Vulnerability and Adaptation to Climate Change for Bangladesh, Kluwer Academic Publishers, Dordrecht, 125-143.
Ahmed, A.U., Siddiqi, N.A. and Choudhury, R.A., 1998b. ‘Vulnerability of Forest Ecosystems of Bangladesh to Climate Change’, in S. Huq, Z. Karim, M. Asaduzzaman, and F.U. mahtab (Eds.), Vulnerability And Adaptation to Climate Change for Bangladesh, Kluwer Academic Publishers, Dordrecht, pp. 93-111.
Alam, M., Nishat, A., and Siddiqui, S,M, 1998. Water Resources Vulnerability to Climate Change With Special Reference to Inundation, in S. Huq, Z. Karim, M. Asaduzzaman, and F. Mahtab (eds.), Vulnerability and Adaptation to Climate Change for Bangladesh. Kluwer Academic Publishers, Dordrecht, 21-38.
Section 2: Strategic review
29
Ali, A., 1999. Climate Change Impacts and Adaptation Impacts in Bangladesh, Climate Research, 12: 109-116.
Asaduzzaman, M., Ahmed, A.U., Haq, E. and Chowdhury, S.M.Z.I., 2005. Climate Change and Bangladesh: Livelihood Issues for Adaptation, Bangladesh Institute for Development Studies (BIDS), Dhaka.
Commission for Africa, 2005. Our Common Interest. Penguin Books, London.
CDMP, 2006. Community Risk Assessment Guidelines (in Bangla), Comprehensive Disaster Management Programme (CDMP), Ministry of Food and Disaster Management (MOFDR), Government of the People’s Republic of Bangladesh, Dhaka.
CEGIS, 2006. Impacts of Sea Level Rise on Landuse Suitability and Adaptation Options, Final report, submitted to the Ministry of Environment and Forest, Centre for Environmental Geographic Information services (CEGIS), Dhaka.
Choudhury, A.M., Quadir, D.A., Neelormi, S. and Ahmed, A.U., 2003. Climate Change and Its Impacts on Water Resources of Bangladesh, in A. Muhammed (ed.), Climate Change and Water resources in South Asia, Asianics Agrodev International, Islamabad, pp. 21-60.
DFID, 2004. Poverty and Climate Change: Key Sheets 1-13. DFID. Policy Division, DFID. Available at www.dfid.gov.uk.
DFID, 2006a. Eliminating World Poverty: making governance work for the poor. White Paper on International Development. Department for International Development, London.
DFID, 2006b. Reducing the Risk of Disasters – Helping to achieve sustainable poverty reduction in a vulnerable world: A DFID Policy Paper. Department for International Development, London.
EC, 2004. EU Strategy on Climate Change in the Context of Development Cooperation: Action Plan 2004-208. DGE, European Commission, Brussels.
ERM, 2002. Predicted impact of global climate change on poverty and the sustainable achievement of the Millennium Development Goals. DFID / Environmental Resources Management Ltd, London.
GOB-UNDP, 2005. National Adaptation Program for Action (NAPA), Final report: November 2005, Ministry of Environment and Forest, Government of the People’s Republic of Bangladesh (GOB) and United Nations Development Programme (UNDP), Dhaka, Bangladesh.
Habibullah, M., Ahmed, A.U. and Karim, Z., 1998, “Assessment of Foodgrain Production Loss Due to Climate Induced Enhanced Soil Salinity”, in S. Huq, Z. Karim, M. Asaduzzaman and F. Mahtab (Eds.), Vulnerability and Adaptation to Climate Change for Bangladesh, Kluwer Academic Publishers. pp 55-70.
Huq, S., Z. Karim, M. Asaduzaman, and F. Mahtab (eds.), 1998. Vulnerability and Adaptation to Climate Change for Bangladesh, Kluwer Academic Publishers, Dordrecht, 135 pp.
Huq et al, 2003. Mainstreaming Adaptation to Climate Change in the Least Developing Countries. IIED, London.
Karim, Z., Hussain, S.G. and Ahmed, A.U., 1998. “Climate Change Vulnerability of Crop Agriculture”, in S. Huq, Z. Karim, M. Asaduzaman, and F. Mahtab (ds.), Vulnerability and Adaptation to Climate Change for Bangladesh, Kluwer Academic Publishers, Dordrecht, 39-54.

Section 2: Strategic review
30
Mirza, M.M.Q., 2002. Global Warming and Changes in the Probability of Occurrence of Floods in Bangladesh and Implications, Global Environmental Change, Vol. 12: 127-138.
Mirza, M.M.Q. and Dixit, A., 1997. Climate Change and Water Resources in the GBM Basins. Water Nepal 5(1), 71-100.
Mitchell T and Tanner TM, 2006a. Adapting to Climate Change: challenges and opportunities for the development community. Tearfund, Teddington, UK.
MOA, 1999. National Agriculture Policy, Ministry of Agriculture (MOA), Government of the People’s Republic of Bangladesh, Dhaka.
MOFDM, 2005. Corporate Plan, Ministry of Disaster Management and Relief (MDMR), Government of the People’s Republic of Bangladesh, Dhaka.
MOP, 1997. Fifth Five Year Plan 1997-2002, Ministry of Planning (MOP), Government of the People’s Republic of Bangladesh, Dhaka.
MOWR, 1999. National Water Policy, Ministry of Water Resources (MOWR), Government of the People’s Republic of Bangladesh, Dhaka.
MOWR, 2005a. Coastal Zone Policy, Water Resources Planning Organization, Ministry of Water Resources (MOWR), Government of the People’s Republic of Bangladesh, Dhaka.
MOWR, 2005b. National Water Management Plan, Water Resources Planning Organization in association with Sir William Halcrow et al, Ministry of Water Resources (MOWR), Government of the People’s Republic of Bangladesh, Dhaka.
MOWR, 2005c. Coastal Development Strategy, Water Resources Planning Organization, Ministry of Water Resources (MOWR), Government of the People’s Republic of Bangladesh, Dhaka.
OECD (2006) Declaration on Integrating Climate Change Adaptation into Development Co-operation Adopted by Development and Environment Ministers of OECD Member Countries. 4 April 2006, OECD, Paris.
PC, 2005. Unlocking the Potential: A National Strategy for Accelerated Poverty Reduction, General Economic Division, Planning Commission (PC), Government of the People’s Republic of Bangladesh, Dhaka.
Schaerer, C. and Ahmed, A.U., 2004. Adaptation to Climate Change in Vulnerable Communities: Lessons from Practice in Southwestern Bangladesh, in A.U. Ahmed and Haque, N. (eds.), Adaptation to Climate Change: Knowledge Sharing for Capacity Building, Proceedings of Workshop at COP9, Milan, Climate Action Network South Asia (CANSA) and RVCC, Dhaka.
World Bank, 2000, “Bangladesh: Climate Change and Sustainable Development. Report No. 21104-BD”, Rural Development Unit, South Asia Region, The World Bank (WB), Dhaka, pp. 95.
Section 3: Review of existing climate scenarios
Section 3: Review of Existing Climate Scenarios for Bangladesh This section is authored by Ahsan Uddin Ahmed 1, and Declan Conway2,3 1Executive Director, Bangladesh Unnayan Parishad 2School of Development Studies-Overseas Development Group 3Tyndall Centre for Climate Research University of East Anglia
3.1 SUMMARY
This report presents a summary of previous climate scenarios published for Bangladesh primarily based on two studies: OECD (Agrawal et al., 2005); and regional climate model results from the IPCC Data Distribution Centre (adapted from Ruosteenoja et al., 2003). The report also contains reviews of previous work on future sea level rise and cyclone activity in the Bay of Bengal and Bangladesh.
Scenarios from the OECD are based on an ensemble of 11 climate models and show:
• Annual average temperature increase in Bangladesh with B2 emissions scenario: 1.0ºC 2030; 1.4ºC 2050; and 2.4ºC 2100.
• Summer (monsoon) average rainfall change in Bangladesh shows wetter conditions: +5% (range roughly 1-9%) 2030; +8% (3-11%) 2050; and 12% (4-20%) 2100. Reasonable agreement between GCMs for changes in monsoon rainfall.
• Winter (dry season) average rainfall change in Bangladesh shows slight drying: -1% (range roughly -13 to +11%) 2030; -2% (-20 to +17%) 2050; and -3% (-35 to +29%) 2100. Poor agreement between GCMs for changes in monsoon rainfall.
Key results of scenarios from the IPCC Data Distribution Centre:
• Seven climate model experiments are used with SRES emissions scenarios (A1FI, A2, B1 and B2). Data are averaged over the entire South Asian region.
• Temperatures rise in all seasons with all GCMs and emission scenarios and warming is slightly greater in winter and spring than summer and autumn.
• Rainfall increases in all cases during summer, ranging from; 5-7% in the 2020s, 10-13% in the 2050s and, 15-26% in the 2080s.
Overall for Bangladesh, to date, climate models have generally been consistent in simulating warming throughout the country in all seasons, moderate increases in monsoon rainfall and moderate decreases in dry season rainfall.
Finally we review previous research on future sea level rise and cyclone activity in relation to the Bay of Bengal and Bangladesh. Because of numerous uncertainties in the science and modelling of these phenomena we base our scenarios on published assessments by the IPCC (IPCC, 2001).
The material in this report informs Input Reports 1bii (Climate change Scenarios) and 1biii (Secondary Impacts of Climate Change).

Section 2: Strategic review
32
3.2 CLIMATE CHANGE SCENARIOS FOR BANGLADESH PREVIOUS WORK Since the early 1990s various studies have presented scenarios based on climate model results for the wider region or Bangladesh itself. Here we present results from two recent studies that combine outputs from different climate models. This is an important consideration in order to determine whether there is good agreement between models about the future climate. We also present results from a recent high resolution climate model (called PRECIS) simulation for the region. OECD Ensemble of GCMs for Bangladesh - Agrawala et al. (2003) used an ensemble of 11 GCMs from a total of 17 for an OECD study. Analyses of their results revealed that only 11 models could reasonably simulate current climate in Bangladesh. The models were run with the IPCC B2 SRES scenario3 (IPCC, 2001). Table-2 provides the results of validated ensemble model runs applicable for Bangladesh.
Temperature change (°C) mean (standard deviation)
Rainfall change (%) mean (standard deviation)
Year
Annual DJF JJA Annual DJF JJA Baseline average 2030
1.0 (0.11) 1.1 (0.18) 0.8 (0.16) 3.8 (2.30) -1.2 (12.56) +4.7 (3.17)
2050 1.4 (0.16) 1.6 (0.26) 1.1 (0.23) +5.6 (3.33) -1.7 (18.15) +6.8 (4.58)
2100 2.4 (0.28) 2.7 (0.46) 1.9 (0.40) +9.7 (5.8) -3.0 (31.6) +11.8 (7.97)
Note: DJF represents the months of December, January and February, usually the winter months. JJA represents the months of June, July and August, the monsoon months.
Table 1: GCM projections for changes in temperature and precipitation for Bangladesh. Source: Agrawala et al., 2003. The results were compared with previous results as provided by Ahmed and Alam (1998). The core findings appear to be consistent with the analysis presented above. Both studies found that winter warming would be greater than summer warming and estimated little change in winter precipitation and an increase in precipitation during the monsoon. Note that the National Adaptation Programme for Action (NAPA) for Bangladesh (GOB, 2005) adopted the results obtained by Agrawala et al. (2003) for changes in temperature, but slightly modified them for precipitation.
3 The IPCC SRES (Special Report on Emission Scenarios) B2 scenario assumes a world of moderate population growth and intermediate level of economic development and technological change (IPCC, 2001). SCENGEN estimates a global mean temperature increase of 0.8 °C by 2030, 1.2 °C by 2050, and 2 °C by 2100 for the B2 scenario.

Section 2: Strategic review
33
A high-resolution climate change scenario for India/Bangladesh - A Regional Climate Model called PRECIS (i.e., Providing Regional Climates for Impacts Studies) has recently been applied for India and partly covers Bangladesh. PRECIS aims to provide datasets at finer scales with more realistic spatial patterns of summer monsoon rainfall over the Indian domain. PRECIS simulations under scenarios of increasing GHG concentrations and sulphate aerosols indicated marked increase in both
rainfall and temperature towards the end of 21st century (Kumar et al., 2006). The warming was fairly homogeneous over India, including Bangladesh, but there were substantial spatial differences in the rainfall changes. Figure-1 shows a summary of simulation results applicable for the whole of India. The detailed results for Bangladesh suggest a warmer summer and wetter monsoon.
Climate Scenarios from the IPCC Data Distribution Centre (IPCC DDC) - Here we present results from the IPCC DDC for the region used by IPCC to represent South Asia (including Bangladesh and large parts of the Ganges-Brahmaputra-Megna basins). Seven climate model experiments are used with SRES emissions scenarios (A1FI, A2, B1 and B2)4. Temperatures rise in all seasons with all GCMs and emission scenarios and warming is slightly greater in winter and spring than summer and autumn. There is more divergence in results for rainfall between GCMs; some suggest wetting and some drying, although there is a general bias towards wetter conditions. For the main wet season, JJA, rainfall increases in all GCMs and emission scenarios. A stronger and more consistent rainfall signal emerges further into the future and by the 2080s summer and autumn are wetter in all cases, spring in most cases although in winter the signal is less clear. Rainfall increases range from 5-7 per cent in the 2020s, 10-13 per cent in the 2050s and 15-26 per cent in the 2080s. Temperature Rainfall
A2 B2 A1FI B1 A2 B2 A1FI B1
DJF 2010-39 1.1 1.2 1.2 1.1 -2.2 2.3 -3.1 4.1
DJF 2040-69 2.4 2.1 3.2 2.0 -0.5 -3.0 0.4 0.5
4 The full results are reported in Ruosteenoja et al. (2003) and available on the www at; http://ipcc-ddc.cru.uea.ac.uk/sres/scatter_plots/scatterplots_home.html.
Figure 1: PRECIS-simulated mean annual cycles of all-India mean precipitation and surface air temperature. Comparisons between baseline (1961-1990) and future scenarios (2071-2100).

Section 2: Strategic review
34
JJA 2010-39 0.5 0.6 0.6 0.6 5.8 7.1 5.2 6.6
JJA 2040-69 1.3 1.1 1.7 0.9 10.7 10.3 13.1 11.5
Table 1. Mean changes in temperature and rainfall by season and emission scenario for IPCC region South Asia (based on Ruosteenoja et al., 2003). 3.3 FUTURE SEA LEVEL RISE PREVIOUS ESTIMATES AND UNCERTAINTIES For sea level rise, the scenarios have so far been largely speculative, not based on any detailed modelling. The BUP-CEARS-CRU study (1994) did not draw detailed estimates in relation to change in sea level, however it commented that both sedimentation and subsidence were likely to complicate net changes in sea level along the Bangladesh coast. Speculative scenarios of 30 and 100 cm sea level rise as lower and upper bound limits have been considered in a number of studies (BCAS-RA-Approtech, 1994; Ali, 1999). In the absence of any Bangladesh-specific sea level rise scenario, the IPCC scenarios for sea level rise have generally been used as a basis for developing net sea level change along the coastal zone of Bangladesh, as cited in Halcrow et al. (2001). MOEF (2002) considered a linear rise in sea level by 1mm/year, which resulted in 30 and 50cm rise in sea level by the year 2030 and 2050, respectively. The latter scenarios were forwarded by the Government of Bangladesh in its First (Initial) National Communication. The OECD study (Agrawala et al., 2003) did not specify any sea level rise scenario for its analysis. However, it reiterated the fact that both subsidence and sedimentation would complicate the outcome. Moreover, it stressed considering mean sea level rise in conjunction with cyclonic activities and subsequent tidal surges. The NAPA document provided a sea-level rise scenario for Bangladesh, but without explanation. Apparently, the upper values of the IPCC SLR Scenario (IPCC, 2001) was adopted for developing the scenarios for 2050 and 2100, while the curve was extrapolated for developing the 2030 scenario. The low-lying topography of the coastal land forms in Bangladesh suggests that a change in sea-level can have catastrophic impacts and increase vulnerability significantly. The GBM delta is morphologically highly dynamic and the coastal lands are simultaneously subject to accretion and tectonic subsidence (Huq et al., 1996; Allison et al., 2003). Compaction of sediment may also play a role in defining net change in sea level along the coastal zone due to the fact that the landform is constituted by sediment decomposition. Lacking more specific information, if one assumes that sediment loading cancels out the effects of compaction and subsidence, then the net sea-level rise can be assumed to be close to the global average as projected by the IPCC. The existing literature provides a wide range of estimates of the rate of subsidence. It is, therefore, difficult to estimate the overall extent of relative sea level rise along the coast of Bangladesh. From the existing literature it is not possible to project the future rate of subsidence in the Bengal delta. Values suggested so far range between less than a millimetre and over 20 mm/year. Considering the estimates for annual rate of subsidence of about 2 mm along the Ganges deltaic plain with a compensation factor of about 1mm/year due to sedimentation, the net change in elevation due to a combination of sedimentation and subsidence would be about 1 mm/year.
Section 2: Strategic review
35
3.4 FUTURE CYCLONE ACTIVITY IN THE BAY OF BENGAL PREVIOUS ESTIMATES AND UNCERTAINTIES In the literature, very little is found on future plausible changes in cyclone intensity along the coastal zones of Bangladesh. A BCAS-RA-Approtech (1994) study considered a net increase of 10% in the intensity of cyclones, which was based on expert judgment. Ali (1999) commented that an increase in 2°C in sea surface temperature (SST) would likely cause an increase in the probability of cyclone formation from depressions. The IPCC noted that currently available models could not do a good job towards resolving the influence of climate change on cyclones (IPCC, 2001). However, based on emerging insights from a few climate model experiments as well as the empirical records, they concluded that “... there is some evidence that regional frequencies of tropical cyclones may change but none that their locations will change. There is also evidence that the peak intensity may increase by 5% and 10% and precipitation rates may increase by 20% to 30%” (IPCC, 2001). For the Bay of Bengal, there hasn’t been any significant effort to analyze the impacts of climate change (i.e., warming) on cyclonic storm and surges. However, Knutson and Tuleya (2004) studied simulated hurricane intensity and precipitation for three sub-regions: the NW Pacific Basin, the Atlantic Basin and the NE Pacific Basin. The study considered CO2-induced SST changes based on GCMs and change in temperature ranging from +0.8oC to +2.4oC in the three tropical storm basins. The aggregate results, averaged across all experiments, indicated a 14% increase in central fall, a 6% increase in maximum surface wind speed, and an 18% increase in average precipitation rate within 100km of storm centres. It reported, on average, a 21% higher Convective Available Potential Energy in the high CO2 environments, which would result in high intensity cyclones. The study concluded that greenhouse gas induced warming might lead to gradually increasing risk in the occurrence of highly destructive category-5 storms (Knutson and Tuleya, 2004). Based on such research-led information, Witze (2006) warned that in cyclone-prone areas, increasing occurrence of bad weather would devastate lives and livelihoods.
3.5 SECTION 3 REFERENCES
Cubasch,U. and Meehl,G.A. (eds.) (2001) Projections of future climate change pp. 525-582 in, Climate change 2001: the scientific basis (eds.) Houghton,J.T., Ding,Y., Griggs,D.J., Noguer,M., van der Linden,P.J., Dai,X., Maskell,K. and Jonhnson,C.A. (eds.) (2001) Contribution of WG1 to the IPCC Third Assessment, Cambridge University Press, Cambridge, UK, 944pp.
IPCC (2001) Climate change 2001: the scientific basis. . Contribution of Working Group I to The Third Assessment Report of the IPCC. Cambridge University Press, Cambridge.
Mitchell, T. D., Hulme, M., and New, M., 2002: Climate data for political areas. Area 34:109-112. [http://www.cru.uea.ac.uk/~timm/climate/scatter/TYN_CY_2_0.html]
Nakicenovic, N. et al. (2000). Special Report on Emissions Scenarios: A Special Report of Working Group III of the Intergovernmental Panel on Climate Change, Cambridge University Press, Cambridge, U.K., 599 pp. [http://ipcc-ddc.cru.uea.ac.uk/sres/scatter_plots/scatterplots_home.html]

Section 2: Strategic review
36
Ruosteenoja, K., T.R. Carter, K. Jylhä and H. Tuomenvirta, 2003: Future climate in world regions: an intercomparison of model-based projections for the new IPCC emissions scenarios. The Finnish Environment 644, Finnish Environment Institute, 83pp.

Section 4: New climate scenarios for Bangladesh
Section 4: Development of New Climate Scenarios This section is authored by Declan Conway1,2 with additional text and data preparation by Suraje Dessai2,3 and Patricia O’Mahony3, University of East Anglia; 1 School of Development Studies-Overseas Development Group 2 Tyndall Centre for Climate Change Research, UK 3 School of Environmental Sciences, UEA, Norwich, UK
4.1 SUMMARY
Tabulated summary of key points
Climate parameter Future climate scenarios1 Confidence in projection2
Increasing temperatures1
Warmer in all seasons. See Table 2 for details. Higher average temperatures likely to be associated with increase in extreme high temperatures.
High confidence, good agreement between climate models.
Change in rainfall amounts/ distribution1
Seasonal differences: tendency for wetter monsoon (JJA), drier dry seasons (DJF) Changes in the upstream basin region and Bangladesh broadly similar. See Tables 2 and 3 for details.
Medium confidence, less agreement between climate models on direction and magnitude of change. Need to consider a range of outcomes: dry, average and wet (modest average changes, wide range between dry and wet).
Changing rainfall intensities1
Most models indicate wetter monsoon conditions. Likely to be associated with higher rainfall intensities causing higher peak flows in rivers and increases in flood magnitude/frequency. No clear signal of changes in variability in monsoon rainfall.
Medium confidence.
Droughts1
Given reductions in mean dry season rainfall it is likely that dry spells may increase/lengthen with negative consequences for water availability/soil moisture. Higher temperatures will contribute to increased evaporation losses, likely to worsen soil moisture deficits.
As for rainfall above. Likely to be a problem in areas already affected by drought. Medium confidence.
Cyclone and storm surge
Inconclusive – IPCC 2001 concluded that ‘…there is some evidence that regional frequencies of tropical cyclones may change but none that their locations will change. There is also evidence that the peak intensity may increase by 5% and 10% precipitation rates may increase by 20-30%.’
Low confidence, evidence points towards some increase in frequency/intensity.
Sea level rise (including sedimentation and subsidence effects) 3
IPCC ranges; 2030s; 4.5 – 23cm (14cm used by NAPA3) 2050s; 6.5 – 44cm (32cm used by NAPA)
High confidence, but wide range in estimates, depending on emission scenario and scientific uncertainties. Regional/local situation also important.
Table 1. Summary of climate change scenarios for Bangladesh and upstream GBM basins. Notes: 1 = Based on results from recent climate model experiments presented in this report. 2 = Considers inherent uncertainty of different variables produced by climate models and uncertainties due to differences between climate models (in particular some produce wetter conditions, some drier). 3 No explanation provided with the NAPA estimates for sea level rise, other estimates based on GOB-UNDP, 2005 (based on linear change with respect to IPCC, 2100).
Section 4: New climate scenarios for Bangladesh
38
New climate change scenarios are presented based on climate model results made available through the Program for Climate Model Diagnosis and Intercomparison (PCMDI) for the IPPC Fourth Assessment Report to be published in 2007. A total of 18 GCMs were analysed with the IPCC SRES-A2 and B1 emission scenarios. A sub-set of 10 GCMs was selected based on the models that best simulated the average rainfall during the main monsoon rainy season in Bangladesh (using JJA season to represent the monsoon). Results are presented with two IPCC SRES emission scenarios; A2 (high) and B1 (low). Changes in the Ganges-Brahmaputra-Meghna basins: − Annual warming by the 2020s of 1.2°C (A2 and B1) and by the 2050s 2.4°C (A2),
1.9°C (B1). − Modest changes in annual rainfall by the 2020s (-1% and +4% with A2 and B1,
respectively). The seasonal changes are larger: drier winters (0% A2, -9% B1) and wetter monsoon summers (+4% A2, +8% B1).
− By the 2050s average changes are generally larger, with continued winter drying (-5% A2, -4% B1) and summer wetting (+9% A2, +10% B1).
Changes in Bangladesh: − Slightly less annual warming than in the GBM region. By the 2020s warming is
0.9 and 1.0°C (A2 and B1) and the 2050s 2.0°C (A2), 1.6°C (B1). − The climate model averages also suggest smaller changes in annual rainfall by
the 2020s (0% and -1% with A2 and B1, respectively). − Probabilistic estimates of change in rainfall show there is a higher probability of
wetter conditions in summer and a higher chance of drying in winter. − The seasonal changes are also modest: slightly wetter winters (+3% A2, 0% B1)
and monsoon summers (+1% A2, +4% B1). − By the 2050s average changes are slightly larger, with winter drying (-3% A2, -
4% B1) and summer wetting (+2% A2, +7% B1). In both regions and all seasons there are considerable differences between climate model simulations of future rainfall conditions; this emphasises the need to use a range of scenarios to represent the uncertainty in future climate change impacts. Future sea level rise - we base our estimates on IPCC scenarios (IPCC, 2001). The ‘net sea level rise’ will be 4.5 to 23 cm (mid-range value used is 14 cm) in the 2020s and 6.5 to 44 cm (mid-range value used is 32 cm) in the 2050s. Future cyclone activity - we assume changes in SSTs based on the new temperature changes from the scenarios presented above. We make no assumptions about changes in cyclone frequency, cyclone track and the effects of potential increases in rainfall.

Section 4: New climate scenarios for Bangladesh
39
4.2 CLIMATE CHANGE SCENARIOS FOR BANGLADESH New scenarios using climate model results available for the IPCC Fourth Assessment Report (AR4) PREPARATION OF GCM DATA SETS FOR BANGLADESH AND UPSTREAM RIVER BASINS The models used for the temperature and precipitation projections are given in Table 1. This table also illustrates the number of runs given in the 20th century experiment and the resolution of the individual models. For the SRES-A2 and SRES-B1 scenarios, the model results were interpolated onto the grid used for the UK HadGEM1 model, which has a resolution of 1.25° latitude x 1.875° longitude, for a specified window (larger than that used for the basin). After interpolating the model output for the specified window, the grid box used to calculate the upstream river basins area average was defined from 22.5°N to 32.5°N, 75°E to 95.625°E (the Ganges-Brahmaputra-Meghna, GBM, basins). For Bangladesh, the grid used was from 22.5°N to 25°N, 90°E to 91.875°E (6 grid points). For the control run (the climate models’ simulation of 20th century climate), the years used were from 1961 to 1990 (in fact from December 1960 to November 1990) in order to compare with the observations for Bangladesh (from New et al., 2001). For the future projections: 2020s, 2050s and 2080s, the years used were from 2010 to 2039, 2040 to 2069 and 2070 to 2099, respectively (starting in the December of the previous year for each projection and finishing in the November of the last year). Model Model Sponsor Bcc_cm1 BCC (Beijing Climate Center, China Bccr_bcm2_0 BCCR (Bjerknes Centre for Climate Research Cccma_cgcm3_1 Canadian Centre for Climate Modelling and Analysis Ccma_cgcm3_1_t63 Canadian Centre for Climate Modelling and Analysis Cnrm_cm3 Centre National de Recherches Meteorologiques, Meteo-France Csiro_mk3_0 CSIRO Atmospheric Research, Melbourne, Australia Gfdl_cm2_0 NOAA GFDL (US Dept of Commerce / NOAA / Geophysical Fluid
Dynamics Laboratory, Princeton Gfdl_cm2_1 NOAA GFDL (US Dept of Commerce / NOAA / Geophysical Fluid
Dynamics Laboratory, Princeton Giss_aom NASA/Goddard Institute for Space Studies, New York, USA Giss_model_e_h NASA/GISS (Goddard Institute for Space Studies, New York, USA Giss_model_e_r NASA/GISS (Goddard Institute for Space Studies, New York, USA Iap_fgoals1_0_g LASG, Institude of Atmospheric Physics, P.O. Box 9804, Beijing Inmcm3_0 Iistitute for Numerical Mathematics, Moscow, Russia Ipsl_cm4 Institut Pierre Simon Laplace, Paris, France Miroc3_2_hires Center for Climate System Research, Tokyo, Japan Miroc3_2_medres Center for Climate System Research, Tokyo, Japan Miub_echo_g University of Bonn, Bonn, Germany Mpi_echam5_0 Max Planck Institute for Meteorology,Hamburg, Germany Mri_cgcm2_3_2a Meteorological Research Institute, Tsukuba, Ibaraki, Japan Ncar_ccsm3_0 National Center for Atmospheric
Research, Boulder, CO, USA Ncar_pcm1 National Center for Atmospheric
Research, Boulder, CO, USA Ukmo_hadcm3 Met Office (Exeter, Devon, EX1 3PB, UK Ukmo_hadgem1 Met Office (Exeter, Devon)
Table 1: Climate models used from the IPCC AR4 set of models. A2 and B1 emissions. Models in bold are those selected for generate the scenarios for Bangladesh. Data source; PCMDI.
SELECTION OF SUB-SET OF GCMS FOR CONSTRUCTING SCENARIOS: Confidence in GCM simulation of regional climate

Section 4: New climate scenarios for Bangladesh
40
A total of 18 GCMs were analysed with the IPCC SRES-A2 and B2 emission scenarios. A sub-set of 10 GCMs was selected based on the models that best simulated the average rainfall during the main monsoon rainy season in Bangladesh (using JJA season to represent the monsoon).
There are no universal criteria for ranking GCMs in terms of skill at simulating current and future climate. Because different GCMs simulate different responses to emissions of greenhouse gases it is important to present results from more than one model to reflect this source of uncertainty. It is beyond this study to perform a detailed assessment and ranking of GCM performance in simulating Bangladesh’s climate. As an indication of GCM simulation of regional climate Figure 1 shows a comparison of observed and current climate simulations by the 18 AR4 climate models for the GBM basins and Bangladesh. It is clear that there is considerable variation in the models’ simulation of the timing and magnitude of rainfall during the monsoon season.
The errors in the simulation of current climate (termed control climate) in the region underscore the need to interpret the future climate scenarios with caution. We make no judgement on performance between models and present the results with equal weight for all models (methods are available to present scenarios as probabilities, e.g. Dessai et al., 2005). Philips and Gleckler (2006) review control climate simulations of the full set of AR4 models in greater detail. The 10 models with the best simulation of JJA rainfall in the GBM (as it is more critical for future flood patterns in Bangladesh) were used for the following presentation of future climate scenarios.
GCM control climate simulations - JJA
02468
101214161820
10 12 14 16 18 20 22 24 26 28 30 32 34
Mean seasonal temperature (oC)
Mea
n da
ily ra
infa
ll (m
m)
ncar_ccsm3_0_run1
ncar_pcm1_run1
bcc_cm1_run1
bccr_bcm2_0_run1
cccma_cgcm3_1_run1
cnrm_cm3_run1
csiro_mk3_0_run1
gfdl_cm2_0_run1
gfdl_cm2_1_run1
giss_model_e_r_run1
inmcm3_0_run1
ipsl_cm4_run1
miroc3_2_medres_run1
mpi_echam5_run1
mri_cgcm2_3_2a_run1
ukmo_hadcm3_run1
ukmo_hadgem1_run1
OBSERVED
Figure 1: GCM simulation of the current (control) climate – example of JJA monsoon season temperature and rainfall, observed climate data from New et al. (2001). CHANGES IN TEMPERATURE AND PRECIPITATION: BANGLADESH AND GBM BASINS Results are presented with two IPCC SRES emission scenarios; A2 (high) and B1 (low). Ruosteenoja et al. (2003) summarise the SRES storylines from Nakicenovic et al. (2000) as follows:
A2 storyline and scenario family: a very heterogeneous world with continuously increasing global population and regionally oriented economic growth that is more fragmented and slower than in other storylines. B1 storyline and scenario family: a convergent world with the same global population as in the A1 storyline but with rapid changes in economic structures
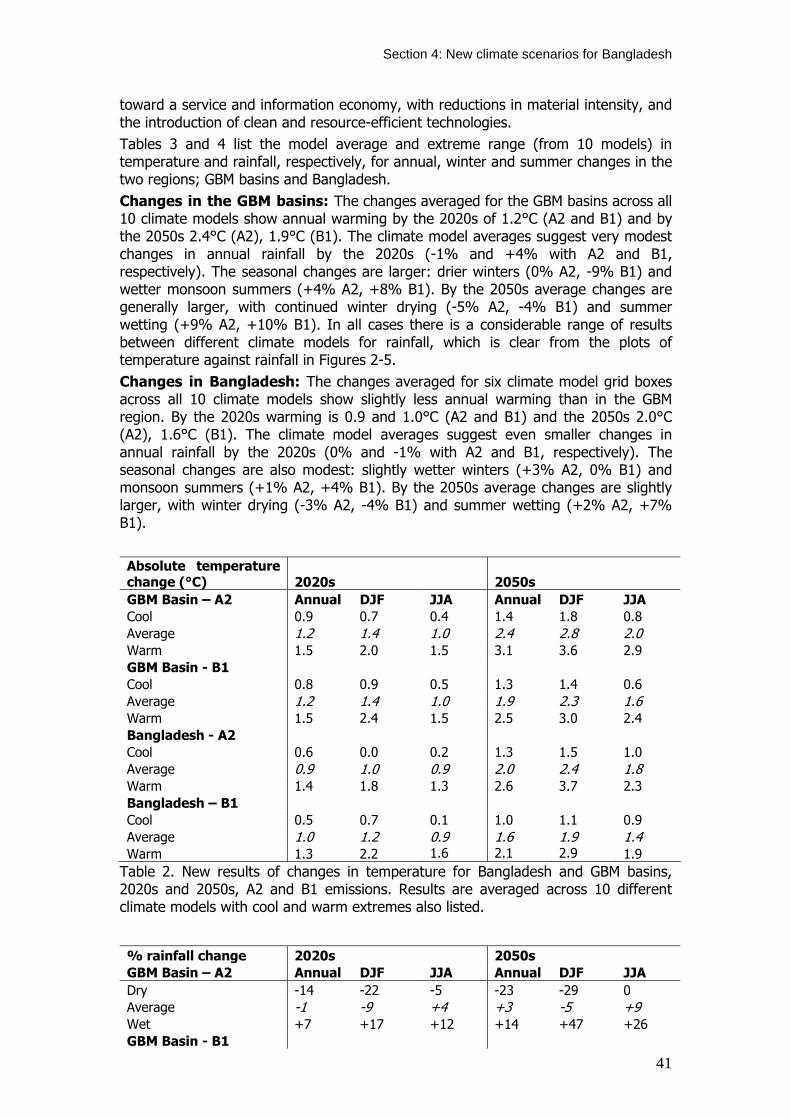
Section 4: New climate scenarios for Bangladesh
41
toward a service and information economy, with reductions in material intensity, and the introduction of clean and resource-efficient technologies. Tables 3 and 4 list the model average and extreme range (from 10 models) in temperature and rainfall, respectively, for annual, winter and summer changes in the two regions; GBM basins and Bangladesh. Changes in the GBM basins: The changes averaged for the GBM basins across all 10 climate models show annual warming by the 2020s of 1.2°C (A2 and B1) and by the 2050s 2.4°C (A2), 1.9°C (B1). The climate model averages suggest very modest changes in annual rainfall by the 2020s (-1% and +4% with A2 and B1, respectively). The seasonal changes are larger: drier winters (0% A2, -9% B1) and wetter monsoon summers (+4% A2, +8% B1). By the 2050s average changes are generally larger, with continued winter drying (-5% A2, -4% B1) and summer wetting (+9% A2, +10% B1). In all cases there is a considerable range of results between different climate models for rainfall, which is clear from the plots of temperature against rainfall in Figures 2-5. Changes in Bangladesh: The changes averaged for six climate model grid boxes across all 10 climate models show slightly less annual warming than in the GBM region. By the 2020s warming is 0.9 and 1.0°C (A2 and B1) and the 2050s 2.0°C (A2), 1.6°C (B1). The climate model averages suggest even smaller changes in annual rainfall by the 2020s (0% and -1% with A2 and B1, respectively). The seasonal changes are also modest: slightly wetter winters (+3% A2, 0% B1) and monsoon summers (+1% A2, +4% B1). By the 2050s average changes are slightly larger, with winter drying (-3% A2, -4% B1) and summer wetting (+2% A2, +7% B1). Absolute temperature change (°C) 2020s 2050s GBM Basin – A2 Annual DJF JJA Annual DJF JJA Cool 0.9 0.7 0.4 1.4 1.8 0.8 Average 1.2 1.4 1.0 2.4 2.8 2.0 Warm 1.5 2.0 1.5 3.1 3.6 2.9 GBM Basin - B1 Cool 0.8 0.9 0.5 1.3 1.4 0.6 Average 1.2 1.4 1.0 1.9 2.3 1.6 Warm 1.5 2.4 1.5 2.5 3.0 2.4 Bangladesh - A2 Cool 0.6 0.0 0.2 1.3 1.5 1.0 Average 0.9 1.0 0.9 2.0 2.4 1.8 Warm 1.4 1.8 1.3 2.6 3.7 2.3 Bangladesh – B1 Cool 0.5 0.7 0.1 1.0 1.1 0.9 Average 1.0 1.2 0.9 1.6 1.9 1.4 Warm 1.3 2.2 1.6 2.1 2.9 1.9
Table 2. New results of changes in temperature for Bangladesh and GBM basins, 2020s and 2050s, A2 and B1 emissions. Results are averaged across 10 different climate models with cool and warm extremes also listed.
% rainfall change 2020s 2050s GBM Basin – A2 Annual DJF JJA Annual DJF JJA Dry -14 -22 -5 -23 -29 0 Average -1 -9 +4 +3 -5 +9 Wet +7 +17 +12 +14 +47 +26 GBM Basin - B1

Section 4: New climate scenarios for Bangladesh
42
Dry -3 -33 -1 -14 -24 0 Average +4 0 +8 +4 -4 +10 Wet +20 +31 +40 +12 +25 +35 Bangladesh - A2 Dry -9 -24 -11 -14 -70 -11 Average 0 +3 +1 +2 -3 +2 Wet +9 +46 +13 +16 +62 +24 Bangladesh – B1 Dry -10 -60 -9 -6 -57 -9 Average +2 0 +4 +4 -4 +7 Wet +7 +62 +16 +21 +27 +28
Table 3. New results of changes in rainfall for Bangladesh and GBM basins, 2020s and 2050s, A2 and B1 emissions. Results are averaged across 10 different climate models with dry and wet extremes also listed. Changes in rainfall are plotted against changes in temperature in Figures 2-5 in winter (DJF), and summer (JJA) for the three periods the 2020s, 2050s and 2080s with the two emission scenarios. Results are presented as mean changes in temperature (degree centigrade) and rainfall (per cent change) between the current conditions (1961-90) and three future 30 year periods. Each symbol represents the result from one GCM experiment.
Climate change over the basin under SRES A2 AR4 models (10 simulations) for DJF
-60
-40
-20
0
20
40
60
0.0 0.5 1.0 1.5 2.0 2.5 3.0 3.5 4.0 4.5
Temperature change (ºC)
Prec
ipita
tion
chan
ge (%
)
2020s2050s2080s
Figure 2: Winter changes in temperature and rainfall in the GBM basins by the 2020s, 2050s and 2080s with A2 emission scenarios and 10 GCMs.
Climate change in Bangladesh under SRES A2 AR4 models (10 simulations) for DJF
-80-60-40-20
0204060
0.0 0.5 1.0 1.5 2.0 2.5 3.0 3.5 4.0 4.5
Temperature change (ºC)
Prec
ipita
tion
chan
ge
(%)
2020s2050s2080s
Figure 3: Winter changes in temperature and rainfall in Bangladesh by the 2020s, 2050s and 2080s with A2 emission scenarios and 10 GCMs.

Section 4: New climate scenarios for Bangladesh
43
Climate change over the basin under SRES B1 AR4 models (10 simulations) for JJA
-20
0
20
40
60
80
0.0 0.5 1.0 1.5 2.0 2.5 3.0 3.5 4.0 4.5
Temperature change (ºC)
Prec
ipita
tion
chan
ge (%
)2020s2050s2080s
Figure 4: Monsoon changes in temperature and rainfall in Bangladesh by the 2020s, 2050s and 2080s with B1 emission scenarios and 10 GCMs.
Climate change in Bangladesh under SRES B1 AR4 models (10 simulations) for JJA
-20
0
20
40
60
80
0.0 0.5 1.0 1.5 2.0 2.5 3.0 3.5 4.0 4.5
Temperature change (ºC)
Prec
ipita
tion
chan
ge (%
) 2020s2050s2080s
Figure 5: Monsoon changes in temperature and rainfall in Bangladesh by the 2020s, 2050s and 2080s with B1 emission scenarios and 10 GCMs. SEA LEVEL RISE SCENARIOS FOR THIS STUDY We base our estimates on IPCC scenarios (IPCC, 2001) which provide globally averaged sea level change that projects a rise of 9 to 88 cm by the year 2100. Considering a non-linear rate of change owing to the gradual accumulation of greenhouse gases in the atmosphere, the range of sea level rise will be 2 to 20 cm in 2025 and 4 to 39 cm in 2050. The ‘net sea level rise’ will be 4.5 to 23 cm in the 2020s and 6.5 to 44 cm in the 2050s.
CYCLONE ACTIVITY SCENARIOS FOR THIS STUDY
We assume changes in SSTs based on the new temperature changes from the AR4 scenarios presented in Input Report 1bii. These are used to estimate future wind speed, storm surge height and cyclone incursion. We make no assumptions about cyclone frequency, cyclone track and the effects of potential increases in rainfall. 4.3 UNCERTAINTIES IN FUTURE CLIMATE CHANGE SCENARIOS
There are uncertainties in climate scenarios at the space and time-scales required for impacts assessment and further uncertainties involved in the translation from climate change to impacts. Sources of uncertainty in our analysis include:
• Large uncertainty exists in the future rate of greenhouse gas emissions and is represented in IPCC by a range of emission scenarios. Different climate models

Section 4: New climate scenarios for Bangladesh
44
may simulate different responses to the same greenhouse gas emissions which also introduces uncertainty in future climate scenarios and this is especially true for rainfall.
• We are show only changes in average climate over very large areas, these average changes in climate may not represent more localised changes.
• We present only results for average seasonal climate. The variability of climate and frequency of extremes is also likely to alter.
There are some aspects of future climate change in which we have greater confidence than others. For example, we are more confident about increases in greenhouse gas concentrations and rises in sea-level, than we are about increases in storminess and intensity of cyclones. The scenarios presented here have been derived from GCMs that include the best possible representation of processes in the atmosphere, ocean and land, given present scientific knowledge and computing technology. Nevertheless there is a varying degree of uncertainty associated with different climate variables which affects our confidence in the scenarios presented here (see Table1 from IPCC).
Climate variable High Confidence Atmospheric CO2 concentration Global-mean sea-level Global-mean temperature Regional seasonal temperature Regional temperature extremes Regional seasonal precipitation Regional potential evapotranspiration Changes in climatic variability (e.g. cyclones and storm surges, daily precipitation)
Low confidence
Climate surprises (e.g. disintegration of the West Antarctic Ice Sheet)
Very low or Unknown
Table 1: List of climate and associated scenario variables, ranked subjectively in decreasing order of confidence (adapted from IPCC, 2001).
4.4 PRESENTING UNCERTAINTIES IN CLIMATE CHANGE SCENARIOS AS PROBABILITIES
TECHNICAL DETAILS
Probability (or cumulative) density functions (PDFs) for temperature and precipitation change were constructed following the methodology described in Dessai et al. (2005). First regional climate change values of temperature and precipitation change per degree of global warming5 were extracted from all Climate Models used in the IPCC Fourth Assessment Report for SRES A2 and B1 (Table 1). Their performance was assessed by comparing their simulations of present climate (1961-90 seasonal means) with observed data (see Figure 1). This analysis allowed the exclusion of one
5 This is calculated by dividing seasonal mean patterns at the end of the century (2080s) by global mean temperature change at the same period.

Section 4: New climate scenarios for Bangladesh
45
model (Bcc_cm1) which performed very poorly. Based on the assumption that all other models are equally likely, frequency distributions (PDFs) of regional climate response (in terms of temperature or precipitation change per degree of global warming for each season) were constructed. A simple climate model (Wigley and Raper 2001) was used to estimate the probability of global mean temperature change (compared to 1990) for different time horizons, under different emissions scenarios and sampling a range of uncertainties such as climate sensitivity, aerosol forcing, carbon cycle and ocean diffusivity (the parameters for these PDFs are those used in Wigley and Raper, 2001). Using the probabilistic pattern-scaling technique (which runs with a Latin Hypercube Sampling; essentially a random stratified sampling) the regional response PDF and the global mean temperature PDF were multiplied to produce time and scenario dependent probabilities of regional climate change.
RESULTS
Plots of probabilities of change in temperature and precipitation are shown in Figures 6-9. From Figures 8 and 9 it is noticeable that there is a higher probability of wetter conditions in summer and a higher chance of drying in winter.
Bangladesh 2080s
0.00
0.01
0.02
0.03
0.04
0.05
0.06
0.07
0 1 2 3 4 5 6 7
JJA Temperature change (ºC)
Probability
A1B
A1FI
A1T
A2
B1
B2
Figure 6 shows the probability of summer temperature change in Bangladesh in the 2080s under different emissions scenarios. Emissions scenarios introduce considerable uncertainty to projections of this climate variable.

Section 4: New climate scenarios for Bangladesh
46
Bangladesh SRES A2
0.00
0.05
0.10
0.15
0.20
0.25
0 1 2 3 4 5 6 7 8
Temperature change (ºC)
Probability
DJF 2020s
DJF 2050s
DJF 2080s
JJA 2020s
JJA 2050s
JJA 2080s
Figure 7 shows the probability of summer and winter temperature change in Bangladesh in the 2020s, 2050s and 2080s under SRES A2. It is evident that winter temperature will warm more than summer temperature and that uncertainty expands the further you look into the future.
Bangladesh SRES A2 JJA
0.000.050.100.150.200.250.300.350.400.450.50
-40 -20 0 20 40 60
Precipitation change (%)
Probability2020s
2050s
2080s
Figure 8 shows the probability of summer precipitation change in Bangladesh in the 2020s, 2050s and 2080s under SRES A2.

Section 4: New climate scenarios for Bangladesh
47
Bangladesh SRES A2 DJF
0.00
0.05
0.10
0.15
0.20
0.25
-100 -50 0 50 100
Precipitation change (%)
Probability2020s
2050s
2080s
Figure 9 shows the probability of winter precipitation change in Bangladesh in the 2020s, 2050s and 2080s under SRES A2.
4.5 SECTION 4 REFERENCES
Cubasch,U. and Meehl,G.A. (eds.) (2001) Projections of future climate change pp. 525-582 in, Climate change 2001: the scientific basis (eds.) Houghton,J.T., Ding,Y., Griggs,D.J., Noguer,M., van der Linden,P.J., Dai,X., Maskell,K. and Jonhnson,C.A. (eds.) (2001) Contribution of WG1 to the IPCC Third Assessment, Cambridge University Press, Cambridge, UK, 944pp.
Dessai, S., X. Lu, and M. Hulme. 2005. Limited sensitivity analysis of regional climate change probabilities for the 21st century. Journal of Geophysical Research-Atmospheres 110:D19108.
IPCC (2001) Climate change 2001: the scientific basis. . Contribution of Working Group I to The Third Assessment Report of the IPCC. Cambridge University Press, Cambridge.
Mitchell, T. D., Hulme, M., and New, M., 2002: Climate data for political areas. Area 34:109-112. [http://www.cru.uea.ac.uk/~timm/climate/scatter/TYN_CY_2_0.html]
Nakicenovic, N. et al. (2000). Special Report on Emissions Scenarios: A Special Report of Working Group III of the Intergovernmental Panel on Climate Change, Cambridge University Press, Cambridge, U.K., 599 pp. [http://ipcc-ddc.cru.uea.ac.uk/sres/scatter_plots/scatterplots_home.html]
Ruosteenoja, K., T.R. Carter, K. Jylhä and H. Tuomenvirta, 2003: Future climate in world regions: an intercomparison of model-based projections for the new IPCC emissions scenarios. The Finnish Environment 644, Finnish Environment Institute, 83pp.
Wigley, T. M. L., and S. C. B. Raper. 2001. Interpretation of high projections for global-mean warming. Science 293:451-454.

Section 6: Assessing vulnerability to climate hazards
Section 5: Secondary Impacts of Climate Change in Bangladesh
This section is authored by Ahmadul Hassan1 with additional text and data preparation by Declan Conway2,3 1Land and Water Resources Planner, [email protected], CEGIS – Center for Environmental and Geographic Information Services, Bangladesh 2School of Development Studies-Overseas Development Group 3Tyndall Centre for Climate Research, University of East Anglia
5.1 SUMMARY
Impacts on River Flows and Area Flooded
Bangladesh is mostly a low-lying delta formed at the confluence of three large rivers; the Ganges, the Brahmaputra and the Meghna (GBM).
The Ganges and Brahmaputra have tended to be the main cause of major floods in Bangladesh. Extreme floods occurred in 1974, 1980, 1984, 1987, 1988, 1998, and 2004.
Long term river flow records for the three rivers show slight increasing trends in peak flows of the Brahmaputra and Ganges, and no trend in the Meghna.
We follow a published approach to estimating future peak flows in the GBM basin using a simple linear relationship between rainfall and river flows and a non-linear relationship between flooded area and total maximum discharge in the GBM rivers.
We then derive estimates of total mean peak discharge and area flooded for the 2020s and 2050s with new climate change scenarios produced for this study.
− Annual rainfall changes are modest, seasonal changes more significant: The mean changes in annual rainfall from 10 climate models are relatively modest, even by the 2050s, however seasonal changes are larger but remain within 10% for the summer monsoon (JJA).
− Monsoon rainfall increases: Mean rainfall changes in JJA are all positive suggesting wetter conditions in the future with A2 and B1 emissions in the 2020s and 2050s.
− Flood magnitude and area flooded increases: Rainfall changes produce similar size percentage changes in peak river discharges and larger percentage changes, mainly increases, in total flooded area.
− In the future, extreme peak river discharges are likely to occur more frequently: The recurrence interval for the devastating 1998 flood reduces from roughly 1 in 50 years to 1 in 30 years in the 2020s and 1 in 15 years in the 2050s.
− Uncertainty in future rainfall conditions remains high: In all cases individual climate model results show a wide spread of rainfall changes, ranging from large decreases to large increases.
SRES A2 Emissions SRES B1 Emissions
2020s Rain-fall %
Qmax % FA%
% of total
Rain-fall %
Qmax % FA%
% of total
Mean 4 5 24 26 8 8 47 31 High (wet) 8 9 49 31 40 42 424 109 Low (dry) 3 4 18 25 0 1 2 21 2050s Mean 9 10 54 32 10 11 63 34 High (wet) 26 28 218 66 35 37 336 91 Low (dry) 7 8 45 30 8 9 50 31

Section 6: Assessing vulnerability to climate hazards
49
Table 1: Change in mean maximum discharge and flooded area for SRES A2 and B1 emission scenarios. Qmax% is the per cent change in maximum river discharge, FA% is the per cent increase in flooded area – all changes calculated from current means.
Flooded Area
-
20,000
40,000
60,000
80,000
100,000
120,000
140,000
0 10 20 30 40 50 60 70 80 90 100Flood recurrence interval (1 in X years)
Are
a af
fect
ed (k
m2)
0%
10%
20%
30%
40%
50%
60%
70%
80%
90%
100%
Perc
ent o
f tot
al
Return Period B1 2020sB1 2050s Flooded Area
Figure 1: Shows the increase in area affected by flood from present situation (black line) to the 2020s (blue line) and 2050s (red line). Flood area is also expressed as percentage of total area of Bangladesh.
Sea Level Rise, Coastal Inundation and Salinity Intrusion
Because of its low lying situation Bangladesh is very vulnerable to current coastal hazards and future sea level rise (SLR). Previous studies have highlighted the potential negative consequences of SLR, which are likely to be most serious through the effects of extremes such as storm surges. Drainage congestion is already a growing important problem in Bangladesh and is likely to be exacerbated by SLR and increased river flooding. We adopt widely accepted figures for rates of SLR (e.g. by Bangladesh NAPA, and IPCC) which suggest the following:
− Increases in inundated areas of up to 3% (2030s) and 6% (2050s): Primarily in coastal low lying areas (0 – 30 cm, Khan et al., 2006, using upper estimates of SLR).
− Modelling studies show salinity intrusions along much of the coastline: Rates of intrusion vary with local conditions and are strongly influenced by dry season river flows and the rate of SLR.
− Large uncertainties are associated with regional to district level estimates of inundation: This is due to the confounding effects of, inter alia, variable rates of uplift and sedimentation, river flooding and erosion.
Climate Change Impact on Cyclones and Storm Surges in Bangladesh
Roughly 3 to 7 cyclones hit the Bangladesh coast each decade year. About 53% of the total world deaths due to tropical cyclones occurred in Bangladesh.
There is some evidence that regional frequencies of tropical cyclones may change but none that their location will change. There is also evidence that peak intensity may increase by 5% to 10% which would contribute to enhanced storm surges and coastal flooding.

Section 6: Assessing vulnerability to climate hazards
50
We calculate estimates of future wind velocity and surge height for the Bangladesh coast using simple response functions between temperature and wind speed and wind speed and surge height.
− Cyclones may penetrate further inland and cyclone High Risk Areas are likely to increase in size: Increases in the wind velocity and storm surge height result in further inland intrusion. The cyclone High Risk Areas (HRAs) of 8900 sq km will increase by 35% and 40% in the 2020s and 2050s, respectively.
− The total population exposed to cyclone High Risk Areas is likely to increase: The total coastal area is about 39 400 km2 and population density is 930 person/km2. Currently about 8.3 million people live in cyclone HRAs and, based on our results and projections of future population density, this will increase to 14.6 million in the 2020s and 20.3 million in the 2050s.
Impact of Flooding on Agricultural Yields
There is a clear and well known relationship between total damages and flood magnitude in Bangladesh. Statistics on crop damage at the national level also indicate a strong non-linear relationship with peak river discharges.
Our preliminary analysis at sub-national scale shows only weak relationships exist between agricultural yields (Boro, Aman and Aus crops) and river levels at key dates in the crop calendar.
Changes in future flood frequency and extent will impact on agricultural yields but further analysis is necessary to quantify their impacts.
Impacts of Drought on Crop Production
Drought may affect crop production during three seasons Rabi, Pre-Kharif and Kharif.
Existing work shows small change in drought severity with one degree increase in temperature but substantial increased in stress with two degree increase for both Rabi and Kharif season.
Our climate change scenarios suggest moderate drying in the winter with implications for the Boro crop, although these will be mediated by availability of irrigation water.
Higher maximum temperatures and increases in crop water requirements may negatively effect crop production but better understanding of current situation is required to quantify such effects.
Effects of El Nino-Southern Oscillation (ENSO) Events In Bangladesh
There is an influence from the ENSO on rainfall and river flows in the region that is well documented. Rainfall and some river flows tend to be reduced during El Niño events.
At present there are no clear and consistent multi-climate model patterns of future behaviour in the ENSO. Further activities should be directed to improving skill and dissemination of flood early warning systems and inclusion of ENSO effects.

Section 6: Assessing vulnerability to climate hazards
51
5.2 RIVER FLOWS AND FLOODING
BACKGROUND
Bangladesh is mostly a low-lying delta formed at the confluence of three large rivers; the Ganges, the Brahmaputra and the Meghna (GBM). The rivers originate from three different basins forming a vast and complex system which it is extremely challenging to predict. The rivers drain huge volumes of monsoon runoff as 80% of the annual rainfall occurs during June-September. The river flows exceed the capacity of the drainage channels and as a result Bangladesh is the most flood vulnerable county in the world. Flood patterns are highly dependent on the magnitude and pattern of precipitation in the three river basins.
Figure 1: River networks and hydrographs of three main river systems of Bangladesh.
WL in Station Hardinge Bridge (River Ganges)
0 2 4 6 8 10 12 14 16
1-Jan 1-Feb 1-Mar 1-Apr 1-May 1-Jun 1-Jul 1-Aug 1-Sep
1-Oct 1-Nov1-Dec
Days
WL
(mPW
D)
Year 1998 Year 2002
WL in Station Bahadurabad (River Brahmaputra-Jamuna)
121314
15161718
192021
1-Jan 1-Feb1-Mar 1-Apr 1-May
1-Jun
1-Jul 1-Aug 1-Sep 1-Oct 1-Nov
1-Dec
Days
WL
(mPW
D)
Year 1998
Year 2002
WL in Station Bhairab Bazar (River Meghna)
0
1
2
3
4
5
6
7
8
1-Jan 1-Feb1-Mar 1-Apr 1-May 1-Jun
1-Jul 1-Aug 1-Sep 1-Oct 1-Nov 1-Dec
Days
WL
(mPW
D)
Year 1998Year 2002
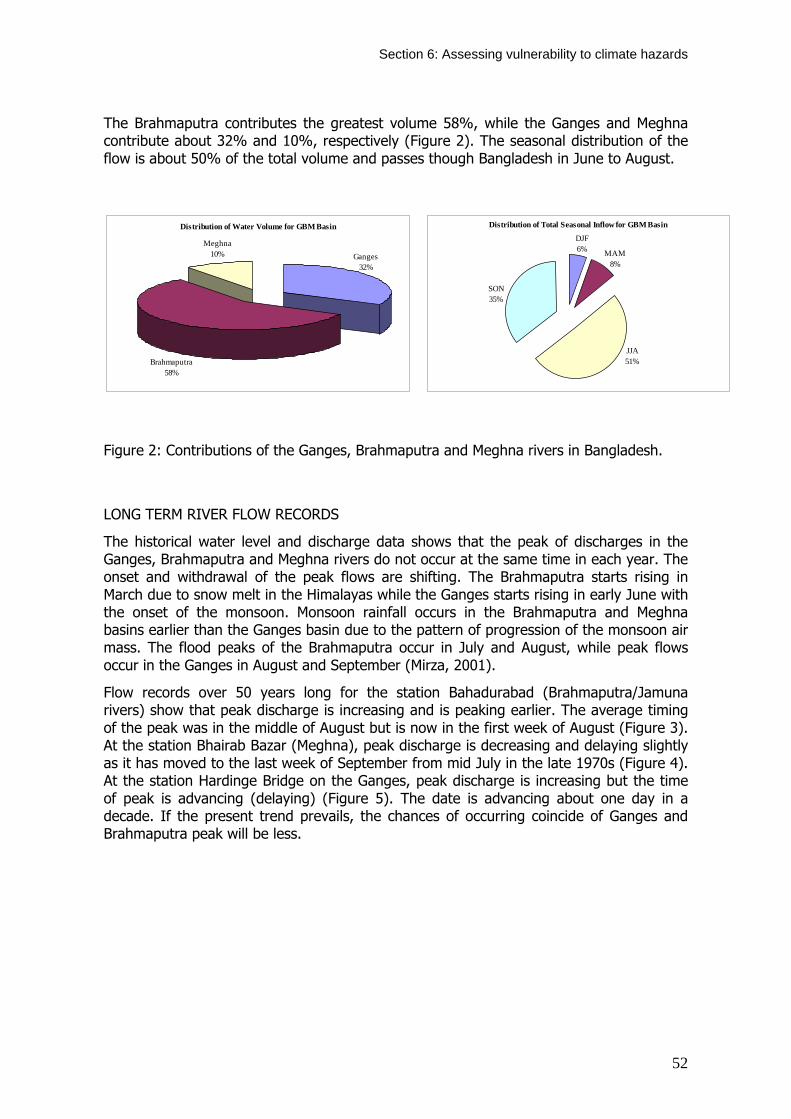
Section 6: Assessing vulnerability to climate hazards
52
The Brahmaputra contributes the greatest volume 58%, while the Ganges and Meghna contribute about 32% and 10%, respectively (Figure 2). The seasonal distribution of the flow is about 50% of the total volume and passes though Bangladesh in June to August.
Figure 2: Contributions of the Ganges, Brahmaputra and Meghna rivers in Bangladesh.
LONG TERM RIVER FLOW RECORDS
The historical water level and discharge data shows that the peak of discharges in the Ganges, Brahmaputra and Meghna rivers do not occur at the same time in each year. The onset and withdrawal of the peak flows are shifting. The Brahmaputra starts rising in March due to snow melt in the Himalayas while the Ganges starts rising in early June with the onset of the monsoon. Monsoon rainfall occurs in the Brahmaputra and Meghna basins earlier than the Ganges basin due to the pattern of progression of the monsoon air mass. The flood peaks of the Brahmaputra occur in July and August, while peak flows occur in the Ganges in August and September (Mirza, 2001).
Flow records over 50 years long for the station Bahadurabad (Brahmaputra/Jamuna rivers) show that peak discharge is increasing and is peaking earlier. The average timing of the peak was in the middle of August but is now in the first week of August (Figure 3). At the station Bhairab Bazar (Meghna), peak discharge is decreasing and delaying slightly as it has moved to the last week of September from mid July in the late 1970s (Figure 4). At the station Hardinge Bridge on the Ganges, peak discharge is increasing but the time of peak is advancing (delaying) (Figure 5). The date is advancing about one day in a decade. If the present trend prevails, the chances of occurring coincide of Ganges and Brahmaputra peak will be less.
Distribution of Total Seasonal Inflow for GBM Basin
SON35%
MAM8%
DJF6%
JJA51%
Distribution of Water Volume for GBM Basin
Brahmaputra58%
Meghna10% Ganges
32%

Section 6: Assessing vulnerability to climate hazards
53
Time of Peak discharge with respect to 1st April (Bahadurabad Station)
1-Apr
1-May
31-May
30-Jun
30-Jul
29-Aug
28-Sep
28-Oct
1950 1955 1960 1965 1970 1975 1980 1985 1990 1995 2000 2005 2010Year
Lead
tim
e (d
ay)
30
45
60
75
90
105
120
135
150
Dis
char
ge (1
000
m3/
sec)
Time of peak
Peak discharge
Figure 3: Trend line of peak discharge and its timing at Bahadurabad (Brahmaputra/Jamuna rivers) in Bangladesh.
Lead of peak discharge with respect to 1 st April (Bhairab bajar railway station)
1979
19801981
1983
1984
1985
1986 1987
19881989
19901991
19921993
1-Apr
1-May
31-May
30-Jun
30-Jul
29-Aug
28-Sep
28-Oct
1978 1979 1980 1981 1982 1983 1984 1985 1986 1987 1988 1989 1990 1991 1992 1993 1994
Year
Lead
of T
ime
(Day
)
0
5,000
10,000
15,000
20,000
25,000D
icha
rge
(m3/
s)
Date Peak Dicharge
Figure 4: Trend line of peak discharge and its timing at Bhairab Bazar (Meghna river) in Bangladesh.

Section 6: Assessing vulnerability to climate hazards
54
Time of Peak discharge with respect to 1st April (Hardinge Bridge Station)
1-Apr
1-May
31-May
30-Jun
30-Jul
29-Aug
28-Sep
28-Oct
1930 1940 1950 1960 1970 1980 1990 2000 2010
Year
Lead
of T
ime
(Day
)
30
45
60
75
90
105
120
135
150
Dis
char
ge (1
000
m3/
sec)
Time of peak
Peak discharge
1
Figure 5: Trend line of peak discharge and its timing at Hardinge Bridge (Ganges river) in Bangladesh.
Extreme floods occurred in 1974, 1980, 1984, 1987, 1988, 1998, and 2004. The quantity and timing of peak flows in the three rivers were analyzed and presented in Table 1. The 1987 flood was mainly from the Ganges and in 1988 all three rivers had high flows with peaks within one week. The 1998 flood discharge in the Ganges and Brahmaputra rivers was even higher than 1988 with coincidence in the timing. In the 2004 flood, the Ganges and Brahmaputra peaked early. The Ganges and Brahmaputra have tended to be the main cause of major floods in Bangladesh.
ExtremeYears Date m3/s % Date Discharge % Date Discharge %
1974 7-Aug 91.10 1.35 3-Sep 50.70 0.99 21.10 1.58 1980 20-Aug 61.20 0.91 22-Aug 57.80 1.13 7-Aug 12.40 0.93 1984 20-Sep 76.80 1.14 17-Sep 56.50 1.11 17-Sep 15.40 1.15 1987 16-Aug 73.00 1.08 20-Sep 75.80 1.48 4-Aug 15.60 1.17 1988 31-Aug 98.30 1.46 4-Sep 71.80 1.40 18-Sep 21.00 1.57 1998 9-Sep 103.10 1.53 11-Sep 74.28 1.45 18.60 1.39 2004 12-Jul 83.90 1.24 19-Jul 77.43 1.51 16.30 1.22
Mean 67.49 51.13 13.37 Min 40.90 31.50 7.94 Max 103.13 77.44 21.07
Brahmaputra/Jamuna Ganges Meghna
Table 1: Peak discharge and timing during extreme flood years. The peak discharge is a good indicator or proxy to assess the flood hazard. We use a Gumbel Type I distribution for flood frequency and return period analysis for the three rivers as shown in Figure 4.
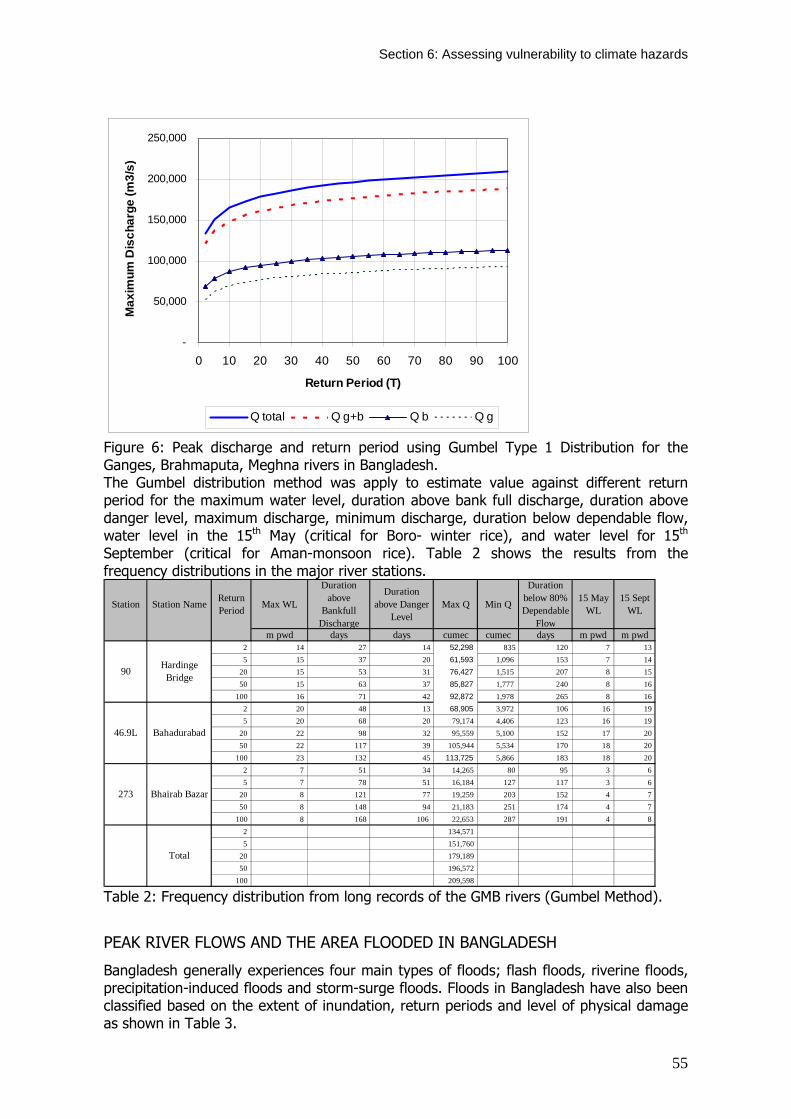
Section 6: Assessing vulnerability to climate hazards
55
-
50,000
100,000
150,000
200,000
250,000
0 10 20 30 40 50 60 70 80 90 100
Return Period (T)
Max
imum
Dis
char
ge (m
3/s)
Q total Q g+b Q b Q g
Figure 6: Peak discharge and return period using Gumbel Type 1 Distribution for the Ganges, Brahmaputa, Meghna rivers in Bangladesh. The Gumbel distribution method was apply to estimate value against different return period for the maximum water level, duration above bank full discharge, duration above danger level, maximum discharge, minimum discharge, duration below dependable flow, water level in the 15th May (critical for Boro- winter rice), and water level for 15th September (critical for Aman-monsoon rice). Table 2 shows the results from the frequency distributions in the major river stations.
Station Station Name Return Period Max WL
Duration above
Bankfull Discharge
Duration above Danger
LevelMax Q Min Q
Duration below 80% Dependable
Flow
15 May WL
15 Sept WL
m pwd days days cumec cumec days m pwd m pwd 2 14 27 14 52,298 835 120 7 13 5 15 37 20 61,593 1,096 153 7 14 20 15 53 31 76,427 1,515 207 8 15 50 15 63 37 85,827 1,777 240 8 16 100 16 71 42 92,872 1,978 265 8 16 2 20 48 13 68,905 3,972 106 16 19 5 20 68 20 79,174 4,406 123 16 19 20 22 98 32 95,559 5,100 152 17 20 50 22 117 39 105,944 5,534 170 18 20 100 23 132 45 113,725 5,866 183 18 20 2 7 51 34 14,265 80 95 3 6 5 7 78 51 16,184 127 117 3 6 20 8 121 77 19,259 203 152 4 7 50 8 148 94 21,183 251 174 4 7 100 8 168 106 22,653 287 191 4 8 2 134,571 5 151,760 20 179,189 50 196,572 100 209,598
Total
90
46.9L
273
Hardinge Bridge
Bahadurabad
Bhairab Bazar
Table 2: Frequency distribution from long records of the GMB rivers (Gumbel Method).
PEAK RIVER FLOWS AND THE AREA FLOODED IN BANGLADESH
Bangladesh generally experiences four main types of floods; flash floods, riverine floods, precipitation-induced floods and storm-surge floods. Floods in Bangladesh have also been classified based on the extent of inundation, return periods and level of physical damage as shown in Table 3.

Section 6: Assessing vulnerability to climate hazards
56
Flooded Area in Bangladesh
-
10,000
20,000
30,000
40,000
50,000
60,000
70,000
80,000
90,000
100,000
110,000
1954
1956
1958
1960
1962
1964
1966
1968
1970
1972
1974
1976
1978
1980
1982
1984
1986
1988
1990
1992
1994
1996
1998
2000
2002
2004
Year
Floo
ded
Are
a (k
m2 )
Types of Flood Range of flooded area (km2)
Range of percent inundation
Probability of occurrence
Normal Flood 31,000 21 0.50
Moderate Flood 31,000-38,000 21-26 0.30
Severe Flood 38,000-50,000 26-34 0.10
Catastrophic Flood 50,000-57,000 34-38.5 0.05
Exceptional Flood > 57,000 > 38.5 0.05
Table 3: Flood Classification in terms of area flooded and likelihood of occurrence. Source: Mirza (2002).
About 26 percent of the country is subject to annual flooding and an additional 42 percent is at risk of floods with varied intensity (Ahmed and Mirza, 1999). The 1998 flood inundated about 100,000 km2, the 1987 flood about 57,000 km2 and the 1988 flood 89,000 km2. The 1998 flood affected 68% of the country, seriously impacted the livelihoods of 30 million people and lasted for over 10 weeks (MDMR/UNDP 2000).
Flooded area versus water volume (June to August [JJA], total for GBM) and a classification of flood types are shown in Figure 7. If the total volume in JJA exceeds 558 000 Mm3 floods are classified as above normal, severe over 577 000 Mm3 and exceptional over 615 000 Mm3.
Figure 7: Flooded area and classification of flood types in Bangladesh.
The major flood events were analysed in-terms of area and percentage of total area flooded, exceedance probability of occurrence, and total discharge from the Ganges and Brahmaputra (Table 4). Historic data on flooded area and total water flow were estimated against return periods as shown in Figure 8.
-
10,000
20,000
30,000
40,000
50,000
60,000
70,000
80,000
90,000
100,000
110,000
0 100,000 200,000 300,000 400,000 500,000 600,000 700,000 800,000 900,000
Water Volume - JJA (Mm3)
Floo
ded
Are
a (k
m2 )
Normal Flood Moderate Flood
Severe Flood Catastrophic Flood
Exceptional Flood

Section 6: Assessing vulnerability to climate hazards
57
EventMajor Floods years Area (sq km)
% of total probability
Return Periond (T, year) Total
Brahmaputra+Ganges Total
Brahmaputra+Ganges
1974 52,600.00 0.36 0.858 7.04 162,866 141,800 8.64 6.61 1980 33,000.00 0.22 0.568 2.31 131,395 119,000 2.06 2.12 1984 28,200.00 0.19 0.458 1.85 148,688 133,300 4.32 4.20 1987 57,300.00 0.39 0.894 9.44 164,356 148,800 9.32 9.77 1988 89,970.00 0.61 0.987 79.34 191,125 170,100 37.51 33.54 1998 100,250.00 0.68 0.990 100.00 195,965 177,407 48.48 51.60 2004 58,000.00 0.39 0.899 9.86 177,770 161,383 18.59 20.14
Discharge (m3/s) Return period (T, year)Flood affected Exceedance
Table 4: Return period of flood affected area and peak discharge from Ganges and Brahmaputra for extreme flood events.
-
50,000
100,000
150,000
200,000
250,000
0 20 40 60 80 100
Return period
Valu
e
Total water flow, m3/s Flooded Area (sq km)
Figure 8: Flooded area and total water flow against recurrence interval.
5.3 RELATING RIVER FLOWS TO AREA FLOODED
PREVIOUS STUDIES
Various attempts have been made to estimate the effects of future climate change on flood frequency and magnitude in Bangladesh. Alam et al. (1998) estimated that by the year 2030, an additional 14.3% of the country would become extremely vulnerable to floods, and the already flood-vulnerable areas would face higher levels of flooding. Even if the banks of the major rivers are embanked, more non-flooded areas will undergo flooding by the year 2075. They found that depth of flooding is likely to be more pronounced in the lowlands and depressions in Faridpur, Southwest Dhaka, Rajshahi-Pabna, Comilla and Sylhet-Mymensingh greater districts. More areas are likely to be flooded by the year 2030, even after completion of about 60% of the flood protection schemes considered under the Flood Action Plan (Alam et al., 1998).
Mirza (2002) found the magnitude of future mean flood could exceed the current 20-year flood at the point where a 6°C rise in global mean temperature occurs (no date for this provided). A 2°C warming, combined with a 10% increase in precipitation, would increase runoff in the GBM Rivers by 19, 13 and 11%, respectively (Mirza and Dixit, 1997). A 10% increase in monsoon precipitation in Bangladesh could increase runoff depth by 18 to 22%, resulting in a sevenfold increase in the probability of an extremely wet year

Section 6: Assessing vulnerability to climate hazards
58
(Qureshi and Hobbie, 1994). In one study it is presented that monsoon precipitation could increase by 11 and 28% by 2030 and 2050, leading to surface runoff increases of 20 and 45%, respectively (Atoned and Alam, 1998).
METHOD FOR CALULATING FUTURE FLOOD FLOWS AND FLOODED AREA
Mirza (2002) used a series of empirical models between annual mean precipitation and discharge, and between annual mean discharge and peak discharge for the three rivers to translate climate model scenarios of precipitation (at given increases in temperature) into discharges and then calculate new probabilities of flood occurrence. Changes in precipitation under various warming scenarios (with climate models CSIR09, HadCM2, and GFDL) and corresponding mean peak discharge shows a simple relationship, as described below:
Ganges:
Average of Maximum Discharge QMAXg = 603.48 ∆ P + 52623 --- (1)
Brahmaputra:
Average of Maximum Discharge QMAXb = 639.69 ∆ P + 69187 --- (2)
Meghna:
Average of Maximum Discharge QMAXm= 227.73 ∆ P + 14084 --- (3)
QMAX tot = QMAXg + QMAXb + QMAXm --- (4)
We use this very simple relationship to derive new estimates of total mean peak discharge with new precipitation scenarios produced for this study.
Spatial patterns of flooding are extremely complex phenomena in flat topography like Bangladesh. To provide a simple estimate of future extent of flooded area we define a current relationship between flooded area and total maximum discharge of the GBM rivers:
Flooded Area = 2.11 (QMAXtot) 4.7113 / 1020 ---------- (5)
This relationship is shown in Figure 9, the relationship holds well for very high discharge, however, for lower discharges there is considerable uncertainty (this may be related to differences in the influence of the Meghna in lower flood years).
-
20,000
40,000
60,000
80,000
100,000
120,000
- 50,000 100,000 150,000 200,000 250,000
Total Qmax (m3/s)
Floo
ded
Area
(sq
km)
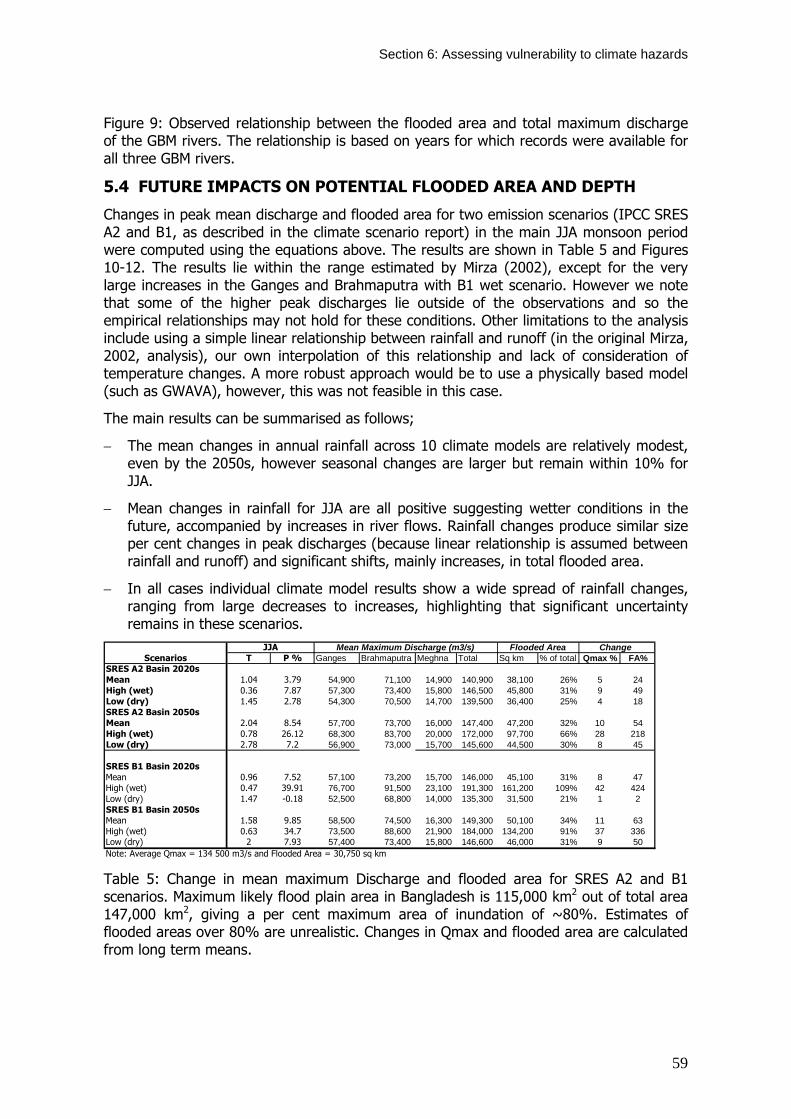
Section 6: Assessing vulnerability to climate hazards
59
Figure 9: Observed relationship between the flooded area and total maximum discharge of the GBM rivers. The relationship is based on years for which records were available for all three GBM rivers.
5.4 FUTURE IMPACTS ON POTENTIAL FLOODED AREA AND DEPTH
Changes in peak mean discharge and flooded area for two emission scenarios (IPCC SRES A2 and B1, as described in the climate scenario report) in the main JJA monsoon period were computed using the equations above. The results are shown in Table 5 and Figures 10-12. The results lie within the range estimated by Mirza (2002), except for the very large increases in the Ganges and Brahmaputra with B1 wet scenario. However we note that some of the higher peak discharges lie outside of the observations and so the empirical relationships may not hold for these conditions. Other limitations to the analysis include using a simple linear relationship between rainfall and runoff (in the original Mirza, 2002, analysis), our own interpolation of this relationship and lack of consideration of temperature changes. A more robust approach would be to use a physically based model (such as GWAVA), however, this was not feasible in this case.
The main results can be summarised as follows;
− The mean changes in annual rainfall across 10 climate models are relatively modest, even by the 2050s, however seasonal changes are larger but remain within 10% for JJA.
− Mean changes in rainfall for JJA are all positive suggesting wetter conditions in the future, accompanied by increases in river flows. Rainfall changes produce similar size per cent changes in peak discharges (because linear relationship is assumed between rainfall and runoff) and significant shifts, mainly increases, in total flooded area.
− In all cases individual climate model results show a wide spread of rainfall changes, ranging from large decreases to increases, highlighting that significant uncertainty remains in these scenarios.
T P % Ganges Brahmaputra Meghna Total Sq km % of total Qmax % FA%SRES A2 Basin 2020sMean 1.04 3.79 54,900 71,100 14,900 140,900 38,100 26% 5 24High (wet) 0.36 7.87 57,300 73,400 15,800 146,500 45,800 31% 9 49Low (dry) 1.45 2.78 54,300 70,500 14,700 139,500 36,400 25% 4 18SRES A2 Basin 2050sMean 2.04 8.54 57,700 73,700 16,000 147,400 47,200 32% 10 54High (wet) 0.78 26.12 68,300 83,700 20,000 172,000 97,700 66% 28 218Low (dry) 2.78 7.2 56,900 73,000 15,700 145,600 44,500 30% 8 45
SRES B1 Basin 2020sMean 0.96 7.52 57,100 73,200 15,700 146,000 45,100 31% 8 47High (wet) 0.47 39.91 76,700 91,500 23,100 191,300 161,200 109% 42 424Low (dry) 1.47 -0.18 52,500 68,800 14,000 135,300 31,500 21% 1 2SRES B1 Basin 2050sMean 1.58 9.85 58,500 74,500 16,300 149,300 50,100 34% 11 63High (wet) 0.63 34.7 73,500 88,600 21,900 184,000 134,200 91% 37 336Low (dry) 2 7.93 57,400 73,400 15,800 146,600 46,000 31% 9 50Note: Average Qmax = 134 500 m3/s and Flooded Area = 30,750 sq km
JJA Change Scenarios
Mean Maximum Discharge (m3/s) Flooded Area
Table 5: Change in mean maximum Discharge and flooded area for SRES A2 and B1 scenarios. Maximum likely flood plain area in Bangladesh is 115,000 km2 out of total area 147,000 km2, giving a per cent maximum area of inundation of ~80%. Estimates of flooded areas over 80% are unrealistic. Changes in Qmax and flooded area are calculated from long term means.

Section 6: Assessing vulnerability to climate hazards
60
F0 (0-30 cm) F1 (30 - 90 cm) F2 (90 - 180 cm) F3/F4 ( > 180 cm)Base 40 35 15 10SRES A22020s 38 34 16 122050s 36 33 17 14SRES B12020s 36 34 17 132050s 35 33 18 14
Area Percentage by Flood Depth Categories
Table 6: Change in Area percentage by flood Depth Categories for SRES A2 and B1 scenarios. Excluding the coastal area of Bangladesh.
The flood free and shallow flooded year will be reduced to 70% and 68% from 75% in 2020s and 2050s respectively. While deeply flooded area (F3/F4) will be increased to 2% and 4% from the base (present expected average inundation) in 2020s and 2050s respectively.
In Bangladesh, the land inundation has been categories into four land type classes F0, F1, F2 and F3 in response to peak discharge for crop suitability (MPO, 1986) and also for resources planning. In an average monsoon, the about 20% of area expected to be inundated in moderate to deeply flooded depth categories (Table 7 and Figure 10) and remaining areas are in flood free and shallow flood dept classes.
Table 7: Inundation categories of land type in Bangladesh. Source: CEGIS
Figure 10: Spatial Distribution of Land Type of Inundation Classes in Bangladesh (Source: CEGIS)
Land type of inundation class Range of inundation depth (cm) Percentage
Area Highland (F0) <30 (Flood free) 35 Medium highland (F1) 30 – 90 (Shallow flooded) 45 Medium lowland (F2) 90 – 180 (Moderately flooded) 10 Lowland (F3) > 180 (Deeply flooded) 10

Section 6: Assessing vulnerability to climate hazards
61
The study assess the impacts on average flood depth for two emission scenarios of IPCC SRES A2 and B1 in the JJA monsoon period for the mean value only. Analyze the changes in the probability of the exceedence of a current 2.33 year (average) flood for the Ganges, Brhmaputra and Meghna rivers under climate changes. The ratio of the future and present probability (p2/p1) for mean value of IPCC SRES A2 and B1 scenarios for the three major rivers is shown in Table 8. Table 7 shows more changes will be in the area influenced by the river Meghna.
Ratio of the future and present probability (p1/p2)
of 2.33 year (average) flood for Major River Dependable Areas Scenarios
Ganges Brahmaputra Meghna SRES A2 Basin 2020s 1.22 1.16 1.65 SRES A2 Basin 2050s 1.53 1.40 2.45 SRES B1 Basin 2020s 1.46 1.35 2.20 SRES B1 Basin 2050s 1.64 1.49 2.75
Table 8: Ration of the future and present probability (p2/p1) of the Return Period of 2.33 year (average) flood for Ganges, Brahmaputra, Meghna river dependable area.
The Ganges, Brahmaputra and Meghan river induced flood dependable area were delineated with river, catchment, topography and physiographic data using GIS overlay technique. There are 255 BWDB water level observing stations spread over the three dependable areas (Figure 11) with minimum 30years records. Of which 70 observed stations are in the coastal area of Bangladesh. The selected water level stations 47, 86, and 52 of BWDB are in the Ganges river Dependable Area, Jamuna Dependable Area (JDA) and Meghna Dependable Area (MDA) respectively for the analysis. Compute future water levels under climate change scenarios using p2/p1 ratios from Table 8 for each selected stations of respective dependable areas to produce continuous water level using GIS surfacing techniques.
Figure 11: Selected Water Level Observation Stations of BWDB spread over the GDA, JDA, MDA and Coastal Area of Bangladesh for GIS based water surface modelling.

Section 6: Assessing vulnerability to climate hazards
62
The flood depth maps under climate change scenarios was generated using GIS modelling techniques with the water level surface and digital elevation model (DEM) data. The produced flood depth without climate change scenario baseline case was verified with existing land type map (Figure 10) and compute error for adjustment. Further more, additional adjustment was made for the areas within the flood-protected areas (FCD/I, FCD, FC type BWDB projects).
The change in inundation categories (F0, F1, F2 and F3) under mean value of IPCC SRES A2 and B1 scenarios were estimated and shown in Figure 12. There will be 57% decrease in flood free (F0) and about 51 percent increase in moderate flooded area (F2) in the year 2050s with SRES A2 scenario. While, there will be 63% reduction in flood free area (F0) and about 82% increase in Moderate flooded area (F2) in the year 2050s with SRES B1 scenario. Recent study shows similar patterns of changes (Mirza at el., 2003).
Figure 12: Change in Fo,F1, F2 and F3 inundation flood depth categories in Bangladesh for two IPCC Scenarios (Mean SRES A2 and B1) for the year 2020s and 2050s. Result excludes the coastal area of Bangladesh.
The spatial distribution of flood depth for IPCC SRES A2 and B1 scenarios are shown in Figure 13. The base line of the flood depth area percentage are 32, 41, 15 and 12 for F0, F1, F2 and F3 land type categories respectively excluding coastal area. More flooding in the north eastern region of Bangladesh. The will be the average year scenario for 2020s and 2050s but with the extreme event like 1998 flood, situation will be devastating.

Section 6: Assessing vulnerability to climate hazards
63
Figure 13: Spatial Distribution of Flood extent and depth for mean IPCC SRES A2 and B1 Scenarios for the year 2020s and 2050s excluding the coastal area of Bangladesh.
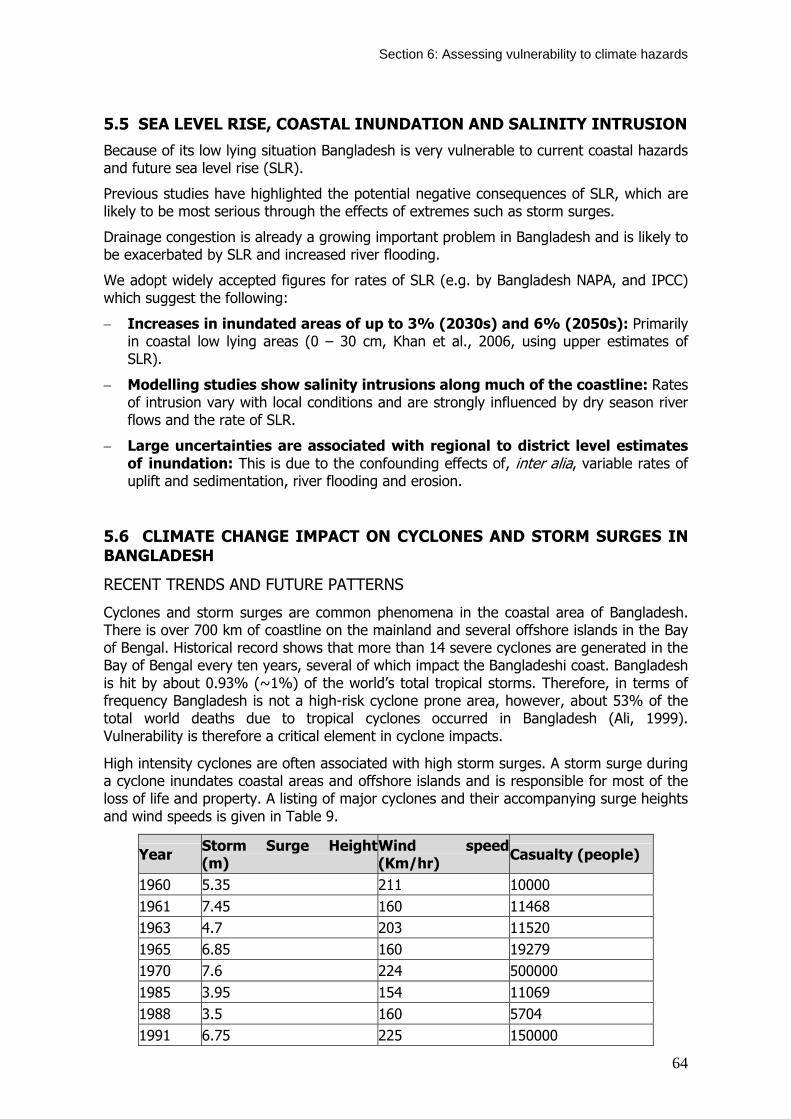
Section 6: Assessing vulnerability to climate hazards
64
5.5 SEA LEVEL RISE, COASTAL INUNDATION AND SALINITY INTRUSION
Because of its low lying situation Bangladesh is very vulnerable to current coastal hazards and future sea level rise (SLR).
Previous studies have highlighted the potential negative consequences of SLR, which are likely to be most serious through the effects of extremes such as storm surges.
Drainage congestion is already a growing important problem in Bangladesh and is likely to be exacerbated by SLR and increased river flooding.
We adopt widely accepted figures for rates of SLR (e.g. by Bangladesh NAPA, and IPCC) which suggest the following:
− Increases in inundated areas of up to 3% (2030s) and 6% (2050s): Primarily in coastal low lying areas (0 – 30 cm, Khan et al., 2006, using upper estimates of SLR).
− Modelling studies show salinity intrusions along much of the coastline: Rates of intrusion vary with local conditions and are strongly influenced by dry season river flows and the rate of SLR.
− Large uncertainties are associated with regional to district level estimates of inundation: This is due to the confounding effects of, inter alia, variable rates of uplift and sedimentation, river flooding and erosion.
5.6 CLIMATE CHANGE IMPACT ON CYCLONES AND STORM SURGES IN BANGLADESH
RECENT TRENDS AND FUTURE PATTERNS
Cyclones and storm surges are common phenomena in the coastal area of Bangladesh. There is over 700 km of coastline on the mainland and several offshore islands in the Bay of Bengal. Historical record shows that more than 14 severe cyclones are generated in the Bay of Bengal every ten years, several of which impact the Bangladeshi coast. Bangladesh is hit by about 0.93% (~1%) of the world’s total tropical storms. Therefore, in terms of frequency Bangladesh is not a high-risk cyclone prone area, however, about 53% of the total world deaths due to tropical cyclones occurred in Bangladesh (Ali, 1999). Vulnerability is therefore a critical element in cyclone impacts.
High intensity cyclones are often associated with high storm surges. A storm surge during a cyclone inundates coastal areas and offshore islands and is responsible for most of the loss of life and property. A listing of major cyclones and their accompanying surge heights and wind speeds is given in Table 9.
Year Storm Surge Height(m)
Wind speed (Km/hr) Casualty (people)
1960 5.35 211 10000 1961 7.45 160 11468 1963 4.7 203 11520 1965 6.85 160 19279 1970 7.6 224 500000 1985 3.95 154 11069 1988 3.5 160 5704 1991 6.75 225 150000

Section 6: Assessing vulnerability to climate hazards
65
Table 9: Observed wind speed and storm surge heights during major cyclones.
A cyclone in 1970 resulted in close to 300,000 deaths, and another in 1991 (7.6 m storm surge height) led to the loss of 138,000 lives (World Bank 2000). According to previous records a cyclone in 1991 had the highest-pressure fall of 74mb and the strongest wind speed of 225km/hr. Between 1881 and 2001, decadal frequency cyclone shows that 3 to 7 cyclones hit the coastal area of Bangladesh. During this period there has been about an 8% increase in the frequency of devastating cyclones.
COASTAL DEFENCES
From the 1960s, about 145 polders (area enclosed by embankment) requiring more than 500 km of embankment, were constructed to protect coastal low lying areas from salinization and coastal flooding from regular tides. The coastal defenses were constructed to increase agricultural production in the polder areas without consideration of safety against cyclonic storm surge. Within the last four decades around 800,000 lives have been lost to cyclones by overtopping or breaching of coastal embankments. For safety of the coastal population in the high risk areas (HRA), the Government of Bangladesh constructed about 1600 cyclone shelters in HRA but it is estimated that more than 1500 new shelters are needed to meet the current demands (CEGIS, 2001).
CYCLONES AND CLIMATE CHANGE
Atmospheric Scientist Kerry Emanuel has proposed that hurricanes have grown more intense over the past thirty years, most likely because of increasing sea surface temperatures (SSTs). About 365 cyclones formed and died in the Bay of Bengal without hitting any littoral countries between 1877 and 1995. The frequency of tropical cyclones originating in the Bay of Bengal has decreased since roughly 1970 but damage caused by intense cyclones has risen significantly (Lal, 2001).
According to IPCC (2001) there is some evidence that regional frequencies of tropical cyclones may change but none that their location will change. There is also evidence that peak intensity may increase by 5% to 10% which would contribute to enhanced storm surges and coastal flooding. Amplification of storm surge heights will result from stronger winds with increasing in SSTs and lower pressure resulting in an enhanced risk of coastal disasters.
ESTIMATING THE POTENTIAL IMPACTS OF CHANGES IN CYCLONE CONDITIONS
Ali (1996) developed a model for the Bay of Bengal, to estimate tropical cyclone intensity (wind velocity and storm surge) for 20C and 40C rise in SST and estimated the effect of sea level rise (0.3 m and 1.0 m) on surge height. Ali also calculated the effect of a repeat of the 1991 cyclone with an increase of 20C and 40C and found the wind velocity would increase 10% and 21%, respectively. Storm surge height increased with wind speed by about 21% and 49%, respectively. With no change in SST Ali (1996) obtained a reduction in surge height of -3% and -7% with increasing SLR 0.3 m and 1.0 m, respectively (Table 10), due to the moderating effects of deeper water on storm surge height.
Temperature Present 270C 20C SST 40C SST rise Wind speed (km/h) 225 248 275 Storm surge heights in m (% changes w.r.t 7.6 m surge) SLR = 0 m 7.6 (0%) 9.2 (21%) 11.3 (49%) SLR = 0.3 m 7.4 (-3%) 9.1 (20%) 11.1(46%) SLR = 1 m 7.1 (-.7%) 8.6 (13%) 10.6 (40%)

Section 6: Assessing vulnerability to climate hazards
66
Table 10: Storm surge under different SST and sea level rise conditions (Ali, 1996).
Using assumptions from Ali’s (1996) results, potential wind speed and storm surge height in the year 2020 and 2050 is calculated for four different scenarios. Sea level rise and temperature increase are considered. We use simplified proxy relationships based on the Ali’s results to compute wind velocity and surge heights as follows:
Wind Velocity, V (km/hr) = Vr (1+ 0.0547 ∆T) -------------------------- (1)
Surge Height, h (m) = 0.55 + 0.00055 V1.77 ---------------------------- (2)
Corrected Surge Height with SLR, hc (m) = h (1 + 7.247 ∆SL) --------- (3)
Where, Vr = Reference Wind Velocity (assumed 225 km/hr – 1991 cyclone)
∆T = Change in temperature as per scenarios for the 2020s and 2050s
∆SL = Change in SLR in meters for the 2020s and 2050s
We assume a 10cm SLR for 2020s and 32cm for the 2050s (as detailed in Output report 1bi).
Storm surge movement over the costal land areas is extremely complex. The maximum travel distance of surges over the land depends mainly on surge height at the sea coast, water velocity and wave velocity of the approaching surge wave, tidal condition, configuration of coast line, slope of the beach, etc. Complicated models are required to simulate storm surge in detail.
An approximate solution for the maximum travel distance of a long solitary wave over dry bed in a purely one dimensional flow domain is investigated here. Freeman and LeMchcute (1994) showed that the shape of the leading edge of the wave over a dry land is in the form of a parabola. In the case of a solitary long wave propagating over still water, the maximum water velocity is approximately equal to the wave height multiplied by wave velocity divided by the water depth. This approximation is applied to the Freeman and LeMchcute’s solution and the equation become:
Intrusion Length, x (km) = 4 (4 + 1.5 hc)2 R / 3 (4 +hc)(Sb + f /8) ----------------- (4)
Where, hc = corrected surge height
Sb = Land slope (for Bangladesh coast from 0.001 to 0.01)
f = Surface friction (for Bangladesh coast from 0.1 to 0.01)
The value of x varies with values of Sb, f and h along the coast.
Five zones were defined by the Multipurpose Cyclone Shelter Programme (BUET, 1993) and the resistance factor, bed slope and constants are shown in Table 11. Teknaf-Cox’s Bazar coast, Cox’s bazar-Chittagong coast, Noakhali coast, the east coast of Bhola, the sea coast from Galachipa to the border with India, and off-shore islands are the areas exposed to the sea in the Bay of Bengal, subject to storm surge flooding.
Z1 Z2 Z3 Z4 Z5
R 0.00175 0.00175 0.00175 0.002 0.0021
F 0.02 0.015 0.01 0.0125 0.01
Sb 0.01 0.005 0.001 0.0001 0.0001
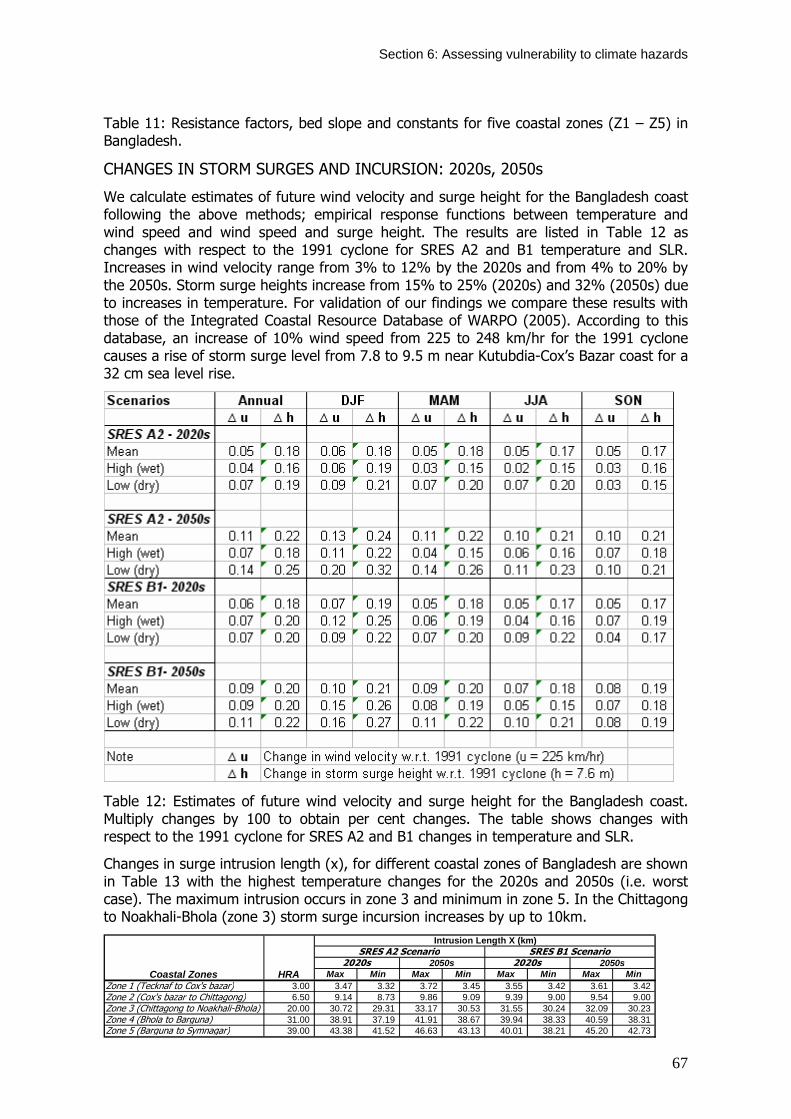
Section 6: Assessing vulnerability to climate hazards
67
Table 11: Resistance factors, bed slope and constants for five coastal zones (Z1 – Z5) in Bangladesh.
CHANGES IN STORM SURGES AND INCURSION: 2020s, 2050s
We calculate estimates of future wind velocity and surge height for the Bangladesh coast following the above methods; empirical response functions between temperature and wind speed and wind speed and surge height. The results are listed in Table 12 as changes with respect to the 1991 cyclone for SRES A2 and B1 temperature and SLR. Increases in wind velocity range from 3% to 12% by the 2020s and from 4% to 20% by the 2050s. Storm surge heights increase from 15% to 25% (2020s) and 32% (2050s) due to increases in temperature. For validation of our findings we compare these results with those of the Integrated Coastal Resource Database of WARPO (2005). According to this database, an increase of 10% wind speed from 225 to 248 km/hr for the 1991 cyclone causes a rise of storm surge level from 7.8 to 9.5 m near Kutubdia-Cox’s Bazar coast for a 32 cm sea level rise.
Table 12: Estimates of future wind velocity and surge height for the Bangladesh coast. Multiply changes by 100 to obtain per cent changes. The table shows changes with respect to the 1991 cyclone for SRES A2 and B1 changes in temperature and SLR.
Changes in surge intrusion length (x), for different coastal zones of Bangladesh are shown in Table 13 with the highest temperature changes for the 2020s and 2050s (i.e. worst case). The maximum intrusion occurs in zone 3 and minimum in zone 5. In the Chittagong to Noakhali-Bhola (zone 3) storm surge incursion increases by up to 10km.
Max Min Max Min Max Min Max MinZone 1 (Tecknaf to Cox's bazar) 3.00 3.47 3.32 3.72 3.45 3.55 3.42 3.61 3.42 Zone 2 (Cox's bazar to Chittagong) 6.50 9.14 8.73 9.86 9.09 9.39 9.00 9.54 9.00 Zone 3 (Chittagong to Noakhali-Bhola) 20.00 30.72 29.31 33.17 30.53 31.55 30.24 32.09 30.23 Zone 4 (Bhola to Barguna) 31.00 38.91 37.19 41.91 38.67 39.94 38.33 40.59 38.31 Zone 5 (Barguna to Symnagar) 39.00 43.38 41.52 46.63 43.13 40.01 38.21 45.20 42.73
Coastal Zones HRA2020s 2050s 2020s 2050s
SRES A2 Scenario SRES B1 ScenarioIntrusion Length X (km)

Section 6: Assessing vulnerability to climate hazards
68
Table 13: The storm surge intrusion length (x in km), for different coastal zones of Bangladesh for Max. and Min. SRES A2 and B1 for 2020s and 2050s.
Figure 14 shows the existing cyclone HRA moves further inland with the distance varying between zones according to their physical characteristics. Increases in the wind velocity and storm surge height result in greater inland intrusion and an increase in the area exposed to cyclone hazard. The HRA increase to 35% and 40% in the 2020s and 2050s, respectively (Table 12). The total coastal area is about 39 400 km2 and population density is 930 person/km2. Currently about 8.3 million people live in the HRAs (CEGIS, 2004) and, based on our results and projections of future population density (WARPO, 2005), this increases to 14.6 million in the 2020s and 20.3 million in the 2050s.
Figure 14: Changes in cyclone High Risk Areas for current conditions, the 2020s and the 2050s. Only worst case examples included – highest warming.
Max Min Max Min Max Min Max MinZone 1 (Tecknaf to Cox's bazar) 2,031 2,349 2,250 2,519 2,335 2,407 2,315 2,444 2,314 Zone 2 (Cox's bazar to Chittagong) 3,722 5,235 4,999 5,646 5,203 5,376 5,155 5,465 5,153 Zone 3 (Chittagong to Noakhali-Bhola) 1,472 2,261 2,157 2,441 2,247 2,322 2,226 2,362 2,225 Zone 4 (Bhola to Barguna) 500 628 600 676 624 644 618 655 618 Zone 5 (Barguna to Symnagar) 1,178 1,310 1,254 1,408 1,303 1,208 1,184 1,365 1,291 Total 8,903 11,783 11,260 12,690 11,712 11,957 11,498 12,291 11,601 Change in percentage 32% 26% 43% 32% 34% 29% 38% 30%Population Density ('000/sq km) 0.93 1.22 1.22 1.63 1.63 1.22 1.22 1.63 1.63
Population Exposed (million) 8.3 14.00 13.00 20.00 19.00 14.00 13.00 20.00 18.00
Existing
High Risk Area (Sq Km)
Note: The population in the coast area (39,436 sq km) 36.83 million, 47.92 million and 64.35 million in the year 2001, 2020 and 2050 respective, as estimated by ICZMP/WARPO ( 2005).
SRES A2 Scenario SRES B1 Scenario2020s 2050s 2020s 2050s
Coastal Zones
Table 14: Changes in population exposed to cyclone HRA for different coastal zones of Bangladesh for Max. and Min. SRES A2 and B1 for 2020s and 2050s.

Section 6: Assessing vulnerability to climate hazards
69
5.7 THE IMPACT OF FLOODING ON AGRICULTURAL YIELDS
FLOODING AND AGRICULTURE IN BANGLADESH
Large areas of Bangladesh are normally flooded every year and form an important part of many people’s livelihood strategies. Statistical analysis of flood affected areas conducted by JICA (2003) shows about 20% of the country is inundated with a 2 year recurrence interval. Nineteen floods affecting an area of more than 30,000 km2 (20% of total land area) have occurred since 1954. The highest death toll was 2,379 people in 1988, followed by 1,987 people in 1974 and 1,657 people in 1987. The largest economic losses are estimated to be roughly 160,000 million Taka in 1998 and 100,000 million Taka in 1988. The total number of people affected in the 1998 flood was more than 30 million. The most affected were located in Dhaka District of Dhaka Division (3,038,867 persons, 35% of district population). The total number of recorded deaths was 918 people.
Total damaged crop area due to the 1998 flood was around 1.9 million ha. The largest area of crop damage was recorded in Comilla District of Chittagong Division (108,719 ha). The damage in monetary value of the 1998 flood has been estimated in several studies. However, all results excluded damage to human life, homestead, injuries, etc. Above normal floods clearly lead to major socio-economic disruption.
A summary of historical flood events and flood related damage during extreme hydrological years is shown in Table 15. The extent of historical flood events are shown in Figures 15 and 16. The damage units (US$) are converted to the reference year 2004. During recent years flood damage per unit area has increased substantially because of increases in exposure of human settlement, property value, etc.
Year
Flood affected area(sq.km)
Damage (Billion US$)
Damage (Billion US$) (Reference to Year 2004)
Damage per area (million US$/sq.km) (Reference to Year 2004)
1984 52520 0.378 0.79 0.02
1987 57300 1 2.05 0.04
1988 89970 1.2 2.43 0.03
1998 100250 2.8 3.85 0.04
2004 58000 6.6 6.60 0.11
Table 15: Extent of flood and flood related damage during extreme hydrological years. Source: K.U. Siddique and A.N.H. Akhtar Hossain, 2006. Exchange rate given on Economic Trends Tk./$ exchange rate for the year 2004-05 as on 10th May, 2005

Section 6: Assessing vulnerability to climate hazards
70
Impact of flood during different historical flood disasters
52520 57300
89970100250
58000
0.79
2.052.43
3.85
6.60
0
20000
40000
60000
80000
100000
120000
1984 1987 1988 1998 2004
Year
Floo
d af
fect
ed a
rea
(sq.
km)
0.00
1.00
2.00
3.00
4.00
5.00
6.00
7.00
Dam
age
(Billi
onU
S$)
Flood affected area Damage(Billion US$)
Figure 15: Historical flood event: spatial extent and damage.
Impact of flood
0.11
0.04
0.02
0.03 0.04
0.00
0.02
0.04
0.06
0.08
0.10
0.12
1984 1987 1988 1998 2004
Year
Dam
age
per a
rea
(mill
ion
US$
/sq.
km)
Figure 16: Historical flood event and damage in million US dollar per unit area of inundation. Source: K.U. Siddique and A.N.H. Akhtar Hossain, 2006. Exchange rate given on Economic Trends*Tk./$ exchange rate for the year 2004-05 as on 10th May, 2005.
ANALYSIS OF FLOODING AND AGRICULTURAL PRODUCTION
In this study flood effects on agriculture are analyzed with respect to river discharge. Three types of rice crop are considered, Aus, Aman and Boro. Two hydrological zones of Bangladesh are considered for data analysis: Bahadurabad station from north-east and
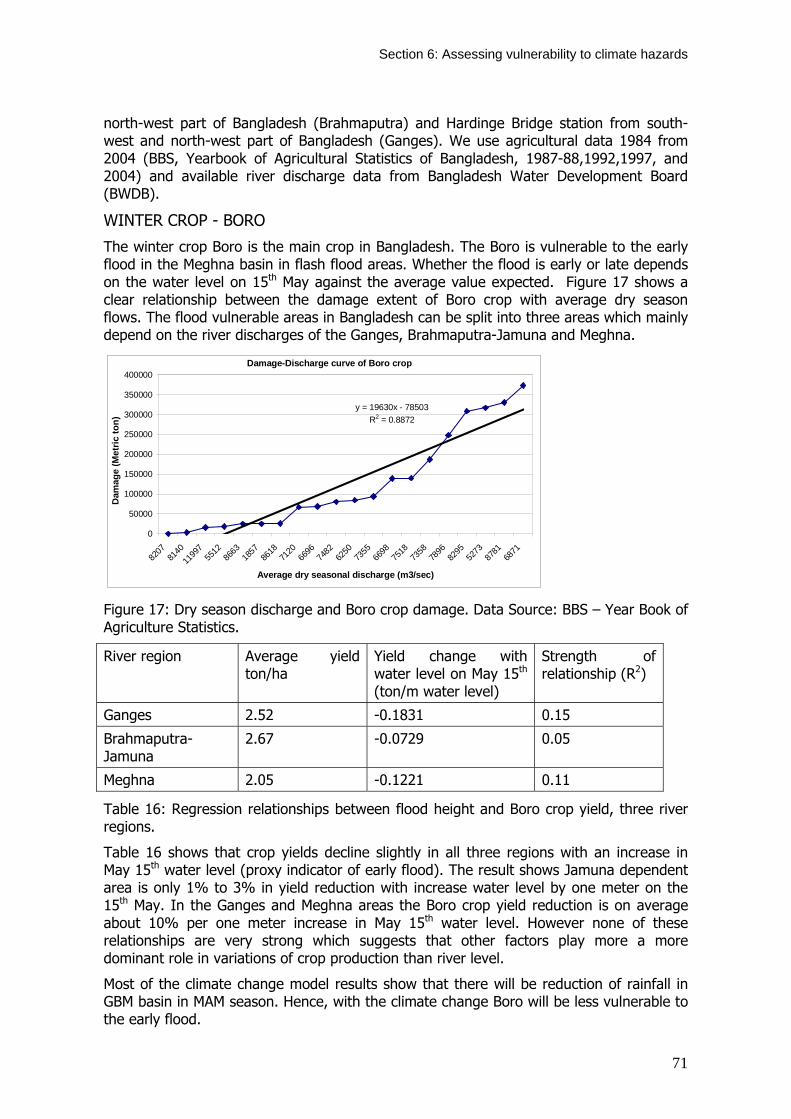
Section 6: Assessing vulnerability to climate hazards
71
north-west part of Bangladesh (Brahmaputra) and Hardinge Bridge station from south-west and north-west part of Bangladesh (Ganges). We use agricultural data 1984 from 2004 (BBS, Yearbook of Agricultural Statistics of Bangladesh, 1987-88,1992,1997, and 2004) and available river discharge data from Bangladesh Water Development Board (BWDB).
WINTER CROP - BORO
The winter crop Boro is the main crop in Bangladesh. The Boro is vulnerable to the early flood in the Meghna basin in flash flood areas. Whether the flood is early or late depends on the water level on 15th May against the average value expected. Figure 17 shows a clear relationship between the damage extent of Boro crop with average dry season flows. The flood vulnerable areas in Bangladesh can be split into three areas which mainly depend on the river discharges of the Ganges, Brahmaputra-Jamuna and Meghna.
Damage-Discharge curve of Boro crop
y = 19630x - 78503R2 = 0.8872
0
50000
100000
150000
200000
250000
300000
350000
400000
8207
8140
1199
755
1286
6318
5786
1871
2066
9674
8262
5073
5566
9875
1873
5878
9682
9552
7387
8168
71
Average dry seasonal discharge (m3/sec)
Dam
age
(Met
ric to
n)
Figure 17: Dry season discharge and Boro crop damage. Data Source: BBS – Year Book of Agriculture Statistics.
River region Average yield ton/ha
Yield change with water level on May 15th
(ton/m water level)
Strength of relationship (R2)
Ganges 2.52 -0.1831 0.15
Brahmaputra-Jamuna
2.67 -0.0729 0.05
Meghna 2.05 -0.1221 0.11
Table 16: Regression relationships between flood height and Boro crop yield, three river regions.
Table 16 shows that crop yields decline slightly in all three regions with an increase in May 15th water level (proxy indicator of early flood). The result shows Jamuna dependent area is only 1% to 3% in yield reduction with increase water level by one meter on the 15th May. In the Ganges and Meghna areas the Boro crop yield reduction is on average about 10% per one meter increase in May 15th water level. However none of these relationships are very strong which suggests that other factors play more a more dominant role in variations of crop production than river level.
Most of the climate change model results show that there will be reduction of rainfall in GBM basin in MAM season. Hence, with the climate change Boro will be less vulnerable to the early flood.

Section 6: Assessing vulnerability to climate hazards
72
MONSOON RICE - AMAN
Aman is the main rice crop in the monsoon season in Bangladesh. The last sowing period of T. Aman is 15th September, after that crop yield is likely to be substantially reduced. Hence the water level on 15th September is generally considered an important indicator of yield loss in the Aman crop, as shown by the strong non-linear relationship between Aman crop yields and peak discharge (Figure 18).
Damage-Discharge curve of Aman crop
0
500000
1000000
1500000
2000000
2500000
1177
0086
800
1369
26
1117
00
1140
0098
051
1030
00
1175
00
1048
00
1162
00
1218
48
1310
00
1418
00
1488
00
Peak discharge (m3/sec)
Dam
age
(Met
ric to
n)
Figure 18: Peak discharge and Aman crop damage. Data Source: BBS – Year Book of Agriculture Statistics.
River region Average yield ton/ha
Yield change with water level on September 15th (ton/m water level)
Strength of relationship (R2)
Ganges 1.36 -0.0156 0.00
Brahmaputra-Jamuna
1.52 -0.0493 0.02
Meghna 1.38 -0.0284 0.02
Table 17: Regression relationships between flood height and Aman crop yield, three river regions.
Table 17 shows that crop yields decline slightly in all three regions with an increase in peak discharge. The Ganges and Meghna dependent areas only display a 1% to 3% yield reduction per one meter increase in September 15th water level. The Jamuna dependent area is more sensitive and reduces by 5-7%. As for the Boro crop none of the relationships are very strong and possess little predictive power.
The climate change model results show that there will be an increase in precipitation in the GBM basins during SON as well as JJA seasons. Hence, with the climate change the Aman will be more vulnerable due to higher discharge.

Section 6: Assessing vulnerability to climate hazards
73
CONCLUSIONS ON FLOODING AND CROP PRODUCTION
There is a clear and well known relationship between total damages and flood magnitude in Bangladesh. Statistics on crop damage at the national level also indicate a strong non-linear relationship with peak river discharges. However, our preliminary analysis at sub-national scale (disaggregated to three river areas) shows only weak relationships exist between agricultural yields (Boro, Aman and Aus crops) and river levels at key dates in the crop calendar. The relationships are all slightly negative but plots (not shown here) show that in general yields per hectare are fairly stable from year to year – a better index for this type of analysis might be to use total output.
The strong relationship between total damages and flood magnitude at the national level with Boro, Aman and Aus crops could be used to infer future damages due to changes in river levels if they can be calculated from changes in peak discharge.
5.8 IMPACTS OF DROUGHT ON CROP PRODUCTION
DROUGHT AND AGRICULTURE IN BANGLADESH Drought risk is based on a combination of the frequency, severity, and spatial extent of drought (the physical nature of drought) and the degree to which a population or activity is vulnerable to the effects of drought. In Bangladesh, about 2.7 million ha are vulnerable to annual drought; there is about a 10% probability that 41-50% of the country experiences drought in a given year (GOB, 1989). Every year Bangladesh experiences a dry period for seven months, from November to May, when rainfall is normally low.
Drought causes severe stress to both crops and fruit trees particularly in areas where water cannot be pumped from the shallow aquifer due to drawdown or increased salinity. However, the progressive development of groundwater for both water supplies and agriculture has meant that dry season water availability is not the major threat that it used to be. Indeed, dry season agriculture has been the main source of increased food production over the past 20 yeasr (BBS: 1998). Two seasons cover the annual cycle; Rabi and Kharif. Rabi falls in the winter/dry season and Kharif in the wet season. Drought affects all the Rabi crops, such as HYV Boro, Aus, wheat, pulses and potatoes especially where irrigation possibilities are limited. It also affects sugarcane production. Kharif droughts in the period June/July to October/November, created by sub-humid and dry conditions in the highland and medium highland areas of the country (in addition to the west/northwest and the Madhupur tract is drought prone). Shortage of rainfall affects the critical reproductive stages of transplanted Aman crops in December, reducing its yield, particularly in those areas with low soil moisture holding capacity. The BARC produce drought, stress or deficit in soil moisture results in yield loss, maps for Rabi, Pre-Kharif and Kharif seasons. The drought severity classes defined in the maps are slight, moderate, severe and very severe, related to yield losses of 15-20%, 20-35%, 35-45%, and 45-70%, respectively for different crops (Hussain, 2006). Areas of Bangladesh affected by drought in the different crop seasons are given in Table 18 (in million ha). About 18% Rabi and 9% Kharif crops are highly vulnerable to the Drought and it will be more with the climate change. Karim et al. (1998) found that under moderate climate change scenario, Aus production would decline by 27% while wheat production would be reduced to 61 percent while the yield of Boro might reduce by 55-62%.
Drought class Rabi Pre-Kharif Kharif

Section 6: Assessing vulnerability to climate hazards
74
Very severe 0.446 0.403 0.344
Severe 1.71 1.15 0.74
Moderate 2.95 4.76 3.17
Slight 4.21 4.09 2.90
No Drought 3.17 2.09 0.68
Non-T. Aman 4.71
Source: National Action Programme (NAP) for Combating Desertification in Bangladesh Department of Environment, Ministry of Environment and Forest and IUCN – The World Conservation Union Table 18: Summary of drought severity areas in Bangladesh by crop season (in M ha).
FUTURE CLIMATE CHANGE AND DROUGHT/SOIL MOISTURE DEFICIT This study considered two seasons cover the annual cycle is Rabi season and Kharif season. Two emission scenarios of IPCC SRES A2 and B1 were considered for the 2020s and 2050s. The projected average change in temperature for the winter and monsoon period are shown in following table 19.
Period A2 Average ∆T B1 – Average ∆T Average ∆T
Winter (DJF)
2020s 1.03 1.23 1.13
2050s 2.39 1.90 2.15
Monsoon (JJA)
2020s 0.91 0.90 0.90
2050s 1.71 1.37 1.56
Table 19: Change in temperature (IPCC SRES A2 and B1 average scenario) in winter (DJF) and monsoon (JJA). The drought analysis for Rabi season considers the temperature, while the Kharif season considers both rainfall and temperature. For the Kharif season 12% and 27% increase in monsoon precipitation for the periods 2020s and 2050s, respectively. To present the results the country is divided into five zones and these zones/divisions are given below and shown in figure 18:
Sl No. Name of Zones Division and greater areas included
1 Northwestern Rajshahi and greater Rangpur
2 Northeastern Sylhet
3 Northcentral Dhaka and greater Mymenshingh
4 Southwestern Khulna and parts of Barisal
5 Southeastern Chittagong and parts of Barisal

Section 6: Assessing vulnerability to climate hazards
75
Figure 18: Existing, year 2030 (1 degree rise) and year 2075 (2 degree rise) Droughts in Rabi and Kharif Crop Season discharge and Boro crop damage.
5.9 THE EFFECTS OF EL NINO-SOUTHERN OSCILLATION (ENSO) EVENTS IN BANGLADESH
The El Niño-Southern Oscillation refers to the coherent and sometimes very strong year to year variations in the SST, convective rainfall, surface air pressure, and atmospheric circulation that occur across the equatorial Pacific Ocean. El Niño and La Nina represent opposite extremes in the ENSO cycle. The Japan Meteorological Association (JMA) defined El Niño years as; 1958, 1965, 1966, 1969, 1972, 1982, 1986, 1987, 1990, 1991, 1992, 1993, 1994, 1997, 2001, 2002, and 2003. They defined La Nina years as 1956, 1964, 1970, 1971, 1974, 1975, 1976, 1984, 1985, 1988, 1989, 1998, 1999 and 2000. Chowdhury (2003) focused on the relationships between SOI and rainfall in Bangladesh. In general there is a deficiency in rainfall during El Niño years in all seasons. Ahmad et al. (1996) identified low rainfall tendency in most El Niño years in two stations in southwest Bangladesh. Using an empirical Bayesian forecast system Webster et al. (2004) have been able to show substantial forecasting skill in the 20-30 day range flow forecasts of the Ganges and Jamuna rivers and mention the significance of ENSO in this process.
ENSO AND JAMUNA RIVER DISCHARGES Nasreen Jahan (2005) investigated the influence of ENSO on the Jamuna river flow in the monsoon. Figure 19 shows the cumulative frequency of the standardized annual flow in the Jamuna for all years, El Niño and La Nina years during 1956-2003. For the annual Jamuna flow series the probability of exceeding the long term average annual flow is
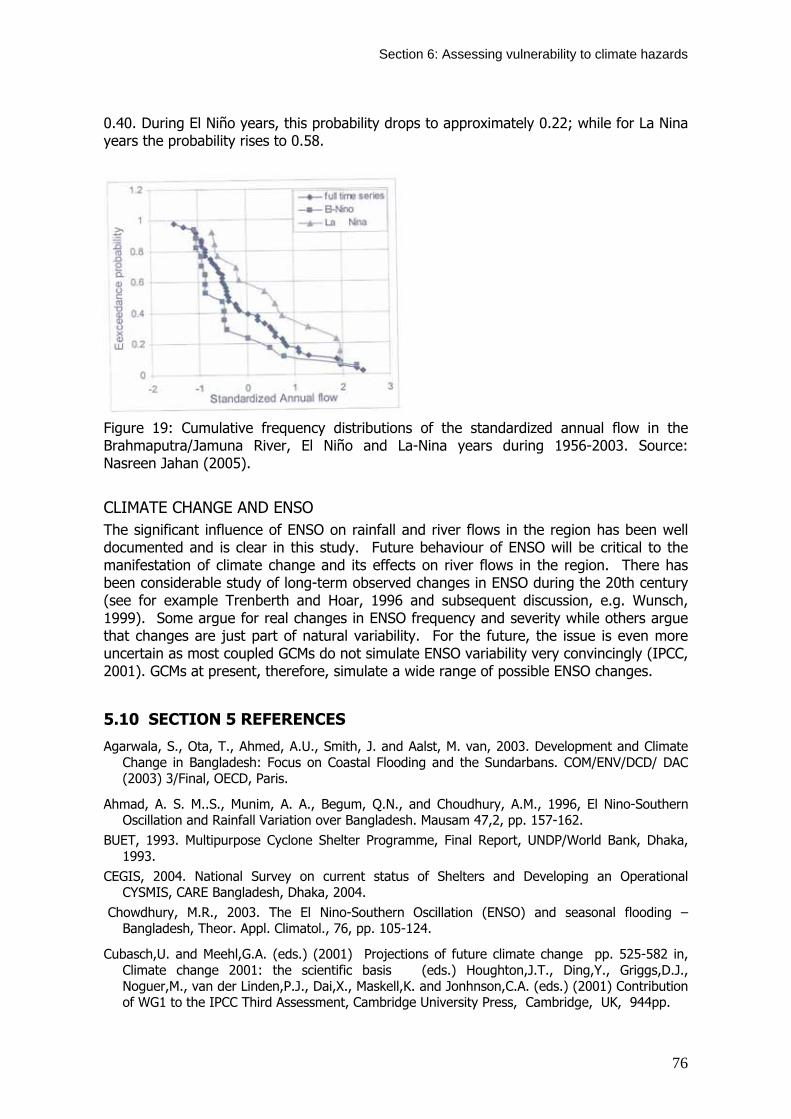
Section 6: Assessing vulnerability to climate hazards
76
0.40. During El Niño years, this probability drops to approximately 0.22; while for La Nina years the probability rises to 0.58.
Figure 19: Cumulative frequency distributions of the standardized annual flow in the Brahmaputra/Jamuna River, El Niño and La-Nina years during 1956-2003. Source: Nasreen Jahan (2005).
CLIMATE CHANGE AND ENSO The significant influence of ENSO on rainfall and river flows in the region has been well documented and is clear in this study. Future behaviour of ENSO will be critical to the manifestation of climate change and its effects on river flows in the region. There has been considerable study of long-term observed changes in ENSO during the 20th century (see for example Trenberth and Hoar, 1996 and subsequent discussion, e.g. Wunsch, 1999). Some argue for real changes in ENSO frequency and severity while others argue that changes are just part of natural variability. For the future, the issue is even more uncertain as most coupled GCMs do not simulate ENSO variability very convincingly (IPCC, 2001). GCMs at present, therefore, simulate a wide range of possible ENSO changes.
5.10 SECTION 5 REFERENCES
Agarwala, S., Ota, T., Ahmed, A.U., Smith, J. and Aalst, M. van, 2003. Development and Climate Change in Bangladesh: Focus on Coastal Flooding and the Sundarbans. COM/ENV/DCD/ DAC (2003) 3/Final, OECD, Paris.
Ahmad, A. S. M..S., Munim, A. A., Begum, Q.N., and Choudhury, A.M., 1996, El Nino-Southern Oscillation and Rainfall Variation over Bangladesh. Mausam 47,2, pp. 157-162.
BUET, 1993. Multipurpose Cyclone Shelter Programme, Final Report, UNDP/World Bank, Dhaka, 1993.
CEGIS, 2004. National Survey on current status of Shelters and Developing an Operational CYSMIS, CARE Bangladesh, Dhaka, 2004.
Chowdhury, M.R., 2003. The El Nino-Southern Oscillation (ENSO) and seasonal flooding – Bangladesh, Theor. Appl. Climatol., 76, pp. 105-124.
Cubasch,U. and Meehl,G.A. (eds.) (2001) Projections of future climate change pp. 525-582 in, Climate change 2001: the scientific basis (eds.) Houghton,J.T., Ding,Y., Griggs,D.J., Noguer,M., van der Linden,P.J., Dai,X., Maskell,K. and Jonhnson,C.A. (eds.) (2001) Contribution of WG1 to the IPCC Third Assessment, Cambridge University Press, Cambridge, UK, 944pp.

Section 6: Assessing vulnerability to climate hazards
77
Hussain, S. G., 2006. Agriculture Water Demand and Drought Modeling, Proceedings - Workshop on Climate Change Impact Modeling, Climate Change Cell, Department of Environment, Govt. of the people’s republic of Bangadesh, Dhaka, 2006.
IPCC (2001) Climate change 2001: the scientific basis. Contribution of Working Group I to The Third Assessment Report of the IPCC. Cambridge University Press, Cambridge.
Jahan N/, 2005. El Nino-Southern Oscillation: Links and Potential for Long Range Flood Forecasting in the Jamuna and the Surma Rivers.
Knutson, T. R and Tuleya, R. E., 2004. Impact of CO2 – Induced Warming on Simulation Hurricane Intensity and Precipitation: Sensitivity to the Choice of Climate Model and Convective Parameterization. J. Climate, vol. 17, No. 18, 3477-3495.
Lal, M, 2001: Tropical Cyclones in a wormer World, Current Science, Vol 80(9), 1103-1104
Master Plan Organization (MPO), 1986. National Water Plan. Volume 1: Sector Analysis, MPO, Dhaka.
Mirza, M. M. Q., Warrick, R. A., and Ericksen, N.J., 2003. The Implication of Climate Changes on Floods of the Ganges, Brahmaputra and Meghna Rivers in Bangladesh, Climate Change 57: 287-318, 2003, Kluwer Academic Publishers, Printed in the Netherlands
Mitchell, T. D., Hulme, M., and New, M., 2002: Climate data for political areas. Area 34:109-112. [http://www.cru.uea.ac.uk/~timm/climate/scatter/TYN_CY_2_0.html]
Nakicenovic, N. et al. (2000). Special Report on Emissions Scenarios: A Special Report of Working Group III of the Intergovernmental Panel on Climate Change, Cambridge University Press, Cambridge, U.K., 599 pp. [http://ipcc-ddc.cru.uea.ac.uk/sres/scatter_plots/scatterplots_home.html]
Ruosteenoja, K., T.R. Carter, K. Jylhä and H. Tuomenvirta, 2003: Future climate in world regions: an intercomparison of model-based projections for the new IPCC emissions scenarios. The Finnish Environment 644, Finnish Environment Institute, 83pp.
Trenberth, K.E. and Hoar, T.J. (1996) The 1990-1995 El Niño-Southern Oscillation event: longest on record. Geophys. Res. Lett. 23, 57-60.
WARPO, 2005. Impact assessment of climate changes on the coastal zone of Bangladesh, Integrated Coastal Resources Database, ICZMP, Water Resources Planning Organization (WARPO), Dhaka, 2005.
Webster, P.J. and Hoyos, C., 2004. Prediction of monsoon rainfall and river discharge on 15-30 day time scales, Bulletin of American Meteorological Society, 85(11), pp 1745-1765.
Wunsch, C. (1999) The interpretation of short climate records, with comments on the North Atlantic and Southern Oscillations. Bull. Am. Met. Soc. 80, 245-255

Section 6: Cost benefit analysis of adaptation options
78
Section 6: Economic and Cost Benefit Analysis of Adaptation
This section is authored by Nabiul Islam1 and Reinhard Mechler2 1 Bangladesh Institute of Development Studies (BIDS), Dhaka 2 International Institute of Applied Systems Analysis, Vienna
6.1 EXECUTIVE SUMMARY
This chapter discusses the appraisal of economic efficiency of selected adaptation options to extreme climate-related event risks of the DFID development assistance portfolio in Bangladesh via Cost-Benefit Analysis (CBA). The methodology developed was tested as a pilot study for selected intervention options within the DFID Bangladesh portfolio as part of the ORCHID project and should be understood as an exploration of the potential to conduct such analyses with available data and modelling techniques. Such an approach may inform the prioritization and implementation of efficient disaster risk management and climate adaptation (“no-regret”) options that help with coping with current and future extreme events as possibly increased in intensity and/or frequency by climate change.
Economic risk and the economic efficiency of selected adaptation options of the DFID development assistance portfolio in Bangladesh is estimated by means of Cost-Benefit Analysis (CBA) accounting for uncertainty and dynamic driving forces of hazards, vulnerability and exposure. A key concept employed in this analysis is the probabilistic representation of costs and benefits of risk reduction through the use of loss-frequency functions.
Although, for the Bangladesh case the data situation is good as concerns data on disaster impacts and risk, estimating extreme event risk and the benefits of risk reduction is fraught with substantial uncertainty, particularly so in this case, as disasters by definition are low-frequency, high consequence events. Uncertainties are among others associated with estimates of hazard and changes thereof, for example due to climate change, exposure of assets and people, fragility (the degree of damage for a given level of hazard intensity), the benefits of risk reduction, the proper choice of the discount rate and different cost concepts used for valuing impacts. In this assessment, due to data limitations and the scope of the study, it was not possible to conduct a quantitative uncertainty analysis (for example using confidence intervals); rather, sensitivity analysis was used to vary costs and benefits of options as well as the discount rate. The sensitivity of results to assumptions of those parameters and variables (as often in CBAs) was found to be considerable.
In order to set the stage for the CBA analysis and specific adaptation options, aggregate risk of flooding for economic asset risk for all of Bangladesh for now, in 2020 and 2050 under possible climate change is conducted. Economic assets losses today are estimated to amount to 0.6% when measured as a ratio of GDP, with a 50 year event (an event with an annual recurrency probability of 2%) possibly consuming about 5.8% of GDP. In the future, based on estimations of increasing frequency of flooding in Bangladesh due to climate change these losses may increase or decrease depending on the amount of adaptation assumed. If no adaptation is assumed (as is standardly done in similar assessments in the literature), annual average losses could increase to 0.7% and 0.75% of GDP in 2020 and 2050 (50 year events: 7.0 and 7.3% GDP). If significant adaptation as in the past, when, for example, loss of life per event in Bangladesh was reduced by two orders of magnitude over a 30 year period, is assumed, annual losses would decrease to 0.5

Section 6: Cost benefit analysis of adaptation options
79
and 0.2% of GDP for 2020 and 2050 (50 year events: 4.6 and 1.9%). Uncertainty around these estimates and the assumptions utilized, while hard to quantify, is considerable and should be kept in mind. Accordingly, numbers should be understood in terms of orders of magnitude.
No further adaptation assumed
0.0%
2.0%
4.0%
6.0%
8.0%
10.0%
0.0% 10.0% 20.0% 30.0% 40.0% 50.0%
Exceedance probability
Asse
t los
s as
% G
DP
baseline 2020 2050
Significant adaptation as in past assumed
0.0%
2.0%
4.0%
6.0%
8.0%
10.0%
0.0% 10.0% 20.0% 30.0% 40.0% 50.0%
Exceedance probability
Asse
t los
s as
% G
DP
baseline 2020 adapt 2050 adapt
Figure: Asset losses for the baseline, 2020 and 2050 without and with significant adaptation assumed
These estimates indicate the importance of adaptation (and assumptions on it) for thinking about climate change and climate change policy. The representation of adaptation in this top-down assessment of necessity is broad-brushed, locale-unspecific and based on adaptation that occurred in the recent past. A key question for this assessment and the adaptation discussion in general (for example see Stern, 2007) is the scope for such adaptation and whether it will occur autonomously or in a planned manner. In order to shed more light on these crucial issues, CBAs for two specific ongoing and planned adaptation options within the DFID-Bangladesh portfolio are analyzed in a more risk-based, bottom-up approach.
One option considered is the flood-proofing of roads and highways by raising this infrastructure above the highest ever-recorded flood levels within the DFID-sponsored programme “Roads and Highways Policy Management, budgetary and TA Support” (RHD). Specifically, some 170 Km of national and regional roads and some 518 Km of district (feeder) roads in high risk areas will be raised by 1m. Further,

Section 6: Cost benefit analysis of adaptation options
80
about 124km of national and regional roads in low risk area will be raised by 0.5m. As the option comprises a long-term programme and since the costs would be very high if incurred at one time, it proposes action when a particular road is due for major maintenance or re-surfacing, with priority given to high risk areas.
In the CBA calculations, it is assumed that costs and benefits are evenly spread over time, i.e. every year a constant amount is spent for flood-proofing, resulting in a gradual building-up of flood protection. Benefits considered are the avoided costs of reconstructing lost infrastructural asset (direct losses). Although an option with national scope, specific fragility and risk functions are employed for estimating risk and risk reduced. Furthermore, increases in hazard frequency as determined in chapter 5 are studied and are taken to increase risk by 2.6% per annum.
Although very costly and an option with national coverage, the flood-proofing of RHD investments seems to be efficient given the assumptions taken. For such a best estimate case, a range in the benefit-cost ratio of 1.2-2.7 is calculated; thus, for this set of assumptions, the option would be (socially) beneficial. It would mostly still be larger than 1 with more pessimistic assumptions such as costs increasing by 50%. If however, under very pessimistic assumptions, costs are increased and benefits are supposed to be decreased by 50%, then for all discount rates considered the option would not be efficient anymore. This exemplifies the need for varying input parameters and studying the sensitivity of results given a lack of more comprehensive data.
The second option considered involves flood proofing individual homesteads against a maximum of 20 year floods on riverine islands, known as Chars. The option, which is already under implementation, is to construct earth platforms on beneficiaries land for the unit of a bari (homestead with 4 households). The riverine areas of Bangladesh are home to the poorest and most vulnerable communities in the country with over 80 percent living in extreme poverty. Inhabitants of these areas live under serious risk of frequent flooding. The option presented here considers raising the level of multiple areas, each large enough to accommodate four dwellings, a hand tube well and a toilet.
Such flood proofing reflects traditional practices in Bangladesh, including building houses on higher ground and the raising of public infrastructure such as roads, shared areas and water supply/sanitation facilities above experienced flood level. Not all households have the resources to do this, especially in the unprotected Char areas near the major river channels and donor support is required. The implementation involves paying for local labour to construct an earth platform for dwellings, buildings and the associated facilities on raised ground. The level to which the land is raised is currently based on the maximum observed flood levels (up to a 20-year flood), but the cost benefit analysis option analysed here also considers the effects of global sea level rise due to climate change.
This homestead raising option can be divided into two sub-options depending on whether or not the community will bear any costs associated with this. Under suboption A, the CLP project will raise one common platform for 4 dwellings, each with 150 M2 area and will reconstruct individual houses. Other infrastructure provision such as tube wells and sanitation will also be constructed by the project. Under suboption B, the project will only raise the common platform while the beneficiaries will reconstruct their individual houses, including making other infrastructure provision such as tube wells and sanitation. The analysis is carried out for both cases.
Similar results as for the RHD option are obtained with slightly higher B-C ratios. For the best estimate cases, suboptions A and B seem to be beneficial given the

Section 6: Cost benefit analysis of adaptation options
81
assumptions taken; option B scores higher, as costs for the project are reduced by residents helping out. If more pessimistic assumptions on costs and benefits are taken, the suboptions eventually become inefficient with rising discount rates.
6.2 CBA FOR CLIMATE AND DISASTER RISK
This chapter discusses the appraisal of economic efficiency of selected adaptation options to extreme climate-related event risks of the DFID development assistance portfolio in Bangladesh via Cost-Benefit Analysis (CBA). The methodology developed was tested as a pilot study for selected intervention options within the DFID Bangladesh portfolio as part of the ORCHID project. Such an approach may inform the prioritization and implementation of cost-effective disaster risk management and climate adaptation (“no-regret”) options that help with coping with current and future extreme events as possibly increased in intensity and/or frequency by climate change. The approach draws on prior work on CBA for disaster risk management (Mechler, 2005) and research on estimating flood risk and damage functions for Bangladesh (Islam, 2005, 2006).
6.2.1 Essentials of CBA
CBA is the main technique used by governments and public authorities for appraising public investment projects and policies. CBA has its origins in the rate-of return assessment/financial appraisal methods undertaken in business operations to assess whether investments are profitable or not. CBA takes a broader perspective and aims at estimating the overall “profit” for society. Generally, it is used to organise and present the costs and benefits, and inherent tradeoffs, and finally estimate the economic efficiency of projects.
There are several limitations to CBA that must be taken into account. One important issue is the lack of accounting for the distribution of benefits and costs in CBA.6 CBA takes an utilitarian approach holding that social welfare is derived at by aggregating individual welfare and changes therein due to projects and policies. A focus on maximizing welfare, rather than its distribution is a consequence (Dasgupta and Pearce, 1978).7 The CBA methodology adds together the monetized preferences of those who view themselves as “winners “with those that view themselves as “losers”, but actual compensation is not required. If preferences are measured through market prices or “willingness to pay”, it should be kept in mind that more weight is given to those with higher ability to pay. Moreover, CBA cannot resolve strong differences in value judgements that are often present in controversial projects (for example, nuclear power, bio-technology, river management, etc.).
6 The general principle underlying CBA is the Kaldor-Hicks-Criterion, which holds that those benefiting from a specific project or policy should potentially be able to compensate those that are disadvantaged by it (Dasgupta and Pearce, 1978). Whether compensation is actually done, however, is often not of importance. Also, methods to account for the distribution of costs and benefits have been proposed, but are not used in practice (Little and Mirrlees, 1990). 7 Also, no definite aggregation rule exists for aggregating individual preferences to a social welfare function. As Arrow (1963) has shown in the Impossibility theorem no such welfare function exists that allows the social ranking of alternative social states from individual preferences given that intuitively plausible criteria of social choice are satisfied. This is a serious restriction to CBA, as a main proposition contends that individual preferences should count in an assessment of social choice. The way out of this impasse usually taken is to introduce normative judgment by means of postulating a decisionmaker or observer that seeks to maximize social welfare. This can be the government, a project evaluator or a representative agent (see Dasgupta and Pearce, 1978).

Section 6: Cost benefit analysis of adaptation options
82
Another difficulty is the assessment of non-market values such as for health and the environment. Although methods exist, this often involves making difficult ethical decisions, particularly regarding the value of human life for which CBA should be used with caution. Another important issue is the question of discounting. Applying high discount rates expresses a strong preference for the present while potentially shifting large burdens to future generations. However, when keeping these limitations in mind, CBA can be a useful tool and its main strength is its explicit and rigorous accounting of those gains and losses that can be effectively monetized, and in so doing, making decisions more transparent. CBA provides a common yardstick with a money metric against which to measure projects (Kopp et al., 1997). CBA and economic efficiency considerations should not be sole criterion for evaluating policies and need to be integrated within a wider decision-making framework incorporating social, economic and cultural considerations.
While CBA’s main function is to inform the actual project appraisal stage, it is of importance for the other phases of a project cycle, specifically the project identification and specification stage (preproject appraisal stage), where it can help to preselect potential projects and reject others. Also, in the evaluation phase, CBA is regularly used for assessing if a project really has added value to society. Though there are different levels of detail and complexity to CBA, the general features and principles of CBA are listed in box 1.
Box 1: Main principles of CBA Revealed vs. expressed preferences: In the revealed preference-approach, available
market prices for goods (such as used for reconstructing a building) are used; in the expressed preference approach the value of a non-marketed good, such as the value of flood protection, is directly elicited.
With-and without-approach: CBA compares the situation with and without the project/investment, not the situation before and after.
Focus on selection of “best-option”: CBA is used to single out the best option rather than calculating the desirability to undertake a project per se.
Societal point of view: CBA takes a social welfare approach. The benefits to society have to outweigh the costs in order to make a project desirable. The question addressed is whether a specific project or policy adds value to all of society, not to a few individuals or business.
Clear define boundaries of analysis: Count only losses within the geographical boundaries in the specified community/area/region/country defined at the outset. Impacts or offsets outside these geographical boundaries should not be considered.
Application to Disaster Risk Management The main application of CBA in the context of disaster risk discussed here is using it for evaluating disaster risk management (DRM) projects. This application is extended in this analysis to climate change adaptation, which shares many of the characteristics of DRM (for example, see Sperling and Szekely, 2005). Key elements of the process are shown in figure 1.

Section 6: Cost benefit analysis of adaptation options
83
Fig. 1: Framework for estimating risk as a function of hazard and vulnerability
1. Risk analysis: risk in terms of potential impacts without risk management has to be estimated. This entails estimating and combining hazard(s) and vulnerability. The changing hazard burden due to the impacts of global climate change is estimated from best available science, noting the levels of certainty attached to projected changes.
2. Identification of risk management measures and associated costs: based on the assessment of risk, potential risk management projects and alternatives can be identified. The costs in a CBA are the specific costs of conducting a project, which consist of investment and maintenance costs. There are the financial costs, the monetary amount that has to be spent for the project. However of more interest are the so-called opportunity costs which are the benefits foregone from not being able to use these funds for other important objectives.
3. Analysis of benefits risk reduction: next, the benefits of reducing risk are estimated. Whereas in a conventional CBA of investment projects, the benefits are the additional outcomes generated by the project compared to the situation without the project, in this case benefits arise due to the savings in terms of avoided direct, indirect and macroeconomic costs as well as due to the reduction in variability of project outcomes. Only those costs and benefits that can be measured likewise are included. Often, an attempt is made to monetarise costs or benefits that are not given in such a metric, such as loss of life, environmental impacts etc. However, as the case with CBA generally, some effects and benefits will be left out of the analysis due to estimation problems. Generally, revealed vs. expressed preference approaches can be distinguished (Parker et al., 1987). In the revealed preference-approach, available market prices for goods, such as used for reconstructing a damaged building, are used; in practice, this involves adding up potential avoided impacts in terms of reconstruction costs. Alternatively, in the expressed preference approach, the value of a non-marketed good, such as the value of flood protection, is directly elicited by asking the potentially affected. The revealed preference approach is more common and followed for disaster risk management due to the general availability of some data, while for the revealed preference method, specific surveys would be required.

Section 6: Cost benefit analysis of adaptation options
84
4. Calculation of economic efficiency: Finally, economic efficiency is assessed by comparing benefits and costs. Costs and benefits arising over time need to be discounted to render current and future effects comparable. From an economic point of view, 1 $ today has more value than 1 $ in 10 years, thus future values need to be discounted by a discount rate representing the preference for the present over the future. Last, costs and benefits are compared under a common economic efficiency decision criterion to assess whether benefits exceed costs. Basically, three decision criteria are of major importance in CBA:
Net present value (NPV): costs and benefits arising over time are discounted and the difference taken, which is the net discounted benefit in a given year. The sum of the net benefits is the NPV. A fixed discount rate is used to represent the opportunity costs of using the public funds for the given project. If the NPV is positive (benefits exceed costs), then a project is considered desirable.
The BC-Ratio is a variant of the NPV: The benefits are divided by the costs. If the ratio is larger than 1, i.e. benefits exceed costs, a project is considered to add value to society.
Internal Rate of return (IRR): Whereas the former two criteria use a fixed discount rate, this criterion calculates the interest rate internally, which represents the return of the given project. A project is rated desirable if this IRR surpasses the average return of public capital determined beforehand (eg. 12%).
In most circumstances, the three methods are equivalent. In this assessment, due to its intuitive appeal, the BC-ratio will be used.
6.2.2 Assessing risk
A key issue in conducting CBA’s in this context is the assessment of risk and impacts. Disaster risk is commonly defined as the probability of potential impacts affecting people, assets or the environment. Natural disasters may cause a variety of effects which are usually classified into social, economic, and environmental impacts as well as according to whether they are triggered directly by the event or occur over time as indirect or macroeconomic effects (fig. 2).
Fig. 2: Natural disaster risk and categories of potential disaster impacts

Section 6: Cost benefit analysis of adaptation options
85
The standard approach for estimating natural disaster risk and potential impacts is to understand natural disaster risk as a function of hazard and vulnerability.8 Hazard analysis involves determining the type of hazards affecting a certain area with specific intensity and recurrency. In order to assess vulnerability, the relevant elements (population, assets) exposed to hazard(s) in a given area need to be identified. Furthermore, the susceptibility to damage (in the following called vulnerability) of those elements associated with a certain hazard intensity and recurrency needs to be assessed. Resilience decreases vulnerability and is denoted as the ability to return to pre-disaster conditions; appropriate organisational structures, know-how of prevention, mitigation ands response have a decisive influence on resilience. Combining hazard and vulnerability, results in risk and potential effects to be expected. Risk management projects aim at reducing these effects. Benefits of risk management are the reduction in risk estimated by comparing the situation with and without risk management.
6.2.3 Assessing Impacts and potential benefits
Natural disasters and associated impacts are triggered by a specific event. Risk is commonly defined as the probability of a certain event and associated impacts occurring. Potentially, there are a large number of impacts, in actual practice however, only a limited amount of those can and is usually assessed. Table 1 presents the main indicators for which usually at least some data can be found.
Table 1: Summary of quantifiable disaster impacts equaling benefits in case of risk reduction
Direct Indirect Direct IndirectSocial
Number of casualties Increase of diseasesHouseholds Number of injured Stress symptoms
Number affectedEconomicPrivate sector
Households Housing damaged or destroyed
Loss of wages, reduced purchasing
powerIncrease in poverty
Public sectorEducation
HealthWater and sewage
ElectricityTransport
Emergency spendingEconomic Sectors
AgricultureIndustry
CommerceServices
Environmental Loss of natural habitats Effects on biodiversityTotal
Loss of infrastructure
services
Assets destroyed or damaged:
buildings, roads, machinery, etc.
Assets destroyed or damaged: buildings,
machinery, crops etc.
Losses due to reduced production
Monetary Non-monetary
8 More and detailed information can be found in the Risk analysis guidelines published by the GTZ (GTZ, 2004).

Section 6: Cost benefit analysis of adaptation options
86
The list is structured around the 3 broad categories of social, economic and environmental indicators, whether the effects are direct or indirect and whether they are originally indicated in monetary or non-monetary terms: • Direct: Due to direct contact with disaster, immediate effect. • Indirect: Occur as a result of the direct impacts, medium-long term effect. • Monetary: Impacts that have a market value and will be measured in monetary
terms. • Non-monetary: Non-market impacts, such as health impacts.
Economic impacts, the focus of this chapter, are usually grouped into three categories: direct, indirect, and macroeconomic effects (ECLAC, 2003). These effects fall into stock and flow effects: direct economic damages are mostly the immediate damages or destruction to assets or “stocks,” due to the event per se. The direct stock damages have indirect impacts on the “flow” of goods and services: Indirect economic losses occur as a consequence of physical destruction affecting households and firms. Assessing the macroeconomic impacts involves taking a different perspective and estimating the aggregate impacts on economic variables like gross domestic product (GDP), consumption and inflation due to the effects of disasters, as well as due to the reallocation of government resources to relief and reconstruction efforts. As the macroeconomic effects reflect indirect effects as well as the relief and restoration effort, these effects cannot simply be added to the direct and indirect effects without causing duplication, as they are partially accounted for by those already (ECLAC, 2003).
Care needs to be taken not to double-count when including direct and indirect impacts. Generally, good data are often only easily available for the direct monetary impacts. In the following, also information on indirect losses, such as income losses will be employed.
6.2.4 Frameworks for estimating risks and cost and benefits
Two frameworks for the estimation and monetary quantification of disaster risk for the purposes of a CBA are presented here:
• The more rigorous risk-based framework (forward-looking, risk-based) combining data on hazard and vulnerability (fragility and exposure) to an estimate of risk and risk reduced; and
The more pragmatic impact-based framework relying on past damages (backward-looking, impact-based), focusing on past damages and modifying those to come to a first-order understanding of risk.
The appropriate approach to be used depends on the objectives of the specific CBA conducted, the data situation and available resources and expertise.
For Bangladesh and the assessment of the economic efficiency of selected DRR options under dynamic conditions including climate change via CBA these two frameworks were use to tackle the following issues
• The impact-based macro assessment of disaster risk and potential changes due to climate change on the national level. One crucial question here is the level of adaptation that can be assumed for the future.
• Risk-based CBAs of specific ongoing and planned DRR. These can help identify cost-effective DRM and adaptation options and set the stage for estimating national-level adaptation in the future.
Section 6: Cost benefit analysis of adaptation options
87
For Bangladesh, when estimating risk for the whole country the impact-based approach is likely to be more applicable, while bottom-up assessment can be risk-based, using established damage functions for given hazards. Risk-based calculations combine given hazard probabilities with vulnerability factors derived from a combination of exposure and vulnerability. Exposure (people and assets at risk) are calculated as a function of GDP and/or population, with projected changes for the future. Fragility (degree of damage of the exposed people and assets) is more complex and proxies are therefore established based on damage functions, which are explained for flooding in detail in part 2 of this report. Changes in hazards in the future due to climate change have been estimated by climate scientists working on the project.
6.2.5 Uncertainty
Estimating extreme event risk and the benefits of risk reduction is fraught with a substantial amount of uncertainty, particularly so in this case, as disasters by definition are low-frequency, high consequence events. Uncertainties are inherent in
• The recurrency of hazards: estimates are often based on a limited number of data points only.
• Incomplete damage assessments: data will not be available for all relevant direct and indirect effects, particularly so for the non-monetary effects.
• Fragility: fragility curves do often not exist.
• Exposure: the dynamics of population increase and urban expansion, increase of welfare need to be accounted for.
• Benefits of risk management estimates: often difficult to accurately measure the effect and benefit of risk management measures.
• Discounting: the discount rate used reduces benefits over the lifetime of a project and thus has very important impact on the result.
• Valuation issues: exchange rates, deflators and different cost concepts (replacement, market values) used.
• Additionally for climate change, uncertainties are due to estimating the changes in frequency and intensity of natural hazards
For example, the following chart shows possible overestimation and underestimation biases when estimating risk by means of a loss-frequency distribution (chart 3).

Section 6: Cost benefit analysis of adaptation options
88
Fig. 3: Over- and estimation biases in estimating risk by means of loss-frequency distribution Source: Penning-Rowsell, 2000
When fitting the distribution by a limited number of data points (for example, in above figure 3 data points are available only), loss may be overestimated or underestimated relative to the “true” loss probability relationship. Of course, in practice the “true” relationship is never known. What the chart demonstrates is that with increasing data points, the approximation to the underlying relationship is bound to get better. However, as discussed (and further elaborated in the case studies) often the number of data points that can be derived is limited due to lack of data and time and money constraints. Estimates of risk and benefits of risk reduction should be understood in terms of orders of magnitude. The specific sources of uncertainty are discussed in more detail in the assessment of the adaptation options.
6.3 BACKWARD-LOOKING APPROACH AND ASSESSING RISK
In a less rigorous and less data-intensive backward-looking assessment past damages build the basis for a rougher understanding of risk and potential damages.
1. Assessing relative losses and associated probabilities.
2. Adjust for dynamic driving forces of vulnerability and exposure.
3. Risk reduction and benefits thereof can be estimated (not done here for the aggregate risk exercise).
Such an assessment may be more applicable where damage functions are not developed (e.g. other than flood hazard) or the scale under investigation is too broad to use damage functions. This approach is illustrated in Figure 4 and was followed to assess current and future risk to economic assets all over Bangladesh.

Section 6: Cost benefit analysis of adaptation options
89
Damages
Benefits of risk reduction
Original loss-frequency curve
Loss-frequency curve with risk reduction
Damages
Exceedance probability(inverse: recurrency period)
Exceedance probability(inverse: recurrency period)
Step 1: Assessment of past damage events
Direct Indirect Direct IndirectSocial
Health HealthHouseholds Sense of Insecurity
EconomicPrivate sector
Households Housing damaged or destroyed
Eg loss of wages, reduced purchasing
powerIncrease in poverty
Public sector and Infrastructure
EducationHealth
Water and sewageElectricityTransport
Emergency spendingEconomic Sectors
AgricultureIndustry
Commerce…
EnvironmentalLoss of natural habitats Loss of services
Reduction/loss of infrastructure services and/or increased cost
Assets destroyed or damaged: buildings,
roads, machinery, etc.
Assets destroyed or damaged: buildings, machinery, crops etc.
Indicated in monetary terms Indicated in non-monetary terms
Profit losses due to reduced production
Recorded Impacts in past events
Step 2: Accounting for possible changes in exposure and vulnerability
Probability of occurrenceor recurrency period
Original curve
Downward shift due to flood protection
Increase in damages due to increased exposure
Direct Indirect Direct IndirectSocial
Health HealthHouseholds Sense of Insecurity
EconomicPrivate sector
Households Housing damaged or destroyed
Eg loss of wages, reduced purchasing
powerIncrease in poverty
Public sector and Infrastructure
EducationHealth
Water and sewageElectricityTransport
Emergency spendingEconomic Sectors
AgricultureIndustry
Commerce…
EnvironmentalLoss of natural habitats Loss of services
Reduction/loss of infrastructure services and/or increased cost
Assets destroyed or damaged: buildings,
roads, machinery, etc.
Assets destroyed or damaged: buildings, machinery, crops etc.
Indicated in monetary terms Indicated in non-monetary terms
Profit losses due to reduced production
Year X
Step 3: Analysis of benefits of riskreduction: Probability * Damages reduced
Year Y
Fig. 4: Backward-looking assessment framework based on impacts
The following section outlines methodological steps and associated results for the analysis for the case of flooding in Bangladesh.
Step 1: Assessing relative losses and associated probabilities
First, information on impacts in terms of asset losses were set in relation to GDP in the year of the event to calculate losses in relative terms independent of exposure and changes therein. Generally, disaster statistics, as used in this case, list the direct economic losses in terms of impacts on physical structures such as roads, buildings and other assets.9 The second to last column in table 2 shows those values in terms of GDP, and the last column tabulates return periods of events as estimated by Islam (2005). These direct impacts range from 2% of GDP for the 1984 flood (with a suggested return period of 2 years, i.e. a 2 year event) to 7.5% for the 1974 flood event, presumably a 9 year event.
9 Economists differentiate between economic assets (machinery, buildings, infrastructure) and flows (income, consumption), which are produced with inputs of assets and labour.

Section 6: Cost benefit analysis of adaptation options
90
Table 2: Selected impacts for worst floods in Bangladesh over the last 33 years Year Asset
losses (million current US$)
Fatalities Affected (million)
Affected country (‘000 sq km)
Houses damaged (‘000s)
GDP current (million US$)
Asset losses as % GDP
Estimated return period (years) per Islam, 2005
1998 2128 918 31 100 2647 44092 4.8% 90 1988 1424 2379 47 90 2880 26034 5.5% 55 1987 1167 1657 30 57 989 23969 4.9% 13 2004 1860 285 33 56 895 55900 3.3% 12 1974 936 28700 30 53 Na 12459 7.5% 9 1984 378 1200 30 Na Na 19258 2.0% 2
Data sources: Islam 1997, 2000, 2005, 2006; EMDAT, 2007; WDI, 2006.
People and societies are continuously bracing themselves for natural hazards and aiming at reducing vulnerability; these vulnerability-reducing efforts can readily be discerned in the statistics: The 1998 flood event, considered the largest event so far with an estimated recurrency period of 90 years, incurred relative asset losses of 4.8% of GDP, whereas those losses were much higher in the 9 year floods of 1974. Similarly, fatalities were reduced strongly in the 1998 event (ca. 900) with a much stronger hazard intensity compared to the 1974 disaster (ca. 29,000 dead).
With probabilities of economic asset losses as a percentage of GDP in the year of the event, a so-called loss-frequency curve can be established. Adjustments need to be undertaken in order to arrive at a first-order representation of risk for today’s (2007) conditions.
Step 2: Adjust for dynamic driving forces in the past
In establishing such a curve, it should be noted that vulnerability, exposure and hazard are dynamic forces and subject to change over time. For example:
Hazards may intensify due to changed weather patterns (eg due to climate change),
Vulnerability may change as
• Exposure may change due to higher asset concentration, population growth or migration, or/and
• Fragility can change, as e.g. more protective measures are put into place or houses are built in a more disaster-proof way.
Changes in hazard are discussed in the following and the changes in asset and population exposure is accounted for as values used are relative to population and GDP. Yet, fragility needs to be accounted for as discussed above. For this component of risk, the relative GDP losses per area affected are taken as a first order proxy, which considers the degree of damage and area affected the intensity of the event.
Based on these assumptions, risk can thus be normalized to current conditions by dividing relative losses per GDP by this indicator, and a loss exceedance curve for today’s risk (2007) drawn. The result is a standard downward sloping loss-frequency curve (low probabilities of high consequences and vice versa). Table 3: Deriving a representation of current risk for Bangladesh Description Economic
risk in relative
Risk of loss of life adjusted
Proxy for hazard
Economic risk adjusted
Risk of loss of life
Normalization to 2004
Economic risk adjusted for

Section 6: Cost benefit analysis of adaptation options
91
terms adjusted for asset exposure
for population exposure
and intensity
for exposure and hazard
adjusted for exposure and hazard
exposure and hazard
Year % GDP Fatalities per population of 10 million
% area affected
rel losses/area affected
Fatalities per 10 million /area affected
Fragility adjustment factor
Current risk: normalized to 2004
Estimated return period (years) per Islam, 2005***
1998 4.8% 0.3% 68.0%
0.030 0.071
0.81 6.0% 90
1988 5.5% 0.5% 62.0%
0.051 0.088
1.01 5.4% 55
1987 4.9% 0.6% 40.0%
0.055 0.122
1.39 3.5% 13
2004** 3.3% 0.1% 38.0%
0.009 0.088
1.00 3.3% 12
1974 7.5% 9.6% 37.0%
0.957 0.203
2.32 3.2% 9
1984 2.0% - - - - - - 2 * Fatalities were related to population of 10 million to arrive at similar magnitudes as the asset losses. ** 2004 conditions were used as representative for 2007, as this is the last data point with impact data. *** The return periods are estimated in relation to affected areas.
Figure 5 shows how the value of this proxy decreases over time for the major floods over the last 33 years. As a comparison, fatalities in those events per 10 million inhabitants are displayed as well, showing the progress made in protecting lives from about 29,000 people killed in a flood in 1974 compared with 285 in 2004. When taking this indicator as a proxy of fragility, the losses can be adjusted for vulnerability-reducing efforts by dividing this proxy value in the year of the event by the value of the last year in the dataset (=2004). For example, for the 1974 floods, a value of 2.32 is calculated in this way. This could roughly be interpreted as the potential degree of damage (fragility) in 1974 being 230% of that in 2004.

Section 6: Cost benefit analysis of adaptation options
92
-
0.20
0.40
0.60
0.80
1.00
1.20
1974 1978 1982 1986 1990 1994 1998 2002 2006 2010 2014 2018 2022 2026 2030 2034 2038 2042 2046 2050
asse
t los
ses
as %
GD
P/%
of c
ount
ry a
ffect
ed a
nd
fata
litie
s pe
r 10
mill
ion/
% o
f cou
ntry
affe
cted
Fatalities
Assets
Fig. 5: Fragility proxies for assets and fatalities
Dividing the relative asset losses (column 1) by these fragility proxies would lead to an adjusted value for the relative asset losses and is shown in the next to last column for the events where values were available. In this fashion, a more realistic estimate of risk as represented by the loss-frequency function is arrived at. As figure 6 shows, this adjusted curve is a regularly downward sloping schedule with highest potential losses for the 90 year event (6% of GDP) and lowest for the 9 year event with 3.2% of GDP.
0.0%
2.5%
5.0%
7.5%
10.0%
0.0% 2.0% 4.0% 6.0% 8.0% 10.0% 12.0%
Exceedance probability
Rel
ativ
e Im
pact
ass
ets l
osse
s as %
GD
P
adjusted loss frequency curve fro 2007
loss frequency curve without adjustments
Fig. 6: Loss frequency curve for asset losses measured in terms of GDP in major floods events in Bangladesh

Section 6: Cost benefit analysis of adaptation options
93
In order to account for changes in hazard frequency and/or intensity, the CBA draws on the results of the natural science components of this report presented in section 5 for the IPCC b1 future greenhouse gas emissions scenarios in 2020 and 2050. Climate change is assumed to change frequencies of loss events due to its impact in terms of area affected. Given a lack of more detailed data, this economic analysis draws the assumption that economic impacts such as loss of assets would be proportional to area affected and thus frequencies can be adjusted likewise.
-
20,000
40,000
60,000
80,000
100,000
120,000
140,000
0.0% 10.0% 20.0% 30.0% 40.0% 50.0%
Exceedance probability
Are
a af
fect
ed(k
m2)
2050 2050 baseline
Fig. 7: Projected change in frequency of severe instances with areas flooded
Source: Hassan and Conway, Chapter 5 of this report.
As well as changes to the burden of hazards in the future, changes in vulnerability also need to be represented. Two vulnerability and adaptation cases were considered.
- No adaptation case : In this scenario, no additional adaptation beyond current efforts is assumed and thus with increased frequency of flooding, losses would increase. This scenario is unlikely given that some degree of adaptive adjustment can be expected as a response to increasing losses, but exemplifies a worst case.
- Significant adaptation case:
In the alternative scenario, significant adaptation is assumed and the relationship is extrapolated from data on successful reduction of losses in events in the past. The extrapolation is based on the asset fragility curve shown in figure 5 and conducted to 2020 and 2050. Due to the exponential fit, it is assumed that the fragility decreasing effect over the next 4 decades is substantial, which is a strong assumption. With such significant adaptation occurring, despite changing frequency of hazards, asset losses as a share of GDP would substantially be reduced.
The results in terms of asset risk for Bangladesh for the respective scenarios are shown in figures 8 a and b.
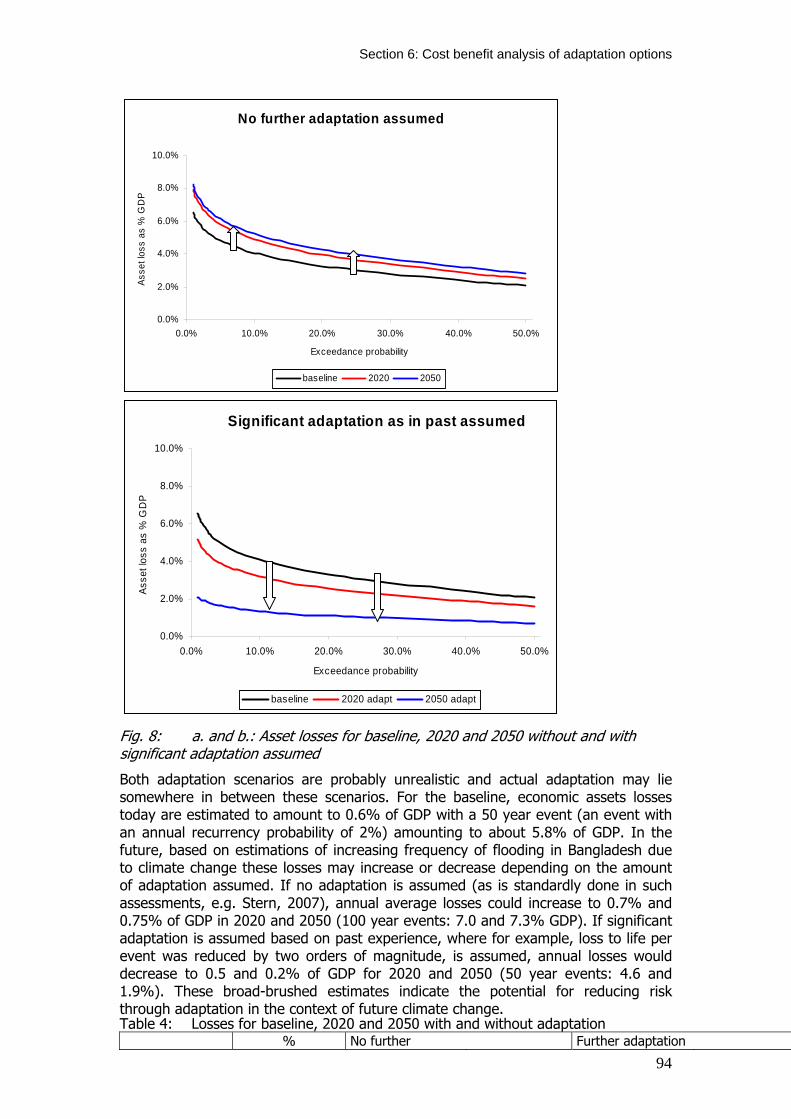
Section 6: Cost benefit analysis of adaptation options
94
No further adaptation assumed
0.0%
2.0%
4.0%
6.0%
8.0%
10.0%
0.0% 10.0% 20.0% 30.0% 40.0% 50.0%
Exceedance probability
Asse
t los
s as
% G
DP
baseline 2020 2050
Significant adaptation as in past assumed
0.0%
2.0%
4.0%
6.0%
8.0%
10.0%
0.0% 10.0% 20.0% 30.0% 40.0% 50.0%
Exceedance probability
Asse
t los
s as
% G
DP
baseline 2020 adapt 2050 adapt
Fig. 8: a. and b.: Asset losses for baseline, 2020 and 2050 without and with significant adaptation assumed
Both adaptation scenarios are probably unrealistic and actual adaptation may lie somewhere in between these scenarios. For the baseline, economic assets losses today are estimated to amount to 0.6% of GDP with a 50 year event (an event with an annual recurrency probability of 2%) amounting to about 5.8% of GDP. In the future, based on estimations of increasing frequency of flooding in Bangladesh due to climate change these losses may increase or decrease depending on the amount of adaptation assumed. If no adaptation is assumed (as is standardly done in such assessments, e.g. Stern, 2007), annual average losses could increase to 0.7% and 0.75% of GDP in 2020 and 2050 (100 year events: 7.0 and 7.3% GDP). If significant adaptation is assumed based on past experience, where for example, loss to life per event was reduced by two orders of magnitude, is assumed, annual losses would decrease to 0.5 and 0.2% of GDP for 2020 and 2050 (50 year events: 4.6 and 1.9%). These broad-brushed estimates indicate the potential for reducing risk through adaptation in the context of future climate change. Table 4: Losses for baseline, 2020 and 2050 with and without adaptation % No further Further adaptation

Section 6: Cost benefit analysis of adaptation options
95
adaptation assumed Return Period Baseline 2020 2050 2020 2050
( T year) 10 4.1% 4.9% 5.2% 3.2% 1.3% 50 5.8% 7.0% 7.3% 4.6% 1.9% 100 6.5% 7.9% 8.2% 5.1% 2.1%
Expected annual losses 0.60% 0.7% 0.8% 0.5% 0.2%
The representation of adaptation in this top-down assessment of necessity is broad-based, locale-unspecific and based on adaptation that occurred in the recent past. A key question for this assessment and the adaptation discussion in general (for example see Stern, 2007) is the scope for such adaptation and the extent to which it will occur autonomously or to which it will require specific planning and intervention . In order to shed more light on these crucial issues, in the following, CBAs for two specific ongoing and planned adaptation options within the DFID-Bangladesh portfolio are analyzed using a more risk-based, bottom-up approach. 6.4 CBAS OF SELECTED ADAPTATION OPTIONS USING A FORWARD-LOOKING FRAMEWORK
For measuring risk and the benefits arising due to selected adaptation or risk reduction options in a risk-based framework 4 steps are followed as illustrated in Figure 9. The first three steps correspond to calculating the hazard and vulnerability profiles to inform a risk assessment. Based on this, in a fourth step the benefits due to risk reduction can be determined. In detail, the necessary steps are:
1. Hazard analysis: Identifying intensity and frequency of the respective hazard(s) and changes therein, for example due to climate change,
2. Vulnerability analysis: Assessing exposure and fragility,
3. Risk analysis: combining hazard and vulnerability to an estimate of risk, and
4. Analysis of the benefits of risk management.

Section 6: Cost benefit analysis of adaptation options
96
Fig. 9: Quantitative forward-looking framework for estimating disaster risk Illustration modified based on World Bank, 1996.
2 Options are studied using this framework:
• Flood-proofing of the Bangladesh roads and highways, relevant to the DFID-supported programme “Roads and Highways Policy Management, budgetary and TA Support” (RHD).
• Raising homesteads in Char Areas of Northern Bangladesh within the “Char Livelihoods Programme” (CLP).
6.4.1 Option 1: Flood-proofing of roads and highways by raising road height to the highest recorded flood and provision of adequate cross-drainage facilities
Bangladesh is covered by a large road and highway network, most of it traversing through the flood plains of the country. The Roads and Highways Department (RHD) is responsible for a huge number of assets in the form of roads, bridges and culverts. Protecting and maintaining about 20,798 kilometers of roads and 14,712 bridges and culverts with an estimated asset value of TK 727,000 Million is of prime importance for the national economy.

Section 6: Cost benefit analysis of adaptation options
97
Flood loss potentials to roads infrastructure have been huge. In the 1998 and 2004 flood, for example, the direct damage to roads sector is estimated as TK 15,272 and TK 10,031 Million, accounting for 15 and 9 per cent of the total damage respectively. The situation is expected to be deteriorating in the days to come, with the increased extent and intensity of flooding due to potential climate change and sea level rise in future. Hence, it is important to develop flood proofing systems as a response to natural disasters, in designated flood risk zones, to protect life, property and vital infrastructure such as roads. As yet, flood proofing to roads in areas under CLP has not prominently featured in its activities and programmes. As more and more households benefit from raised homesteads (see option 2), the priorities may change and the demand for raised roads is expected to increase.
The maintenance of these assets and protecting them against disasters such as floods is a fundamental requirement for the economy to sustain. It is, therefore, the national policy that all national and regional roads are planned and designed to be constructed for above the highest flood level (HFL). The district roads are planned to be constructed over the normal flood level. It is also the policy that the damages are minimised by measures through increasing openings of bridges and culverts as, it has been observed that inadequate openings of bridges and culverts cause damage to both structures and approach roads.
Historical records show that the roads, which were raised above the 1988/1998 flood-level, suffered minimum damage in the 2004 floods. After the 1988 flood, for example, national highways such as the Dhaka-Chittagong, Dhaka-Mawa-Khulna, Dhaka-Sylhet and Dhaka-Aricha highways were raised by 1 to 1.5 meters above HFL. As a result, these highways suffered no significant damages during the 2004 flood (Rahman 2006).
In recent time, relevant experts suggested that roads constructed along the east-west direction were given extra attention to ensure proper drainage of water, by providing extra spans for adequate passage at the peak flow stage. Experts also warned that the existing bituminous pavements are more susceptible to water than cement-concrete ones. Provision of asphalt concrete topping and hard shoulder can reduce the damage to roads caused by the flow of water over the road surface. Asphalt concrete produce more durable pavements than the usual road with mixed carpeting.
Knowledgeable people also opine that in order to minimize the erosion of the road embankments and vulnerable road sections, slopes have to be protected with hard layers (C.C. blocks with geo-textile); less vulnerable sections should be protected with flood resistant natural turfs and plants like vetiver (Kashful).
Currently there are three types of maintenance:
(1) Routine maintenance, carried out year round (at an approximate cost in the range of TK50,000-70,000 per Km)
(2) Periodic maintenance, carried out in 4 -5 years (at an approximate cost in the range of TK500,000-1500,000 per Km)
(3) Partial/Full/Rehabilitation/Reconstruction (at an approximate cost in the range of TK5000,000 per Km)
The requirement for maintenance depends on the roughness, caused due to inundation and heavy rains, and associated traffic loads. Ironically, routine and periodic maintenance are often overlooked by policy makers, in consequence of which more and more roads are becoming subject to complete rehabilitation over years, turning this to a great backlog. Only recently, a sum of TK10000 Million has been allocated to rehabilitate only a few roads. Had there been regular and

Section 6: Cost benefit analysis of adaptation options
98
routine maintenance no such backlog could crop up at a very short interval of time.
Over and above, pavement designs constructed in the past were generally inadequate to adaptation to floods in terms of alignment, height, widths, slopes and provision of adequate drainage openings. Apart from the roads having been previously constructed at a level lower than HFL, this is one of the reasons why older roads have generally become yet more vulnerable to flood water. For example, relatively older roads, the Commilla–Brahamanbaria highway appears to have now become vulnerable to floods. As a result, it is now planned to undergo full rehabilitation for at least 37 out of 74 Km length. Similar is the case with the Bhariab–Mymensingh road. The development partners while funding these projects have asked to pay proper attention to flood risks. It has been suggested that while undergoing complete rehabilitation such types of roads are raised up to a safe flood level.
Hence, policies, guidelines and technologies are already there but, ironically, these are not properly practiced in real situations, with the exception of, perhaps, new national highways. Hence, it is important that they are enforced at least phase-wise and on a priority basis. The Roads Master Plan (Government of Bangladesh, 2007) also recently reiterated the maintenance of 1 to 1.2 meter freeboard above a 50 year flood, although directives in this respect have been in existence since the time of the floods back in 1987 and 1988. Notwithstanding the above facts, so far, the efforts and resources of the RHD are meagre compared to the enormous dimension of the problem. The proposed option in its entire scope will provide appropriate flood proofing to nearly 800 Km of roads through roads raising across the country.
In the calculations it is assumed that costs and benefits are evenly spread over time, i.e. every year a constant amount is spent for flood-proofing, resulting in a gradual building-up of flood protection. Benefits considered are the avoided infrastructural asset losses (direct losses).
Regional focus and time horizon
This is an option with a national coverage. The National Water Management Plan- NWMP (2001) divided the entire country into eight ecological regions: South Western (SW), South Central (SC), North Western (NW), North Central (NC), North Eastern (NE), South Eastern (SE), Rivers and Estuaries (RE) and Eastern Hills (EH). This option relates to the six major regions of Bangladesh, but does not include the RH and EH region of the country.
The option comprises a long-term programme (25 years) but since the costs would be very high if incurred at one time it is intended that roads raising will be carried out when a particular road is due for full rehabilitation, with priority given to high risk areas. Since the work involves simply the raising of existing roads, environmental impacts would be minimal.
Table 5 shows the estimated regional distribution of roads according to high and low flood risk levels, (NWMP 2001). The distribution refers to year 2000 and it is assumed that, since then, according to government policy all new roads have been constructed keeping in view of the highest flood level of the 1998 flood. It is intended that all national and regional roads not above flood level at present, and one-fifth of the district (feeder) roads in high risk areas only, will be raised by the end of 25 year period.
Table 5: Estimated regional distribution of roads to be raised

Section 6: Cost benefit analysis of adaptation options
99
Length of road to be raised, by type and region (Km) Road Type Risk level SW SC NW NC NE SE Total
National Highways
High 6.7 15.8 19.4 39.6 0.4 7.3 89.2
National Highways
Low 10.3 0.6 12.8 12.5 1.4 9.6 47.2
Regional Roads High 19.9 7.4 16.1 18.6 2.9 14.6 79.5 Regional Roads Low 7.7 4.0 41.1 8.9 5.4 9.9 77.0 District Road Type A High 17.8 34.8 48.3 94.5 4.2 41.2 240.7 District Road Type A Low 31.9 38.8 62.8 108.8 8.4 26.7 277.5
Source: Government of Bangladesh, 2001.
The investment period for the option upon which the cost benefit analysis is undertaken is 25 years, reflecting existing practices in RHD.
Cost estimates
The option is targeted at the flood proofing needs of key portions of Bangladesh's highway network. Specifically, some 170 Km of national and regional roads and some 518 Km of district (feeder) roads in high risk areas will be raised by 1 meter. Under the option, about 124 km of national and regional roads in low risk area will be raised by 0.5m.
Table 6 presents cost estimates for road raising and related drainage improvements by roads category of high and low risk areas. In total, about TK 8,794 Million will be required for the implementation of the option. The costs estimates have considered an average two culverts per Km (for cross-drainage facilities) for each category of roads, instead of currently practiced 0.71 culvert per Km. An average culvert costs 1 million Taka. The road maintenance cost assumed to be at the rate 4% will have to be incorporated while estimating NPV.
Table 6: Costs estimates by category of roads by risk level Roads type
Length of roads to be raised (Km)
% of total in each category
Rate Tk/Km (2007 prices)*
Total (TK-Million)
In high flood risk areas National Highway 89.2 2.5 13.8 1,228 Regional Highway 79.5 1.9 13.2 1,053 District (Feeder) Roads- Type A 240.7 3.7 9.9 2,388 District(Feeder) Roads – Type B 277.5 4.2 8.8 2,455 Subtotal 686.9 3.3 7,125 In low flood risk areas National Highway 47.2 1.3 13.8 650 Regional Highway 77.0 1.9 13.2 1,020 Sub-total 124.2 0.6 1,670 Grand Total 8,794
Assessing risks and benefits of DRM Benefits of the option would be the avoided rehabilitation costs due to floods. Table 7 lists the major riverine floods that have occurred in all of Bangladesh, its impacts on the roads sector and estimated recurrency.
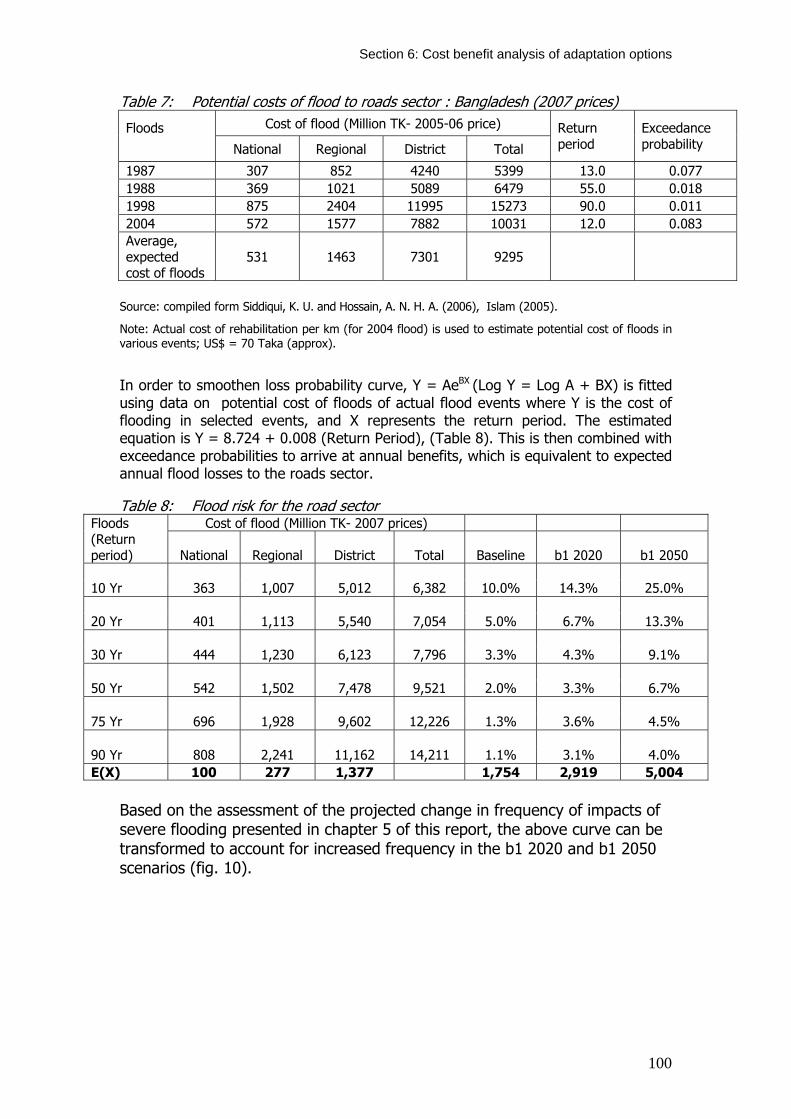
Section 6: Cost benefit analysis of adaptation options
100
Table 7: Potential costs of flood to roads sector : Bangladesh (2007 prices)
Source: compiled form Siddiqui, K. U. and Hossain, A. N. H. A. (2006), Islam (2005).
Note: Actual cost of rehabilitation per km (for 2004 flood) is used to estimate potential cost of floods in various events; US$ = 70 Taka (approx).
In order to smoothen loss probability curve, Y = AeBX (Log Y = Log A + BX) is fitted using data on potential cost of floods of actual flood events where Y is the cost of flooding in selected events, and X represents the return period. The estimated equation is Y = 8.724 + 0.008 (Return Period), (Table 8). This is then combined with exceedance probabilities to arrive at annual benefits, which is equivalent to expected annual flood losses to the roads sector. Table 8: Flood risk for the road sector
Cost of flood (Million TK- 2007 prices) Floods (Return period) National Regional District Total Baseline b1 2020 b1 2050
10 Yr 363 1,007 5,012 6,382 10.0% 14.3% 25.0%
20 Yr 401 1,113 5,540 7,054 5.0% 6.7% 13.3%
30 Yr 444 1,230 6,123 7,796 3.3% 4.3% 9.1%
50 Yr 542 1,502 7,478 9,521 2.0% 3.3% 6.7%
75 Yr 696 1,928 9,602 12,226 1.3% 3.6% 4.5%
90 Yr 808 2,241 11,162 14,211 1.1% 3.1% 4.0% E(X) 100 277 1,377 1,754 2,919 5,004
Based on the assessment of the projected change in frequency of impacts of severe flooding presented in chapter 5 of this report, the above curve can be transformed to account for increased frequency in the b1 2020 and b1 2050 scenarios (fig. 10).
Cost of flood (Million TK- 2005-06 price) Floods National Regional District Total
Return period
Exceedance probability
1987 307 852 4240 5399 13.0 0.077 1988 369 1021 5089 6479 55.0 0.018 1998 875 2404 11995 15273 90.0 0.011 2004 572 1577 7882 10031 12.0 0.083 Average, expected cost of floods
531 1463 7301 9295

Section 6: Cost benefit analysis of adaptation options
101
4,000
6,000
8,000
10,000
12,000
0% 5% 10% 15% 20% 25% 30%
Probability
Loss
es (m
illio
n Ta
ka)
baseline
b1 2020
b1 2050
Fig. 10: Potential impacts of flooding on the road sector now and in the future (2020, 2050) The expected value of the benefits is considered to equal the area under the curve, assuming that roads and highways are flood-proofed to the highest ever-recorded flood and floods can thus be avoided.10 The annual increase in risk from adding in these climate change scenarios to the hazard burden is estimated to amount to 2.6% per year, where the assumption is taken that increases over time are linearly distributed.
Results Based on the estimates of costs and benefits, the economic efficiency of this option can be estimated. The following table outlines the process of estimating the BC ratio, NPV and IRR. For each given year over the time horizon of 25 years, costs and benefits and net benefits are displayed both in discounted and non-discounted format in constant 2007 values for a (high) discount rate of 12%, the rate most commonly assumed in similar exercises.11 Dividing benefits by costs leads to the B-C ratio, subtracting costs from benefits to the net present value (NPV), and the IRR is calculated as the rate that discounts the NPV to zero.
10 In reality, full protection against extreme events is normally not possible and cost-effcient. 11 The return on capital in most developing countries is considered to be between 8-15% in real terms and often 12% is used as a default value (see, for example, OAS 1991; ADB 2001).

Section 6: Cost benefit analysis of adaptation options
102
Table 9: Overview over CBA calculations for RHD option for best estimate and 12% discount rate Discount rate 12%
Year Calendar Year Costs Benefits Net benefits: benefits-costs
Discounted costs
Discounted benefits
Discounted net benefits
1 2007 352 70 -282 352 70 -2822 2008 352 144 -208 314 128 -1863 2009 352 217 -134 280 173 -1074 2010 352 291 -61 250 207 -435 2011 352 365 13 224 232 86 2012 352 438 87 200 249 497 2013 352 512 160 178 259 818 2014 352 586 234 159 265 1069 2015 352 659 308 142 266 124
10 2016 352 733 381 127 264 13811 2017 352 807 455 113 260 14712 2018 352 880 529 101 253 15213 2019 352 954 602 90 245 15514 2020 352 1028 676 81 236 15515 2021 352 1101 750 72 225 15316 2022 352 1175 823 64 215 15017 2023 352 1249 897 57 204 14618 2024 352 1322 971 51 193 14119 2025 352 1396 1044 46 182 13620 2026 352 1470 1118 41 171 13021 2027 352 1543 1192 36 160 12422 2028 352 1617 1265 33 150 11723 2029 352 1691 1339 29 140 11124 2030 352 1764 1413 26 130 10425 2031 352 1838 1486 23 121 98
Sum 8794 23853 15058 3090 4998 1907 NPV
1.62B/C ratio
12.1%
Estimated internal rate of
returm According to table 9, for a discount rate of 12%, the net present value would be TK 1,907, the B-C ratio 1.6 and the estimated internal rate of return of about 12% (thus the same as the discount rate). For all these criteria, the suggestion of this analysis would thus be to conduct the project (for the internal rate of return it would just be fulfilled).
Table 10 and figure 11 show the effects of varying the discount rates and costs/benefits by+/- 50% in order to account for uncertainty. Although very costly and an option with national coverage, the flood-proofing of RHD investments seems to be efficient given the assumptions taken. For the best estimate case, a range of 1.2-2.7 is calculated; thus for this set of assumptions, the option would be beneficial. It would mostly still be larger than 1 with more pessimistic assumptions such as costs increasing by 50%. If however, under very pessimistic assumptions, costs are increased and benefits are supposed to be decreased by 50%, then for all discount rates considered the option would not be efficient anymore.
Table 10: Results in terms of B-C ratio for current and future conditions Scenario\Discount rate 0% 5% 10% 12% 15% 20% Best estimate 2.7 2.2 1.8 1.6 1.4 1.2 Costs +50% 1.8 1.5 1.2 1.1 1.0 0.8* Costs +50%, benefits - 50% 0.9* 0.7* 0.6* 0.5* 0.5* 0.4*
*Not efficient
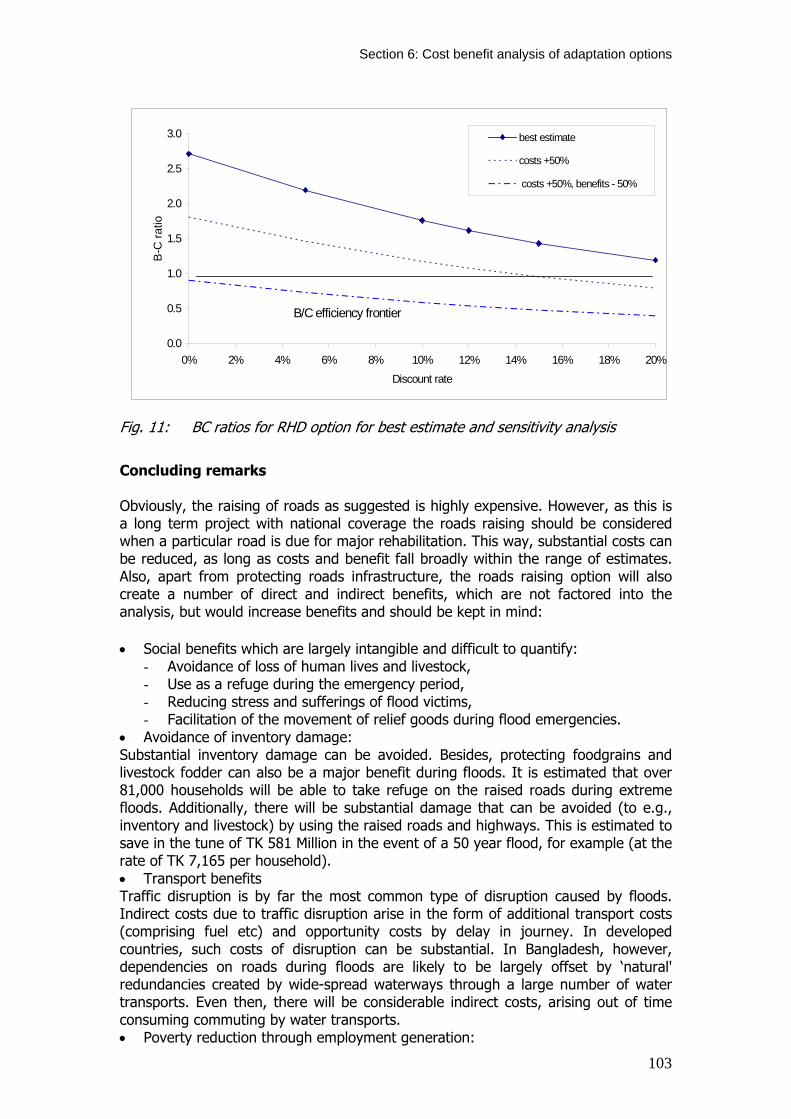
Section 6: Cost benefit analysis of adaptation options
103
0.0
0.5
1.0
1.5
2.0
2.5
3.0
0% 2% 4% 6% 8% 10% 12% 14% 16% 18% 20%Discount rate
B-C
ratio
best estimate
costs +50%
costs +50%, benefits - 50%
B/C efficiency frontier
Fig. 11: BC ratios for RHD option for best estimate and sensitivity analysis
Concluding remarks Obviously, the raising of roads as suggested is highly expensive. However, as this is a long term project with national coverage the roads raising should be considered when a particular road is due for major rehabilitation. This way, substantial costs can be reduced, as long as costs and benefit fall broadly within the range of estimates. Also, apart from protecting roads infrastructure, the roads raising option will also create a number of direct and indirect benefits, which are not factored into the analysis, but would increase benefits and should be kept in mind: • Social benefits which are largely intangible and difficult to quantify:
- Avoidance of loss of human lives and livestock, - Use as a refuge during the emergency period, - Reducing stress and sufferings of flood victims, - Facilitation of the movement of relief goods during flood emergencies.
• Avoidance of inventory damage: Substantial inventory damage can be avoided. Besides, protecting foodgrains and livestock fodder can also be a major benefit during floods. It is estimated that over 81,000 households will be able to take refuge on the raised roads during extreme floods. Additionally, there will be substantial damage that can be avoided (to e.g., inventory and livestock) by using the raised roads and highways. This is estimated to save in the tune of TK 581 Million in the event of a 50 year flood, for example (at the rate of TK 7,165 per household). • Transport benefits Traffic disruption is by far the most common type of disruption caused by floods. Indirect costs due to traffic disruption arise in the form of additional transport costs (comprising fuel etc) and opportunity costs by delay in journey. In developed countries, such costs of disruption can be substantial. In Bangladesh, however, dependencies on roads during floods are likely to be largely offset by ‘natural' redundancies created by wide-spread waterways through a large number of water transports. Even then, there will be considerable indirect costs, arising out of time consuming commuting by water transports. • Poverty reduction through employment generation:
Section 6: Cost benefit analysis of adaptation options
104
The option, when implemented, will generate employment opportunities largely for the disadvantaged groups of people, particularly women, especially during construction. Additionally, during repair and maintenance phase there will be some extra employment. Total person-days that will be generated by earthwork alone estimates are 4 million. Total wages that will be earned by way of this employment estimates as TK 600 Million. Obviously, this will have some implication to poverty reduction. 6.4.2 Option 2: Flood proofing of individual homesteads in the Char areas against 20 year floods by means of constructing raised earth platforms.
The second option considered in this analysis involves flood proofing individual homesteads against a maximum of 20 year floods on riverine islands, known as Chars, in Bangladesh. The option is already under implementation as part of the Chars Livelihoods Programme and involves constructing earth platforms on beneficiaries land for the unit of a bari (homestead with 4 households).
The riverine areas of Bangladesh are home to the poorest and most vulnerable communities in the country with over 80 per cent living in extreme poverty. Inhabitants of these areas live under serious risk of frequent flooding. The Bangladesh National Water Management Plan emphasizes coping with inland floods rather than managing them. In the past, greater reliance has been placed on embankments and drainage schemes, which are primarily designed for agriculture protection. The protection of non-agricultural sectors such as human habitation and infrastructure has received far less attention in the past, despite the significant flood loss potentials of such sector. In the 1998 and 2004 floods, for example, the direct damage to residential sectors accounted for 20 to 33 per cent of the total damage, and 40 to 44 per cent of the total non-agricultural damage (Islam, 2006).
With this background, the Homestead Raising Option in Char Areas is concerned with providing proven technologies in the form of raised households to some 2.5 Million people in the main river Char lands. Flood proofing through raising of houses, roads, water supply/sanitation facilities and other infrastructure above flood level reflects traditional practice in Bangladesh. Not all households have the resources to do this, however, especially in the unprotected Char areas near the major river channels.
The option is to construct earth platforms on beneficiaries land, establishing an unit for a ‘bari’ (homestead), which comprises 4 houses with a total of 20 people on 600 m2 area, each house being on a 150 m2 area, to protect against a the height of a flood with a recurrence interval of 20 years. The adaptation option presented here considers the flood proofing of an area to accommodate four dwellings, a hand tube well and a toilet. It is assumed that the inhabitants will dismantle their individual houses and reconstruct their individual houses on a common platform. As erodible soils can be washed away by wave action during floods, protection and/or regular maintenance may be required.

Section 6: Cost benefit analysis of adaptation options
105
Fig. 12: Women involved in homestead raising in the Chars, Courtesy CLP
Linkages with Char Livelihood Programme (CLP) activities and rationale for cost benefit analysis of the option
The lives of the Char people are closely related to the dynamics of the river flows and the resultant formation and erosion of Chars. Thus, Char communities are extremely vulnerable to erosion and flooding. With this background, the CLP aims to improve the livelihood of the poor in the Char areas by reducing vulnerability of dwellers, through targeted provision of, among others, infrastructures thereby improving the resilience of the community to environmental shocks. However, these people have the least resources to afford to build such infrastructures.
The current study considers security of houses as closely linked with the reduction in overall vulnerability of Char people. Hence, it is of prime importance to provide secure houses to Char people. In fact, CLP has already targeted towards achieving this through raising of homesteads. In the mean time, it has already raised homesteads to more than 24,000 Char people, with a target of another 32,000 by the end of this fiscal year.
The CLP has recently targeted plantation including through Vetiver grass, Durba grass and trees to protect slopes from erosion due to flooding. It has recently prioritised which homesteads should be selected for earthworks to raise their plinth level. In this respect, it has also adopted a consistent approach towards the promotion of improved latrine technologies.
Small-scale water supply systems are not recommended for the Chars. Motorized pumping equipment, which incur greater operational costs, associated with the cost of fuel and a water distribution system, often fail during the most critical time of floods. The CLP thus recommends for low-cost, improved water supply activities.
Notwithstanding the above facts, so far, the efforts and resources of the CLP are small compared to the enormous dimension of venture for the vast number of people. Moreover, homestead raising on a cluster basis has not yet featured in CLP activities and programmes.
Regional focus and time horizon
The Char areas in this option refer to the project area delineated by Char Livelihoods Programme. The option will focus on one of the main Char areas comprising five districts – along the Brhmaputra river, stretching from Kurigram in the north to Sirajganj districts in the south. The other three districts are Jamlpur, Gaibanda and Bogra. About 1000 villages in 20 Upazilas in the Brahmaputra Char lands will be covered under the option. Although the option refers to Char areas this could also be

Section 6: Cost benefit analysis of adaptation options
106
adopted in any areas vulnerable to flooding, including coastal areas. A 25 year project time horizon is assumed.
Cost estimates
Knowledge of the maximum flood level in Char areas is critical for the design height of the raised homestead. It is difficult to assess exactly to what extent individual homesteads have to be raised as land level in an area varies considerably from house to house, and location to location. It is also difficult to assess what return period this equates to. In fact, there is no real scientific basis for quick assessment unless there is any detailed-level land use, land level and hydrological survey relating to the area. This is more critical for such a short assignment. However, the maximum flood level has been based upon the living memory of local people as adopted by CLP.
Based on discussion with local people and CLP personnel, an average three feet raising (0.91 meter) is suggested for a flood such as 2004 event with an approximate return period of 15 years locally. An additional 0.61 meter (2 feet), however, has to be added to this level as a freeboard. This allows to assume that a height of 1.52 meter (from ground level) will protect from approximately maximum of a 20-yr flood. In other words, this is expected to protect against a flood level of 1.22 meter (from house floor level), assuming an average floor height of .30 meter (one foot). It is gathered that almost 100 percent of the Char inhabitants are said to be at flood risk even to a 2 year event although some 33 per cent are reported to be most vulnerable. Average floor heights of houses as elsewhere in the country are assumed in this analysis.
The option is involved in providing an earth platform to permit construction of dwellings and the associated facilities on raised ground to protect against a minimum flood level. In other words, these would be constructed such that flooding does not affect their day-to-day functioning. The option presented here considers the flood proofing of an area to accommodate four dwellings, a hand tube well and a latrine. The level to which the land is raised takes into account not only the maximum observed flood level (probably up to a 20-year flood), but the effects of sea level rise due to climate change to some extent.
The HS Option can be divided into two sub-options depending on whether or not the community will bear any costs associated with this. Under the HS Option (A), the CLP project will raise one common platform for 4 dwellings, each with 150 M2 area and will reconstruct individual houses. Other infrastructure provision such as tube wells and sanitation will also be constructed by the project. Under the HS Option (B), the project will only raise the common platform while the beneficiaries will reconstruct their individual houses, including making other infrastructure provision such as tube wells and sanitation. The analysis is carried out for both the cases.
Cost estimation has been carried out for the above typical system and its details are given in Table 11. The first sub-option assumes that the cost of water supply, toilets and reconstruction of buildings will be borne by the Project. According to the estimate, the capital investment cost per household benefited amounts to about TK 16,000 for the first sub-option. For the second sub-option, the capital investment cost per household benefited amounts to about TK 10,000.
Raising land for buildings above flood levels is assumed to eliminate the damage caused by flooding up to that respective flood level. Raising of other facilities and infrastructure can also reduce or eliminate the disruption caused by the floods.
Table 11: Information and costs for option homestead raising option
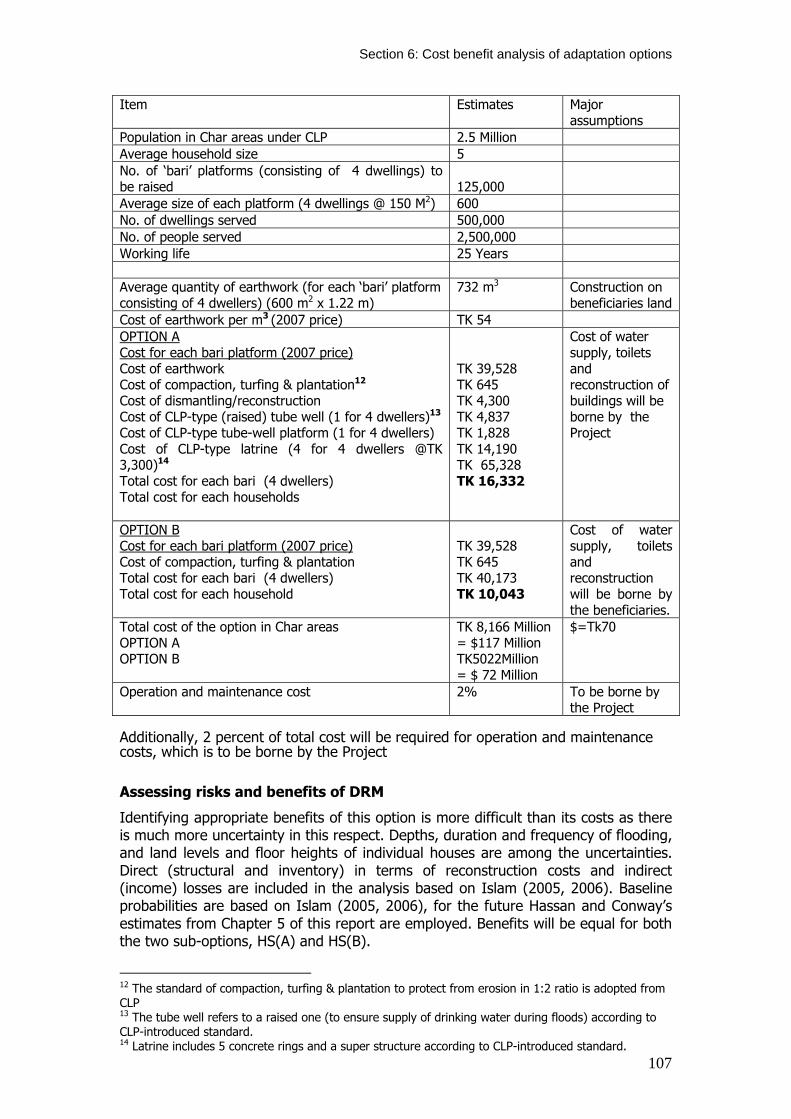
Section 6: Cost benefit analysis of adaptation options
107
Item Estimates Major assumptions
Population in Char areas under CLP 2.5 Million Average household size 5 No. of ‘bari’ platforms (consisting of 4 dwellings) to be raised
125,000
Average size of each platform (4 dwellings @ 150 M2) 600 No. of dwellings served 500,000 No. of people served 2,500,000 Working life 25 Years Average quantity of earthwork (for each ‘bari’ platform consisting of 4 dwellers) (600 m2 x 1.22 m)
732 m3 Construction on beneficiaries land
Cost of earthwork per m3 (2007 price) TK 54 OPTION A Cost for each bari platform (2007 price) Cost of earthwork Cost of compaction, turfing & plantation12 Cost of dismantling/reconstruction Cost of CLP-type (raised) tube well (1 for 4 dwellers)13 Cost of CLP-type tube-well platform (1 for 4 dwellers) Cost of CLP-type latrine (4 for 4 dwellers @TK 3,300)14 Total cost for each bari (4 dwellers) Total cost for each households
TK 39,528 TK 645 TK 4,300 TK 4,837 TK 1,828 TK 14,190 TK 65,328 TK 16,332
Cost of water supply, toilets and reconstruction of buildings will be borne by the Project
OPTION B Cost for each bari platform (2007 price) Cost of compaction, turfing & plantation Total cost for each bari (4 dwellers) Total cost for each household
TK 39,528 TK 645 TK 40,173 TK 10,043
Cost of water supply, toilets and reconstruction will be borne by the beneficiaries.
Total cost of the option in Char areas OPTION A OPTION B
TK 8,166 Million = $117 Million TK5022Million = $ 72 Million
$=Tk70
Operation and maintenance cost 2% To be borne by the Project
Additionally, 2 percent of total cost will be required for operation and maintenance costs, which is to be borne by the Project
Assessing risks and benefits of DRM
Identifying appropriate benefits of this option is more difficult than its costs as there is much more uncertainty in this respect. Depths, duration and frequency of flooding, and land levels and floor heights of individual houses are among the uncertainties. Direct (structural and inventory) in terms of reconstruction costs and indirect (income) losses are included in the analysis based on Islam (2005, 2006). Baseline probabilities are based on Islam (2005, 2006), for the future Hassan and Conway’s estimates from Chapter 5 of this report are employed. Benefits will be equal for both the two sub-options, HS(A) and HS(B).
12 The standard of compaction, turfing & plantation to protect from erosion in 1:2 ratio is adopted from CLP 13 The tube well refers to a raised one (to ensure supply of drinking water during floods) according to CLP-introduced standard. 14 Latrine includes 5 concrete rings and a super structure according to CLP-introduced standard.

Section 6: Cost benefit analysis of adaptation options
108
Following a detailed information collection is beyond the scope of the current study and one has to adopt some broad assumptions based on general discussion with the Char managers and Char dwellers. The method of Triangulation is adopted to crosscheck information from various sources. The major sources of information used in this analysis are CLP secretariat, Government of Bangladesh (2001), Islam (2005, 2006) and the potential beneficiaries themselves. Perceptions of local Char people were useful in collecting information on floods, its frequency, depths and durations.
In relation to flood events and from the perspective of the residents, the following factors are of specific importance and these have implications on the engineering design of flood protection structures and flood response strategies:15
a) Frequency of flooding
b) Depth of flooding
c) Duration of flooding
d) Land levels and height of platform
e) Susceptibility of building materials to water
Two types of houses are considered for Char areas (1) EC- Earthen floor, CI sheet wall; and (2) ET- Earthen floor, Thatched wall. Field survey and discussion with CLP personnel suggests the existing proportions of these two house types to be 33 and 67 per cent respectively. The design and cost of raised tube wells and latrines are adopted from CLP. The option will have the provision for one raised tube well and four latrines (one each for four dwellers) on the platform.
Depths and duration of flooding are assumed as follows (based on quick survey in Char areas and Islam (2005, 2006):
Table 12: Important assumptions taken Return period Average depth (above floor level) (Meter) Duration of
flooding (days)
2 Yr Floors not inundated, only courtyard flooded 7 5 Yr 0.30 7 10 Yr 0.61 14 20 Yr 1.22 14 Appropriate deflators of building materials (for structural damage) and national income (for inventory damage) are used in the benefit assessments, to convert to 2007 prices.
15 Knowledge of the maximum flood level in Char areas is critical for the design height of the raised homestead. It is difficult to assess exactly to what extent individual homesteads have to be raised as land level in an area varies considerably from house to house, and location to location. It is also difficult to assess what return period this equates to. In fact, there is no real scientific basis for quick assessment unless there is any detailed-level land use, land level and hydrological survey relating to the area. This is more critical for such a short assignment. However, the maximum flood level has been based upon the living memory of local people as adopted by CLP, which includes a freeboard of 0.6 meter to take into account of, among others, probably climate change impacts on flooding.

Section 6: Cost benefit analysis of adaptation options
109
Adverse impacts of floods on health are considerable as, for example, there is close correlation between flooding extent and incidence of water borne diseases such as diarrhoea and dysentery (r=0.66 with more than 99 per cent significance level). The benefits relating to welfare cannot be quantified. The proposed option has introduced some low-cost and improved water supply and sanitary activities by which protection from water borne diseases will be ensured. Such types of benefits, however, have not been incorporated in the analysis. As regards working life, Government of Bangladesh (2001) suggested for a 25 year life for a project such as this. Table 13: Flood Risk now and in 2020 and 2050 Structural damage (main house) avoided
(2007-TK)
Inventory damage avoided
(2007-TK)
Income loss
(2007-TK)
Other damages avoided*
Sum Prob. baseline
Prob. b1
2020
Prob. b1
2050
591 0 355 0 946 50% 67% 67% 2,366 2,103 710 478 5,657 20% 33% 43% 5,159 5,594 1,419 1,911 14,084 10% 20% 25% 7,468 9,052 1,774 3,822 22,115 5% 11% 13%
Expected losses (TK)
4,118 7,790 9,528
*Other damages include clean-up cost, loss of livestock, trees, gardens and other houses (including livestock shed, kitchen, toilets etc)/ Avoiding impacts up to the 20 year flood (5% recurrency) leads to benefits. These benefits in terms of expected values are tabulated for the baseline, 2020 and 2050 cases in Table 13. As the option has a lifetime of 25 years, a climate-change induced annual increase of 2.6% in losses and benefits based on above calculations was used up to the year 2031 as for the RHD option. Results
Calculating CB-ratios as before for current and future climatic conditions, would lead to the following results in terms of BC ratio (table 14 and 15 and fig. 13).
Table 14: B/C ratio for homestead option for Option A Interest rate 0% 5% 10% 12% 15% 20%
Baseline estimate 2.8 2.1 1.6 1.4 1.3 1.0
Costs +50% 2.4 1.7 1.2 1.1 0.9* 0.7* Costs +50%, benefits – 50% 1.2 0.9* 0.6* 0.6* 0.5* 0.4*
*Not efficient
Table 15: B/C ratio for homestead option for Option B Interest rate 0% 5% 10% 12% 15% 20%
Baseline estimate 3.2 2.6 2.1 1.9 1.7 1.4
Costs +50% 2.9 2.2 1.7 1.5 1.3 1.1 Costs +50%, benefits – 50% 1.4 1.1 0.8* 0.8* 0.7* 0.5*
*Not efficient
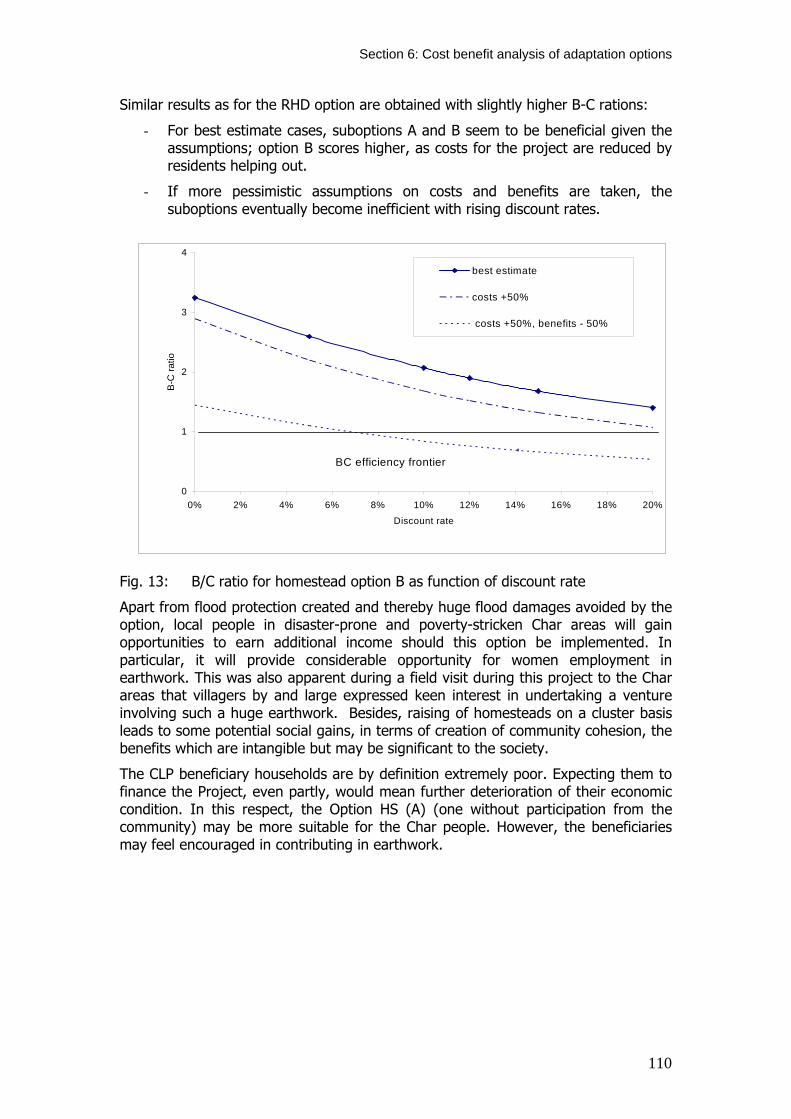
Section 6: Cost benefit analysis of adaptation options
110
Similar results as for the RHD option are obtained with slightly higher B-C rations:
- For best estimate cases, suboptions A and B seem to be beneficial given the assumptions; option B scores higher, as costs for the project are reduced by residents helping out.
- If more pessimistic assumptions on costs and benefits are taken, the suboptions eventually become inefficient with rising discount rates.
0
1
2
3
4
0% 2% 4% 6% 8% 10% 12% 14% 16% 18% 20%
Discount rate
B-C
ratio
best estimate
costs +50%
costs +50%, benefits - 50%
BC efficiency frontier
Fig. 13: B/C ratio for homestead option B as function of discount rate
Apart from flood protection created and thereby huge flood damages avoided by the option, local people in disaster-prone and poverty-stricken Char areas will gain opportunities to earn additional income should this option be implemented. In particular, it will provide considerable opportunity for women employment in earthwork. This was also apparent during a field visit during this project to the Char areas that villagers by and large expressed keen interest in undertaking a venture involving such a huge earthwork. Besides, raising of homesteads on a cluster basis leads to some potential social gains, in terms of creation of community cohesion, the benefits which are intangible but may be significant to the society.
The CLP beneficiary households are by definition extremely poor. Expecting them to finance the Project, even partly, would mean further deterioration of their economic condition. In this respect, the Option HS (A) (one without participation from the community) may be more suitable for the Char people. However, the beneficiaries may feel encouraged in contributing in earthwork.

Section 6: Cost benefit analysis of adaptation options
111
6.5 CONCLUSIONS
Methodology
This chapter discussed the appraisal of economic efficiency of selected adaptation options to extreme climate-related event risks of the DFID development assistance portfolio in Bangladesh via Cost-Benefit Analysis (CBA). The methodology developed was tested as a pilot study for selected intervention options within the DFID Bangladesh portfolio as part of the ORCHID project. Such an approach may inform the prioritization and implementation of cost-effective disaster risk management and climate adaptation (“no-regret”) options that help with coping with current and future extreme events as possibly increased in intensity and/or frequency by climate change.
Economic risk and the economic efficiency of selected adaptation options of the DFID development assistance portfolio in Bangladesh is estimated by means of Cost-Benefit Analysis (CBA) accounting for uncertainty and dynamic driving forces of hazards, vulnerability and exposure. A key concept employed in this analysis is the probabilistic representation of risk and benefits of risk reduction by loss-frequency functions. For valuing benefits of public sector interventions, the expressed preference-approach was used using available market prices for goods, such as used for reconstructing a damaged building. This involves adding up potential avoided impacts in terms of reconstruction costs. The revealed preference approach is more common and followed for disaster risk management due to the general availability of some data, while for the alternative revealed preference method, specific surveys would be required.
Two frameworks for the estimation and monetary quantification of disaster risk for the purposes of a CBA were presented:
• The more rigorous risk-based framework (forward-looking, risk-based) combining data on hazard and vulnerability (fragility and exposure) to an estimate of risk and risk reduced; and
The more pragmatic impact-based framework relying on past damages (backward-looking, impact-based), focusing on past damages and modifying those to come to a first-order understanding of risk.
The appropriate approach to be used depends on the objectives of the specific CBA conducted, the data situation and available resources and expertise.
Estimating extreme event risk and the benefits of risk reduction is fraught with substantial uncertainty, particularly so in this case, as disasters by definition are low-frequency, high consequence events. Uncertainties are among others associated with estimates of hazard and changes thereof, for example due to climate change, exposure of assets and people, fragility (the degree of damage for a given level of hazard intensity, the benefits of risk reduction, the proper choice of the discount rate and different cost concepts used for valuing impacts. In this assessment, due to data limitations and the scope of the study, it was not possible to conduct a quantitative uncertainty analysis (for example using confidence intervals); rather, sensitivity analysis was used to vary costs and benefits of options as well as the discount rate. The sensitivity of results to assumptions of those parameters and variables (as often in CBAs) was found to be considerable.
Results

Section 6: Cost benefit analysis of adaptation options
112
In order to set the stage for the CBA analysis and specific adaptation options, aggregate risk of flooding for economic asset risk for all of Bangladesh for now, in 2020 and 2050 under possible climate change is conducted. Economic assets losses today are estimated to amount to 0.6% when measured as a ratio of GDP with a 50 year event (an event with an annual recurrency probability of 2%) possibly consuming about 5.8% of GDP. In the future, based on estimations of increasing frequency of flooding in Bangladesh due to climate change these losses may increase or decrease depending on the amount of adaptation assumed. If no adaptation is assumed (as is standardly done in similar assessments), annual average losses could increase to 0.7% and 0.75% of GDP in 2020 and 2050 (50 year events: 7.0 and 7.3% GDP). If significant adaptation as in the past, where for example, loss of life per event was reduced by two orders of magnitude over a 30 year period, is assumed, annual losses would decrease to 0.5 and 0.2% of GDP for 2020 and 2050 (50 year events: 4.6 and 1.9%). Uncertainty around these estimates and the assumptions utilized, while hard to quantify, is considerable and should be kept in mind. Accordingly, numbers should be understood in terms of orders of magnitude.
These estimates indicate the importance of adaptation (and assumptions on it) have for thinking about climate change and climate change policy. The representation of adaptation in this top-down assessment of necessity is broad-brushed, locale-unspecific and based on adaptation that occurred in the recent past. A key question for this assessment and the adaptation discussion in general (for example see Stern, 2007) is the scope for such adaptation and whether it will occur autonomously or in a planned manner. In order to shed more light on these crucial issues, CBAs for two specific ongoing and planned adaptation options within the DFID-Bangladesh portfolio were analyzed in a more risk-based, bottom-up approach.
The first option considered was the flood-proofing of roads and highways by raising this infrastructure above the highest ever-recorded flood levels within the DIFD-sponsored programme “Roads and Highways Policy Management, budgetary and TA Support” (RHD). Specifically, some 170 Km of national and regional roads and some 518 Km of district (feeder) roads in high risk areas will be raised by 1m. Further, about 124km of national and regional roads in low risk area will be raised by 0.5m. As the option comprises a long-term programme and since the costs would be very high if incurred at one time, it proposes action when a particular road is due for major maintenance or re-surfacing, with priority given to high risk areas. The maintenance of these assets and protecting them against disasters such as floods is a fundamental requirement for the economy to sustain.
Benefits considered were the avoided infrastructural rehabilitation costs due to floods. Although an option with national scope, specific fragility and risk functions are employed for estimating risk and risk reduced. Furthermore, increases in hazard frequency as determined in section 5 are studied and are taken to increase risk by 2.6% per annum. Although very costly, the flood-proofing of RHD investments seems to be efficient given the assumptions taken. For the best estimate case, a range of 1.2-2.7 is calculated; thus for this set of assumptions, the option would be beneficial. It would mostly still be larger than 1 with more pessimistic assumptions such as costs increasing by 50%. If however, under very pessimistic assumptions, costs are increased and benefits are supposed to be decreased by 50%, then for all discount rates considered the option would not be efficient anymore. This exemplifies the need, given lack of better data, for varying input parameters and studying the sensitivity of results.
Also, apart from protecting roads infrastructure and losses in case of an event, the roads raising option will also create a number of direct and indirect benefits, which are not factored into the analysis, but would increase benefits and should be kept in

Section 6: Cost benefit analysis of adaptation options
113
mind. These are intangible social benefits such as the avoidance of loss of human lives and livestock, use as a refuge during the emergency period and the reduction of stress and sufferings of flood victims, avoided inventory damage, transport benefits as traffic disruption is limited and finally poverty reduction benefits through employment generation.
The second option considered in this analysis involves the flood proofing individual homesteads against a maximum of 20 year floods on riverine islands, known as Chars, in Bangladesh. The option is already under implementation as part of the Chars Livelihoods Programme (CLP) and involves constructing earth platforms on beneficiaries land for the unit of a bari (homestead with 4 households). The lives of the Char people are closely related to the dynamics of the river flows and the resultant formation and erosion of Chars. Thus, Char communities are extremely vulnerable to erosion and flooding. With this background, the CLP aims to improve the livelihood of the poor in the Char areas by reducing vulnerability of dwellers, through targeted provision of, among others, infrastructures thereby improving the resilience of the community to environmental shocks. However, these people have the least resources to afford to build such infrastructures and thus need public and donor support.
The homestead option was divided into two sub-options depending on whether or not the community will bear any costs associated with this. Under the Option A, the CLP project will raise one common platform for 4 dwellings, each with 150 M2 area and will reconstruct individual houses. Other infrastructure provision such as tube wells and sanitation will also be constructed by the project. Under Option B, the project will only raise the common platform while the beneficiaries will reconstruct their individual houses, including making other infrastructure provision such as tube wells and sanitation. The analysis is carried out for both the cases.
Economic damages considered and benefits as they are avoided were:
- Structural damages to the dwellings house,
- Inventory damage avoided,
- Income loss, and
- Other damages avoided such as clean-up costs.
Similar results as for the RHD option are obtained with slightly higher B-C ratios.
- For the best estimate cases, options A and B seem to be beneficial given the assumptions and a range of BC ratios of 14.-3.2 was calculated; option B scored higher, as the costs for the project are reduced by residents helping out.
- If more pessimistic assumptions on costs and benefits are taken, the suboptions eventually become inefficient with rising discount rates.
Apart from flood protection created and thereby huge flood damages avoided by the option, local people in disaster-prone and poverty-stricken Char areas will gain opportunity to earn additional income should this option be implemented. In particular, it will provide considerable opportunity for women employment in earthwork. This is also apparent during our field visit to Char areas that villagers by and large expressed keen interest in undertaking a venture involving such a huge earthwork. Besides, raising of homesteads on a cluster basis leads to some potential social gains, in terms of creation of community cohesion, the benefits which are intangible but may be significant to the society.
Section 6: Cost benefit analysis of adaptation options
114
Outlook
Extreme events, their potential impacts and the scope for adaptation are gaining in importance in the policy debate on climate change, also due to increasing empirical evidence and studies on climate change-induced increases in intensity and frequency of extremes such as cyclones and flooding. The representation of extreme event risk and adaptation within modelling approaches is emerging, but there is considerable scope for making better use of improved modelling of extremes in a risk-based, more geographical explicit manner harnessing recent innovations and improvements in modelling techniques and data.
The climate change modelling community is embracing a more risk-based approach, regional climate modelling as well as climate and socio-economic downscaling techniques are increasingly being utilized; furthermore the climate change community is increasingly linking up with the natural hazards community for modelling natural disaster risk as a function of a geophysical signal, socioeconomic drivers and vulnerability in a stochastic framework accounting for the inherent variability of natural hazards via loss-frequency functions. Such a stochastic representation (cognizant of parameter and modelling uncertainties) of extreme event risks more appropriately reflects the low-probability, high consequence nature of such events. In that manner, this assessment of the costs and benefits of adaptation to climate variability and change as conducted for the DFID ORCHID project for Bangladesh should be understood as an exploration of these issues and with improvements in data and modelling techniques may contribute to planning for helping hazard-prone societies better adapt to climate variability and change. Acknowledgements Advice and support by the following people and institutions is gratefully acknowledged: • Transport Sector Management Reform (TSMR), Dhaka • Dr. Jelle van Gijn, TSMR, Dhaka • Engr. Iftekhar Ahmed Khan • Engr. Aminul Islam, RHD • Mr. Mosharaf Hossain, Social Development Officer, CLP • Mr. Zubair Haque, Infrastructure Development Manager, CLP • Mr. M A Sekendar, Senior Infrastructure Engineering Advisor, CLP • Mr. Abdul Momin, Contacts Manager, CLP • CLP beneficiaries including key-informants
Section 6: Cost benefit analysis of adaptation options
115
6.6 SECTION 6 REFERENCES
Ahmad, Q. K., Warrick, R. A., Ericken, N. J. and Mirza, M. Q. (1996). “The
Implications of Climate Change for Bangladesh: A Synthesis”, In R. A. Warrick and Q. K. Ahmad (eds) The Implications of Climate and Sea-level Change for Bangladesh, Kluwer Academic Publishers, London.
Ahmed, I. (1999) (ed). Living with Floods, An Exercise in Alternatives, University Press Limited, Dhaka.
Asaduzzaman, M. (1993). "Sea Level Rise in Bangladesh: Socio-economic Issues and Implications", Paper presented at the IOC/UNDP Workshop on Impact of Rise in Sea Level and Temperature Increases due to Global Warming on Coastal Zone in the South Asian Sea Region, January, Dhaka.
Asian Development Bank-ADB (1994). Climate Change in Asia: Bangladesh Country Report, Regional Study on Global Environmental Issues, Manila, Philippines.
Asian Development Bank-ADB and The World Bank (2005). 2004 Floods in Bangladesh, Damage and Needs Assessment and Proposed Recovery Program, January, Dhaka.
Bangladesh Bureau of Statistics (BBS). Various Yearly Issues, Statistical Year Book of Bangladesh, Dhaka.
Bension and Clay (2004). Understanding the Economic and Financial Impacts of Natural Disasters, The World Bank, Washington.
Brammer, H. (1990a). “Floods in Bangladesh I - Geographical Background to the 1987 and 1988 Floods”, The Geographical Journal, Vol 156, No 1, 12-22.
- (1990b). “Floods in Bangladesh II - Flood Mitigation and Environmental Aspects”, The Geographical Journal, July, Vol 156, No 2, 158-156.
Brooks, N., Adger, W N. and Kelly P M (2004). The Determinants of Vulnerability and Adaptive Capacity at eh National Level and Implications for Adaptation, Global Environmental Change, East Anglia
Brouwer, R., Aftab, S. and Brander, L. (2006). Socio-economic Vulnerability and Adaptation to Environmental Risk, A Case Study of Climate Change and Flooding in Bangladesh, PREM Working Paper, Amsterdam.
Centre for Policy Dialogue, CPD (2005) Options for Self-reliant Resurgence: CPD's Rapid Assessment of Flood 2004, January, UPL, Dhaka.
Centre for Research on the Epidemiology of Disasters (CRED) ‘Emergency Disaster Database’ htt//www.em-dat.net.
Chowdhury, O. H., Islam, K. M. N. and Bhattacharya, D. (1999). The Impacts of 1998 Floods on Bangladesh Economy -a Rapid Assessment, Asian Development Bank, Dhaka.
Department for International Development (DFID) (2005). Natural Disaster and Disaster Risk Reduction Measures, A Desk review of Costs and Benefits.
ERM (2002). Predicted Impact of Global climate Change on Poverty and the Sustainable Achievements of the Millennium Development Goals, Report prepared for DFID by Environmental Resources Management, London.
Few, R., Ahern, M., Matthies, F. and Kovats, S. (2004). Floods, Health and Climate Change: A Strategic Review, Working Paper 63, Tyndall Centre for Climate Change Research, Norwich, UK.
Government of the People's Republic of Bangladesh (2006). Bangladesh Economic Review. Economic Advisor’s Wing, Finance Division, Ministry of Finance,.

Section 6: Cost benefit analysis of adaptation options
116
- (2005). National Adaptation Programme of Action (NAPA), Final Report, Ministry of Environment and Forest, Dhaka.
- (1992), Flood Response Study, FAP-14, Final Report and Planning Guidelines, ISPAN, Dhaka.
- National Water Management Plan- NWMP (2001), Vol. 3, Investment Portfolio, Ministry of Water Resources, December, Dhaka
Guha-Sapir, D., Hargitt, D. and Hoyois, P. (2004). Thirty Years of Natural Disasters 1974-2003: The Numbers, Presses Universitaires de Louvain, Belgium.
Intergovernmental Panel on Climate Change (IPCC) (2002). Climate Change 2001:Impacts, Adaptation, and Vulnerability, Summary for Policy makers, A Report of Working Group II of the IPCC, Geneva, IPCC.
Intergovernmental Panel on Climate Change (IPCC) (1990). Policymakers Summary, In J. T. Houghton, G. J. Jenkins and J. J. Ephraums (eds) Climate Change: The IPCC Scientific Assessment, Cambridge University Press, Cambridge, UK.
International Federation of Red Cross and Red Crescent Societies IFRC (2004). World Disasters Report, Focuses on Community Resilience.
Islam, K. M. Nabiul (2006). Impacts of Flood in Urban Bangladesh, Micro and Macro Level Analysis, A H Development Publishing House and Community Development Library, Dhaka, July
- (2005). Flood Loss Potentials in Non-agricultural Sectors, Assessment Methods and Standard Loss Database for Bangladesh, Palok Publishers, Dhaka, February.
- (2000). "Micro and Macro Level Impacts of Urban Floods in Bangladesh", In D. J. Parker (ed) Floods, Volume I, Chapter 9, UN-International Decade for Natural Disasters Reduction (IDNDR), Routledge, London and New York.
- (1997). The Impacts of Flooding and Methods of Assessment in Urban Areas of Bangladesh, Ph.D. Thesis, Flood Hazard Research Centre, Middlesex University, London, UK.
Islam, M. R. (2004) (ed). Where Land Meets the Sea, A Profile of the Coastal Zone of Bangladesh, PDO-ICZMP, WARPO, University Press Limited, Dhaka.
Kabat, P., Schulze, R. E., Hellmuth, M. E. and Veraat, J. A. (2002) (ed). Coping with Impacts of Climate Variability and Climate Change in Water Management: A Scoping Paper, Wageningen.
Kausher, A., Kay, R. C., Asaduzzaman, M. and Paul, S. (1996). “Climate Change and Sea-level Rise: The Case of the Coast”, In R. A. Warrick and Q. K. Ahmad (eds), The Implications of Climate and Sea-level Change for Bangladesh, Kluwer Academic Publishers, London, 335-396.
Mechler, R. (2005). Cost-Benefit Analysis of Natural Disaster Risk Management on Developing Countries, Disaster Risk Management in Development Cooperation, Working Paper, August.
Nishat, A., Reazauddin M., Amin, R. and Khan, A. R. (eds) (2000). The 1998 Flood : Impact on Environment, Department of Environment and IUCN, Dhaka.
Siddiqui, K. U. and Hossain, A. N. H. A. (2006) (eds). Options for Flood Risk and Damage Reduction in Bangladesh, University Press Limited, Dhaka.
Warrick, R. A. and Ahmad, Q. K. (1996) (eds). The Implications of Climate and Sea-level Change for Bangladesh, Kluwer Academic Publishers, London.
Water Resources Planning Organization (2000). Draft Development Strategy: Annex M: Technical Options, Annex N: Project Profiles, Vol.10, National Water Management Plan Project, Halcrow, Mott MacDonald, , December, Dhaka

Section 6: Cost benefit analysis of adaptation options
117
World Bank (2006).World Development Indicators
World Bank (1989). Bangladesh Action Plan for Flood Control, Main Report, Dhaka
World Disasters Report (2006). Equity and Development

Section 7: Adaptation options assessment
118
Section 7: Adaptation Options Assessment This section is authored by Thomas Tanner1, Mozaharul Alam2 and Declan Conway3
1 Institute of Development Studies, University of Sussex 2 Bangladesh Centre for Advanced Studies (BCAS), Dhaka
3School of Development Studies-Overseas Development Group and Tyndall Centre for Climate Research, University of East Anglia
7.1 SUMMARY INTRODUCTION
This options assessment followed an initial screening exercise described in Section 1, during which ten interventions were flagged as high priority for further climate risk assessment. These projects include:
− Char Livelihoods Programme (CLP) − Economic Empowerment of the Poorest (EEP) − Private Sector Development Support Project (PSDSP now RISE) − Promoting Financial Services for Poverty Reduction (PROSPER) − Rural Infrastructure Improvement Project (RIIP II) − UPHC II (Second Urban Primary Health Care Programme) − PEDP II (Primary Education Development Programme) − English in Action (EIA) − Samata (Land Rights programme) − Roads and Highways Policy Management, budgetary and TA Support (RHD)
For these ten interventions, an assessment of project documents was combined with scientific inputs described in Section 3-5 to create a range of potential options to facilitate climate change adaptation and disaster risk reduction in the context of planned or ongoing activities. These were worked through with DFID-B staff using guiding criteria to work through aspects of the options. These criteria, developed at a national expert meeting in September 2006, are presented below and included consideration of feasibility, cost effectiveness, ‘win-win’ options that addressed current priorities as well as future risks due to climate change, and coherence with national policies, among others.
Criteria and Indicator Rating Win-win options Does option addresses current climate variability and future climate change?
1 = based only current, or only future risks 2 = current and future
Existing risk management Is the option consistent with existing risk management activities?
1=No 2=Yes
Cost effectiveness Can costs and benefits of option be easily determined?
1=No 2=Yes
Adaptive flexibility Does the option focus on narrow range of future scenarios, or allow flexibility of response?
1=narrow 2=flexible
Unintended impacts Potential negative spin-off impacts beyond targeted activity?
1=High 2=Low
Practical considerations Is the option practical and feasible for donor, partner and implementer?
1=More problematic 2=Relatively simple
Knowledge level How certain we are in predicting a particular change in hazard and its impact?
1=Low 2=High
Policy Coherence Does option reflect local and national DRR / adaptation plans or studies?
1=Low 2=High
Total score

Section 7: Adaptation options assessment
119
The result was the production of a set of high-performing recommendations for integration of climate change adaptation and disaster risk reduction in individual interventions. These can be arranged into a broad typology that include strategic changes to interventions, structural measures and non-structural measures. This is shown in table 2, below.
The remainder of this report then provides summary assessment reports on these recommendations by intervention. The summaries include general comments; specific recommendations with detail, methods, potential inputs for monitoring and indicators, entry points and follow-up; an annotated criteria table; and a table of further relevant information.
Table 2: Typology of Adaptation and Risk Reduction Options Strategic and Planning o Strategic recommendations regarding the programme as a whole (see Section 2) o Integration within guidelines/criteria for challenge funds (eg EEP, PROSPER, CDMP) o Disaster-assessment in land-use planning: (eg Shamata)
Structural o Developing and implementing risk-specific infrastructure design (eg RISE, CHARS, RIIP2, UPHCP2,
PEDP2). o Improving enforcement and regulation of existing design guidelines (eg RHD)
Non-Structural o Livelihoods diversification (eg CHARS) o Research, monitoring and data collection (eg UPHCP2, CLP) o Education, training, dissemination (eg CLP, EIA) o Working with other programmes (eg most programmes, CDMP)
7.2 CHARS LIVELIHOODS PROGRAMME General Comments: The screening exercise highlighted the extent to which the CLP already includes direct and indirect measures to tackle disaster and climate change risks. This screening therefore to a large extent reinforces the existing focus of the programme of reducing climate-related vulnerability in a livelihoods context. Much of these recommendations therefore provide an added impetus to consider climate-related shocks and stresses and their impacts, and to include a longer term view regarding future impacts of climate change. The homestead-raising activities, in which home are raised onto mud banks above the 10 year flood level, are already underway and demonstrate how the programme is tackling vulnerability to today’s climate. Note that the term ‘climate proofing’ is used here with full acknowledgement that making investments fully climate proof may be neither attainable nor cost effective. Rather it is used as shorthand to refer to a process to increase resilience by means of an assessment of risks and uncertainties Recommendation 1: Improved ‘Climate proofing’ infrastructure in the Chars
Subject: Addressing climate risks to infrastructure related to the project.
Details: Under Output 1, CLP has a significant component related to infrastructure development. IN the Chars, infrastructure already suffers regular negative impacts from climate-related shocks and
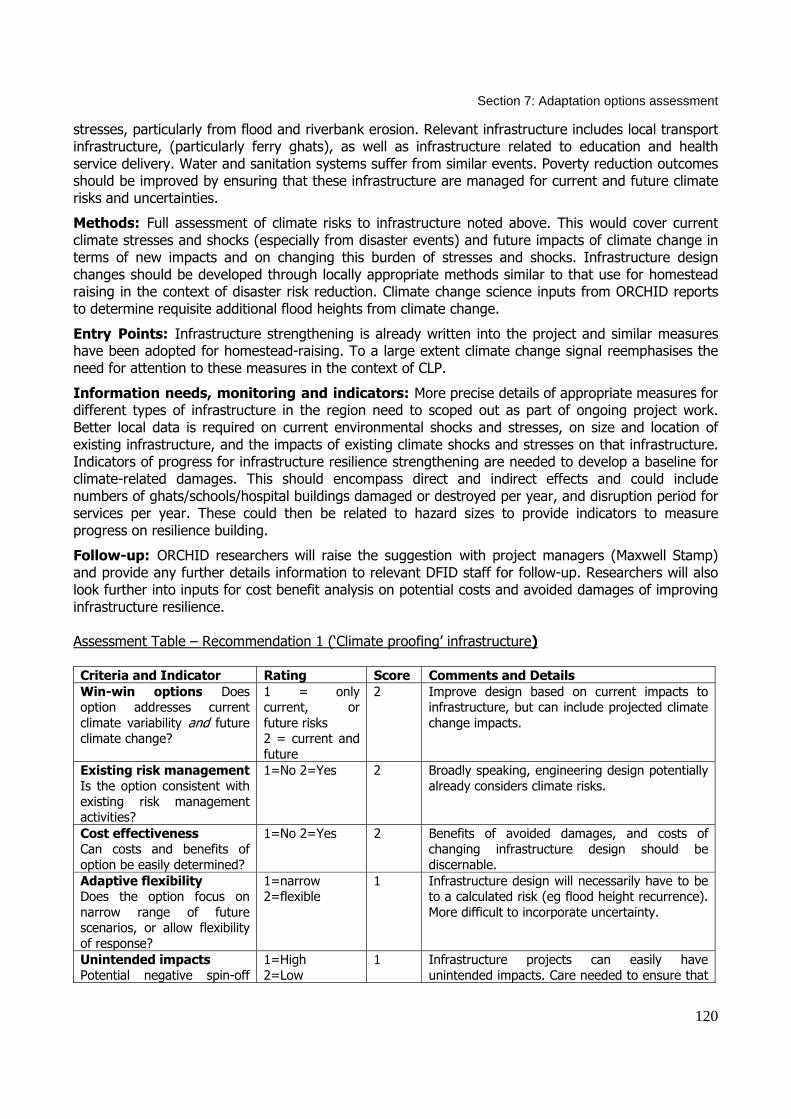
Section 7: Adaptation options assessment
120
stresses, particularly from flood and riverbank erosion. Relevant infrastructure includes local transport infrastructure, (particularly ferry ghats), as well as infrastructure related to education and health service delivery. Water and sanitation systems suffer from similar events. Poverty reduction outcomes should be improved by ensuring that these infrastructure are managed for current and future climate risks and uncertainties.
Methods: Full assessment of climate risks to infrastructure noted above. This would cover current climate stresses and shocks (especially from disaster events) and future impacts of climate change in terms of new impacts and on changing this burden of stresses and shocks. Infrastructure design changes should be developed through locally appropriate methods similar to that use for homestead raising in the context of disaster risk reduction. Climate change science inputs from ORCHID reports to determine requisite additional flood heights from climate change.
Entry Points: Infrastructure strengthening is already written into the project and similar measures have been adopted for homestead-raising. To a large extent climate change signal reemphasises the need for attention to these measures in the context of CLP.
Information needs, monitoring and indicators: More precise details of appropriate measures for different types of infrastructure in the region need to scoped out as part of ongoing project work. Better local data is required on current environmental shocks and stresses, on size and location of existing infrastructure, and the impacts of existing climate shocks and stresses on that infrastructure. Indicators of progress for infrastructure resilience strengthening are needed to develop a baseline for climate-related damages. This should encompass direct and indirect effects and could include numbers of ghats/schools/hospital buildings damaged or destroyed per year, and disruption period for services per year. These could then be related to hazard sizes to provide indicators to measure progress on resilience building.
Follow-up: ORCHID researchers will raise the suggestion with project managers (Maxwell Stamp) and provide any further details information to relevant DFID staff for follow-up. Researchers will also look further into inputs for cost benefit analysis on potential costs and avoided damages of improving infrastructure resilience. Assessment Table – Recommendation 1 (‘Climate proofing’ infrastructure) Criteria and Indicator Rating Score Comments and Details Win-win options Does option addresses current climate variability and future climate change?
1 = only current, or future risks 2 = current and future
2 Improve design based on current impacts to infrastructure, but can include projected climate change impacts.
Existing risk management Is the option consistent with existing risk management activities?
1=No 2=Yes 2 Broadly speaking, engineering design potentially already considers climate risks.
Cost effectiveness Can costs and benefits of option be easily determined?
1=No 2=Yes 2 Benefits of avoided damages, and costs of changing infrastructure design should be discernable.
Adaptive flexibility Does the option focus on narrow range of future scenarios, or allow flexibility of response?
1=narrow 2=flexible
1 Infrastructure design will necessarily have to be to a calculated risk (eg flood height recurrence). More difficult to incorporate uncertainty.
Unintended impacts Potential negative spin-off
1=High 2=Low
1 Infrastructure projects can easily have unintended impacts. Care needed to ensure that

Section 7: Adaptation options assessment
121
impacts beyond targeted activity?
measures do not inadvertently enhance vulnerability in other sectors.
Practical considerations Is the option practical and feasible for donor, partner and implementer?
1=More problematic 2=Relatively simple
2 Programme already aware of climate risks and active in risk management. Needs extension to infrastructure development component.
Knowledge level How certain we are in predicting a particular change in hazard and its impact?
1=Low 2=High
2 Relatively good projections for impact of climate change on floods, which is the main hazard. Data on past flood events impact on infrastructure in region unknown.
Policy Coherence Does option reflect local and national DRR / adaptation plans or studies?
1=Low 2=High
2 NAPA has project on infrastructure strengthening.
Total score 14 Recommendation 2: Action research on migration flows in Chars region
Subject: Action research into current migratory flows in Chars and how these can be harnessed as a livelihoods opportunity.
Details: Current migratory flows, both permanent and seasonal, are used as coping strategies, both as a result of asset losses from climate shocks and stresses, and particularly to cope with seasonal hunger during monga season. CLP could extend its work on contributing to monga eradication (currently mostly through public works) to facilitating migration strategies. Enhancing free market mobility provides a strategy that is more sustainable in the long term, as well as enabling permanent migration for displaced families. Research would form the basis of integrating migration flows into further CLP activities.
Methods: Household survey to determine existing patterns of seasonal and non-permanent migration. Action research methods to analyse the incentives and drivers for different forms of migration within households, stratified by poverty level. Modelling of climate-related determinants of migration.
Entry Point: Research, monitoring, and information dissemination to support an evidence-based policy influencing process at the national level is included within Output 3 of CLP. This research would be integrated within the existing programme as a topic under Output 3.
Migration is already touched on in project, especially as a monga coping strategy. This study would provide the basis for expansion work targeting migration by providing empirical data on the barriers and opportunities to migration as a coping strategy in the Chars.
Information needs, monitoring and indicators This recommendation would integrate empirical data on migration patterns as part of core programme research and monitoring under Output 3. Recommend inclusion of migration data as part of project monitoring. Project indicators could include rates of seasonal and semi-household migration, remittance contributions as a percentage of hhold incomes, numbers of households permanently and temporarily displaced per year by climate shocks and stresses. Follow-up: Research team to raise with project managers (Maxwell Stamp) and liaise with institutions already active in migration research in Bangladesh (specifically the Migration Development Research Centre at University of Sussex). Assessment Table – Recommendation 2 (Migration research)

Section 7: Adaptation options assessment
122
Criteria and Indicator Rating Score Comments and Details Win-win options Does option addresses current climate variability and future climate change?
1 = only current, or future risks 2 = current and future
2 Improved knowledge of migration drivers and patterns will improve present outcomes. By analysing drivers, projected increases in climate-driven migration can be made.
Existing risk management Is the option consistent with existing risk management activities?
1=No 2=Yes
2 Yes, uses existing migration drivers and responses as central.
Cost effectiveness Can costs and benefits of option be easily determined?
1=No 2=Yes
1 Costs and benefits not easily disaggregated or determined.
Adaptive flexibility Does the option focus on narrow range of future scenarios, or allow flexibility of response?
1=narrow 2=flexible
2 Migration responses are flexible to wide range of scenarios of future shocks and stresses.
Unintended impacts Potential negative spin-off impacts beyond targeted activity?
1=High 2=Low
2 Low from this activity, but longer term facilitation of migration must be coupled with service provision in areas of in-migration (esp urban services).
Practical considerations Is the option practical and feasible for donor, partner and implementer?
1=More problematic 2=Relatively simple
2 Programme already aware of climate shocks and stresses, migration issues are within project remit.
Knowledge level How certain we are in predicting a particular change in hazard and its impact?
1=Low 2=High
2 Relatively good projections for impact of climate change on floods and river-bank erosion, which are the main hazards.
Policy Coherence Does option reflect local and national DRR / adaptation plans or studies?
1=Low 2=High
1 Migration not key consideration in national policy on disasters and climate change.
Total score 14 Recommendation 3: Climate-proofing livelihoods diversification and enterprise
Subject: Ensuring that livelihood diversification and enterprise development activities do not increase vulnerability by over-emphasising climate-sensitive sectors. Inclusion of activities to reduce vulnerability by reducing exposure (people and assets exposed) and fragility (damages suffered to exposed people and assets) to climate hazards.
Details: Output 2 of CLP is a livelihoods strengthening component focusing on enterprise development and livelihoods diversification. If these activities are all developed in areas that are climate-sensitive (such as agricultural development), there is a danger that they could inadvertently increase risks from climatic hazards. Similarly, these livelihoods an enterprise components can actively seek to address climate-related vulnerability reduction, particularly among the
Methods: Use of participatory vulnerability assessment tools to establish key vulnerabilities and develop locally appropriate responses that reduce vulnerability and enable poverty reduction. Development of easy to understand guidelines on climate risk reduction in the context of livelihoods

Section 7: Adaptation options assessment
123
and enterprise activities. Application as an over-arching component of output 2 of CLP in its future development.
Entry Point: Integrated within the existing activities relating to diversification and enterprise development in the CLP, which are in early stages of development.
Information needs, monitoring and indicators: Integrate climatic impacts on livelihoods within project monitoring. Indicators of livelihood resilience to be developed by project for wider range o shocks and stresses
Follow-up: Research, monitoring, and information dissemination to support an evidence-based policy influencing process at the national level is included within Output 3 of CLP. This research would be integrated within the existing programme as a topic under Output 3. Follow-up on next steps with project managers (Maxwell Stamp). Assessment Table – Recommendation 3 (Livelihoods and Enterprise) Criteria and Indicator Rating Score Comments and Details Win-win options Does option addresses current climate variability and future climate change?
1 = only current, or future risks 2 = current and future
2 Addresses both by reducing climate sensitivity of livelihoods
Existing risk management Is the option consistent with existing risk management activities?
1=No 2=Yes
2 Where they exist, particularly in agric.
Cost effectiveness Can costs and benefits of option be easily determined?
1=No 2=Yes
1 Costs and benefits not easily disaggregated without further research on climatic impacts to livelihoods.
Adaptive flexibility Does the option focus on narrow range of future scenarios, or allow flexibility of response?
1=narrow 2=flexible
2 Diversification out of climate sensitive sectors flexible to wide range of scenarios of future shocks and stresses.
Unintended impacts Potential negative spin-off impacts beyond targeted activity?
1=High 2=Low
2 Expected to be low, although enterprise development in flood prone locations may be an issue.
Practical considerations Is the option practical and feasible for donor, partner and implementer?
1=More problematic 2=Relatively simple
2 Programme already aware of climate shocks and stresses, diversification and enterprise are already within project remit.
Knowledge level How certain we are in predicting a particular change in hazard and its impact?
1=Low 2=High
2 Relatively good projections for impact of climate change on floods and river-bank erosion, which are the main hazards.
Policy Coherence Does option reflect local and national DRR / adaptation plans or studies?
1=Low 2=High
2 Mainstreaming into other sectors and promoting drr at community level. No specific NAPA project.
Total score 15
Recommendation 4: Integration of climate issues into awareness-raising activities of CLP
Subject: Incorporating issues of climate change, climate variability and extreme events (especially floods and erosion) into CLP training module, dissemination and awareness-raising activities.

Section 7: Adaptation options assessment
124
Details: Climate change and disasters issues and their relation to Char-dwellers included as priority for inclusion in strategy to influence local and national policy.
Methods: Research into local awareness of and experience of climate risks. Development of briefing information on how climate change and disasters relates to char-dwellers, informed by a participatory vulnerability assessment and climate science inputs (ORCHID science inputs as a basis for science). Possible collaboration with CMDP work on Community Risk Assessments. Subsequent preparation of materials, dissemination and awareness-raising activities to be employed.
Entry Point: Integrated within the existing activities in Output 3 of CLP relating to training module, dissemination and awareness-raising
Information needs, monitoring and indicators: Baselines of current experiences and risk perception, and levels of awareness need to be developed as part of project activities. Indicators should relate to actions taken to reduce risk as a consequence (eg evidence of adaptive practices).
Follow-up: Researchers to follow-up on viability with project managers (Maxwell Stamp).
Assessment Table – Recommendation 4 (Awareness raising)
Criteria and Indicator Rating Score Comments and Details Win-win options Does option addresses current climate variability and future climate change?
1 = only current, or future risks 2 = current and future
2 Potential to address both
Existing risk management Is the option consistent with existing risk management activities?
1=No 2=Yes
2 Yes, will build on existing risk mment at hhold, community, and local govt levels
Cost effectiveness Can costs and benefits of option be easily determined?
1=No 2=Yes
1 Costs and benefits not easily disaggregated.
Adaptive flexibility Does the option focus on narrow range of future scenarios, or allow flexibility of response?
1=narrow 2=flexible
2 Potential wide range of options suited to local conditions. Need to ensure materials are not prescriptive in directing adaptation as one size fits all.
Unintended impacts Potential negative spin-off impacts beyond targeted activity?
1=High 2=Low
2 Expected to be low.
Practical considerations Is the option practical and feasible for donor, partner and implementer?
1=More problematic 2=Relatively simple
2 Programme already aware of climate shocks and stresses, awareness, education and influence components are already within project remit.
Knowledge level How certain we are in predicting a particular change in hazard and its impact?
1=Low 2=High
2 Relatively good projections for impact of climate change on floods and river-bank erosion, which are the main hazards in the region.
Policy Coherence Does option reflect local and national DRR / adaptation plans or studies?
1=Low 2=High
2 NAPA recommends project on ‘climate change and adaptation information dissemination to vulnerable community to raise awareness’ as a national priority.
Total score 15

Section 7: Adaptation options assessment
125
Project name: Bangladesh Char Livelihood Programme (CLP)
FURTHER INFORMATION
Brief project description:
The goal of the Char Livelihood Programme is to halve extreme poverty in the riverine areas of Bangladesh by 2015. The programme purpose is to improved livelihood security for poor and vulnerable women, men and children living within the riverine areas of 5 districts of the northern Jamuna.
It will directly target 6.5 million people - 2 million in the chars and a further 4.5 million non-char people living in the 166 local government councils (union parishads) which include chars and unprotected embankments alongside the Brahmaputra. Traditional development approaches are rarely successful in the chars, and this programme will develop new approaches and institutional arrangements for reducing poverty in the region.
It is expected that char dwellers and poor people from adjacent areas will be better able to withstand the shocks and stresses; they will have increased access to better quality services, higher incomes, more assets and less ill-health as a result of different activities. They will have better skills, and be better able to manage productive activities, access markets and financial services, take care of their families or find employment. They will more effectively participate in planning, decision making and exercise their rights and choice to select alternative services or livelihood options.
Sector (where applicable):
Natural resources (agriculture), human development (service provision), infrastructure
Geographical location:
This programme is being implemented on the Brahmaputra Chars, northern Bangladesh, working in five districts (Kurigram, Jamalpur, Gaibandha, Bogra, and Sirajganj).
Time-frame, budget and investment period :
GBP 50 million, March 2004 to June 2011, expected investment period for infrastructure 20 years.
Activities summary:
The CLP programme will implement a number of activities to achieve three broader outputs to:
o Reduce vulnerability of char dwellers through targeted provision of infrastructure and services,
o Effectively sustain livelihoods and engage in the local and national economy,
o Effectively influence local and national policy and service provision as citizens’.
In order to achieve project objectives, it will implement both locations specific and chars-wide activities. Examples of the locations specific activities are enterprise development and livelihoods diversification while transport, communications, and delivery of services such as health and education are chars-wide.
Activities for Output 1.
Interventions will be carried out for individual community needs (e.g. local disaster prevention and response) and others will be more char-wide perspective (e.g. communications). Example of activities are:
o Assistance to overcome livelihood shocks as short-term measures and providing additional resources for union parishad infrastructure improvements;
o Improvement of communications, including radio broadcasting; improvements in major ferry ghats and improved disaster management systems;
o Establishment of partnership-based primary health care services; development of a more flexible education and training delivery strategy.
Activities for Output 2.

Section 7: Adaptation options assessment
126
There are two main components: Livelihoods strengthening, and enterprise development.
Livelihoods strengthening component targets both the highly vulnerable groups (‘declining poor’) and those with some assets (‘coping and improving poor’) who have the ability to improve and diversify their agriculture based livelihoods. The types of interventions anticipated for declining poor include; training, literacy for livelihoods and also the extension of appropriate economic diversification opportunities. These may include natural resource based enterprises but also handicrafts, commerce, and petty trade.
Activities for “coping and improving poor” will give emphasis on capacity building of groups of like-minded individuals or households (i.e. the group approach as favoured by NGOs throughout Bangladesh) to include group dynamics, simple book-keeping, extension, training and developing links with credit providers for livelihood diversification.
The Enterprise Development component will link people to interact effectively with strengthened markets, obtaining business development services and financial services on a commercial basis from the private sector.
Activities Related to Output 3
Influence local and national policy component employs two strategies: i) developing bottom-up planning, decision-making and accountability mechanisms to ensure that chars dwellers’ demands and needs are articulated at union parishad, upazila, chars-wide and national levels; and ii) undertaking research, monitoring, and information dissemination to support an evidence-based policy influencing process at the national level. It will establish a series of information dissemination and awareness-raising activities, including publications, a web page, stakeholder conferences.
Main partners:
The programme is being implemented by GoB through the Ministry of Local Government, Rural Development and Cooperatives (MoLGRD&C).
The programme brought government, private and non-government sector actors together. Output 1, concerned with local government institutions, services and infrastructure, are being implemented through government. Output 2, concerned with enterprise development activities and livelihoods strengthening and diversification, are being implemented through the private sector and through NGOs and Output 3 at the community level (strengthening char dwellers’ ability to influence local policy and service provision) are being implemented by NGOs and other community-based organisations.
Key potential hazards (current/future):
The Chars are exposed to a range of environmental shocks and stresses (particularly erosion and flooding) associated with the unpredictability of the river and water coming from upstream. The programme document recognises environmental change or natural disasters which may undermine programme progress.
On average, the chars experience a major flood episode on a ten-year cycle. It is assessed that frequency and intensity of flood will increase in future under climate change condition (BCAS/RA/Approtec, 1994).
It is to be noted that frequency and intensity will vary from place to place and risk will also be different. It is necessary to understand details climate change induced risks for different sectors (e.g. agriculture, infrastructure) and char dwellers.
Disaster risk reduction and adaptation priorities:
The CLP aims to build on char dwellers’ own existing livelihood coping strategies to reduce impacts of shocks and stresses. It has recognised the necessity to understand effects of climate change on char livelihood strategies and vulnerability including poverty-environment linkages. It has already stressed that these will be considered during programme inception and an action plan developed to integrate activities across the programme.
The programme has identified a number of interventions to increase livelihood and disaster preparedness, improvement of local infrastructure etc.
In order to address climate change induced risk, first it is important to assess risk of climate change for different targeted sectors and livelihoods options of char dwellers’ and then address additional risk by

Section 7: Adaptation options assessment
127
incorporating this into different activities. It may arise that existing livelihood coping strategies may not adequate and activities planned for improving livelihood may not sustain.
Risk assessment can be carried out for “char wide” programme and also for “locations specific activities” by analysing past and future trend of disaster (floods and erosion) in the context of climate change and changes in temperature and rainfall. It is also necessary to assess impacts on agriculture sector as one of the important sectors in this area which can be done by agriculture experts.
Relevant information from/for scientific inputs and cost-benefit analysis:
List of different interventions designed under CLP is necessary to know for assessing present and future risk related to flood, erosion, temperature and rainfall.
A risk assessment is necessary for these planned interventions and assessment of additional cost.

Section 7: Adaptation options assessment
128
7.3 ECONOMIC EMPOWERMENT OF THE POOREST CHALLENGE FUND (EEP) General Comments: The screening exercise focused on the potential to include climate change and disasters considerations within the criteria for accessing the Challenge Fund. This can draw from experiences of other challenge funds both on the subject matter (particularly the LDRRF of the Comprehensive Disaster Management Programme) and practical considerations (particularly the current design work for the Remittances Programme, RRP). Recommendation: Integration of climate change and disasters within funding criteria
Subject: Poverty/climate linkages are recommended as part of criteria for projects funded through EEP challenge funds. At the same time, briefing/training materials provided to NGOs who express interest in applying to EEP.
Details: The relationships between extreme poverty and climatic risks are recommended as areas for specific attention of projects. The funding guidelines for EEP challenge fund can be tailored to include criteria that promote attention to climate change and disasters issues within funded projects.
Methods: Include scoping of climate change and disasters issues relevant to the fund as part of the TORs for the design phase. Cross-referencing with other projects that have included environmental or other similar criteria. Briefing/training materials provided to NGOs on climate change and disasters who express interest in applying to EEP, potentially in collaboration with CDMP.
Entry-points: EEP is currently going through sign off with the Secretary of State. A design phase for the fund guidelines will follow, providing a good entry point for inclusion of climate change and disasters considerations.
Information needs, monitoring and indicators: Greater information needs to be generated during scoping of the sorts of projects that might be proposed to the fund or actually funded.
Follow-up: Limited to this note. DFID staff to take recommendation forward in context of project design phase, subject to sign off by Secretary of State. Potential link to CDMP climate change cell in provision of climate change and disasters training to NGOs interested in applying to EEP. Assessment Table – Recommendation 1 Criteria and Indicator Rating Score Comments and Details Win-win options Does option addresses current climate variability and future climate change?
1 = only current, or future risks 2 = current and future
2 Potential for both current and future
Existing risk management Is the option consistent with existing risk management activities?
1=No 2=Yes - Hard to state at this stage. Potential to demand consistency with existing risk management in funding criteria.
Cost effectiveness Can costs and benefits of option be easily determined?
1=No 2=Yes - Hard to state at this stage – dependent on projects supported.
Adaptive flexibility Does the option focus on narrow range of future scenarios, or allow flexibility
1=narrow 2=flexible
- Hard to state at this stage – dependent on projects supported. Potential to demand flexible adaptation options in funding criteria.
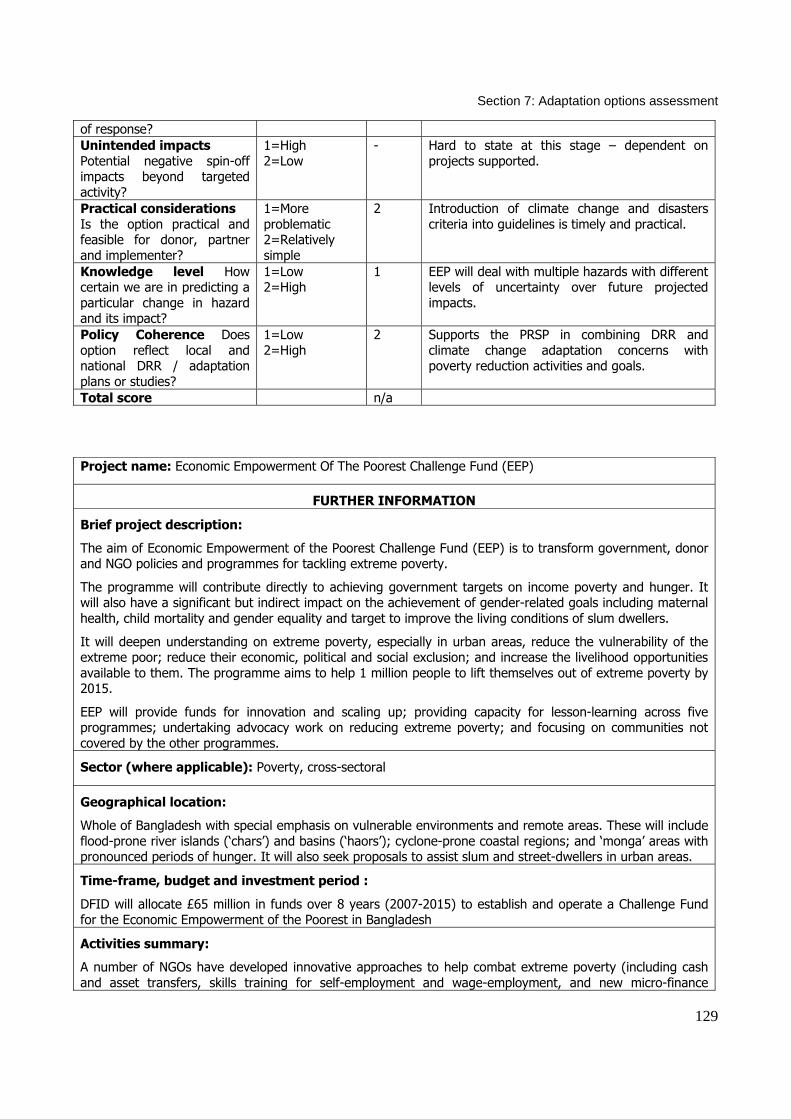
Section 7: Adaptation options assessment
129
of response? Unintended impacts Potential negative spin-off impacts beyond targeted activity?
1=High 2=Low
- Hard to state at this stage – dependent on projects supported.
Practical considerations Is the option practical and feasible for donor, partner and implementer?
1=More problematic 2=Relatively simple
2 Introduction of climate change and disasters criteria into guidelines is timely and practical.
Knowledge level How certain we are in predicting a particular change in hazard and its impact?
1=Low 2=High
1 EEP will deal with multiple hazards with different levels of uncertainty over future projected impacts.
Policy Coherence Does option reflect local and national DRR / adaptation plans or studies?
1=Low 2=High
2 Supports the PRSP in combining DRR and climate change adaptation concerns with poverty reduction activities and goals.
Total score n/a Project name: Economic Empowerment Of The Poorest Challenge Fund (EEP)
FURTHER INFORMATION
Brief project description:
The aim of Economic Empowerment of the Poorest Challenge Fund (EEP) is to transform government, donor and NGO policies and programmes for tackling extreme poverty.
The programme will contribute directly to achieving government targets on income poverty and hunger. It will also have a significant but indirect impact on the achievement of gender-related goals including maternal health, child mortality and gender equality and target to improve the living conditions of slum dwellers.
It will deepen understanding on extreme poverty, especially in urban areas, reduce the vulnerability of the extreme poor; reduce their economic, political and social exclusion; and increase the livelihood opportunities available to them. The programme aims to help 1 million people to lift themselves out of extreme poverty by 2015.
EEP will provide funds for innovation and scaling up; providing capacity for lesson-learning across five programmes; undertaking advocacy work on reducing extreme poverty; and focusing on communities not covered by the other programmes.
Sector (where applicable): Poverty, cross-sectoral
Geographical location:
Whole of Bangladesh with special emphasis on vulnerable environments and remote areas. These will include flood-prone river islands (‘chars’) and basins (‘haors’); cyclone-prone coastal regions; and ‘monga’ areas with pronounced periods of hunger. It will also seek proposals to assist slum and street-dwellers in urban areas.
Time-frame, budget and investment period :
DFID will allocate £65 million in funds over 8 years (2007-2015) to establish and operate a Challenge Fund for the Economic Empowerment of the Poorest in Bangladesh
Activities summary:
A number of NGOs have developed innovative approaches to help combat extreme poverty (including cash and asset transfers, skills training for self-employment and wage-employment, and new micro-finance

Section 7: Adaptation options assessment
130
models). But these have mostly been small-scale, but lessons are being learnt and some have the potential to be scaled up.
The Challenge Fund will finance NGOs to implement (a) large-scale projects designed to bring rapid benefits to large numbers of poor people (existing model) and (b) smaller projects designed to develop innovative approaches to reduce extreme poverty. The programme will target both rural and urban areas to lift extreme poverty and achieve sustainable livelihoods.
The exact means of doing this will be determined by the NGOs themselves, but proposals will need to show that the NGO has a clear vision of the ‘pathways’ out of extreme poverty for the target group. Methods are likely to include aspects of the following: cash or asset transfers directly to the extreme poor; training, awareness raising and mobilisation – of the extreme poor but also of the wider community; and strengthening linkages between the extreme poor, the private sector and government service providers.
Reducing the vulnerability of the extreme poor
• Enhancing assets and improving service delivery directly and through public and private service providers (e.g. asset and cash transfer; skill training; savings, insurance and targeted credit; better-targeted public works programmes; health services; government and other safety nets).
• Enhancing the capabilities of children to move out of extreme poverty (e.g. through access to schools and non-formal education for working children)
Reducing social, economic and political exclusion
• Enhancing their ability to claim entitlements from local government, including social protection programmes (e.g. through improved knowledge and capabilities).
• Facilitating innovative partnerships with local government and/or the business community and increasing their awareness of and ability to address the needs of the extreme poor.
• Whole community approaches (e.g. alliances between pro-poor elites and extreme poor around issues like sanitation).
Increasing livelihood opportunities
• Support in making markets work more effectively for the extreme poor (e.g. by strengthening SMEs, improved business and technical services to micro-entrepreneurs (e.g. veterinary, training, financial services).
• Improving access to state-owned assets (e.g. land, ponds, and infrastructure).
Transforming government, donor and NGO policies and programmes
This will be done through lesson-learning, dissemination and advocacy.
Main partners:
Large and established NGOs to implement 4-5 large-scale projects (indicative cost £40 million)
NGOs and other organisations to develop innovative approaches to combat extreme poverty (indicative cost £15 million)
Key potential hazards (current/future):
The extreme poor tend to live in areas of high environmental vulnerability and are exposed to a range of environmental shocks and stresses (including, flooding, erosion, saline intrusion and cyclones). Major catastrophes (floods, cyclones) occur every few years in Bangladesh. They have localized impact, which will seriously affect extremely poor people living in those areas.
It is evident that climate change will increase the frequency and intensity of flooding, erosion, intrusion of saline water, formation of cyclone and storm surges. The extreme poor in urban areas are exposed to serious environmental health issues because of pollution, inadequate shelter and lack of clean water and sanitation.
These environmental shocks and stresses could wipe-out the livelihood gains made as a result of the programme. Reducing the vulnerability of the extreme poor to present and anticipated future environmental

Section 7: Adaptation options assessment
131
shocks and stresses – both chronic (e.g. lack of clean water) and acute (e.g. floods) – is critical in helping them to lift themselves out of extreme poverty.
Disaster risk reduction and adaptation priorities:
The programme is targeting to reduce extreme poor living of environmentally shocks and stressful area by increasing livelihood opportunities and providing training to increase skills. It has been recognised that present and future environmental shocks and stresses could wipe-out success of the programme. Therefore it is necessary to design and promote a number of livelihoods opportunities (diversified options) so that environmental shocks and stresses have minimum impacts on livelihood options of the targeted poor community. It will provide opportunities to support poor people to adapt their livelihoods to cope better with the likely impacts of climate change.
The programme activities will be implemented by different types of organisations. Responsibility to incorporate potential environmental risk and opportunities to reduce extreme poverty will be given to the invited organizations. In general, NGOs working with community and promoting different livelihoods options have knowledge about exiting environmental shocks and stresses but has no knowledge, with few exceptions, on anticipated risk related to climate change. Considering the facts, the following activities can be incorporated in the programme as potential options to address climate change induced impacts.
Relevant information from/for scientific inputs and cost-benefit analysis:
It is necessary to estimate present and future environmental and climate change related risk including variability and extreme events where programme will be implemented.
A risk assessment of different livelihood options and identification of necessary measures along with cost is necessary. It can be done based on the submitted proposal by different NGOs.
Output of the assessment can be provided to the selected NGOs and training can be organized for them to incorporate climate change related risks into the programme activities.

Section 7: Adaptation options assessment
132
7.4 TRANSPORT SECTOR MANAGEMENT REFORM PROGRAMME OF THE ROADS AND HIGHWAYS DEPARTMENT (RHD) General Comments: This project is a technical assistance programme currently being implemented by WSP IMC. It links closely to another larger project that is delivering periodic budget support to RHD, and work on auditing and research into ‘pavement’ (ie road surface) design. Ernst and Young are undertaking the financial and physical audit of RHD work, essentially performing function of internal auditors to improve their systems for auditing and giving greater attention that at present to the physical audit in particular. As part of this wider project, DFID-B are currently designing a project looking into road pavement research with Birmingham University. This may have implications for assessing build-quality for disasters and climate change, and it might be possible to add a specific element on climate change and disasters within the context of this work. Where these recommendations would best be integrated with ongoing programmes will be a decision for DFID-B. Climate change may be a crucial driver of compliance/best practice in this case by providing the added urgency and impetus to ensure that adequate management is put in place regarding current hazards. This can put RHD in a better position to tackle additional impacts of future climate change and include these changes within its planning. The case is also made for inclusion of training and awareness-raising on climate change and disasters issues in the context of RHD activities, including the potential to access additional funding for the additional costs of RHD activities due to climate change impacts. This would be a complementary activity in order to sensitise RHD staff to these issues and could be provided through the existing Comprehensive Disaster Management Programme programme, whose activities include training of government officials on climate change and disasters issues. Recommendation 1: Improving roads and highways resilience to climatic hazards
Subject: Improving resilience of roads and highways to climatic hazards through design and maintenance.
Details: Recommend that the auditors look into current level of risk assessment and management during the course of their work. This entails assessing impacts from climate hazards on roads and highways (particularly from flood, cyclone, salinity, rainfall, and extreme temperatures) on a regional basis, as well as the adequacy of present maintenance levels and design. A risk assessment could also build in projections for changing hazard burdens, particularly floods and increased temperatures.
Methods: The starting point for the work would be an impact assessment of current disaster impacts on roads and highways to determine whether current practices and levels of risk management for climate hazards are sufficient or indeed whether they exist. It would assess current measures to manage these risks and develop possible future, measures particularly in key areas of pavement design and roads drainage. Cost benefit analysis will be carried out by ORCHID researchers on pilot risk reduction options. A medium term goal of the work as a whole might be to carry this forward to develop tools for climate risk assessment for integration into road maintenance policy, following up previous work on environmental safeguards.
Entry-points: TMSR provides an important linkage to the RHD as a whole and in potentially working with RHD to include climate risk assessment in criteria for tendering roads contacts. The internal audit programme funded by DFID-B can incorporate assessment of current disaster impacts and level of climate risk management practice as part of its work. The planned pavement research work provides an entry point for looking into climatic impacts on roads and highways, and developing technical options to address these impacts.

Section 7: Adaptation options assessment
133
Information needs, monitoring and indicators: Greater information is needed on current impacts related to climatic events to RHD infrastructure and existing level of risk management, particularly drainage management. Additional activity is also needed to scope potential changes that might improve resilience to acceptable levels where it is not currently adequate. Indicators to track progress on resilience-building can be developed from the assessment of current damages for given hazard levels (eg reduction in damage for a flood of a given level).
Follow-up: ORCHID Researchers will follow up with the TSMR programme manager, Mr Jelle van Gijn, and engineers working in the RHD regarding existing disaster impacts and risk management, as well as scoping options to improve resilience. These data will be used to conduct a cost benefit analysis of these options, including the additional change due to climate change where possible. Assessment Table – Recommendation 1 (Improving road resilience to climatic hazards) Criteria and Indicator Rating Score Comments and Details Win-win options Does option addresses current climate variability and future climate change?
1 = only current, or future risks 2 = current and future
2 Potential for both current and future
Existing risk management Is the option consistent with existing risk management activities?
1=No 2=Yes 2 Yes, but existing risk mment practices need to be assessed first as part of this work.
Cost effectiveness Can costs and benefits of option be easily determined?
1=No 2=Yes 2 Dependent on options supported but in theory we should be able to differentiate between current practices and options recommended.
Adaptive flexibility Does the option focus on narrow range of future scenarios, or allow flexibility of response?
1=narrow 2=flexible
1 Dependent on options implemented, but infrastructure development tend to be narrowly oriented.
Unintended impacts Potential negative spin-off impacts beyond targeted activity?
1=High 2=Low
1 Potentially high, as drainage has implications for multiple other sectors.
Practical considerations Is the option practical and feasible for donor, partner and implementer?
1=More problematic 2=Relatively simple
2 DFID-B has established relations and multiple programme areas with RHD, who are responsive to areas for improvement in operations.
Knowledge level How certain we are in predicting a particular change in hazard and its impact?
1=Low 2=High
2 Good projections for temperatures (trend already rising) and changes in flood frequency, which are two of the principle hazards affecting roads.
Policy Coherence Does option reflect local and national DRR / adaptation plans or studies?
1=Low 2=High
2 Supports NAPA in building resilience of infrastructure in the face of climate change.
Total score n/a Recommendation 2: Awareness-raising for improved climate risk management and financing
Subject: Improving awareness of climate change and disasters impacts / risk management to roads and highways.
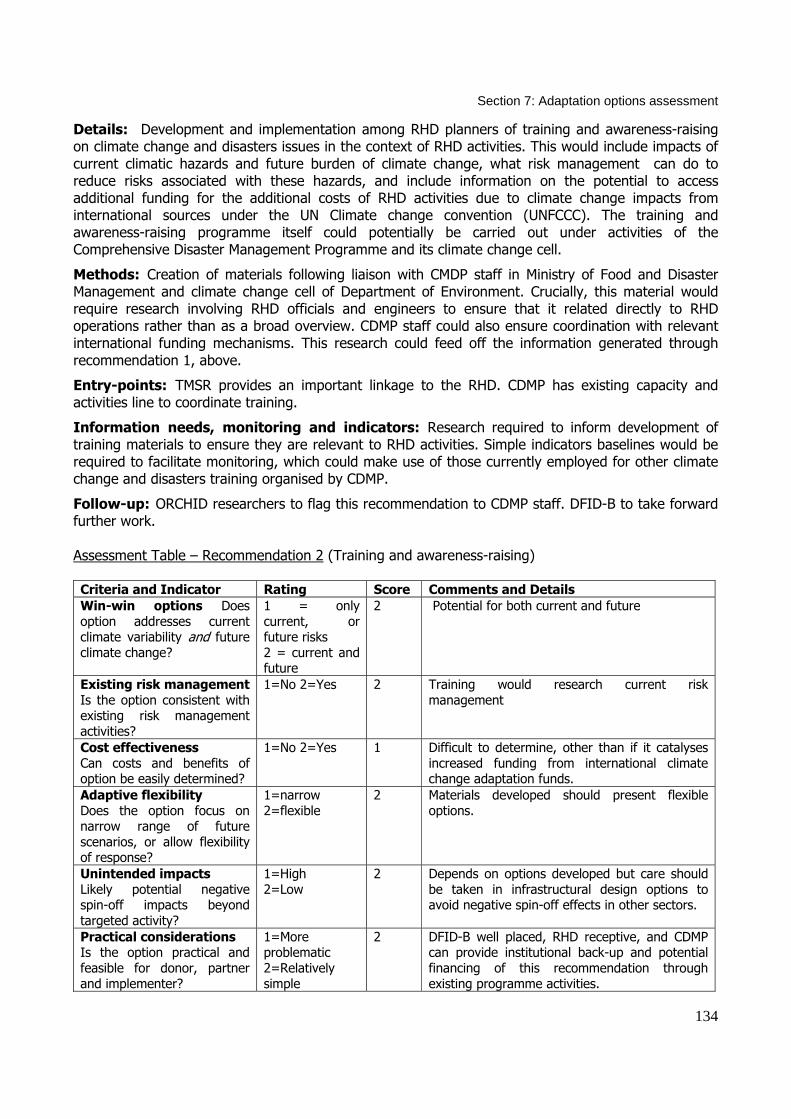
Section 7: Adaptation options assessment
134
Details: Development and implementation among RHD planners of training and awareness-raising on climate change and disasters issues in the context of RHD activities. This would include impacts of current climatic hazards and future burden of climate change, what risk management can do to reduce risks associated with these hazards, and include information on the potential to access additional funding for the additional costs of RHD activities due to climate change impacts from international sources under the UN Climate change convention (UNFCCC). The training and awareness-raising programme itself could potentially be carried out under activities of the Comprehensive Disaster Management Programme and its climate change cell.
Methods: Creation of materials following liaison with CMDP staff in Ministry of Food and Disaster Management and climate change cell of Department of Environment. Crucially, this material would require research involving RHD officials and engineers to ensure that it related directly to RHD operations rather than as a broad overview. CDMP staff could also ensure coordination with relevant international funding mechanisms. This research could feed off the information generated through recommendation 1, above.
Entry-points: TMSR provides an important linkage to the RHD. CDMP has existing capacity and activities line to coordinate training.
Information needs, monitoring and indicators: Research required to inform development of training materials to ensure they are relevant to RHD activities. Simple indicators baselines would be required to facilitate monitoring, which could make use of those currently employed for other climate change and disasters training organised by CDMP.
Follow-up: ORCHID researchers to flag this recommendation to CDMP staff. DFID-B to take forward further work. Assessment Table – Recommendation 2 (Training and awareness-raising) Criteria and Indicator Rating Score Comments and Details Win-win options Does option addresses current climate variability and future climate change?
1 = only current, or future risks 2 = current and future
2 Potential for both current and future
Existing risk management Is the option consistent with existing risk management activities?
1=No 2=Yes 2 Training would research current risk management
Cost effectiveness Can costs and benefits of option be easily determined?
1=No 2=Yes 1 Difficult to determine, other than if it catalyses increased funding from international climate change adaptation funds.
Adaptive flexibility Does the option focus on narrow range of future scenarios, or allow flexibility of response?
1=narrow 2=flexible
2 Materials developed should present flexible options.
Unintended impacts Likely potential negative spin-off impacts beyond targeted activity?
1=High 2=Low
2 Depends on options developed but care should be taken in infrastructural design options to avoid negative spin-off effects in other sectors.
Practical considerations Is the option practical and feasible for donor, partner and implementer?
1=More problematic 2=Relatively simple
2 DFID-B well placed, RHD receptive, and CDMP can provide institutional back-up and potential financing of this recommendation through existing programme activities.
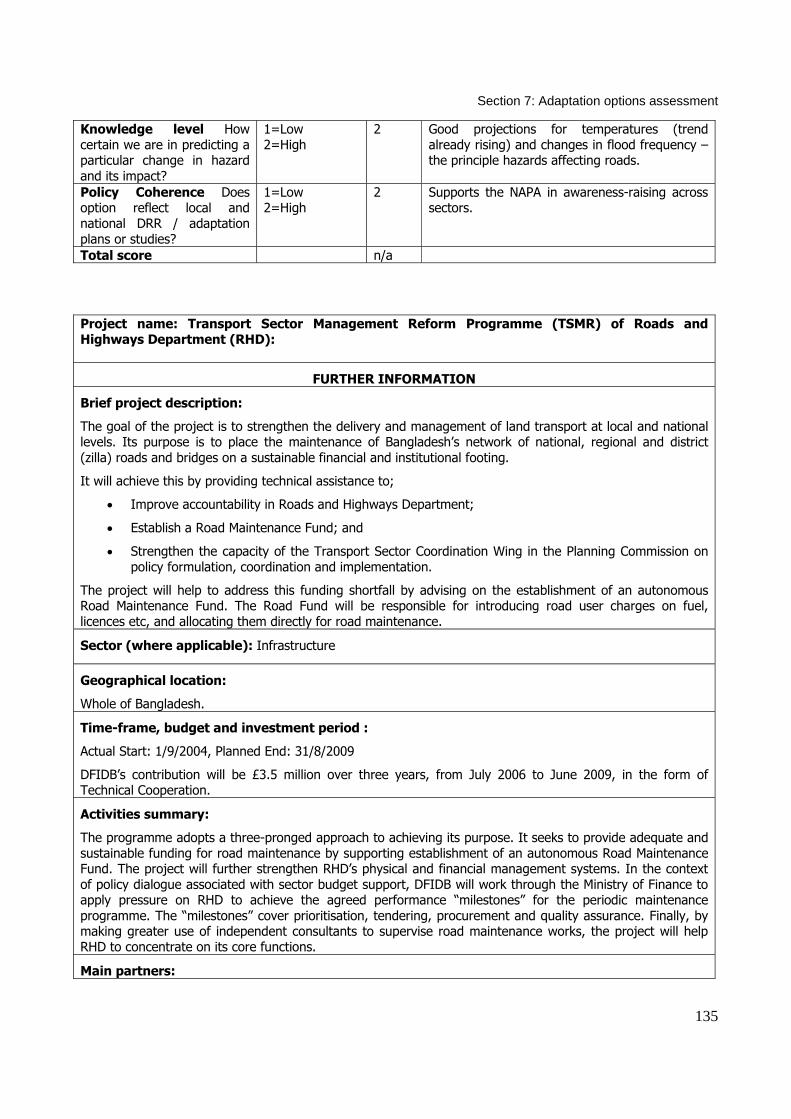
Section 7: Adaptation options assessment
135
Knowledge level How certain we are in predicting a particular change in hazard and its impact?
1=Low 2=High
2 Good projections for temperatures (trend already rising) and changes in flood frequency – the principle hazards affecting roads.
Policy Coherence Does option reflect local and national DRR / adaptation plans or studies?
1=Low 2=High
2 Supports the NAPA in awareness-raising across sectors.
Total score n/a Project name: Transport Sector Management Reform Programme (TSMR) of Roads and Highways Department (RHD):
FURTHER INFORMATION
Brief project description:
The goal of the project is to strengthen the delivery and management of land transport at local and national levels. Its purpose is to place the maintenance of Bangladesh’s network of national, regional and district (zilla) roads and bridges on a sustainable financial and institutional footing.
It will achieve this by providing technical assistance to;
• Improve accountability in Roads and Highways Department;
• Establish a Road Maintenance Fund; and
• Strengthen the capacity of the Transport Sector Coordination Wing in the Planning Commission on policy formulation, coordination and implementation.
The project will help to address this funding shortfall by advising on the establishment of an autonomous Road Maintenance Fund. The Road Fund will be responsible for introducing road user charges on fuel, licences etc, and allocating them directly for road maintenance.
Sector (where applicable): Infrastructure
Geographical location:
Whole of Bangladesh.
Time-frame, budget and investment period :
Actual Start: 1/9/2004, Planned End: 31/8/2009
DFIDB’s contribution will be £3.5 million over three years, from July 2006 to June 2009, in the form of Technical Cooperation.
Activities summary:
The programme adopts a three-pronged approach to achieving its purpose. It seeks to provide adequate and sustainable funding for road maintenance by supporting establishment of an autonomous Road Maintenance Fund. The project will further strengthen RHD’s physical and financial management systems. In the context of policy dialogue associated with sector budget support, DFIDB will work through the Ministry of Finance to apply pressure on RHD to achieve the agreed performance “milestones” for the periodic maintenance programme. The “milestones” cover prioritisation, tendering, procurement and quality assurance. Finally, by making greater use of independent consultants to supervise road maintenance works, the project will help RHD to concentrate on its core functions.
Main partners:

Section 7: Adaptation options assessment
136
GoB Road and Highways Department
Key potential hazards (current/future):
Heavy rainfall, floods and cyclonic storm surges are key environmental shocks and stresses deteriorate condition of roads and highways. Under the future climate change regime, it is expected that intensity of rainfall, frequency of floods and cyclonic storm surges will increase. Therefore, it is likely that road and highways condition will deteriorate more frequently and maintenance cost will be increased. Therefore, measures need to be taken to cope with changed situation.
Relevant information from/for scientific inputs and cost-benefit analysis:
Disaggregate road and highways according to present and future anticipated risk related to climate and assessment of risks.
Section 7: Adaptation options assessment
137
7.5 PRIVATE SECTOR DEVELOPMENT SUPPORT PROJECT (PSDSP) - NOW RISE
General Comments: This programme has not yet been approved, meaning that there is a good opportunity to integrate climate change and disasters concerns at an early stage. It consists of two main parts. The IFC (WB group) are managing and EC is in the process of approval as co-financers of a large trust fund, the Bangladesh Investment Climate Fund (BICF), to tackle the enabling and regulatory environment for enterprise. This fund would finance infrastructure outside industrial zones and integrated waste processing facilities. Inside the zones, the investment would be private capital. The PSDSP part focuses more specifically on operationalising Enterprise Zones. This work is currently undergoing an environmental impact assessment (EIA), financed by Canadians. While the EIA considers the impact of the enterprise zone development on the environment, it does not consider the potential impact of the environment on the zones themselves. Given the level of hazard and potential risk to investment, the recommendation is for a climate risk assessment, focusing on disaster risks, to be included as part of the process of developing enterprise zones. Possible targets for this integration are both the regulatory and legislative aspects of enterprise development and through technical assistance for carrying out such assessments. Although the initial focus may be in existing climate hazards and disaster events, climate change may be a crucial driver of compliance/best practice in this case by providing the added urgency and impetus to ensure that adequate management is put in place regarding current hazards. This can put enterprise development in a better position to tackle additional impacts of future climate change and include these changes within its future guidelines and planning. Recommendation 1: Climate risk assessments for enterprise zones and related infrastructure Subject: Improving resilience of enterprise zones and related infrastructure to climatic hazards through design and maintenance.
Details: Develop method for, and assist in implementation of, climate risk assessments for sites selected for private enterprise grants through the project under both the PSDSF components of the programme. Given widespread loses to private enterprise infrastructure from previous climate-related disasters, this would ensure that infrastructure investments assess risks and manage them accordingly. Lessons from these assessments should be used to develop disaster risk reduction guidelines and potential sources of funding to incentivise risk reduction actions. Alternatively, the programme could insist on risk management practices at all enterprise zones.
Methods: The starting point for the work would be an impact assessment of current disaster impacts private enterprise in general and existing enterprise zones in particular to determine whether current practices and levels of risk management for climate hazards are sufficient, or indeed whether they exist. It would develop measures to manage these risks in the future in the context of the RISE programme activities. If these risk management options are developed in the short term, cost benefit analysis could potentially be carried out by ORCHID researchers on options.
Entry-points: RISE is still in early design stage and awaiting sign-off, giving a crucial opportunity to include this recommendation within programme design and to sensitise partners across RISE/PSDSP programme to the importance of climate risk management to protect investment and ensure sustainable investment.
Information needs, monitoring and indicators: Preliminary information required on burden of current hazards on private enterprise infrastructure and activities. Indicators will be needed to track

Section 7: Adaptation options assessment
138
progress on resilience-building of enterprise development, based on the progress relative to current damages for given hazard levels (eg reduction in damage/disturbance for a flood of a given level). Indicators relating to damages and disturbance from climatic factors should be included in project design.
Follow-up: DFID-B senior enterprise adviser (Richard Boulter) to send relevant project documents to ORCHID researchers for review. Further scoping on entry-points then passed back to DFID-B. ORCHID researchers to contact CIDA regarding the EIA to cross-check on coverage of climatic risks and climate change and disasters issues. Assessment Table – Recommendation 1 (Climate risk assessments for enterprise zones) Criteria and Indicator Rating Score Comments and Details Win-win options Does option addresses current climate variability and future climate change?
1 = only current, or future risks 2 = current and future
2 Although initially focused on current risks, potential to extend to both current and future
Existing risk management Is the option consistent with existing risk management activities?
1=No 2=Yes 2 Yes, but existing risk mment practices need to be assessed first as part of this work.
Cost effectiveness Can costs and benefits of option be easily determined?
1=No 2=Yes 2 Dependent on options supported but we should be able to differentiate between current practices and options recommended.
Adaptive flexibility Does the option focus on narrow range of future scenarios, or allow flexibility of response?
1=narrow 2=flexible
1 Dependent on options implemented, but infrastructure options tend to be narrower
Unintended impacts Potential negative spin-off impacts beyond targeted activity?
1=High 2=Low
1 Potentially high, as infrastructure protection often has implications for multiple other sectors.
Practical considerations Is the option practical and feasible for donor, partner and implementer?
1=More problematic 2=Relatively simple
2 Programme still in design stage so opportune. Multiple partners, but DFID well positioned. World Bank also promoting climate risk management .
Knowledge level How certain we are in predicting a particular change in hazard and its impact?
1=Low 2=High
1 Multiple hazards depending on location- mixed levels of certainty (see climate science reports).
Policy Coherence Does option reflect local and national DRR / adaptation plans or studies?
1=Low 2=High
2 Supports NAPA in building resilience of infrastructure in the face of climate change.
Total score n/a Recommendation 2: Awareness raising and guidelines development for climate risk management
Subject: Improving awareness and development of guidelines on climate change and disasters impacts and risk management for regulatory bodies in the enterprise sector.
Details: The recommendation would work with BICF component and regulatory bodies relevant to enterprise sector. This would include development and delivery of awareness-raising materials on climate change and disasters issues in the context of enterprise development. These materials would scope out and detail the range of impacts to private enterprise of current climatic hazards as well as

Section 7: Adaptation options assessment
139
assessment of the likely future hazard burden due to climate change. It would also examine risk management options to reduce risks associated with these hazards. This would prepare the ground for the development of broad guidelines in partnership with enterprise regulatory bodies and other stakeholders on climate risk assessment for enterprise development. Both the awareness-raising materials and guideline development could potentially be carried out in conjunction with or under the activities of the Comprehensive Disaster Management Programme and its climate change cell, as this cross-sectoral mainstreaming work is within their project remit.
Methods: Creation of awareness-raising materials following scoping research on current impacts and existing risk management measures (if any) and development of potential risk reduction options (such as flood proofing) in partnership with regulatory bodies and infrastructure engineers. Liaison with CMDP staff on climate change and disasters issues. Development of broad (voluntary?) guidelines with regulatory bodies would stem from this initial work.
Entry-points: RISE is still in PM stage and awaiting sign-off, giving a crucial opportunity to include this recommendation within programme design and to sensitise partners across RISE/PSDSP programme to the importance of climate risk management to protect investment and ensure sustainable investment.
Information needs, monitoring and indicators: Preliminary information required on burden of current hazards on private enterprise infrastructure and activities. Indicators will be needed to track progress on resilience-building of enterprise development, based on the progress relative to current damages for given hazard levels (eg reduction in damage/disturbance for a flood of a given level). Indicators relating to damages and disturbance from climatic factors should be included in project design.
Follow-up: DFID-B senior enterprise adviser (Richard Boulter) to send relevant project documents to ORCHID researchers for review. Further scoping on entry-points then responsibility of DFID-B. Assessment Table – Recommendation 2 (Awareness-raising and guidelines development) Criteria and Indicator Rating Score Comments and Details Win-win options Does option addresses current climate variability and future climate change?
1 = only current, or future risks 2 = current and future
2 Potential for both current and future
Existing risk management Is the option consistent with existing risk management activities?
1=No 2=Yes 2 Awareness raising would be based on research into current risk management practice.
Cost effectiveness Can costs and benefits of option be easily determined?
1=No 2=Yes 1 Dependent on options supported but we should be able to differentiate between current practices and options recommended.
Adaptive flexibility Does the option focus on narrow range of future scenarios, or allow flexibility of response?
1=narrow 2=flexible
2 Dependent on options implemented, but infrastructure options tend to be narrower
Unintended impacts Likely potential negative spin-off impacts beyond targeted activity?
1=High 2=Low
2 Potentially high, as infrastructure protection often has implications for multiple other sectors.
Practical considerations Is the option practical and
1=More problematic
2 Programme still in design stage so opportune. Multiple partners, but DFID well positioned.

Section 7: Adaptation options assessment
140
feasible for donor, partner and implementer?
2=Relatively simple
World Bank also promoting climate risk management .
Knowledge level How certain we are in predicting a particular change in hazard and its impact?
1=Low 2=High
2 Multiple hazards depending on location- mixed levels of certainty (see climate science reports).
Policy Coherence Does option reflect local and national DRR / adaptation plans or studies?
1=Low 2=High
2 Supports NAPA in building resilience of infrastructure in the face of climate change.
Total score 15 Project name: Private Sector Development Support Project (PSDSP) - now Regulatory & Investment Systems improvement for Enterprise growth (RISE) Programme
FURTHER INFORMATION
Brief project description:
The super-goal of the programme is ‘pro-poor growth for increasing income and employment for the poor’. The goal of the programme is ‘to strengthen the enabling environment, which better enables enterprises to create more and better jobs for the poor, especially women’. The purpose of the programme is ‘to improve the enabling environment with respect to regulatory & investment systems in Bangladesh’ by 20% by the end of the project.
Sector (where applicable): Financial Sector, Enabling Policy
Geographical location:
Whole of Bangladesh.
Time-frame, budget and investment period :
February 2004 to March 2005, 50.2 million pounds
Activities summary: In order to establish mechanisms and policies to streamline regulatory constraints on businesses, especially for SMEs, technical assistance (TA) & financial support to GoB regulatory unit; TA & financial resources for e-governance and selected GoB departments; TA on regulatory research & reform; strengthening of specific agencies (e.g. possibly legal dispute & land registry institutions) will be provided. The project will streamline FDI procedures, promote commercial EPZs and Diaspora investment, strengthen infrastructure investment policies, strengthen investment promotion policies & institutions. Technical assistance will be provided for this also. The framework for linking Government accountability to stakeholders will be improved by establishing an independent regulation benchmarking & performance measurement, strengthen private sector & other stakeholder pressure for improved regulation & investment. Financial and technical assistance will be provide for the above also.
Regulatory and investment system will also consider mechanisms to integrate environmentally and socially responsible business practice (especially benefiting women).
Main partners:
The above mentioned activities are design phase activities. At the end of the first stage of the design process (when investment options will be clear) donors will finalise on the scope for co-funding and additional programming. All agencies have expressed interest in moving towards a more integrated approach, and the

Section 7: Adaptation options assessment
141
design process will guide this trajectory. This will achieve a co-ordinated approach potentially linked to conditionality, with low transaction costs and flexible mechanisms for all stakeholders.
Key potential hazards (current/future):
Broad-ranging given nature of project. All current risks thus need to be considered as well as future climate change impacts and vulnerabilities.
Section 7: Adaptation options assessment
142
7.6 PROMOTING FINANCIAL SERVICES FOR POVERTY REDUCTION (PROSPER)
General Comments: The screening exercise focused on the potential to include climate change and disasters considerations within the criteria for accessing micro-finance co-finance and technical assistance. This can draw from experiences of other challenge funds both on the subject matter (particularly the LDRRF of the Comprehensive Disaster Management Programme) and practical considerations (particularly the current design work for the Remittances Programme, RRP). As is the case with integration of climate risk considerations in other challenge fund, a balance needs to be struck between providing incentives to tackle climate risks and creating a set of conditionalities that constrain innovation in the micro-finance sector. In addition, a recommendation was discussed regarding the potential to incorporate forms of disaster risk insurance mechanisms for micro-finance funds in sectors sensitive to disaster events. It was agreed that this fits well with the rural finance programme being prepared by the World Bank, where weather-related crop insurance plays a role. It was agreed that this option should be brought to the table with the WB further down the line, as PROSPER is keen to link up with the WB programme. As a consequence, the option of disaster insurance for micro-finance initiatives is not discussed further here in detail.
Recommendation: Integration of climate change and disasters issues within funding criteria
Subject: Poverty/climate linkages are recommended as part of criteria for grants through PROSPER funds.
Details: Attention to climatic risks (particularly disaster risks) within micro-finance projects can be included as areas for specific attention from PROSPER financing. The funding guidelines for PROSPER can be tailored to include criteria that promote attention to climate change and disasters issues within funded projects. Project documents already mention crop insurance as an example of a potential project.
Methods: Initial scoping of innovative ways that climate change and disasters might be addressed by PROSPER co-financing. These might include crop insurance and other schemes targeting climate-related food security issues such as monga. Creation and integration of criteria for project financing based on attention to climate change and disasters. This will involve cross-referencing with other projects that have included environmental or other similar criteria (eg RPP, EEP, CDMP). Promotion of links with CDMP to promote disaster-related micro-insurance.
Entry-points: PROSPER has been signed off and is currently awaiting GoB signature. A design phase for the fund guidelines will follow, providing a good entry point for inclusion of climate change and disasters considerations. Addressing climatic issues fits well with the programmes goal of funding innovative micro-finance for which conventional financing streams cannot cover 100% of loan finance.
Information needs, monitoring and indicators: Greater information needs to be generated during scoping of the sorts of projects that might be proposed to the fund or actually funded. Assessment Table Criteria and Indicator Rating Score Comments and Details Win-win options Does option addresses current
1 = only current, or
2 Potential for both current and future

Section 7: Adaptation options assessment
143
climate variability and future climate change?
future risks 2 = current and future
Existing risk management Is the option consistent with existing risk management activities?
1=No 2=Yes - Hard to state at this stage. Potential to demand consistency with existing risk management in funding criteria.
Cost effectiveness Can costs and benefits of option be easily determined?
1=No 2=Yes - Hard to state at this stage – dependent on projects supported.
Adaptive flexibility Does the option focus on narrow range of future scenarios, or allow flexibility of response?
1=narrow 2=flexible
- Hard to state at this stage – dependent on projects supported. Potential to demand flexible adaptation options in funding criteria.
Unintended impacts Potential negative spin-off impacts beyond targeted activity?
1=High 2=Low
- Hard to state at this stage – dependent on projects supported.
Practical considerations Is the option practical and feasible for donor, partner and implementer?
1=More problematic 2=Relatively simple
2 Introduction of climate change and disasters criteria into guidelines is timely and practical, although DFID-B will need to coordinate with other partners.
Knowledge level How certain we are in predicting a particular change in hazard and its impact?
1=Low 2=High
1 Micro-finance likely to deal with multiple hazards with different levels of uncertainty over future projected impacts.
Policy Coherence Does option reflect local and national DRR / adaptation plans or studies?
1=Low 2=High
2 Supports the PRSP in combining DRR and climate change adaptation concerns with poverty reduction activities and goals. NAPA calls for exploring options for insurance and other emergency preparedness measures
Total score n/a Project name: Promoting Financial Services for Poverty Reduction (Prosper)
FURTHER INFORMATION
Brief project description: The goal is pro-poor economic growth to increase income and employment for the poor (especially women). The purpose is a sustainable financial sector for the poor in Bangladesh, offering better financial services for previously excluded groups (the extreme poor, MSEs, and small farmers).
The intervention seeks to increase access of two main groups to appropriate financial services: the ultra poor and micro-enterprises/marginal farmers. It also looks to support the formulation and adoption of regulation and professional standards in the microfinance (MF) industry – which will include capacity building on environmental procedures. The programme aims to ensure that financial services are more driven by customer need and impact.
Sector (where applicable): Financial Sector, Poverty, Micro-finance
Geographical location: National - Whole of Bangladesh.
Section 7: Adaptation options assessment
144
Time-frame, budget and investment period :
The programme will provide £72.6m over 8 years (June 2006 – May 2014) – with a DFID allocation of £40m and £32.6m from other development partners16 (DPs) – alongside $4m annually from GoB’s ongoing PRSP commitments.
Activities summary: Programme targets key excluded groups through providing MFIs and other financial institutions with funds and technical expertise to innovate tailored products for these groups. For example, providing an MFI with a grant to cover 50% of the costs of developing and providing crop insurance for small farmers, or providing a bank with a 30% grant to adapt a leasing product for micro-enterprises.
The programme will provide smaller grants to pilot new instruments, and funds to scale these up where they prove successful.
The programme has a component that specifically targets three million of those extreme poor who experience seasonal famine known as ‘monga’, through supporting NGOs in better targeting the extreme poor with new financial services and skills development. The programme has targeted to achieve three key outputs. These are as follows.
Catalysing innovation for the excluded extreme poor
Approach: Scaling up of savings, insurance and flexible loans are envisaged, combined with business skills training, especially in areas prone to monga. Critical systems to allow expansion of MSE loan volumes will be developed with the Bangladesh Bank under PRISE17.
Supporting effective regulation of microfinance
Approach: The MRA will develop from an existing unit that has been set up to begin regulation of the sector. GoB has achieved the initial triggers (ratification of law) and has requested funding. Prosper will provide technical and operational support in establishing the MRA. Assistance to the MRA will be tied to performance based on (a) benchmarks of organisational performance against desirable norms and (b) adoption of regulatory standards by MFIs in Bangladesh. Funding is phased to match results.
Strengthening the capacity to innovate and deliver services
Approach: The Institute of Microfinance (InM) will facilitate provision of training courses (short term & long term) to financial institutions. Prosper will support the InM with TA and operational funding through PKSF. On the supply side the InM will a) assess priorities for training and consultancy services; b) in response to identified needs, develop training curricula and materials, and associated training-of-trainer packages; c) train and accredit service providers in delivering core curricula; and d) monitor and ensure the quality of service delivery. On the demand side it will administer a voucher scheme that subsidises the cost of training to the end users, as smaller MFIs lack resources to invest in upgrading capacity. Funds will be provided for research and M&E studies of access and depth across the financial sector by poverty segments (using ‘Finscope methodology18).
Main partners:
Key stakeholders are the Bangladesh Bank (lead implementing agency) and PKSF (co-implementer). Both report ultimately to the Ministry of Finance. Two other implementing agencies are under the auspices of these organisations (MRA and InM). Other donors include AusAid, CIDA, IFAD, KfW, IFAD and SDC.
Potential disaster risk reduction and adaptation potentials:
Broad-ranging given nature of project. All current risks thus need to be considered as well as future climate
16 AusAid, CIDA, IFAD, KfW, IFAD and SDC. 17 Prosper will assist the Bangladesh Bank in automating its Credit Information Bureau so that banks can extend loans faster without arduous collateral arrangements. 18 For a general explanation see http://www.finscope.co.za .
Section 7: Adaptation options assessment
145
change impacts and vulnerabilities. Climate change is likely to have profound impacts in Bangladesh. Predicted changes include changes in rainfall (e.g. drought as well as increased rainfall in some areas), increased intensity and frequency of extreme events (tornadoes, cyclones, floods etc), and sea level rise.
Key potential hazards (current/future):
Many loans will involve agricultural activities that in aggregate may involve significant numbers of enterprises and have more significant effects e.g. thousands of farmers taking up new cropping regimes, or having increased access to agricultural inputs. The programme therefore has opportunities to both address negative impacts, and maximise positive opportunities to increase environmental sustainability.
Relevant information from/for scientific inputs and CBA work:
A risk index for different sectors for Bangladesh is necessary which will also help in developing crop insurance for different crops and operating micro finance activities.

Section 7: Adaptation options assessment
146
7.7 PHASE II, RURAL INFRASTRUCTURE IMPROVEMENT PROJECT (RIIP2) General Comments:
This programme is in the initial design phase, although progress has been made among parterns on aspects of the programme. Asian Development Bank has recently carried out a social appraisal, which has revealed a paucity of gender considerations – ADB work is focused on rural roads provision. This includes guidance on resettlement policies for people displaced by roads construction, and guidance for relocation and compensation.
This intervention provides another good example of how the emerging risks from climate change can be used as an impetus for ensuring that investments manage current risks more effectively to build resilience for longer term change. Recommendation: Promoting climate risk management in rural infrastructure investment
Subject: Ensuring suitable resilience of infrastructure development to climatic risks through assessments on design and maintenance regimes.
Details: To integrate disaster risk assessment into the procedure for determining infrastructure location and design.
Methods: A baseline on impacts of current climate hazards on infrastructure (focusing on rural roads, jetties, and Union Parishad buildings) would be prepared on a regional basis. Information gaps can then be highlighted that hinder effective climate risk management at present. Guidance for risk assessment and management could then be developed on design and maintenance of such infrastructure in key regions and locations. For example, these could be used to ensure that Union Parishad buildings are not built in highly vulnerable locations or built to withstand given levels of disaster event relevant to that area. These assessments could also include a degree of additional resilience to cope with expected future climate changes during the investment lifetime. The level of this additional resilience can be informed by existing scientific study. This work could also be complemented by a programme of training to local infrastructure maintenance groups on response options during extreme climatic events (such as major flood).
Entry-points: A DFID-funded design team is due to start work shortly, including preparation of an environmental annex and environment screening note (ESN).
Information needs, monitoring and indicators: Greater information is needed on current impacts related to climatic events to rural infrastructure and existing level of risk management, particularly related to roads, jetties and local government buildings. Additional activity will be needed to scope potential changes that might improve resilience to acceptable levels where it is not currently adequate. Indicators to track progress on resilience-building can be developed from the baseline assessment of current damages for given hazard levels (eg reduction in damage for a flood of a given level).
Follow-up: Inclusion of a climate change / disaster risk reduction specialist on the consultancy team for the design phase.
Assessment Table – Recommendation 1 (climate risk management in rural infrastructure investment) Criteria and Indicator Rating Score Comments and Details Win-win options Does option addresses current climate variability and future climate change?
1 = only current, or future risks 2 = current and future
2 Potential for both current and future

Section 7: Adaptation options assessment
147
Existing risk management Is the option consistent with existing risk management activities?
1=No 2=Yes 2 Yes, but existing risk mment practices need to be assessed first as part of this work.
Cost effectiveness Can costs and benefits of option be easily determined?
1=No 2=Yes 2 Dependent on options supported but in theory we should be able to differentiate between current practices and options recommended.
Adaptive flexibility Does the option focus on narrow range of future scenarios, or allow flexibility of response?
1=narrow 2=flexible
1 Dependent on options implemented, but infrastructure development tend to be narrowly oriented.
Unintended impacts Potential negative spin-off impacts beyond targeted activity?
1=High 2=Low
1 Potentially high, as infrastructure development often has implications for other sectors.
Practical considerations Is the option practical and feasible for donor, partner and implementer?
1=More problematic 2=Relatively simple
1 DFID-B needs to be aware of other partners and generate common interest in delivering disaster-resilient infrastructure.
Knowledge level How certain we are in predicting a particular change in hazard and its impact?
1=Low 2=High
2 Varied, but better for flood risks.
Policy Coherence Does option reflect local and national DRR / adaptation plans or studies?
1=Low 2=High
2 Supports NAPA in building resilience of infrastructure in the face of climate change.
Total score 13 Project name: Phase II, Rural Infrastructure Improvement Project (RIIP2)
FURTHER INFORMATION
Brief project description: The purpose of RIIP2 is to reduce physical, social and economic exclusion amongst 14 million women and men in 23 of Bangladesh’s poorest districts (out of 64) by developing rural infrastructure and improving access to services and markets, providing opportunities for employment and strengthening capacity of local government to deliver infrastructure services to the poor.
The goal of RIIP2 is to lift more than one million people out of poverty, by providing improved access to economic opportunities, social services and upgrading rural infrastructure.
Sector (where applicable): Rural Infrastructure
Geographical location: 23 of Bangladesh’s poorest districts
Time-frame, budget and investment period :
The indicative budget is £35 million ($60 million) over 5 years to be provided as financial aid (£28 million) to ADB and technical co-operation (£7 million) to GTZ. This is 23% of the total budget of $260 million. It will also seek up to £50,000 for design work. Timeframe for this design work DFID is (April to October 06). More info on implementation phase is available from other partners.
Activities summary:
Section 7: Adaptation options assessment
148
The project will implement the following activities and involved poor women and men. • Upgrade rural roads, and improve infrastructure at markets, jetties and union parishad19 complexes,
using labour-intensive methods; • Create better access to social services and markets and; • Improve local governance Involvement • Increasing benefits to both poor women and men through greater emphasis on village and union level
roads and infrastructure; • Enhancing women’s empowerment by promoting the role of women’s Labour Contracting Societies in
maintaining village and union roads; • Increasing the project’s ability to meet transport and travel needs of people with physical disabilities;
Strengthening the transparency and accountability of Local Government Engineering Department (LGED) and local government delivery of rural infrastructure services to the poor.
Main partners:
The principal partners are the Local Government and Engineering Department (LGED) of Ministry of Local Government, Rural Development and Co-operatives; the Asian Development Bank and GTZ. Implementing partners will include local government institutions (union parishads) and community-based organisations, including women-only Labour Contracting Societies.
Key potential hazards (current/future):
Rural road and infrastructure will face heavy rainfall and floods and therefore need proper design to address present and future climate related problems. Jetties are normally prone to erosion and sedimentation. Therefore identification of location of Jetties is important. Future climate may alter level of vulnerability of location and therefore future erosion and sedimentation need to be incorporated in identification of Jetties. The above will also need to be incorporated in building Union Parishad.
Relevant information from/for scientific inputs and cost-benefit analysis:
List of 23 district where project activities will be implemented. Data and information on road infrastructure with length, alignment, alignment, engineering design, etc. to assess vulnerability of infrastructure to climate change (rainfall, flood etc.). Location and engineering design of union parishad and Jetties.
19 Local Government Administrative Unit

Section 7: Adaptation options assessment
149
7.8 SECOND PRIMARY EDUCATION DEVELOPMENT PROGRAMME (PEDP II) General Comments: The programme has targeted to achieve four major outputs which are a) quality of primary education improved through organizational development and capacity building, b) improved quality in schools and classrooms, c) quality improvement through infrastructure development, and d) improved access to quality schooling.
The infrastructure development component was highlighted as that most appropriate for actions to reduce climate risks and providing opportunities to engage with the programme. The programme activities include investment in school infrastructure through government construction programmes. The GOB has constructed 36,000 classrooms (new schools or extensions of old schools). Construction is implemented by local government engineering departments but sometimes suffers from poor accountability. The current building plans follow a ‘one size fits all’ with no account of local climate (and other) considerations and to date many school buildings have been over-built, often with too many concrete pillars.
Recommendation 1: Assess climate related problems due to ‘one size fits all’ school construction
Subject: Addressing climate risks to infrastructure related to the project.
Details: The infrastructure component of the project is limited by existing identified limitations in the design and construction of school classrooms.
Methods: An assessment of climate risks and current problems with relevant school infrastructure across the country. This would mainly cover current climate stresses but could also consider future impacts using maps of inundation due to sea level rise, increase in cyclone hazard and estimates of future river flooding behaviour.
Entry Points: Problems with existing practice are already known. A better evidence base would help to make a stronger case for changing practice. The programme mid-term review could provide opportunity to raise concern about current practice.
Information needs, monitoring and indicators: Better local data are required on building design and evidence of problems associated with building design in different areas, given the range of exposure to climate hazards across Bangladesh. Follow-up: Discuss potential for the programme to undertake a targeted data collection exercise (combining interviews with hazard profiles) across the country to identify and assess problems associated with current infrastructure design. Assessment Table – Recommendation 1 Criteria and Indicator Rating Score Comments and Details Win-win options Does option address current climate variability and future climate change?
1 = only current, or future risks 2 = current and future
2 Improve design based on current impacts to infrastructure, but can include some projected climate change impacts.

Section 7: Adaptation options assessment
150
Existing risk management Is the option consistent with existing risk management activities?
1=No 2=Yes 1 Engineering design based on single design blueprint. No consideration of locally based climate (or other) considerations.
Cost effectiveness Can costs and benefits of option be easily determined?
1=No 2=Yes 2 Small report exits on school flood damages done by Save the Children. Additional information required to assess this in more detail.
Adaptive flexibility Does the option focus on narrow range of future scenarios, or allow flexibility of response?
1=narrow 2=flexible
1 Infrastructure design will necessarily have to be to a calculated risk (e.g. flood height recurrence). More difficult to incorporate uncertainty.
Unintended impacts Likely potential negative spin-off impacts beyond targeted activity?
1=High 2=Low
1 Care needed to ensure that infrastructure does not inadvertently enhance vulnerability to users.
Practical considerations Is the option practical and feasible for donor, partner and implementer?
1=More problematic 2=Relatively simple
2 Donor consortium – may be difficult to interest in these concerns. Mid-term review due could be opportunity to influence the process through highlighting of existing problems with stronger evidence base.
Knowledge level How certain we are in predicting a particular change in hazard and its impact?
1=Low 2=High
1 Relatively good projections for impact of climate change on floods, extreme temperatures and sea level rise (relevant on longer time scales). But additional analysis required to map out spatial detail of future hazards and exposure to infrastructure.
Policy Coherence Does option reflect local and national DRR / adaptation plans or studies?
1=Low 2=High
2 NAPA has project on infrastructure strengthening.
Total score 12 Project name: Second Primary Education Development Programme (PEDP II)
FURTHER INFORMATION
Brief project description: The programme goal is to reduce poverty through universal primary education and contribute to sustainable socio economic development and equity. Its purpose is to provide quality primary education to all eligible children in Bangladesh. The programme will finance the 11 categories of school registered as delivering the government’s primary education curriculum to over 17 million primary aged children per year. Planned DFID technical inputs to the ADB, including a secondment into the organisation and on going engagement through the consortium, will seek to reinforce the poverty focus of the programme and increase access for poor, vulnerable and hard to reach children.
Sector (where applicable):
Education
Geographical location: Whole Country
Time-frame, budget and investment period : Six years from January 2004 to December 2009

Section 7: Adaptation options assessment
151
US$ 1,865.74m, of which 67% Government of Bangladesh (GoB) and 33% Development Partners led by ADB (ADB, DFID, Netherlands, Sweden, Norway, Canada, EC, IDA, UNICEF, Australia, Japan), mostly with pooled funds.
A DFID contribution of £100 million, over the six year period (January 2004 – December 2009), is proposed. DFID’s contribution would be a significant proportion (20%) of the proposed US$619 million development partner (DP) financing of the sub-sector.
Activities summary: The programme has targeted to achieve four major outputs which are a) quality of primary education improved through organizational development and capacity building, b) improved quality in schools and classrooms, c) quality improvement through infrastructure development, and d) improved access to quality schooling.
In order to achieve the four outputs, the programme has identified the following inputs.
Civil works for improving physical environment:
Equipment, including computers, and furniture and transport
Teaching, training, guides, manuals and supplementary materials
Program development and studies
Professional and staff development
Technical assistance and consulting services
Staff and salary support
Grants and funds
Main partners: The Ministry of Primary and Mass Education (MOPME) and its Directorate of Primary Education (DPE)
Development partners (DPs) working under the leadership of the Asian Development Bank (ADB)
Valued at US$1865.74 million over a 6 year period (January 2004 – December 2009).
Key potential hazards (current/future):
Civil work for improving physical environment of the school may be exposed to different environmental shocks including anticipated adverse impacts of climate change, variability and extreme events. These will vary from area to area. Water supply facilities for the student and teachers may face problems related to quality and quantity.
Disaster risk reduction and adaptation priorities:
Primary Education Development Programme, Phase II will be implemented all over the country and will undertake civil works (construction of building and other facilities). Different parts of the country are vulnerable to different existing and future climatic shocks and stresses. Therefore, construction of building and other services can be built incorporating present and future climate risk in design of civil works.
Relevant information from/for scientific inputs and cost-benefit analysis: It is necessary to know present and future environmental and climate change related risk including variability and extreme events where civil/construction work will take place.
A risk assessment of risk of civil/construction work and identification of necessary measures along with cost is necessary. This can be done based on suggested construction activities.

Section 7: Adaptation options assessment
152
7.9 SECOND URBAN PRIMARY HEALTH CARE PROJECT (UPHCP-II) General Comments: The goal of the project is to improve the health of the urban population, especially the poor, in the six city corporations (CCs) and five of the municipalities. Its purpose is to improve access to and utilisation of efficient, effective and sustainable good quality PHC services for the poor in urban areas, with a particular focus on women and girls. Opportunities were identified relating to new infrastructure components of the programme and potential to compile baseline data on health related effects of climate variability and extremes. Programme structure limits opportunity to build in policy related measures and baseline surveys (NGOs involved in programme implementation and delivery already stretched to meet current objectives). Discussion highlighted an important need for improved baseline information on health-climate linkages in Bangladesh. Whilst it was felt that such baseline data could not easily be collected through UPHCPII (see considerations above) there is a strong case to be made to try to include some additional questions in the Demographic and Health Survey (the DHS, funded by USAID for Ministry of Health), which is done every 2-3 years and includes urban and rural areas. Recommendation 1: Compliance of programme infrastructure with existing regulations for climate hazards.
Subject: Infrastructure compliance with building regulations.
Details: Opportunities exist to raise awareness and incorporate better monitoring of infrastructure compliance with government regulations on buildings in relation to climate related risks.
Methods: Construction is tendered out – when contracts are awarded it would require guidance with the construction firm to ensure compliance. Infrastructure needs to be compliant with existing climate risks but could also consider changes in risk environment due to climate change, particularly relating to changes in flood frequency and magnitude, changes in the area of high cyclone risk/sea level inundation.
Entry Points: Infrastructure contract tenders to require assessment of climate risks and demonstration of planned compliance with risk reduction / building best practice.
Information needs, monitoring and indicators: Expertise required in knowledge of infrastructure design and building regulation. Generic guidance could be established through links with CDMP – best practice on building standards, risk profiles and risk areas, including information on future changes in the risk environment. Monitoring of new actions needs to be based on better baseline data on existing costs to infrastructure which may require data collection (some analysis by ORCHID researchers on cot-benefit could contribute to this). There may be a case for CDMP to undertake a more general national survey of the current situation. Follow-up: Liaise with programme adviser on best steps to incorporate these concerns into the infrastructure tendering process. Assessment Table – Recommendation 1 Criteria and Indicator Rating Score Comments and Details Win-win options Does option address current
1 = only current, or
2 Compliance with existing infrastructure regulations as first stage in addressing future

Section 7: Adaptation options assessment
153
climate variability and future climate change?
future risks 2 = current and future
climate change impacts.
Existing risk management Is the option consistent with existing risk management activities?
1=No 2=Yes 1 Broadly speaking, engineering design potentially already considers climate risks.
Cost effectiveness Can costs and benefits of option be easily determined?
1=No 2=Yes 2 Benefits of avoided damages, and costs of changing infrastructure design should be discernable.
Adaptive flexibility Does the option focus on narrow range of future scenarios, or allow flexibility of response?
1=narrow 2=flexible
1 Infrastructure design will necessarily have to be to a calculated risk (eg flood height recurrence). More difficult to incorporate uncertainty.
Unintended impacts Likely potential negative spin-off impacts beyond targeted activity?
1=High 2=Low
1 Infrastructure projects can easily have unintended impacts. Care needed to ensure that measures do not inadvertently enhance vulnerability in other sectors.
Practical considerations Is the option practical and feasible for donor, partner and implementer?
1=More problematic 2=Relatively simple
2 Construction is tendered out – when contract awarded it would require guidance with the construction firm to ensure compliance.
Knowledge level How certain we are in predicting a particular change in hazard and its impact?
1=Low 2=High
1 Relatively good projections for impact of climate change on floods, which is the main hazard. Data on past flood events impact on infrastructure unknown – could do retrospective assessment of hazard risk – flood proofing.
Policy Coherence Does option reflect local and national DRR / adaptation plans or studies?
1=Low 2=High
2 NAPA has project on infrastructure strengthening.
Total score 12

Section 7: Adaptation options assessment
154
Project name: SECOND URBAN PRIMARY HEALTH CARE PROJECT (UPHCP-II)
FURTHER INFORMATION
Brief project description: The goal of the project is to improve the health of the urban population, especially the poor, in the six city corporations (CCs) and five of the municipalities. Its purpose is to improve access to and utilisation of efficient, effective and sustainable good quality PHC services for the poor in urban areas, with a particular focus on women and girls.
Sector (where applicable):
Health
Geographical location: Six city corporations (CCs) and five of the municipalities.
Time-frame, budget and investment period : July 2005 - December 2011 The total project cost is US$90 million of which DFID will provide $25m (£15m) of grant funding. Other funding will be provided by SIDA ($5m), the UN Fund for Population Activities (UNFPA) ($2m), the Government of Bangladesh (GoB) ($18m), and ADB ($40m).
Activities summary: UPHCP shows that utilization of health facilities by the poor is influenced by several factors: (i) information on health facilities and services are available for the poor; (ii) types of services provided by the health facilities; (iii) rates of fee for services; (iv) location of the health facilities; (v) ignorance and health awareness; (vi) social prejudice, cultural and religious beliefs etc. Given the experience of the UPHCP, much more emphasis will be given to social mobilization, motivation and awareness campaign and establishment of community level mini-clinic and outreach work, capacity building of the community organizers/health educators to increase use health facilities by the poor and hardcore poor. The key activities are as follows.
a) Baseline Survey and Issue Health Card b) Locate Health Care Centre where concentration of poor is high c) Social Mobilization through audio visual and other innovative methods d) Health Awareness e) Satellite Clinic f) Monitoring and Record Keeping g) Capacity building for Community Organizers
Main partners: MoLGRD will be implementing PHC in urban areas.
Development partners (DPs) working under the leadership of the Asian Development Bank (ADB)
Valued at US$1865.74 million over a 6 year period (January 2004 – December 2009).
Key potential hazards (current/future):
The infrastructure will be exposed to the existing distribution of hazards and a new hazard environment as climate changes. Key parameters are changes in flood frequency and magnitude, cyclone high risk areas and sea level rise.

Section 7: Adaptation options assessment
155
Primary and secondary effects of climate change may directly effect recipients health (change in distribution of vector borne diseases, heat related problems, and most likely, negative health impacts due to declining water quality, particularly after flood events).
Disaster risk reduction and adaptation priorities:
Infrastructure compliance with building regulations to cover hazard profiles.
Relevant information from/for scientific inputs and cost-benefit analysis:
There is a general need to better understanding of climate health linkages in Bangladesh. Better information on existing vulnerability and costs of infrastructure to climate related hazards.

Section 7: Adaptation options assessment
156
7.10 ENGLISH IN ACTION (EIA) General Comments: The goal of the project is to contribute to the economic growth of Bangladesh by providing English language as a necessary skill for better access to the economy. The purpose will be to increase significantly the number of people able to communicate in English to levels that allow them to participate fully in economic and social activity and opportunities.
EIA focuses on developing innovative methods of teaching and learning which will complement existing activity and penetrate all areas of the country. While radio will be used to support learning, EIA will also use television drama to create particular interest in English; develop open learning courses, current affairs, and discussion opportunities dealing with key social issues; and complement existing English language newspapers. Recommendations: Incorporate climate variability (hazards) and change into educational materials and programmes.
Subject: Awareness raising, producing information and teaching materials on understanding of climate related hazards and guidance on mitigation and preparedness.
Details: Particular activities could include;
Development of issues based (flood, cyclone, drought) education and training materials.
Development of radio programme materials on climate change, disasters, adaptation, disaster risk reduction, early warning etc.
Development of posters on weather, climate and climate change issues as education materials and self study for different group of students and teachers.
Methods: Design / updating of existing educational materials. Coordination with existing material and activities in this area (e.g. CDMP).
Entry Points: Programme starts in April/May 2007 - a firm / managing agent will run the project. DFID involved in programme development phase. Good point to incorporate climate change concerns – programme in design phase – DFID managing and keen to support these measures.
Information needs, monitoring and indicators: Careful design of educational material – use current approaches to assess impact of educational programme activities, potential to include before and after assessment of understanding of risks. Follow-up: Opportunity exists to strengthen the environmental risk assessment to include some climate concerns. Project is going through appraisal stage in Nov/Dec 2006. Direct follow up with DFID-B adviser for EIA. Assessment Table – Recommendation 1 Criteria and Indicator Rating Score Comments and Details Win-win options Does option address current climate variability and future
1 = only current, or future risks
2 Yes – actions should relate primarily to existing climate variability and incorporate some coverage of climate change issues.

Section 7: Adaptation options assessment
157
climate change? 2 = current and future
Existing risk management Is the option consistent with existing risk management activities?
1=No 2=Yes 1 Not appropriate to programme. Any materials should be consistent with existing educational material on relevant topics.
Cost effectiveness Can costs and benefits of option be easily determined?
1=No 2=Yes 1 Not easy for this type of activity. Some assessment of awareness of climate and disaster issues could be done before and after activities.
Adaptive flexibility Does the option focus on narrow range of future scenarios, or allow flexibility of response?
1=narrow 2=flexible
2 Information should be designed to be flexible, and to help explain uncertainties and their implications.
Unintended impacts Likely potential negative spin-off impacts beyond targeted activity?
1=High 2=Low
2 Low risk of this – care needs to be taken with delivery of information on current and future risks.
Practical considerations Is the option practical and feasible for donor, partner and implementer?
1=More problematic 2=Relatively simple
2 Previous attempts to get flood chapters in text book/curriculum were not approved (too negative). DFID keen to incorporate actions on climate variability and change. Timing is good as the programme is still in design stage.
Knowledge level How certain we are in predicting a particular change in hazard and its impact?
1=Low 2=High
1-2 Not relevant to these activities – uncertainty can be presented as part of information provision.
Policy Coherence Does \option reflect local and national DRR / adaptation plans or studies?
1=Low 2=High
2 Fits well – important to ensure coordination with existing curricula and activities of organisations such as CDMP.
Total score 14
i ODI (2005) ‘Aftershocks:’ study; EM-DAT/CRED database. ii Adger et al (2006) Fairness in Adaptation to Climate change MIT; Cambridge iii Van Aalst M (2006) Managing Climate Risk. Integrating adaptation into World Bank Group operations. World Bank, Washington, DC. iv Stern N (2007) The Economics of Climate Change: The Stern Review. Cambridge University Press; Cambridge (ref p489)