oregon department of transportation speed zone...
TRANSCRIPT

OREGON DEPARTMENT OF TRANSPORTATION
SPEED ZONE MANUAL
Traffic-Roadway Section March 2007

ii
PREFACE The purpose of this manual is to provide guidance for completing speed zone investigations in Oregon. The primary reason for establishing speed zones and speed limits is safety. In setting speeds, decision-makers attempt to strike an appropriate balance between travel time and risk for the specific highway section. The posted speed should inform motorists of maximum driving speeds that are considered reasonable and safe for a highway section under favorable conditions. Safe and reasonable highway speeds are determined through an engineering investigation. The investigation is based upon nationally accepted standards that include a full review of roadway characteristics. These characteristics include traffic volumes, crash history, highway geometry, roadside culture and density, etc. The primary factor used in establishing speed zones is the 85th percentile speed (the speed at or below which 85 percent of the vehicles are traveling). Most motorists drive in a reasonable and prudent manner, selecting their driving speeds so as to arrive at their destination safely. Regulatory signs are posted for those drivers who are unable to judge the capabilities of their vehicles (e.g., stopping, handling) and anticipate roadway geometry and roadside conditions sufficiently to determine appropriate driving speeds. Studies suggest posting speeds near the 85th percentile speed minimizes crash occurrence and provides favorable driver compliance. The availability of enforcement for traffic speeds is an important consideration in establishing a posted speed. Appropriate speed zones coupled with consistent enforcement increases the safe operation of traffic by discouraging high risk behavior.

iii
TABLE OF CONTENTS PREFACE.........................................................................................................................................ii STATUTES THAT GUIDE ESTABLISHEMENT OF SPEED ZONES .............................................1 SPEED ZONING GUIDELINES........................................................................................................2 SPEED ZONE INVESTIGATION......................................................................................................4
INTRODUCTION...........................................................................................................................4 PRELIMINARY REQUIREMENTS................................................................................................4 RESEARCH INVESTIGATION .....................................................................................................4
Established Speed Zones..........................................................................................................4 Previous Investigations..............................................................................................................5 Determining Mileposts on State Highways ................................................................................5 Current Map...............................................................................................................................9 Crash Data ................................................................................................................................9 Average Daily Traffic .................................................................................................................9
FIELD INVESTIGATION.............................................................................................................11 Roadway Data .........................................................................................................................11 Photographs ............................................................................................................................12 Spot Speed Check...................................................................................................................13
SPEED ZONE INVESTIGATION SUBMITTALS............................................................................17 INTRODUCTION.........................................................................................................................17 TRANSMITTAL LETTER............................................................................................................17 CORRESPONDENCE.................................................................................................................17 SUPPORTING DATA..................................................................................................................17 UNMARKED MAP ......................................................................................................................18 SPEED ZONE REPORT .............................................................................................................21
Report Outline .........................................................................................................................21 Report Heading: ......................................................................................................................27 Recommendation:....................................................................................................................28 Section Descriptions: ...............................................................................................................28 Historical Background..............................................................................................................32 Investigation Data Summary....................................................................................................32 Factors influencing Recommendation: ....................................................................................42
MAP ............................................................................................................................................43 PHOTOGRAPH PAGE ...............................................................................................................47 CRASH SUMMARY....................................................................................................................47 SPOT SPEED SUMMARY..........................................................................................................48
SCHOOL SPEED ZONES..............................................................................................................51 TEMPORARY SPEED ZONES ON NEW ROADWAYS ................................................................53 CONSTRUCTION SPEED ZONES ................................................................................................54 ESTABLISHING SPEED ZONES ON LOW VOLUME/GRAVEL ROADS ....................................55 EMERGENCY SPEED ZONES ......................................................................................................63 APPENDIX A: Crash Data Request Information.........................................................................64

iv
APPENDIX B: Speed Zone Field Investigation Checklist..........................................................65 APPENDIX C: Guidelines for Spot Speed Survey Reports .......................................................68 APPENDIX D: Procedure For Changing A Speed Zone Boundary Description...........69 GLOSSARY....................................................................................................................................70
FIGURES
Figure 1 Blank Example Request...................................................................................................6
Figure 1a Filled In Example Request ...............................................................................................7
Figure 1b Example Request Page 2 ..................................................................................................7
Figure 2 Crash Data Request Form ...............................................................................................10
Figure 3 Spot Speed Survey Form.................................................................................................16
Figure 4 Example Investigation Transmittal Letter .............................................................................19
Figure 5 Example Unmarked Map .................................................................................................20
Figure 6 Standard Outline Format Template ....................................................................................22
Figure 7 Example Speed Zone Investigation Report ..........................................................................24
Figure 7a Template Outline of Section Description Format....................................................................31
Figure 8 Example Motor Vehicle Crash Listing .................................................................................39
Figure 9 Example Spot Speed Check Summary................................................................................41
Figure 10 Example Completed Map.................................................................................................46
Figure 11 Example Typical Views Photograph Pages ..........................................................................49
Figure 12 Template Optional School Speed Zone Record.....................................................................52
Figure 13 Template Delegated Authority Request to Speed Zone Low Volume Public Road .........................57
Figure 14 Template Delegated Authority Request to Speed Zone Non-Hard Surfaced Public Road ................58 Figure 15 Sample Report for Single-Segment Speed Zones..................................................................59
Figure 16 Sample Report for Multi-Segment Speed Zones....................................................................60
Figure 17 Sample Map for Single-Segment Speed Zones .....................................................................61
Figure 18 Sample Map for Multi-Segment Speed Zones .......................................................................62
1
STATUTES THAT GUIDE THE ESTABLISHMENT OF SPEED ZONES State statutes give Oregon motorists the following designated speed zone standards. These statutory speeds can be posted at the discretion of the road authority if they meet the definitions described under ORS 801.100 (Definitions) and the criteria as described under ORS 811.105, ORS 811.111 and ORS 811.200:
15 mph – alleys; 20 mph – business districts, school zones; 25 mph – residential districts, public parks, ocean shores; 55 mph – open rural highways, trucks on interstate highways; 65 mph - passenger vehicles, light trucks, motor homes and light duty commercial vehicles on interstate highways.
State statute also gives the Department of Transportation the authority to establish speed zones other than statutory speeds on all public roadways in Oregon. It requires that an engineering investigation be conducted to determine what the appropriate speed should be (ORS 810.180). If the roadway is a paved low volume road (less that 400 ADT) or gravel road, the Department may delegate authority to the local road authority to conduct speed zone investigations and set speeds on roadways under their jurisdiction. ORS 810.180 (5) (f) says:
”The department, by rule, may delegate its authority under this subsection with respect to highways that are low volume or not hard surfaced to a city or county with jurisdiction over the highway. The department shall delegate authority under this paragraph only if it determines that the city or county will exercise the authority according to criteria adopted by the department”.
For more information regarding speed zoning on low volume paved roads or gravel roads see page 51.

2
SPEED ZONING GUIDELINES The following guidelines will provide a consistent basis for the application of engineering principles to speed zoning. 1. Speed zones shall only be established on the basis of an engineering study. An engineering study
should be conducted whenever there is a change in the roadway that would affect the prevailing speed. Such changes would include roadway reconstruction, changes in roadside development, etc.
2. The engineering study includes a statistical analysis of the speed distribution of free-flowing vehicles on
the subject roadway. The speed limit within a speed zone should be set at the nearest 5 MPH increment to the 85th percentile speed.
3. The engineering study will consider other factors such as:
• Geometric features Geometric features include vertical / horizontal alignment and sight distance. Often times curve warning signs with speed advisory plaques are used rather than lower speed limits to accommodate curves and hills.
• Pedestrian and bicycle movements When determining the appropriate speed, pedestrian and bicycle movements should be taken in to consideration. The type of accommodations for non-motor traffic, such as sidewalks and separated cycling paths versus shoulder use, should be considered if there is consistent pedestrian or cyclist traffic.
• Kind and amount of adjacent land use It is desirable that features such as roadside development (business, residential, rural, etc.) within each speed zone be consistent, as comparable sections tend to encourage similar operating speeds. It is not always practical to subdivide a roadway section into homogenous speed zones because it could result in a number of short sections with various speed limits. The section length used for speed zoning should be at least ¼ of a mile in length, except transition speed zones may be a minimum of 1000 feet in length.
• Enforcement Signing alone is of little benefit accomplishing a change in travel speeds. Even if most drivers believe the limits are reasonable and comply with them, enforcement is essential to ensure conformity of the remaining drivers. Setting speed zones too low makes deterrence difficult and expensive. The deterrence effects of enforcement are temporary and must be reinforced often.
• Crash history A crash analysis should be conducted as a routine part of speed zone investigations. Speed zoning is not always and appropriate counter measure to address high crash situations. The analysis should identify high crash characteristics and problem locations. Common speed related crashes are run-off-road and rear-end crashes. The crash history is relevant to the speed zone if the crashes are spread out along a section, rather than concentrated around a single feature such as a severe curve or
3
intersection. A field review should be conducted to identify possible causes and develop recommendations for improvements for singular crash locations.
• Public testimony The road authority may consider public testimony before establishing a speed zone. Extenuating circumstances or other issues may be revealed beyond the speed zone investigation.
• Traffic Volumes Traffic volumes are a key factor affecting drivers’ choice of speeds and the determination of appropriate speed limits. On two lane rural highways, which have a more limited capacity and more restricted geometric design features, travel speeds tend to deteriorate more rapidly with increasing traffic volumes.
• Accesses Numerous accesses which are typically found in urban or community settings can increase the potential of vehicle conflicts.
4. Speed zones are not a tool to warn motorists of hazardous conditions. If a hazardous condition is found to
exist within a road segment under study, this condition should be corrected and/or an appropriate warning sign with an advisory speed rider should be posted.
5. Enforcement of speed limits within speed zones should be uniform. Efforts should be made to
coordinate the implementation of speed zones with the enforcement policies of the governing enforcement agency.

4
SPEED ZONE INVESTIGATION
INTRODUCTION This section discusses the necessary information to investigate, analyze and complete a speed zone review. Information collection includes research and field investigations. There is a detailed discussion of how to report results. Following these procedures and standards closely is required for acceptance of the report by the State Traffic Engineer. The documentation as described is necessary to prove in court that the speed was rightly determined.
PRELIMINARY REQUIREMENTS Before a speed zone investigation can begin there must be a written request from all road jurisdictions involved in ownership, maintenance and enforcement in the section of road to be investigated. This is the authorization to perform the work on that road. If a city or county is investigating a road under its own jurisdiction, concurrence is needed from any other agency that shares jurisdiction of the section of road investigated. For an investigation on a city street, county road, or state highway within a city there should be a “Speed Zone Request” form. This form gives all required information about the roadway, and it shows what the roadway authority (both engineering and enforcement) think the speed zone should be and why. When an agency conducts its own investigation, the information requested on this form is part of the submittal to the State Traffic Engineer for speed zone approval. (See Figure 1.) The initial request may also be in the form of a letter, memo or email acknowledging a phone request. Written request(s) and concurrence from each affected road authority are needed before work can begin. The request should contain at least the section of road to be investigated, the reason for the review and a recommended speed. If any of these items are missing, they need to be established by correspondence with the Region office or road authority. Documentation of the correspondence must be included with the report transmittal letter.
RESEARCH INVESTIGATION Research and compile the following before performing the field investigation: • Established speed zones
• The latest previous investigation
• Current map
• Crash Data
• Average Daily Traffic Established speed zones Obtain current orders from ODOT Region or headquarters Traffic offices. • Determine both former and current names for the investigated roadway and former and current road
authorities.
• Be certain to have all active orders that cover part of or are contiguous with the roadway section to be investigated.
• If an order is found and the ordered speed is posted, consider the speed established.
5
• If no order is found but a speed is posted, determine if it fits one of the statutory speeds defined in ORS Chapter 811.105 or ORS 811.111. If no statutory speed applies, consider the speed unestablished. It may be necessary for the local road authority to remove or cover existing signs before completing the investigation. This decision will depend on factors such as the length of time the unestablished speeds have been posted and design speeds on a new road.
Remember that city limits are subject to change and road names can change along a corridor, as when the road changes from one jurisdiction to another. Historically, separate orders were written for each road authority. Keep this in mind when reviewing the existing orders to determine that all pertinent orders have been considered. Corrections to road names, boundary descriptions, etc., when the existing speed zone order references are no longer used or otherwise no longer relevant: Some older speed zone orders refer to city limits as speed zone boundaries, requiring a change in the description of that speed zone. Other changes may be needed as well, such as street name changes, new streets closer to the beginning/end of the speed zone than the street referenced, or a roadside change that requires the sign to be relocated. In order to write a new description, the location will have to be verified in the field. Determine where the location should be from known streets at the time of the original speed zone order and map plus other historical documents if necessary, in order to prepare for the field work.
Previous Investigations Obtain a copy of the latest previous investigation from the ODOT Region or headquarters Traffic offices. Determining Mileposts on State Highways There are different data sources to determine the milepoints to use for the maps and speed zone descriptions, and the info obtained from the different sources can vary. The milepoint information in ITIS, the straight-line information, can be as much as 200 feet off, 100 feet either direction. With office corrections over the years for roadway alignment changes, these distances can be even longer. This is hard to determine in the field, and ITIS is still the main choice, as many features surveyed in the field will have corresponding milepoints assigned to them in ITIS. The data in GIS has often been corrected to be able to scale it with other types of data than linear data. Eventually this information may be the main source, but as of now, it should be used as an alternative to help sort out discrepancies when there is conflicting milepoint information. When possible, use ITIS bridge milepoints for tying field work to ITIS. These are the most likely to be surveyed milepoints. Otherwise use a major right-angle intersection centerline. If neither opportunity is available, reconcile to the intersection that has the most agreement on milepoint assignment from ITIS, GIS and/or the Microstation map. The Microstation maps derived from aerial surveys have been corrected for both vertical and horizontal coordinates. However, it doesn’t have all the features mileposted or available to scale off the map. Be aware of the possible discrepancies between the electronic maps and the straight-line data in ITIS. Approach reconciling straight-line data, and your field data, to the map by keeping distances proportionately correct per the field logs.

6
EXAMPLE Oregon Department of Transportation
Speed Zone Request
To request a Speed Zone Investigation by ODOT personnel, City or County Engineering Department staff should complete this form and send it - with a map of the roadway - to:
State Traffic Engineer Oregon Department of Transportation
355 Capitol Street NE, Fifth Floor Salem, OR 97301-3871
1. AGENCY NAME 2. DATE
3/19/2007 3. CONTACT NAME AND TITLE 4. TELEPHONE NUMBER 5. E-MAIL ADDRESS 6. FAX NUMBER 7. ADDRESS (POSTAL)
8. NAME OF ROADWAY
9. FROM 10. TO 11. REQUESTED SPEED - MPH 12. EXISTING POSTED SPEED - MPH 13. EXISTING SPEEDS OF ROADWAY ABUTTING THIS SECTION 14a. ENTERING - MPH: 14b. EXITING - MPH: 15. AVERAGE DAILY TRAFFIC VOLUME
16. ROADWAY CLASSIFICATION: LOCAL COLLECTOR ARTERIAL
17. Speed recommendation from City or County Engineering Department (required per ORS 810.180): MPH 18. Reasons for this recommendation: 19. Are curves in this section of roadway signed appropriately? YES NO 20. Is the recommended speed consistent with the speeds of similar roadways in the surrounding area? YES NO 21. Speed Recommendation from enforcement: MPH 22. Reasons for this recommendation: 23. Are there special plans to enforce the proposed speed zoning? (explain): 24. Speed Recommendation from local residents: MPH 25. Reasons for this recommendation: TO BE COMPLETED BY ODOT STAFF 26. Speed Recommendation from ODOT Region Traffic Engineering Staff: MPH 27. Reasons: If you have questions on speed zones, contact the ODOT Traffic-Roadway Section in Salem at 986-3609, FAX 986-4063 or your local ODOT Region Traffic Office (see reverse for addresses).
FIGURE 1 (Blank Example Request -Page 1)

7
Oregon Department of Transportation
Speed Zone Request
To request a Speed Zone Investigation by ODOT personnel, City or County Engineering Department staff should complete this form and send it - with a map of the roadway - to:
State Traffic Engineer Oregon Department of Transportation
355 Capitol Street NE, Fifth Floor Salem, OR 97301-3871
1. AGENCY NAME 2. DATE
City of Millersburg 03/18/03 3. CONTACT NAME AND TITLE 4. TELEPHONE NUMBERBarbara Castillo, City Recorder 541-928-4523 5. E-MAIL ADDRESS 6. FAX [email protected] 541-928-4524 7. ADDRESS (POSTAL)
4222 Old Salem Road NE Millersburg, OR 97321 8. NAME OF ROADWAY
Millersburg Drive, NE
9. FROM 10. TOMorningstar Road 1.30 mile east of Morningstar Road (RR Xing) 11. REQUESTED SPEED - MPH 12. EXISTING POSTED SPEED - MPH 13. EXISTING SPEEDS OF ROADWAY ABUTTING THIS SECTION40 MPH None 14a. ENTERING - MPH: 55 14b. EXITING - MPH: 55 15. AVERAGE DAILY TRAFFIC VOLUME
600
16. ROADWAY CLASSIFICATION: LOCAL COLLECTOR ARTERIAL
17. Speed recommendation from City or County Engineering Department (required per ORS 810.180): 40 MPH18. Reasons for this recommendation: This is a rural residential area. There are 51 homes in a 1.24-mile stretch of road with many children living in the area. People are driving way too fast through this area. Safety is the key issue 19. Are curves in this section of roadway signed appropriately? YES NO 20. Is the recommended speed consistent with the speeds of similar roadways in the surrounding area? YES NO 21. Speed Recommendation from enforcement: 40 MPH 22. Reasons for this recommendation: Safety 23. Are there special plans to enforce the proposed speed zoning? (explain): Posted speed limit signs and extra police patrols 24. Speed Recommendation from local residents: 40 MPH 25. Reasons for this recommendation: Safety issues. There are many people out walking, biking, etc. along Millersburg Drive. The density is too high for 55 MPH. TO BE COMPLETED BY ODOT STAFF 26. Speed Recommendation from ODOT Region Traffic Engineering Staff: MPH 27. Reasons: If you have questions on speed zones, contact the ODOT Traffic-Roadway Section in Salem at 986-3609, FAX 986-4063 or your local ODOT Region Traffic Office (see reverse for addresses).
FIGURE 1 (Filled In Example Request -Page 1)

8
When should speed zone investigations be requested? When traffic patterns have changed, development has occurred, crashes have increased, or requests have been received from a number of area residents or businesses. Oregon law gives the State Department of Transportation the authority to establish speed zones on all roadways in Oregon. It also states that an engineering investigation will be done to determine what the appropriate speed should be (ORS 810.180). The local roadway authority (the city or county) needs to complete this form and submit it to ODOT to request an investigation. This form facilitates the request by providing ODOT with the pertinent local information needed to complete the investigation. Further speed zoning information may be obtained from your local ODOT Region Traffic Office at the address below: Region 1 123 NW Flanders Portland, OR 97209-4012 Tele: (503) 731-8300 FAX: (503) 731-8259
Region 2 Region 2 Tech Center 455 Airport Rd SE, Bldg A Salem, OR 97301-4989 Tele: 503-986-2990 Fax: 503-986-2839
Region 3 3500 NW Stewart Parkway Roseburg, OR 97470-1687 Tele: (541) 440-3399 FAX: (541) 440-3465
Region 4 63055 N. Hwy 97 PO Box 5309 Bend, OR 97708-5309 Tele: (541) 388-6189 FAX: (541) 388-6231
Region 5 3012 Island Avenue La Grande, OR 97850-9497 Tele: (541) 963-3177 FAX (541) 963-9079
FIGURE 1b (EXAMPLE REQUEST -Page 2)

9
Current Map • Copy the most current map of the report area, showing connecting roadways and enough vicinity to readily
identify the area on a city or county map. When the total speed zoning extends for longer than can be shown on an 11” x 17” map at a reasonable scale, show all investigated sections and speed zoning between and at each end of them as a minimum.
• Show current jurisdictional boundaries, including whether the boundary runs along either side of the road or along centerline, or crosses the road.
• Using a large map sheet and scale will be helpful in the research and field phases, and in adding all of the data required for the report copy.
• Electronic copies of the map may be submitted with the report. Contact Traffic-Roadway Section to be sure of compatibility.
Crash Data • Order crash data for the requested section, on both a manual listing and "PRC" listing, from the ODOT
Crash Analysis and Reporting Unit.
• Crash data for each investigated section always includes at least 3 full calendar years of recorded crashes. Any partial year data for the current year from Crash Analysis and Reporting Unit can be included.
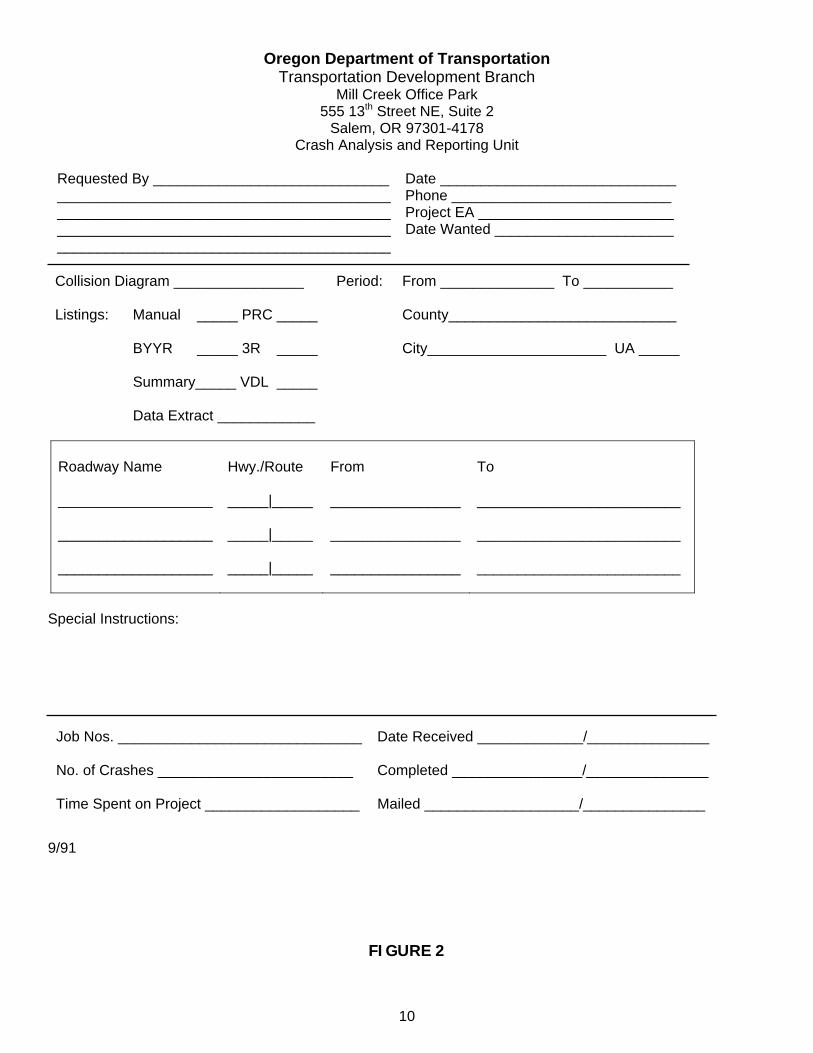
• For additional data if needed, use the Crash Data Request form (Figure 2). Since a speed zone investigation considers crash rates in the recommended sections including intersections, request that intersection crashes not be broken out. The exception to this is that intersections which begin/end a section are not included. Request that these crashes be excluded from the listing. Attaching a map to the crash listing request with the begin and end points labeled may help the Crash Analysis and Reporting Unit process the request faster. Refer to the Crash Summary section of this manual for summary directions.
• It is helpful to solicit crash records from the road authority as well. It is usually the city police or county sheriff’s offices that have this information. This can add valuable insight, especially if safety is cited in the speed zone review request as part of the speed zoning review need.
For a complete discussion of Crash Data Requests, refer to Appendix A, Crash Data Request Information.
Average Daily Traffic • The average daily traffic (ADT) for state highways will be supplied by Region.
• For city streets and county roads, the local jurisdiction must supply the traffic volumes.
• If the agency has no volume count within two or three years of the desired year, ask the agency to give an estimated ADT or call the ODOT Systems Monitoring Unit. Note the estimated ADT as “XXX (estimated)”.
• A two or three year old ADT may be “updated” using a rule-of-thumb of 2-5% growth per year.
10
Oregon Department of Transportation Transportation Development Branch
Mill Creek Office Park 555 13th Street NE, Suite 2
Salem, OR 97301-4178 Crash Analysis and Reporting Unit
Requested By _____________________________ ____________________________________________________________________________________________________________________________________________________________________
Date _____________________________ Phone ___________________________ Project EA ________________________ Date Wanted ______________________
Collision Diagram ________________ Listings: Manual _____ PRC _____
BYYR _____ 3R _____ Summary_____ VDL _____ Data Extract ____________
Period: From ______________ To ___________ County____________________________ City______________________ UA _____
Roadway Name ___________________ ___________________ ___________________
Hwy./Route _____|_____ _____|_____ _____|_____
From ________________ ________________ ________________
To _________________________ _________________________ _________________________
Special Instructions:
Job Nos. ______________________________ No. of Crashes ________________________ Time Spent on Project ___________________
Date Received _____________/_______________ Completed ________________/_______________ Mailed ___________________/_______________
9/91 FIGURE 2

11
FIELD INVESTIGATION Perform a field investigation and compile the following information: • Roadway Data
• Photographs
• Spot Speed Data Appendix B contains a Speed Zone Field Investigations Checklist
Roadway Data 1. Drive the roadway length noting topography, traffic flow, comfortable speeds and general road and traffic
conditions. Note conditions in high crash sections separately. 2. For state highways, milepost the investigated section using the same direction as the established
mileposts. For local roadways, milepost the investigated portion starting at the end closest to the city center or city limits, or the first boundary in the order listed by the road authority if not close to a city. The milepost numbering does not have to coincide with the local milepost system. In most cases, it is easiest to begin with milepoint zero.
3. Verify speed zone boundaries, including any needed changes. See Appendix D for a full discussion of
making changes to speed zone boundaries, including where the speed is not being investigated. 4. Document the following in a milepoint log:
Alignment • Horizontal alignment noting:
Number of horizontal curves: a method to decide if a section of road is on a curve in the field is to sight ahead, establishing a straight line of sight along the fog line or center line. If the road does not follow the line of sight, call it a curve.
Safe speed on curve, determining:
Note if needed signing is in place, and Need for curve signing including ball bank tests or other accepted measures for safe speed if a
curve is questionable, or if the advisory speed is questionable.
• Vertical alignment noting:
number of curves
order of sag and crest curves or
consistency of grade.
• Sight distances, noting:
Locations with substandard stopping sight distance for intersections and major commercial driveways, and
where needed advance signing does not exist. Roadside Conditions • Note sections where driving requirements differ significantly due to
roadside development
traffic volumes and movements.

12
• On-street parking sections.
• Bike/Pedestrian facilities as established by pavement markings and signing.
• The centerline of driveways unless there are too many to note practically. If there are numerous accesses, use comments such as “Avg. 50 feet apart left" or "15 left/14 right" with begin and end milepoints. For very long sections (over a mile) with consistently dense accesses, note “numerous” with begin and end milepoints. (NOTE: It’s very rare when at least a count isn’t very doable. Where it’s reasonable, a count should be done.)
• Signs:
location (offset, R/L ahead on line),
legend, and
sizing if nonstandard or oversized sign. Roadway Characteristics • Intersections:
type,
milepoint of centerline,
alignment (left/right),
traffic controls and
intersecting street surfacing
• Typical sections:
Shoulder to shoulder or back of sidewalks (Do not include sidewalks if separated by planting or other area)
Note median, roadway and shoulder width extremes in each investigated section.
Note range of widths
of shoulders (by type),
bike lanes,
travel lanes,
medians (by type)
islands channelization, and sidewalks
• Railroad crossings.
Photographs The photographs are intended to document the descriptions of the roadway and major factors considered in the recommendation for the report. Digital photographs are preferred, although photographic prints are fine. Instant type photos are not acceptable, as they are too bulky for the files and don't last as long. Follow these guidelines when taking photographs: Choosing photo locations • Choose photo locations to show
roadway character

13
roadside culture, signs and
features referenced in the Speed Zone Report and Transmittal letter
• Photographs should represent each section but are not required to overlap.
• Space photo locations up to 1/4 mile apart while still showing roadway characteristics important to the report recommendations. Spacing may be greater than 1/4 mile if there is no change in the roadway or the roadside culture, and the section is longer than 1 mile.
• Include photos showing both current speed zones and any expected speed zone changes.
• Include photos of the beginning and end of the investigated section.
• For intersections, choose a photo location inside the section and far enough away from the intersection to show all approaches and close enough to show roadside features and traffic control detail.
Taking photographs • Take photographs from the roadway centerline. Use a two person crew and/or medians and crosswalk
areas if necessary for safety when traffic volumes are high.
• Take one photograph ahead on line and one photograph back on line from every photo location. Recording the photographs • Number the photographs consecutively in milepoint order. (There will usually be two numbers per
milepoint)
• Log the photographs using consistently odd numbers for one of the directions and even numbers for the other direction.
• Record the direction of view and milepoint or distance from the nearest intersection for each photograph. The location of the photograph given in the report will be the distance from the nearest intersection.
Spot Speed Check Spot speed checks provide information on current traffic conditions and driving decisions. Only free flow vehicles are counted as making independent choices. This means only one vehicle in a queue is recorded. A queue is when there is less than a 4 second gap between vehicles. Every investigated section in the Speed Zone Report must have at least one spot speed check for each investigated section. An investigated section is determined by the recommended speed zoning. Minimum spot speed check requirements: • Every 1/2 mile with a minimum of two spot speed checks per mile.
When driving conditions remain virtually unchanged, the interval can be lengthened to 1 mile, or longer for a very long (>3 miles) investigated portion.
• When there is a definite change over 1/4 mile in roadside culture or roadway cross section suggesting a change in driving speed.
• For each existing speed zone in the investigated section. If you are considering splitting an existing speed zone, take a spot speed check in each section of the split.
Choosing spot speed locations • Tangent sections away from controlled intersections are preferable.

14
• Do not take spot speeds on curves or near stopped or signalized intersections.
If the section is mostly curves, take spot speeds from a representative location.
If the section has closely spaced controlled intersections, try to gain a mid-block location, or split the directions into separate locations for optimum free flow data.
• Locations should be chosen with the request information in mind. They should be designed to answer the road authority's concerns. This may mean checking
close to speed zone changes,
near a particular development or
taking more checks than the minimum requirement.
Attention paid to good judgment in the choice of spot speed checks will eliminate most re-work needed for appropriate data.
Recording spot speed checks • Fill out the heading on the Spot Speed Survey form (Figure 3).
• The listing of the city or county name should be the road authority for that section.
Only use city names listed in the "Oregon Bluebook" (incorporated cites), otherwise use the county name. Note the names of unincorporated communities in parentheses if they are within the investigated section.
On state highways, use the official highway name, route number, and milepoint.
• Enter the street or road name used by the road authority for a city street or county road. If the road carries 2 names, as can be the case with state highways, list the name on the street signs with the alternate name in parentheses.
• Label each column with the traffic direction at the top.
• Enter the posted speed for the section investigated. If no speed is posted, enter "55 mph". Use the designated statutory speed (ORS 811.105 or ORS 811.111) for a residential or business district with no signing.
• Send a copy of the count with the report to the State Traffic Engineer.
Electronic data must be supported with a hard copy of the raw data (See Note below)
• Record the time in hours and minutes. Note the time the spot speed check began and the time completed. If the count is interrupted for any reason, record each count period.
NOTE: Electronic traffic counters may be used if they can distinguish and analyze headway to count only free flow vehicles as defined above, and if they can tally speeds in 1 mile per hour increments. If an electronic counter is used, the automated analysis must include all of the following, or analysis will have to be completed manually for submittal:
• 85th percentile speed
• 10 mile per hour pace limits
• Percent of traffic in the 10 mile per hour pace
• Posted speed
• Percent of traffic exceeding the posted speed
• Maximum speed, per direction and combined

15
• Line or data point chart showing total vehicles tallied per speed (MPH) in 1 mile increments vs. percentage of total vehicles counted (percentile). The chart must be scaled to read percentile accurately for any speed.
Spot speed check operations • Take checks
in normal weather,
during regular daylight hours and
at free flow rather than peak traffic periods.
Do not record speeds of passing vehicles.
Record trucks or other commercial vehicle speeds separately.
• Count at least 75 vehicles in each direction.
• Spend no longer than 3 hours on a spot speed check even if less than 75 vehicles per direction are counted in that time.
Observation time on low volume roads (less than 400 Average Daily Traffic) may be limited to one hour providing less than 8 total countable vehicles are counted in one hour.
• Tally pedestrians and bicycles traveling along the roadside
Count separately for each direction.
Separate counts by estimated general age of cyclist:
Child (up to 12 years)
Youth (from 13-20 years)
Adult (21 years and older)
Do not include pedestrian or bicycle cross-traffic. Once the analysis is done for the initial field work it may prove that an appropriate speed zone recommendation needs additional spot speed data to meet the above spot speed check requirements. Additional spot speed checks must then be taken to complete the work. Experience with speed zone investigations will minimize this additional field work.

16
OREGON STATE DEPARTMENT OF TRANSPORTATION
Traffic Engineering Section SPOT SPEED SURVEY
City: _______________________ Route: ___________________ Hwy #: _______ MP: ________ Date: ____________________ Day: _____________________ Time: ______________________ Weather: ___________________ Sign Speed: ___________ Observer: _____________________ Location Description: _____________________________________________________________ Remarks: ________________________________ _________________________________________ Bicycles:_________________________________ Pedestrians______________________________
Pavement Width __________ ft. _________ Shoulder Width __________ ft. _________ __________ ft. _________
Passenger Cars Trucks Bus M P H Bound Tot. % Bound Tot. % Bound Tot. % Bound Tot. % Bd Bd
70 + 70 + 70 + 70 + 69 69 69 69 68 68 68 68 67 67 67 67 66 66 66 66 65 65 65 65 64 64 64 64 63 63 63 63 62 62 62 62 61 61 61 61 60 60 60 60 59 59 59 59 58 58 58 58 57 57 57 57 56 56 56 56 55 55 55 55 54 54 54 54 53 53 53 53 52 52 52 52 51 51 51 51 50 50 50 50 49 49 49 49 48 48 48 48 47 47 47 47 46 46 46 46 45 45 45 45 44 44 44 44 43 43 43 43 42 42 42 42 41 41 41 41 40 40 40 40 39 39 39 39 38 38 38 38 37 37 37 37 36 36 36 36 35 35 35 35 34 34 34 34 33 33 33 33 32 32 32 32 31 31 31 31 30 30 30 30 29 29 29 29 28 28 28 28 27 27 27 27 26 26 26 26 25 25 25 25 24 24 24 24 23 23 23 23 22 22 22 22 21 21 21 21 20 20 20 20 19- 19- 19- 19-
FIGURE 3

17
SPEED ZONE INVESTIGATION SUBMITTALS
INTRODUCTION A Speed Zone Report includes the investigation data summary and resulting recommendation. One is written for every speed zone request and submitted to the State Traffic Engineer. All of the following is submitted with the Speed Zone Report to complete the report of investigation:
• 1 copy of the transmittal letter
• 1 copy of all correspondence
• 1 copy of each of the supporting data from the field investigation:
milepoint log,
raw speed data for each spot speed check,
investigation diary
• 1 copy of the unmarked map. May be submitted electronically: please check with Traffic-Roadway Section for compatibility.
• Completed Speed Zone Reports: one copy for each jurisdiction, one copy for Region files and one for Traffic-Roadway Section files.
TRANSMITTAL LETTER The transmittal letter discusses each segment of roadway investigated as well as special circumstances not listed in the Speed Zone Report. Information from phone conversations pertinent to the investigation and/or recommendations should also be included. Include a discussion of any needed speed zone boundary changes both those that were investigated and those that were not. If a needed change was not verified in the field, state that the change should be included in the next investigation and detail what change is needed. For each investigated segment, the transmittal letter presents results, reasons for recommendation and other considerations. Figure 4 is an example transmittal letter.
CORRESPONDENCE The correspondence as a minimum includes the request letter and the acknowledgment letter stating agreement to perform the speed zone study. Any additional related correspondence should be included.
SUPPORTING DATA Include • one copy of the raw data sheet for each Spot Speed check and
• PRC crash data received from the Crash Analysis and Reporting Unit
• Milepoint log
• Investigation diary of any unusual circumstances, conversations, time in the field, etc.

18
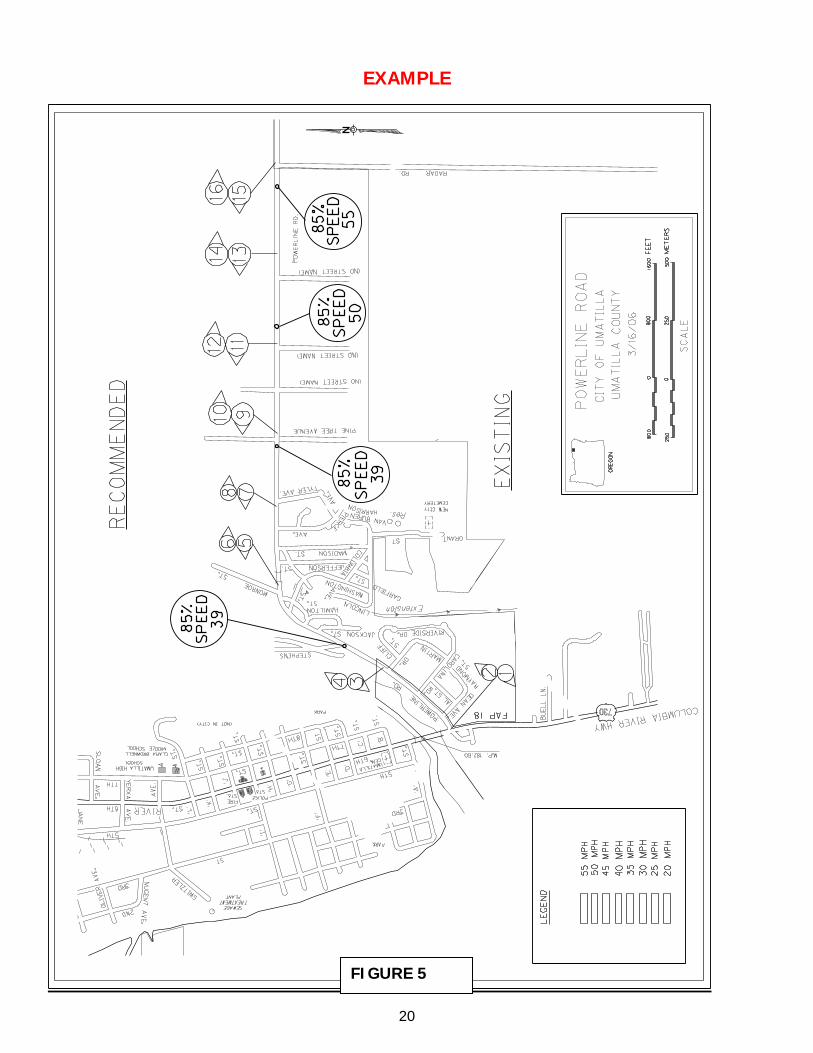
UNMARKED MAP Include one copy of the Speed Zone Report map with the title and color chart legend and north arrow, but no brackets, colors or labels. If you have created your map in CAD or some other electronic program, you are not required to include an unmarked map. See Figure 5 for the information included on the unmarked map.

19
I N T E R O F F I C E M E M OTECHNICAL SERVICES Traffic-Roadway Section
Office Phone: (503) 986-3609 Fax Number: (503) 986-4063
DATE: June 20, 2001 TO: Ed Fischer
State Traffic Engineer File Code: TRA 7-2
FROM: John Doe Region Traffic Investigator
SUBJECT: Speed Zone Recommendation
Powerline Road City of Umatilla Umatilla County
A speed zone investigation had been conducted at the subject location and report attached for your review and approval. The investigation was conducted in response to a request from Larry Clucas, City Administrator for the City of Umatilla with concurrence from Hal Phillips, Roadmaster for Umatilla County. The City has requested ODOT establish a 25 mph speed zone from the Columbia River Hwy (US 730) to Pine Tree Avenue and a 35 mph speed zone from Pine Tree Avenue to Radar Road. Section A, from the Columbia River Highway to 0.14 mile south of Pine Street is of residential culture with moderate density. The roadway is typically 20 feet wide with single 10 foot travel lanes. There were no reported crashes in the three-year crash study period. The spot speed data yields an average 85% speed of 39 mph. Pace limits were from 31-40 mph with 78% of the vehicles in pace. After consideration of the 85th percentile speed and crash history, I recommend retaining existing 35 mph speed zoning. Section B, from 0.14 mile south of Pine Street to Radar Road is of rural culture with sparse density. This section has two intersecting streets that will eventually be used to serve residential areas. The roadway is typically 20 feet wide with single 10 foot travel lanes. There was one reported crash in the three-year crash study period. The spot speed data yields an average 85% speed of 53 mph. Pace limits were from 44-53 mph with 62% of the vehicles in pace. After consideration of the 85th percentile speed, crash history and need for a transition speed zone, I recommend establishing a 45 mph speed zone. If you concur with this recommendation, please note your concurrence on the attached report. JD/cwc
FIGURE 4
EXAMPLE
20
EXAMPLE
FIGURE 5

21
SPEED ZONE REPORT The Speed Zone Report is considered a legal document proving the current speed zone was properly determined. The original is kept on file in the Traffic-Roadway Section, with copies kept in the Region office and in each pertinent jurisdiction. Each Speed Zone Report must closely adhere to the criteria as described in this manual. The report includes in the order of presentation: • a Report Outline,
• a marked Map,
• Photograph page(s),
• Crash Summary(s) and
• Spot Speed Summary(s).
Report Outline The Report Outline consists of the following nine components: • Report heading
• Recommendation
• Sections
• Historical background,
• Data Summaries
Investigation Data
Roadway Data
Crash Data
Spot Speed Data
• Factors influencing the recommendation The Report Outline should be complete and accurate and follow the standard format. See Figure 6 for the two page standard outline format. Figure 7 is a three page completed Speed Zone Report and Figure 7A shows the standard outline format for roadways with multiple names.

22
OREGON DEPARTMENT OF TRANSPORTATION Report of Speed Zone Investigation
Road name Begin Point of Speed Zoning/Investigation to End Point of Speed Zoning/Investigation
Jurisdiction Name(s) Report date
Recommendation: (Disposition of current speed zone orders and investigated sections) Section: Existing Recommended Investigated/Not Investigated Section From: Begin point by road or feature name w/
distance & direction MP (state hwy)
Posted speed (MPH)
Recommended Speed (MPH)
To: End point by road or feature name w/ distance & direction
MP (state hwy)
Posted speed (MPH)
Recommended Speed (MPH)
1/ Except that in the following sections, the designated speed shall be 20 mph as per provisions of ORS 811.111: (This exception applies to state highways only) From: Begin point by road or feature name w/ distance & direction
To: End point by road or feature name w/ distance & direction
Historical Background: Investigation Requested by: Name, title, Jurisdiction Requested Speed: (MPH) Previous Action: Existing Speed Zone Orders Investigation: Section/Part of Sec. Section Length 0.00 miles/ #ft<550' 85% Speed MPH (Last full year) Crash Rate* Acc/MVM (Same yr above) Average Daily Traffic Nearest 50 veh/day Culture Type and Density (See description) Horizontal Alignment (See description) Vertical Alignment (See description) Curve Signs & Speed Riders (See description) Existing Posted Speed MPH Recommended Speed MPH *Crashes per Million Vehicle Miles
FIGURE 6
TEMPLATE
23
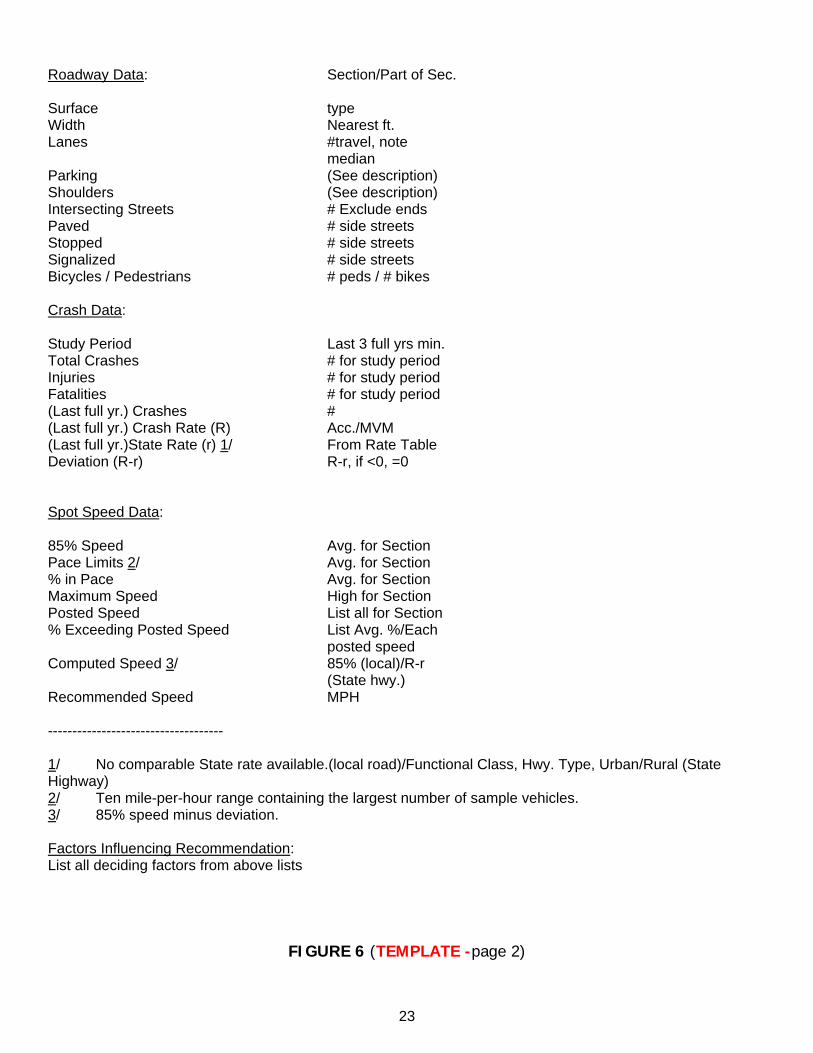
Roadway Data: Section/Part of Sec. Surface type Width Nearest ft. Lanes #travel, note
median Parking (See description) Shoulders (See description) Intersecting Streets # Exclude ends Paved # side streets Stopped # side streets Signalized # side streets Bicycles / Pedestrians # peds / # bikes Crash Data: Study Period Last 3 full yrs min. Total Crashes # for study period Injuries # for study period Fatalities # for study period (Last full yr.) Crashes # (Last full yr.) Crash Rate (R) Acc./MVM (Last full yr.)State Rate (r) 1/ From Rate Table Deviation (R-r) R-r, if <0, =0 Spot Speed Data: 85% Speed Avg. for Section Pace Limits 2/ Avg. for Section % in Pace Avg. for Section Maximum Speed High for Section Posted Speed List all for Section % Exceeding Posted Speed List Avg. %/Each
posted speed Computed Speed 3/ 85% (local)/R-r
(State hwy.) Recommended Speed MPH ------------------------------------ 1/ No comparable State rate available.(local road)/Functional Class, Hwy. Type, Urban/Rural (State Highway) 2/ Ten mile-per-hour range containing the largest number of sample vehicles. 3/ 85% speed minus deviation. Factors Influencing Recommendation: List all deciding factors from above lists FIGURE 6 (TEMPLATE -page 2)

24
OREGON DEPARTMENT OF TRANSPORTATION Report of Speed Zone Investigation
Umatilla – Stanfield Highway (US 395) Canal Road (MP 10.01) to 0.79 mile south of Irwin Road (MP 12.90)
City of Stanfield / OTC June 27, 2001
Recommendation: Rescind Speed Zone Order by Delegated Authority No. 1327D and OTC Order No. 1197 both dated August 28, 1998 and establish the following speed zoning: Section: Existing Recommended Investigated A From: Canal Road MP 9.98 45 MPH 45 MPH 2/ To: Arborvitae Lane MP 10.20 A From: Arborvitae Lane MP 10.20 45 MPH 45 MPH 3/ To: Locust Street MP 10.46
Not Investigated B From: Locust Street MP 10.46 30 MPH 30 MPH 3/ To: Dunne Street MP 11.40 B From: Dunne Street MP 11.40 30 MPH 30 MPH 2/ To: 350 feet south of Dunne Street MP 11.46 C From: 350 feet south of Dunne Street MP 11.46 45 MPH 45 MPH 2/ To: 0.12 mile south of Dunne Street MP 11.52 C From: 0.12 mile south of Dunne Street MP 11.52 45 MPH 45 MPH 3/ To: 0.32 mile south of Irwin Road MP 12.44 C From: 0.32 mile south of Irwin Road MP 12.44 45 MPH 45 MPH 2/ To: 400’ S of eastbound I-84 on-ramp MP 2C12.73 1/ Except that in the following sections, the designated speed shall be 20 mph as per provisions of ORS 811.111: (This exception applies to state highways only) From: 200 feet north of Harding Avenue (MP 10.73) To: 200 feet south of Harding Avenue (MP 10.81) From: 25 feet south of Wood Avenue (MP 10.98) To: 25 feet north of Furnish Avenue (MP 11.07) 2/ OTC 3/ City of Stanfield Historical Background: Investigation Requested by: Chief Robert Akers, Stanfield Police Department Requested Speed: 30 MPH Previous Action: Speed Zone Order by Delegated Authority No. 1327D and OTC Order No. 1197 both dated August 28, 1998.
FIGURE 7
EXAMPLE

25
Investigation: Section A Section B&C
Investigated Not Investigated Section Length 0.48 mile 85% Speed 52 MPH 1999 Crash Rate* 0.92 1999 Average Daily Traffic 12,400 Culture Type and Density Sparse Residential / Business Horizontal Alignment Tangent Vertical Alignment Level Curve Signs & Speed Riders None Existing Posted Speed 45 MPH Recommended Speed 45 MPH *Crashes per Million Vehicle Miles Roadway Data: Surface Bituminous Width 62’ (fog line-fog line) Lanes 4 (w/center turn lane) Parking Not Prohibited Shoulders 8’ paved / 9’ gravel Intersecting Streets 1 Paved 1 Stopped 0 Signalized 0 Bicycles / Pedestrians 5/0 Crash Data: Study Period 01/01/97-12/31/99 Total Crashes 4 Injuries 2 Fatalities 0 1999 Crashes 2 1999 Crash Rate (R) 0.92 1999 State Rate (r) 1/ 3.50 Deviation (R-r) 0.00
FIGURE 7 (EXAMPLE - page 2)
26
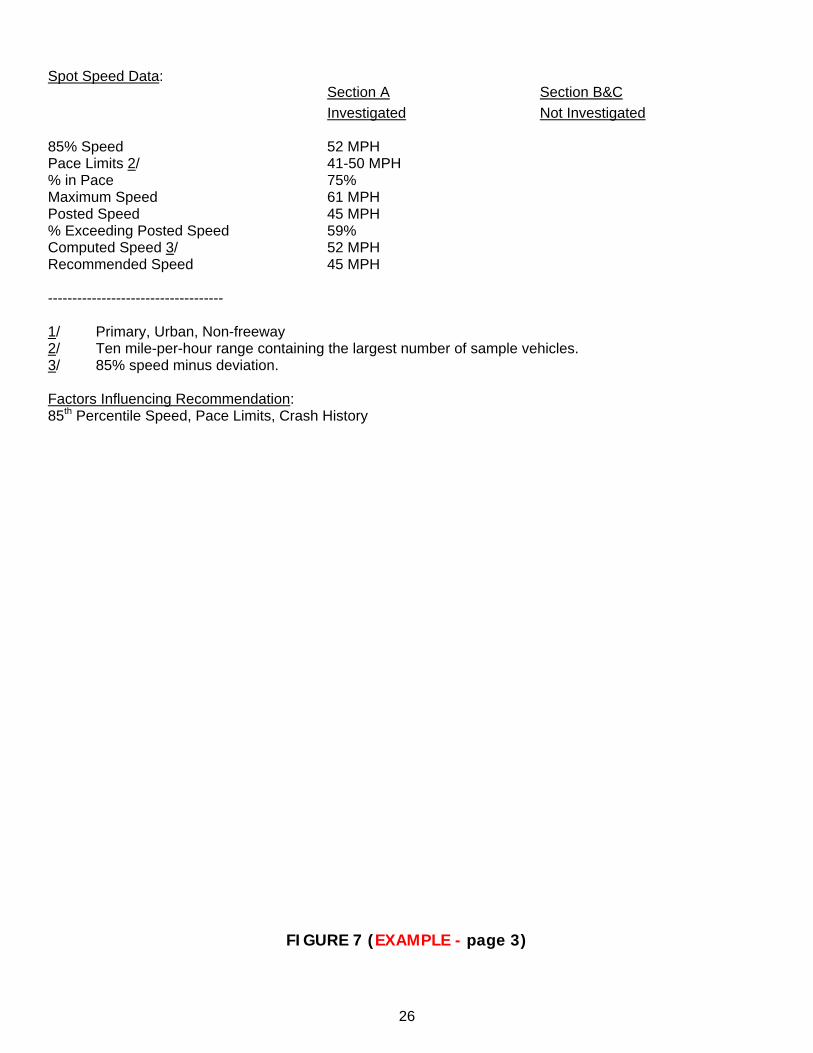
Spot Speed Data:
Section A Section B&C Investigated Not Investigated 85% Speed 52 MPH Pace Limits 2/ 41-50 MPH % in Pace 75% Maximum Speed 61 MPH Posted Speed 45 MPH % Exceeding Posted Speed 59% Computed Speed 3/ 52 MPH Recommended Speed 45 MPH ------------------------------------ 1/ Primary, Urban, Non-freeway 2/ Ten mile-per-hour range containing the largest number of sample vehicles. 3/ 85% speed minus deviation. Factors Influencing Recommendation: 85th Percentile Speed, Pace Limits, Crash History
FIGURE 7 (EXAMPLE - page 3)

27
Report Heading: The heading consists of the following six lines:
1 2 3 4 5 6
OREGON DEPARTMENT OF TRANSPORTATION Report of Speed Zone Investigation
name of highway, street or road Description of beginning and ending points City and/or county jurisdiction and/or OTC
Date Lines 1 and 2
Lines 1 and 2 should remain the same for most reports. When the investigation was completed under the direction of a road authority other than ODOT, the road authority or consultant should use their own official designation on Line 1. Line 3
This line gives all pertinent names for the road investigated. On state highways, use the official highway name and route number. Abbreviate the route number (US XX) or (OR XX) and milepoint (MP) and abbreviate other words only as necessary to fit the report format. The route number can be added in parentheses. For county roads or city streets that are not state highways, use the name preferred by the responsible jurisdiction. If a roadway has two names then show both. When the report recommends to "Retain" the present order, use the name of the street or road shown on the order. If the current name is different, add it in parentheses. Line 4
The report includes the investigated section of road along with all orders contiguous along the road including the investigated section. This line lists the beginning and end of the current speed zoning together with the investigation. In most cases one or both endpoints will be outside of the investigated section. All investigated sections, the orders contiguous with the investigated sections and with each other are included within the end points listed here. These end points are described by distance and direction from the nearest intersection. (e.g., 450 ft. east of Current Road). If you are changing this description due to road changes and not due to the speed investigation, the change must have been verified in the field. See Appendix D for the full discussion on making description changes. On state highways, list the begin and end points beginning with the lowest milepoint. For local roads list the begin and end points moving from the city center toward city limits into the county.
When to use Milepoints
• If the report begins and/or ends on a state highway, spur or connection, use milepoints in addition to the distance from the nearest cross street.
• Do not use milepoints for city streets or county roads.
• If the report of a city street or a county road begins and/or ends at a state highway, use the highway name and route number, but not the milepoint, in the description.
Line 5
This line includes all roadway jurisdictions involved in the investigated sections and the current speed zone orders. Joint jurisdiction (more than one road authority shares responsibility for a single section of road) must include active responsibilities such as enforcement, right of way or maintenance authority. The Oregon Transportation Commission (OTC) has sole speed zoning jurisdiction for rural state highways.

28
Use the following format for line 5, adding the number of road authorities necessary: ROAD CATEGORY City street or State highway in the city State highway outside city State highway in & out of city County road in county Road in city and county Joint jurisdictions
Line 5 City of XX OTC City of XX & OTC XX County City of XX & XX County RoadAuthority1/RoadAuthority2
Line 6
This line establishes the reporting date. Line 6 should have the month, day and year the report is completed by the investigator.
Recommendation: This statement gives the recommended disposition of existing orders and any new speed zoning. It must include the disposition of all orders in the speed zone report. Recommendations are written in the following formats, combining formats as needed to include all existing orders and changes: a) "Retain Order¹ No. XXXX dated XXX:"
This recommendation is used only when the entire order(s) is being retained with no changes, including school zone or boundary name changes.
b) "Rescind Order¹ No. XXXX dated XXX and establish the following speed zoning:" Use this wording when changing the designated speed of a speed zone, adding to or dropping sections of speed zones, or changing school zones or speed zone boundary road names.
c) "Establish the following speed zoning:" Use alone only when the present speed is statutory or basic rule. An unestablished posted speed is considered to be statutory or basic rule unless covered by an existing order. ¹ Use the same labeling (i.e., Order, Resolution, Speed Zone Rule, etc.) as the original document.
Section Descriptions: This part provides the descriptions to identify both the existing and recommended speed zoning on the road along with any road name and jurisdictional changes. This information is used to write the speed zone orders and to document the current conditions. It is organized as follows and generally in the same order:
• investigated or not investigated
• road name (if more than one),
• direction of travel (if divided roadway or couplet),
• recommended speed sections and
• road authority. Note that no one of the above factors is exclusive of the others, except that division by road authority is always described within each recommended speed section. If you are changing a description because of road or roadside changes and not as part of the speed investigation, the new description must be verified in the field. See Appendix D for a full discussion of making description changes. Investigated or Not Investigated
29
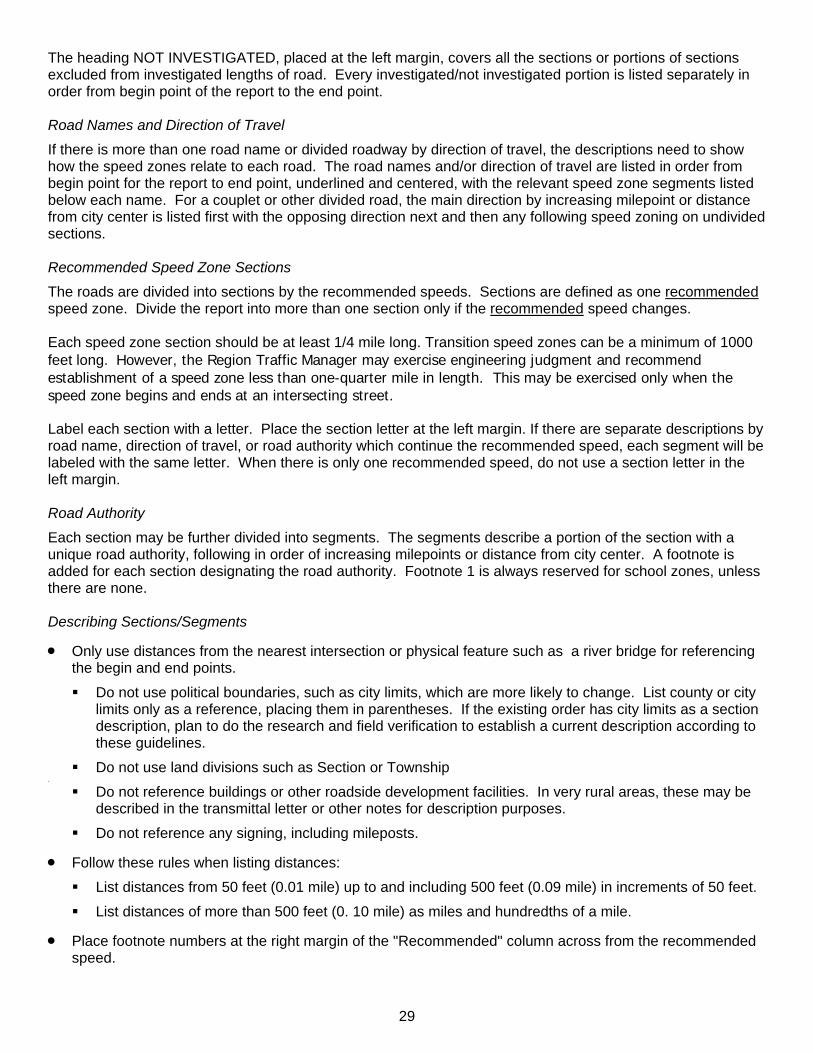
The heading NOT INVESTIGATED, placed at the left margin, covers all the sections or portions of sections excluded from investigated lengths of road. Every investigated/not investigated portion is listed separately in order from begin point of the report to the end point. Road Names and Direction of Travel
If there is more than one road name or divided roadway by direction of travel, the descriptions need to show how the speed zones relate to each road. The road names and/or direction of travel are listed in order from begin point for the report to end point, underlined and centered, with the relevant speed zone segments listed below each name. For a couplet or other divided road, the main direction by increasing milepoint or distance from city center is listed first with the opposing direction next and then any following speed zoning on undivided sections. Recommended Speed Zone Sections
The roads are divided into sections by the recommended speeds. Sections are defined as one recommended speed zone. Divide the report into more than one section only if the recommended speed changes. Each speed zone section should be at least 1/4 mile long. Transition speed zones can be a minimum of 1000 feet long. However, the Region Traffic Manager may exercise engineering judgment and recommend establishment of a speed zone less than one-quarter mile in length. This may be exercised only when the speed zone begins and ends at an intersecting street. Label each section with a letter. Place the section letter at the left margin. If there are separate descriptions by road name, direction of travel, or road authority which continue the recommended speed, each segment will be labeled with the same letter. When there is only one recommended speed, do not use a section letter in the left margin. Road Authority
Each section may be further divided into segments. The segments describe a portion of the section with a unique road authority, following in order of increasing milepoints or distance from city center. A footnote is added for each section designating the road authority. Footnote 1 is always reserved for school zones, unless there are none. Describing Sections/Segments
• Only use distances from the nearest intersection or physical feature such as a river bridge for referencing the begin and end points.
Do not use political boundaries, such as city limits, which are more likely to change. List county or city limits only as a reference, placing them in parentheses. If the existing order has city limits as a section description, plan to do the research and field verification to establish a current description according to these guidelines.
Do not use land divisions such as Section or Township .
Do not reference buildings or other roadside development facilities. In very rural areas, these may be described in the transmittal letter or other notes for description purposes.
Do not reference any signing, including mileposts.
• Follow these rules when listing distances:
List distances from 50 feet (0.01 mile) up to and including 500 feet (0.09 mile) in increments of 50 feet.
List distances of more than 500 feet (0. 10 mile) as miles and hundredths of a mile.
• Place footnote numbers at the right margin of the "Recommended" column across from the recommended speed.

30
On state highways with school speed zones, always use footnote 1 to refer to the school speed zone. It is not necessary to show school speed zones on local roadways. Local roadways and state highways that do not have school speed zones may start with footnote 1 to indicate the road authority of each segment.
Use footnotes to list the road authority for each segment
Use footnotes to include milepoint equations on state highways
Footnotes references are listed at the bottom of the Section Descriptions
Use the same boundary description conventions for describing school zone boundaries as for section and segment boundaries
Listing Existing & Recommended Speeds
• All speeds listed will include the units label (mph).
• Existing speeds shown are the legal current speeds. Posted speeds not established by order or statute are listed in parentheses beside the legal current speed, and noted as unestablished.
• The legal speeds not posted or where there is no order for the posted speed are the appropriate statutory speed.
• There can be more than one existing speed for each recommended speed zone. List all the existing speeds in a segment side by side separated by '/' , e.g., 45/55 MPH.
• Check to be sure there is at least one spot speed check in each existing speed portion of each section. There does not have to be a separate spot speed check for each segment.
• Each section has one recommended speed. This is listed for each segment within that section.

31
Outline of Section Description Format Section Existing Recommended Investigated On Road One A From: Beginning Road XX mph YY mph 2/ To: Next Road From: Next Road XX mph/YY mph YY mph 3/ To: 150 ft. E of Third Street Not Investigated B From: 150 ft. E of Third Street AA mph AA mph 2/ To: New 4th Avenue On New 4th Avenue From: Road One AA mph AA mph 2/ To: 500 ft. N of Throughway Avenue From: 500 ft. N of Throughway Avenue AA mph AA mph 3/ To: 150 ft. N of Industrial Road C From: 150 ft. N of Industrial Road BB mph BB mph 4/ To: Transition Street Investigated D From: Transition Street XX mph (stat) YY mph 1/ 4/ To: End Road 1/ Except that in the following sections, the designated speed shall be 20 mph as per provisions of
Subsection 1 (C) ORS 811.111: (State highways only) 2/ City One jurisdiction 3/ City One and The County joint jurisdiction 4/ The County jurisdiction
FIGURE 7a
TEMPLATE

32
Historical Background: Investigation Requests:
Include the source of each and all requests. Written requests for roads other than a rural State highway should come from one of the following:
• City, for city streets and state highways within the city.
• County, for county roads.
• All relevant agencies for multiple jurisdictions. A written request from one jurisdiction with written concurrence from the other jurisdiction(s) is acceptable.
Each request should include the begin and end points for the investigation and a requested speed. When the request is not clear, a Traffic-Roadway Section employee should seek written clarification from the requestor. A notation may be made on the original request in lieu of a second letter. On rural state highways, private citizens as well as public officials may submit a written request for an investigation. The letter of request author(s) name, title and agency is listed here. The list includes the agency making the original request and the source of concurrence from each concurring agency. When a citizen is the requestor, include his/her name and address on the report. If there is a petition, include only the name(s) of the person(s) submitting the petition. Requested Speed:
A requested speed is required. List the requested speed(s) by section(s), as necessary. Previous Action:
There are three ways to note a previous action:
• "None" indicates that no order exists on the entire length of road described in the report.
• “Established…” indicates that a current order exists. Include the order number and date of the order.
• “Rescinded…” indicates that an order was previously rescinded on this portion of road and no new order was issued.
Investigation Data Summary: A column is created for each section. One column is for one section, except that uninvestigated sections can be grouped together, as there will be no data in that column. Columns for investigated sections cannot be grouped. Account for each section by including column(s) with a “Not Investigated Sections _,_,_" in each investigation data summary category for sections not investigated or with a column headed by "Section _". Investigation
The Investigation component summarizes information from Roadway Data, Crash Data and Spot Speed Data along with basic information for each section. This information gives an overview of traffic conditions, putting together the traffic volumes, road alignment, crash history and prevailing speeds. Section Length:
Give the section length in miles and hundredths of miles. A section less than 1/4 mile is footnoted with an explanation in the reference note of the reason for the short section.
33
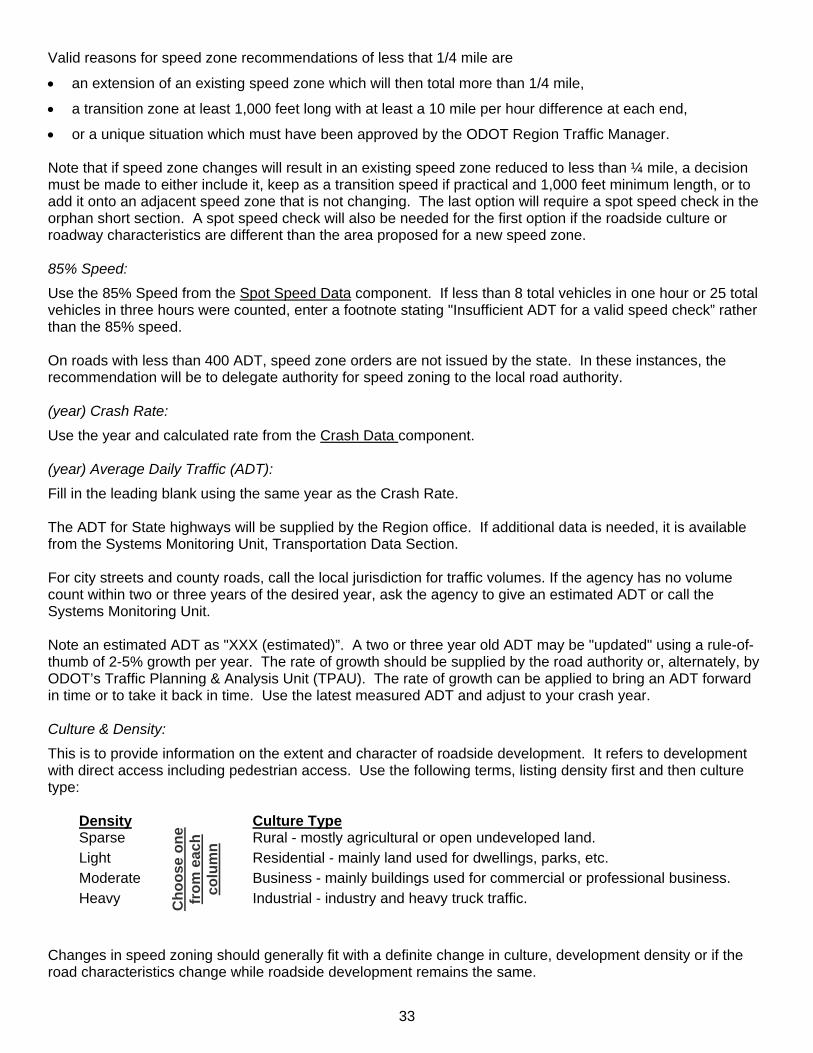
Valid reasons for speed zone recommendations of less that 1/4 mile are
• an extension of an existing speed zone which will then total more than 1/4 mile,
• a transition zone at least 1,000 feet long with at least a 10 mile per hour difference at each end,
• or a unique situation which must have been approved by the ODOT Region Traffic Manager. Note that if speed zone changes will result in an existing speed zone reduced to less than ¼ mile, a decision must be made to either include it, keep as a transition speed if practical and 1,000 feet minimum length, or to add it onto an adjacent speed zone that is not changing. The last option will require a spot speed check in the orphan short section. A spot speed check will also be needed for the first option if the roadside culture or roadway characteristics are different than the area proposed for a new speed zone. 85% Speed:
Use the 85% Speed from the Spot Speed Data component. If less than 8 total vehicles in one hour or 25 total vehicles in three hours were counted, enter a footnote stating "Insufficient ADT for a valid speed check” rather than the 85% speed. On roads with less than 400 ADT, speed zone orders are not issued by the state. In these instances, the recommendation will be to delegate authority for speed zoning to the local road authority. (year) Crash Rate:
Use the year and calculated rate from the Crash Data component. (year) Average Daily Traffic (ADT):
Fill in the leading blank using the same year as the Crash Rate. The ADT for State highways will be supplied by the Region office. If additional data is needed, it is available from the Systems Monitoring Unit, Transportation Data Section. For city streets and county roads, call the local jurisdiction for traffic volumes. If the agency has no volume count within two or three years of the desired year, ask the agency to give an estimated ADT or call the Systems Monitoring Unit. Note an estimated ADT as "XXX (estimated)”. A two or three year old ADT may be "updated" using a rule-of-thumb of 2-5% growth per year. The rate of growth should be supplied by the road authority or, alternately, by ODOT’s Traffic Planning & Analysis Unit (TPAU). The rate of growth can be applied to bring an ADT forward in time or to take it back in time. Use the latest measured ADT and adjust to your crash year. Culture & Density:
This is to provide information on the extent and character of roadside development. It refers to development with direct access including pedestrian access. Use the following terms, listing density first and then culture type:
Density Sparse Light Moderate Heavy
Cho
ose
one
from
eac
h co
lum
n
Culture Type Rural - mostly agricultural or open undeveloped land. Residential - mainly land used for dwellings, parks, etc. Business - mainly buildings used for commercial or professional business. Industrial - industry and heavy truck traffic.
Changes in speed zoning should generally fit with a definite change in culture, development density or if the road characteristics change while roadside development remains the same.
34
See the Glossary in Appendix F, ORS 801.170 and ORS 801.430 for further definitions and descriptions of culture type. Horizontal Alignment:
The horizontal alignment is for the entire section including the end intersections. Record as either “Tangent” or report the number of curves. Turns or sharp curves are called curves for the purposes of the report. Vertical Alignment: The vertical alignment is also for the entire section including the end intersections. It is a description of the general vertical alignment. Enter either “Level”, “Mostly level”, “Mildly undulating”, "Undulating", or "Steady grade”. Alternatively, an undulating alignment can be described with the numbers of sag and crest curves. Curve Signs & Speed Riders: On state highways, curve signs and speed riders are considered together, and curves are to be ball bank tested by the speed zone investigator. On local roadways, the ball bank testing on curves is the responsibility of the local agency. The entries in this section for local roadway speed zone investigations will refer to the curve signs, not to the speed riders. Follow the MUTCD as to whether a speed rider is appropriate. For state highways, designate the curve signing as one of the following: • "In Place”
Use if there are curves and the curve warning sign and speed rider signing is appropriate.
• “Partially Posted”
Use if there are curves and one or more, but not all, is not appropriately signed.
Note safe speeds, extent of posting and needed action by using a footnote.
• "None"
Use if there are no curves.
Use if there are curves (described in the horizontal alignment) but no required curve signing.
Note any needed actions and the safe speeds by using a footnote. For local roadways, designate the curve signing as one of the following: • "In Place”
Use if there are curves and curve warning signs are in place.
• “Partially Posted”
Use if there are curves and one or more, but not all, is not appropriately signed.
Note any recommended action by using a footnote.
• "None"
Use if there are no curves.
Use if there are curves (described in the horizontal alignment) but no curve signing.
Note any recommended actions by using a footnote. Existing Posted Speed: Enter the posted speed from the Spot Speed Data component. If the posted speed can not be found on a current speed zone order, show the posted speed as XX mph (unestablished) Recommended Speed: Enter the recommended speed from the Spot Speed Data component section. Roadway Data:

35
This section describes the traffic and physical driving conditions. Surface: This refers to the surfacing material. Most cases will be either AC (asphalt) or PCC (Portland Cement concrete). If a bridge surface is different than the roadway surface, enter the bridge surfaces separately from the roadway surface: e.g., AC (PCC on bridge). If there is a non-hard surface portion, this portion will not be investigated by the state. The road authority would have to request delegated authority to conduct the speed zone investigation. Width: This is an indication of any travel lane restrictions. Enter the width in feet across all travel lanes. Travel lanes are the portions of road normally used for travel, excluding shoulders or parking areas. The width does include channelization, median and continuous left turn lanes. The width limits are determined by one of the following, depending on what's there:
• fog line to fog line, or
• curb to curb, or
• if none of the above exist, pavement edge to pavement edge.
When the width varies over a substantial portion of the section, show the widths as a range from narrowest to widest (e.g., 24-36 ft.). Lanes: This gives more detail to understand the travel environment by section. This portion should contain all the information about the uses of the traveled width. Enter the number of through travel lanes. Note the existence and widths of a painted or curbed median, channelization, continuous left turn lane or other feature between travel lanes. Also note the existence, width and location of bicycle lanes. When adequate space is lacking for a full description, use footnotes. Note bicycle lanes when the pavement is marked with an 8-inch white stripe, a bicycle legend and a direction arrow. Green and white “Bike Route”' signs denote a bicycle route not a bicycle lane. Parking: This section gives information about the restrictions on travel by parking maneuvers and parked vehicles. Wording should follow the guidelines below: • "Prohibited":
Use when there are red and white regulatory signs throughout the entire section on both sides of the road stating “NO PARKING”.
• "None”:
Use when parking is prohibited by statute (ORS 811.550) in a signed and striped bicycle lane or when the shoulder has insufficient width to park out of the travel lane.
Use this designation when the conditions prohibiting parking exist throughout the entire section on both sides.
• "Partially Prohibited":
Use when there are “NO PARKING” signs for
a portion of the road or
for one side of the road or
if the roadway conditions prohibit parking throughout part of the sections.

36
The sign(s) must be red and white regulatory signs rather than green and white restrictive signs.
• "Not Prohibited":
Use when no signs or conditions prohibit parking anywhere in the section.
• "No Truck Parking":
Use when truck parking and/or oversized vehicle parking is fully or party prohibited by regulatory signing.
Shoulders: Shoulders refer to the part of the road outside the travel lanes. The shoulder is measured from the edge of travel lane to the breakover for the ditch, cut bank, or other obstruction such as barrier or sidewalk. Enter each shoulder width and type(s) in that order. There can be more than one type of surfacing for a section of road, either side by side or along the road. List all relevant types with widths for that type in the section. State if any type is only partial for the length of the section. If widths vary for a type, enter a range from least to greatest width. Enter shoulder types as: • "None"
This means there is less than 1 foot of shoulder
Footnote to describe roadside, e.g., curb and gutter, guardrail, cut bank, tree line
• “Paved”
Paved refers only to a traversable hard surface such as AC
• “Unpaved improved”
Gravel or
Oil treated and compacted dirt
• "Unimproved"
Grass or other small vegetation
Untreated, loose dirt Intersecting Streets: This data informs of the frequency of cross traffic movements within the section. Enter the total number of intersections. Do not count the intersections that begin or end a section. Footnote the number of railroad crossings. Do not include alleys or separated lanes from a single cross street or ramp terminal. A roundabout is a single intersection. Paved & Stopped: The data helps clarify driver expectations concerning cross traffic. Count all paved and stop controlled intersecting streets. There must be a STOP sign installed on the cross street to be counted as stop controlled. Do not count intersections here which have all-way stop control or for which the investigated road has a stop. Note that a roundabout is normally yield controlled and should not be included here. Signalized: This data is about operation of stop control of the investigated street. List the number of fully signalized intersections and footnote each of the following: • All-way stop control
• A stop control on the investigated street, with a through cross street or railroad track
• Intersections having red flashing beacons and STOP signs posted on the investigated street
37
• A flashing yellow beacon Pedestrians/bicycles: This information informs of the extent and character of non-motorized road users. Use data from the spot speed tally and list the total numbers of pedestrians and of cyclists by direction. Crash Data: The crash data used here is the state data, even though it may differ from locally recorded crashes. The reason for this is statewide consistency in the data. If there is a difference between state and local information, this should be discussed in the transmittal letter. Study Period: The study period includes the three most recent complete calendar years plus the partial data available for the current year. If the road is recently physically altered through new pavement, reconstruction, realignment or new construction, the crash data before the construction is invalid. In this case, the study period will be the available data beginning one month after the road was back under normal traffic. If this is less than three years, it must be footnoted as to the cause for the lack of data. Total Crashes: Use data from "Motor Vehicle Crash Listing Summary" (Figure 8). This is the total of reported incidents and not the total vehicles involved, for the full study period. Do not include local crash data not reported on the Listing Summary. Total Injuries: Use data from "Motor Vehicle Crash Listing Summary". This is the total number of injured persons including injuries of all types for the full study period. Total Fatalities: Use data from "Motor Vehicle Crash Listing Summary". Include total number of persons killed for the full study period. (year) Crashes: For the year, enter the most recent year for which a complete year of crash data and volume data is available. For state highways, use the most recent year of complete data where a state rate is available. The most desirable is the latest completed calendar year. If the volume data or state rate isn't provided for the most recent year of crash data, it may be available from the ODOT Systems Monitoring Unit Transportation Data Section. (year) Crash Rate (R) : Fill in the (year) blank with the same year as for Crashes above. Calculate the crash rate to two decimal places using the formula below. When the crash rate is zero, enter a single 0. Crash Rate = (c)(1,000,000)
(L)(365)(V) where: c = number of crashes given above in (year) Crashes L = length of section in hundredths of a mile.

38
V = Average Daily Traffic (ADT) count for the same year as the crash statistics (year) State Rate (r):
This data is for comparison of the local crash rate to state averages. A state rate exists only for state highways and is available from the Region office. Fill in the leading blank with the same year as Crashes and Crash Rate above. For city streets and county roads dash through the column, rather than show “0” or "N/A". Footnote 1/ for Investigation Summary Data is always used for this item.
• For state highways, list the highway type under Footnote 1/ . Use the category from which the state rate was taken.
• For local roads, use the following standard wording in footnote 1/: “No comparable state rate available”.
Deviation (R-r = Crash Rate Deviation):
This is the comparison between the crash rate specific to the investigated section and the state averages. It applies only on state highways because the comparison data is available only on state highways. Deviation = R - r where: R = Crash Rate from above r = State Rate from above
When the Crash Rate (R) exceeds the State Rate (r), list the deviation (R-r) to two decimal places. When the deviation equals zero or a negative number, show the deviation as a single “0".
For city streets and county roads, dash through the column rather than show “0” or "N/A".

39
Grand Total
1991
1990
Total 1989
Total
MP
23.26 1991
MP
22.40 to 1990
Section B
: 1989
Total
MP
22.40 1991
MP
20.19 to 1990
Section A
: 1989
City __________________
County___JA
CK
SO
N____
Street _
RO
GU
E R
IVE
R H
WY_
Hw
y. No. _60 _R
t. No. _99_
From (M
P) ___20.19_____
To (MP
) _____23.26 _____ Fr.__1/89__ To __12-91__
Angle
Head-on
Rear-end
Sideswipe Meeting
Sideswipe Overtaking
4 1 1 2 3 1 2 1 1
Turning
1 1 1 1
Parking
3 1 2 1 1 2 1 1
Non-Collision
Fixed-Object
Pedestrian
1 1 1 1 Backing
Miscellaneous
CO
LLISIO
N TY
PE
9 3 3 3 5 2 1 2 4 1 2 1 ALL COLLISIONS
1 1 1 1
Fatal
2 2 1 1 1 1
Non-Fatal 6 3 1 2 3 2 1 3 1 1 1 Prop. Damage
CLA
SS
IF.
1 1 1 1
Persons Killed
3 2 1 2 1 1 1 1
Persons Injured
MO
TOR
VEHIC
LE CR
ASH
LISTING
FIGURE 8
E X AMP L E

40
Spot Speed Data:
The information from analysis of the spot speed data is reported here. Figure 9 shows a complete Spot Speed Summary with all of the analysis results. If the ADT for a section is less than 500, do not enter the spot speed data. Instead use a footnote and the comment "Insufficient ADT for a valid speed check.” 85% Speed:
If there is a single speed check for a section, list the 85% speed of the combined total vehicles in both travel directions. If there are several speed checks in a section, average the “Combined” 85% speeds and round to the nearest whole number. Pace Limits:
This always includes a standard footnote, Footnote 2/ (see below), explaining what a pace limit is. If there is a single speed check for a section, take the pace limits directly from the analysis. If there are several speed checks for a section, average by averaging the lower limits for combined total vehicles, rounding to the nearest whole number for the lower limit. Then add 9 mph to obtain the upper limit. Percent in Pace:
When there is only one speed check in a section, take the percent in pace directly from the analysis. When there is more than one speed check in a single existing speed zone, average percent in pace and round to the nearest whole number. Maximum Speed:
List the highest recorded speed in each section.

41
Example: Spot Speed Check Summary
Roadway: Rogue Valley Highway (OR 99) Date: 8/4/2005
City: Ashland Time: 2:27 pm - 3:22 pm
County: Jackson
Location: 50 feet north Weather: Overcast
Central Oregon & Pacific RXR overcrossing
MP 17.76 Direction of Travel: Combined
MPH MPH N Averaged S
# of Vehicles 82 165 83
85th % Speed 48 48 48
Pace Limits 40 - 49 40 - 49 39 - 48
% In Pace 80% 81% 82%
Mean Speed 44.59 44.05 43.52
Median Speed 45 44 43
Std. Dev. 3.73 3.81 3.82
Max Speed 52 52 51
Posted Speed 45 45 45
% Exceeding Posted 39% 35% 31% FIGURE 9

42
Posted Speed:
List all the posted speeds for each section. If no speed is posted list the appropriate statutory speed. Percent Exceeding Posted Speed:
If there is a single posted speed for a section, use the percent exceeding from the results of the combined total vehicles analysis. If there are several posted speeds in a section, give the percent exceeding for each posted speed. There should be at least one spot speed check in each existing speed portion. If there is more than one spot speed check per posted speed, average the percent exceeding per posted speed and round to the nearest whole number. Computed Speed:
On state highways, calculate the computed speed by subtracting the Crash Rate Deviation (R-r) from the 85% speed listed above. Because there is no deviation for city streets and county roads, use the 85% speed listed above as the computed speed. Recommended Speed:
Base the recommended speed on the computed speed above, weighing in the roadway characteristics, roadside development demands and crash history when rounding to the optimum 5 mile per hour increment. The recommended speed for rural State highways may vary from the computed speed by a maximum of 5 mph. The recommended speed for State highways within city limits, arterial roadways with statewide or regional significance and major collector roadways with ADT greater than 500 vehicles per day may vary from the computed speed by a maximum of 10 mph (OAR 734-20-015). Standard Footnotes for Roadway Data, Crash Data, Spot Speed Data:
1/ On state highways, list the highway type used to get the state crash rate from Table IV. List each highway type separately by section letter. On city streets and county roads, this should always read "No comparable state rate available.”
2/ Ten mile per hour range containing the largest number of sampled vehicles. (This footnote remains the same for all reports.)
3/ 85% speed minus Crash Rate Deviation (R-r). (This footnote remains the same for all reports.)
4/ Additional footnotes may be used when describing roadway data such as medians and bicycle lanes or when crash data is limited by roadway construction.
Factors influencing Recommendation: This is a summary of all major factors in the recommended speed decision. List factors by name from the Spot Speed Data, Roadway Data, and Crash Data. List any other factors not listed in the report succinctly. Further explain the influences on the recommendation in the transmittal letter. If there is more than one section, list factors by section letter. For example:
Section A: 85% speed, pace limits, roadside culture;
Section B: 85% speed, crash rate.

43
MAP The map graphically represents the speed zone report and is included with each report. The map clearly shows:
• Locale and orientation,
• Location,
• Highway name,
• Jurisdictional boundaries,
• Begin and end points,
• Investigated/not investigated sections,
• Existing and recommended speed zones,
• Photo directions and locations by number,
• Spot speed check locations and 85% speeds. All street names and names of other features such as bridges or creeks referenced in the report and correspondence must be shown on the map. Submit one copy of the original (unmarked) map with the Speed Zone Reports. Figure 10 is a completed map showing the following elements:
• Scale
• Title and Color Chart
• Legend
• North Arrow
• Brackets
• Labels
• Colors
• Date Scale:
Use white paper in standard sizes. Letter size sheets are preferred, although up to 11" x 17" sheets may be used if necessary for a legible map. For very long speed zones, more than one map sheet may be used. Make the map large enough to show clearly all necessary detail including street and highway names. It should be accurate enough at the scale to measure off distances with a standard engineering scale and maintain less than a 50 ft. placement error. Title:
The title shows the locality, road name and date. If the street is entirely a city street, only the city is named in the title. If there is joint jurisdiction, or the speed zones continue in both city and county, or more jurisdictions, then all jurisdictions are named in the title. On rural state highways, show the county name(s) in the title. Color Chart:
Show the full range of speeds in the speed color chart but color only the existing and recommended speeds from the Speed Zone Report Outline.
44
North Arrow:
Provide a North Arrow. Brackets:
The brackets indicate the begin and end points given in the Speed Zone Report. There will be a set of brackets both above and below the roadway to delineate the Recommended and Existing illustrations. Brackets further divide the Recommended length into Sections corresponding to the recommended speeds in the report. The Sections may be further divided by half brackets into "Investigated" and "Not Investigated" portions. Place begin and end milepoints on the Recommended and Section end brackets if the roadway is a state highway, spur or connection. Labels:
The many labels must be designed so each set is distinct, level of importance is maintained, and they are readily understood. Labeling the Speed Sections
Label the Recommended and Existing total lengths as “RECOMMENDED” and “EXISTING” in a font at least 4 points larger than other labeling. Label the Recommended speed sections as “Section A”, "Section B", and so on to correspond to the sections in the report. The font should be the next in importance to the Recommended/Existing labels. Label the uninvestigated sections and parts of sections with “Not Investigated” in a bold font large enough to distinguish from original map names. Place a "No Change" label in a normal font 2 points smaller underneath the "Not Investigated" labels. The same "No Change" tag is placed in portions of a Section which were investigated and the recommendation is no change. Labeling Photograph Locations
Indicate photograph locations using a circled number with an arrow showing direction of sight. Use a normal or bold font a little smaller than the "No Change" label as necessary to clearly stand out from the map. Place the labels as close to perpendicular to the photo location on the road as possible where they don't obscure street or other important feature names. Leave space between the road and the photo labels for clearing the color bar showing the recommended or existing speeds. Draw a single solid line from the photograph label to the roadway photo location. Photo labels can be placed on either side of the road as necessary to avoid conflicting with other labeling. It is easier for the reader if the photo labels are all on one side. Labeling the Spot Speed Checks The Spot Speed Check locations are labeled with the circled 85% speed results. The labels are large with a font similar to the "No Change" label fonts. Place the labels away from the roadway, above the photo labels. Draw a single solid line to the spot speed location on the roadway.

45
Colors:
Using the color codes shown below, indicate Existing and Recommended speed zones with a color bar following the horizontal alignment of the road and with a width of about 1/4 inch (4-6 mm). Color only the boxes in the legend that correspond to the speeds listed as Existing and Recommended. On the Existing side, color the existing ordered and statutory speed zones. Do not color the zones as posted if different from the order or unestablished in a statutory speed zone. Color only the Speed Sections or parts of Sections with changes on the Recommended side. Indicate school zones by adding a color bar the length of the school zone to the outside of the Existing or Recommended color bar (state highways only). Color the roadway outside the beginning and end of the reported section on the Existing side showing the entering and exiting designated speeds.
MPH COLOR EAGLE VERITHIN NO.
20 Green 739 25 Sky Blue 740 ½ 30 Sienna Brown 746 35 Carmine Red 745 40 Violet 742 45 Olive Green 739 ½ 50 Indigo Blue 741 55 Orange 737

46
Figure 10
EXAMPLE
3/16/06

47
PHOTOGRAPH PAGE The photograph page shows:
• highway or roadway name,
• jurisdiction,
• date,
• individual photographs with
numbers,
direction and
location. If the road changes names, list all relevant names in the title and add "on xxx Street" to the photograph description. Include one complete set of photographs for each report. Number the photographs consecutively beginning with number 1 at the beginning of the first investigated section. Photograph labels should either be small white circular stick-on labels or entered into the photograph when taking the photo. Place the following legend below the photographs on each photo page
TYPICAL VIEWS Name of the highway, street or road
City of XX and/or XX County and/or OTC Date
List below the legend by the photograph number, the direction the photograph looks and photograph location. Use the following notation: Example: (Photo #) 1. Looking (direction) from (location) Use the nearest cross street, creek, or other unmovable landmark to describe photograph locations. Use directions matching the general direction of the roadway unless long segments change direction. The two pages of Figure 11 shows completed Photograph Pages for developed and for digital photographs.
CRASH SUMMARY There is a Crash Summary for each portion of the road which was investigated. One Crash Summary is required for each Speed Section. If two non-contiguous portions of a Speed Section were investigated, the portions will be separated on the same Crash Summary form and listed by end point descriptions as described in the Sections part of the Recommendation Report. The crash summary clearly shows the following:
• the highway or roadway name,
• the investigated section description,
• crash summary dates,

48
• number of crashes by type,
• number of fatalities,
• number of injuries
• number of PDO crashes (not vehicles). Include at least one “Crash Listing & Summary” with each report. See Figure 8 for a complete crash summary. Fill out the heading on "Crash Listing & Summary” according to the information listed in the Recommendation Report Outline heading. List the route number of state highways using “US” or “OR”. If there are two routes on the same highway, use the “US” designation rather than the “ORE” designation. On state highways, fill in the milepoint blanks with the begin and end milepoints. The study period includes the three most recent complete calendar years and the current partial year of data. The study periods must be the same for all Sections in one investigation report. More than one investigated section may be summarized on one form if there is room to do so neatly. Label each Section summary with the Section letter and begin and end descriptions, including milepoints if on a state highway. If there are no crashes recorded for a Section, only the Total box needs to be filled out (with '0').
SPOT SPEED SUMMARY The Spot Speed Summary shows the roadway information, summary of the collected data and statistical analysis of one spot speed check. It includes a graph of Speed (MPH) vs. Percentile of Total Vehicles. If the investigated length is divided into sections, label each Spot Speed Summary with the appropriate section letter in the space above the graph itself. The graph can be a line graph, or preferably a point by point graph. It needs to be scaled so that information other than that labeled can accurately be measured off of it. Figure 9 shows a completed Spot Speed Summary. There is a software program available from ODOT which accepts the raw speed check data and produces the analysis and graph. Instructions for the Spot Speed Summary computer program are included in Appendix C.

49
TYPICAL VIEWS Rogue Valley Highway (OR 99)
South Stage Road to 200 feet south of Anderson Creek City of Phoenix Jackson County
1. Looking north from 100 feet south of South Stage Road. 2. Looking south from 100 feet south of South Stage Road. 3. Looking north from 0.24 mile south of South Stage Road. 4. Looking south from 0.24 mile south of South Stage Road. 5. Looking north from 50 feet north of West Glenwood Road. 6. Looking south from 50 feet north of West Glenwood Road. 7. Looking north from 0.13 mile north of North Ridge Terrace. 8. Looking south from 0.13 mile north of North Ridge Terrace.
Figure 11 (pg. 1): A stacked photographs page with title, photograph location and direction.

50
Typical Views
Umatilla-Stanfield Hwy (US 395) City of Stanfield/OTC
June 11, 2001
1. Looking north from 150 feet north of Rosalynn Drive.
2. Looking south from 150 feet north of Rosalynn Drive.
Figure 11 (pg. 2): A digital photograph page with title, photograph location and direction

51
SCHOOL SPEED ZONES
Local Roadways The responsibility for establishing school speed zones on local roadways has been delegated to the road authority. ODOT will no longer show school zone exceptions on the speed zone orders The following statement has been added to speed zone orders for local roads. School speed zones may be posted within the limits of this order as determined by the Road Authority, based on an engineering investigation as per provisions of ORS 811.111 and ORS 810.200. ODOT has developed a Guide to School Area Safety to assist the road authority in making school speed zone decisions. The Guide can be found on the ODOT Traffic-Roadway Section website at: http://www.oregon.gov/ODOT/HWY/TRAFFIC/TEOS_Publications/PDF/Guide_to_School_Area_Safety.pdf.
State Highways within City Limits and Rural State Highways (within existing speed zones) Establishing school speed zones on state highways within city limits requires concurrence from the city state. Concurrence can be sought from city engineering staff, public works or police department. Communicating a description of the new school speed zone termini via email is acceptable to ODOT. Although the road authority may ask for a completed report before making a final decision. The requests are typically made by the school district, law enforcement or city engineering staff. The complete report consists of:
• The original correspondence requesting the school zone exception
• The investigators letter of recommendation stating the reason for establishing the school speed zone
• Report outline that includes the report heading, recommendation, section and historical background
• Map showing the existing speed zoning and the new school speed zone boundaries
• Photographs in each direction at the beginning and end of the proposed school zone Once the investigation has been completed, a copy of the report is submitted to the Traffic-Roadway Section for review and approval. Rural State Highways (within statutory speed areas) On state highways outside city limits, the request usually comes from the school district through the District Manager. If the exception is for a school zone or school crossing, the request should include a copy of the school district’s Pedestrian Route Plan as described in the Manual on Uniform Traffic Control Devices (MUTCD). In statutory speed areas, it is not necessary to obtain the State Traffic Engineers approval. The signs can be posted by the District Manager. However, it still requires an engineering study to determine the limits of the school speed zone boundary. On roadways where the speed is posted 45 mph or above, school speed zones should be implemented only after all other options for transporting children to school safely has been tried (see the Guide to School Area Safety). The complete report consists of:
• The original correspondence requesting the school zone exception
• Investigators letter of recommendation stating the reason for establishing the school speed zone
• Map showing the location of the school speed zone
A copy of the investigation shall be retained at the region office. A record of the school speed zone can be kept on record in the Traffic-Roadway Section files. See figure 12.

52
Date Region District Jurisdiction(s)
SSSccchhhoooooolll SSSpppeeeeeeddd ZZZooonnneee RRReeecccooorrrddd
On State Highway System in Basic Rule Speed Area The Region Traffic Engineer under delegated authority from the State Traffic Engineer, has determined that a designated school speed of 20 MPH is appropriate on certain section(s) of the highway named below: Name
Highway Number Route Number
More specifically, school speed zoning, with the appropriate traffic control devices, shall be placed on the following roadway segment(s) of said highway in compliance with provisions of Subsection 2c of ORS 811.105:
LOCATION OF TERMINI
From (Description) MP
______________________________________________ Region Traffic Engineer
Figure 12
TEMPLATE

53
TEMPORARY SPEED ZONES ON NEW ROADWAYS
Local Roadways When a new or rebuilt road nears completion, the road authority under 810.180(8) can issue a temporary speed zone order if the new section has continuous restrictions on the travel speed. To satisfy the intent of the statute, the order should be established citing the revised road conditions that make the speed changes necessary. The temporary order must have a specified end date, and an investigation for establishing a permanent speed completed before that period ends. This should take place within six months after the road is opened to traffic. The new permanent speed will have to be established by ODOT after a complete speed zone investigation under ORS 810.180(5) and OAR 734-20-0015 once the rebuilt road section is under traffic. The road authority should provide ODOT with a copy of any temporary speed zone order. The road authority shall also notify ODOT, in writing, about the timing of the project completion so the investigation can be scheduled quickly for permanent speed zoning. To provide consistency for all temporary speed zone signing, the road authority should follow the criteria (see criteria below) adopted by ODOT when establishing speed zones on new roadways. This section does not apply to construction speed zones. State Highways Temporary speed zones on new/rebuilt state highways may be established after a modified investigation has been conducted. This investigation should take place after the road nears completion. The modified investigation is based on the following criteria. Criteria • Discuss the proposed roadway with the local agency and enforcement personnel to obtain their
recommendation
• Review the roadside culture
• Determine how the roadway will be used and what classification it will have.
• Review adjacent roadways’ use and speed zoning to ensure consistency with similar roadways in the area.
• Consider estimated pedestrian and bicycle use.
• Design Speed
• Use engineering judgment. Based upon the above criteria, a recommendation with a complete explanation of how the recommendation was determined is submitted to the State Traffic Engineer for temporary speed zoning. After the road has been opened for a period of time, a standard speed zone investigation shall be conducted to determine the permanent speed zone. This should take place within six months after the road has been opened to traffic.

54
CONSTRUCTION SPEED ZONES
Local Roadways The road authority may establish construction speed zones per provisions of ORS 810.180 (8). Any limitations or restriction imposed under this section shall be imposed by a speed zone order. On sections of roads with an existing speed zone order, the road authority should provide ODOT a copy of the speed zone order once a construction speed zone has been established. Once the roadway nears completion, the road authority may establish a temporary speed zone until permanent speed zoning can be established. (See Temporary Speed Zones on New Roadways). To provide consistency for all construction speed zone signing, the local road authority should follow the criteria adopted by ODOT when establishing construction speed zones.
State Highways The Traffic Control Plan Designer, Region Project Manager or Region Traffic Operations Manager/Engineer usually initiates requests for construction speed zones. A completed Worksheet for Determining the Need for a Reduced Speed for Work Zones which can be found on the Traffic-Roadway Section website at (http://www.oregon.gov/ODOT/HWY/TRAFFIC/TEOS_Publications/WORD/Worksheet_Determining_Need_for_Reduced_Speed_Zone.doc) along with a copy of the Traffic Control Plan should be submitted with the request.
Criteria In general, construction speed zone reductions are not warranted under the following conditions.
• Activities which are more than ten feet from the edge of the traveled way
• Activities which require an intermittent or moving operation on the shoulder A recent National Cooperative Highway Research Program (NCHRP) study provides conditions under which temporary speed zones may be warranted. Below are a combination of ODOT and NCHRP conditions which are considered when evaluating requests for temporary reduced speed zones.
• A high crash rate within the work zone.
• Workers present for extended periods within 10 feet of the traveled way unprotected by barriers.
• Traffic control devices encroaching on a lane open to traffic or within a closed lane but within 2 feet of the edge of the open lane that can’t be moved to a safer location.
• Barrier or pavement edge drop-off within 2 feet of the traveled way.
• Horizontal Curvature with a safe speed of 10 or more mph lower than the posted speed.
• Reduced design speed for detour or transitions (radius of curvature, superelevation and sight distance) when the distance between restrictions is less than ¼ mile.
• Lane width reductions of 1 foot or more with a resulting lane width less than 10 feet on most roads or 11 feet on freeways.
• Lane closures with barrier and less than 2 feet of shoulder on each side.
• Unusual conditions which are hard to sign or otherwise communicate to travelers effectively. If above or similar factors do not exist, a speed zone reduction should not be requested. Reducing speed zones under lesser conditions promotes disregard for future speed reductions. Additionally, temporary speed zone reductions should be covered at night and on weekends, or when the work zone is not active. Exceptions to any of the above statements may apply under special circumstances.

55
ESTABLISHING SPEED ZONES ON LOW VOLUME PUBLIC PAVED ROADS AND ON PUBLIC GRAVEL ROADS
Requesting Delegated Authority A city, county or other agency (such as the Bureau of Land Management) may request delegated authority from the Oregon Department of Transportation to conduct speed zone investigations and establish speed zones on low volume public paved roads (less than 400 average daily traffic). The road authority may also request delegated authority to conduct speed zone investigations on public gravel roads. On low volume public paved roads, the road authority shall make written application to the State Traffic Engineer requesting delegated authority to determine and establish speed zones for roads under their jurisdiction. It is not necessary to request delegated authority for each individual roadway. Blanket authority can be granted to the road authority. See Figure 13 (Sample letter requesting delegated authority low volume paved roads). On public gravel roads, the road authority shall make written application to the State Traffic Engineer requesting delegated authority to conduct a speed zone investigation on a gravel road under their jurisdiction. Blanket authority will not be granted on public gravel roads. The road authority must make the request on a case by case basis. See Figure 14. (Sample letter requesting delegated authority gravel road). Establishment of speed zones on public gravel roads is contingent upon approval by the State Traffic Engineer. Guidance for Establishing Speed Zones on Gravel Roads Establishing speed zones on gravel surfaced roads is generally inappropriate and ill advised. The danger with establishing a specific speed zone is that a “Speed Zone” sign creates an expectation by the driver that the roadway is safe to drive at the posted speed. Gravel roadway conditions can change rapidly depending on weather, season, traffic volumes and amount of road maintenance. Establishing the appropriate speed limit for all conditions is difficult, if not impossible, especially when the roadway condition may change rapidly. Oregon’s basic rule speed law requires drivers to adopt a reasonable and prudent speed. The driver should be using their visual observation of the roadway conditions, rather than a speed zone sign to determine the safe speed to drive a road. There are other factors that reduce the effectiveness or necessity for setting speeds on gravel surfaced roads. Enforcement is usually minimal on gravel roads so there would be poor compliance with speed zoning without enforcement commitment. Risks of vehicle conflict are very low on these roads because most are used by travelers who are familiar with the roads and their condition. Procedure for Establishing Speed Zones on Public Low Volume Paved Roads and Public Gravel Roads Step 1: Delegated Authority • The agency with road authority will request delegated authority as outlined above. Step 2: Investigation • A Report of Speed Zone Investigation will be made for determining the recommended speed(s) for the
proposed speed zones(s). The report shall include the following information:
o Report outline: See figure 15. (Sample report for single segment speed zones) See figure 16 (Sample report for multi segment speed zones)
o Marked map showing location of speed zone: See figure 17. (Sample map for single segment speed zones) See figure 18 (Sample map for multi-segment speed zones)

56
o Photograph Page(s) (Optional)
o A primary factor in determining the recommended speed shall be the 85th percentile speed.
o The 85th percentile speed shall be determined from a spot speed sample taken at a location which is representative of normal, unrestricted traffic flow on the roadway. The vehicle involved in taking the spot speed sample should be unmarked and kept as inconspicuous as possible so as not to prejudice the sample.
o A standard spot speed sample is 75 vehicles in each direction. Spend no longer than 3 hours on a speed check even if less than 75 vehicles are counted in that time. The minimum acceptable spot speed sample is a total of 25 vehicles in both directions when the standard sample cannot be achieved.
o On gravel roads spot speed samples shall be taken within one week after the roadway has been graded. If the minimum sample is unattainable, no speed zone will be established.
o The section length used for speed zoning shall be at least one-quarter mile long.
o The recommended speed shall not be reduced more than 10 mph below the 85th percentile speed.
o Transition speed zones should be at least 10 mph increments.
o Posted speeds shall be in 5 mph increments. Step 3: Recommendation • Optional factors* that are further explained on Page 2 of this Manual should be taken into consideration
when determining a reasonable, prudent speed zone:
o Geometric features
o Pedestrian and bicycle movements
o Kind and amount of adjacent land use
o Enforcement
o Crash history
o Public testimony
o Accesses
o Volumes
* The above factors may be included in the Report of Speed Zone Investigation but are not required. Step 4: Speed Zone Order • Speed zones other than statutory speeds shall be established by written order stating the designated
speed and boundaries for that speed zone.
o Boundaries shall be designated by cardinal direction and distance from the nearest named, permanent physical feature, typically a road, bridge or waterway.
o Once the speed has been determined for a public paved low volume road, mail two copies of the report and written order to the State Traffic Engineer. The report and order will not be reviewed for content or accuracy, this responsibility falls under the road authority.
o Once the speed zone investigation has been completed on a public gravel road, mail a copy of the transmittal letter and report to the State Traffic Engineer for review and approval.
See OAR 734-20-0016 and OAR 734-20-0017 for further information regarding establishment of speed zones on Public Paved Low Volume Roads and/or Public Unpaved Roads.
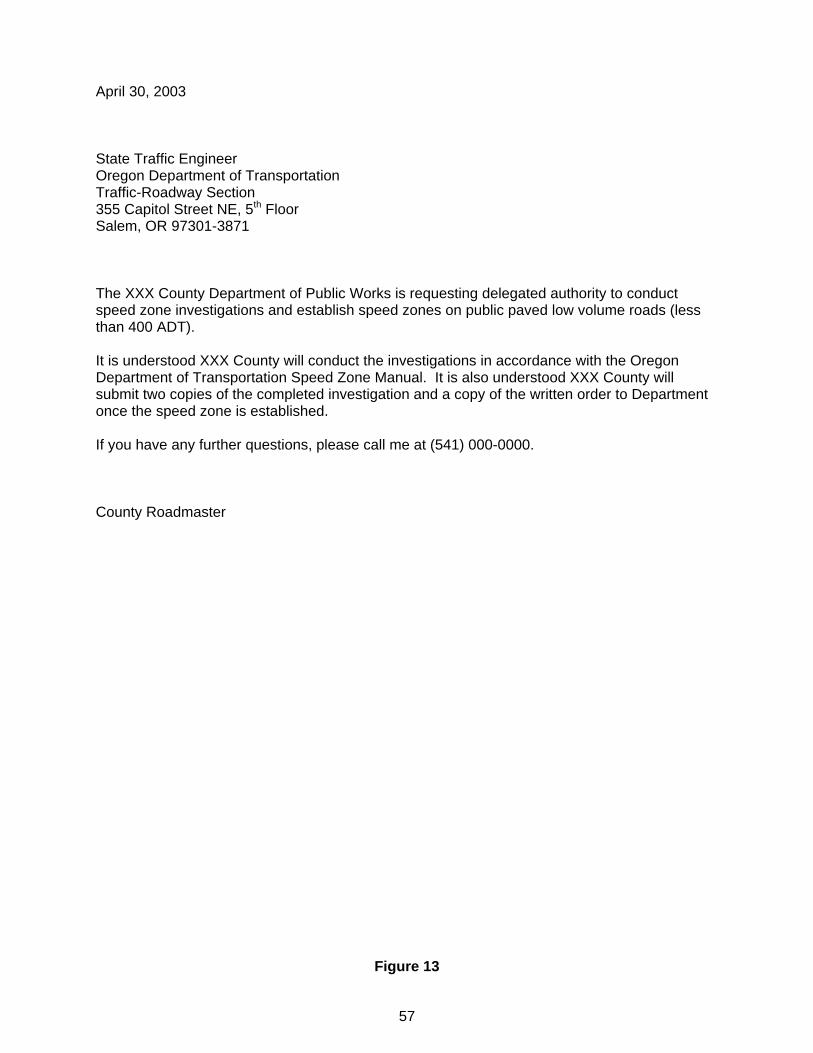
57
April 30, 2003 State Traffic Engineer Oregon Department of Transportation Traffic-Roadway Section 355 Capitol Street NE, 5th Floor Salem, OR 97301-3871 The XXX County Department of Public Works is requesting delegated authority to conduct speed zone investigations and establish speed zones on public paved low volume roads (less than 400 ADT). It is understood XXX County will conduct the investigations in accordance with the Oregon Department of Transportation Speed Zone Manual. It is also understood XXX County will submit two copies of the completed investigation and a copy of the written order to Department once the speed zone is established. If you have any further questions, please call me at (541) 000-0000. County Roadmaster
Figure 13

58
April 30, 2003 State Traffic Engineer Oregon Department of Transportation Traffic-Roadway Section 355 Capitol Street NE, 5th Floor Salem, OR 97301-3871 The XXX County Department of Public Works is requesting delegated authority to conduct a speed zone investigation on XXX road, which is a gravel road. The reason for this request is XXX. It is understood XXX County will:
Conduct the investigation in accordance with the Oregon Department of Transportation Speed Zone Manual.
Submit two copies of the completed investigation to the Department for review and approval.
Grade the subject roadway a minimum of every six months when open to normal traffic.
Enclosed is the evidence of crash history that supports this speed zone request and written commitment from law enforcement that the subject roadway will be part of routine patrols. If you have any further questions, please call me at (541) 000-0000. County Roadmaster
Figure 14

59
MALHEUR COUNTY PUBLIC WORKS
Report of Speed Zone Investigation Hyline Road
From Douglas Road to Grove Road Malheur County
September 23, 2005
Recommendation: Establish the following speed zoning: Existing Recommended Investigated From: Douglas Road MP 55 MPH 45 MPH To: Grove Road MP
Investigation:
85% Speed 47 MPH Section Length 0.31 mile
*Road characteristics, shoulder conditions, grade, alignment and sight distance:
Horizontal Alignment 0 curves Vertical Alignment Level Curve Signs & Speed Riders None Surface Bituminous Width 22 feet Lanes 2 Shoulders 1-2’ gravel Intersecting Streets 6
*Pace Speed 38-47 MPH
*Roadside development and environment:
Culture type and density Sparse/residential
*Parking practices and pedestrian activity:
Parking None Pedestrian/Bicycles 0/2
*Reported crash experience:
Study Period 01/01/2002 - 12/31/2003 Total Crashes 2 Injuries 1 Fatalities 0
* Optional
Figure 15
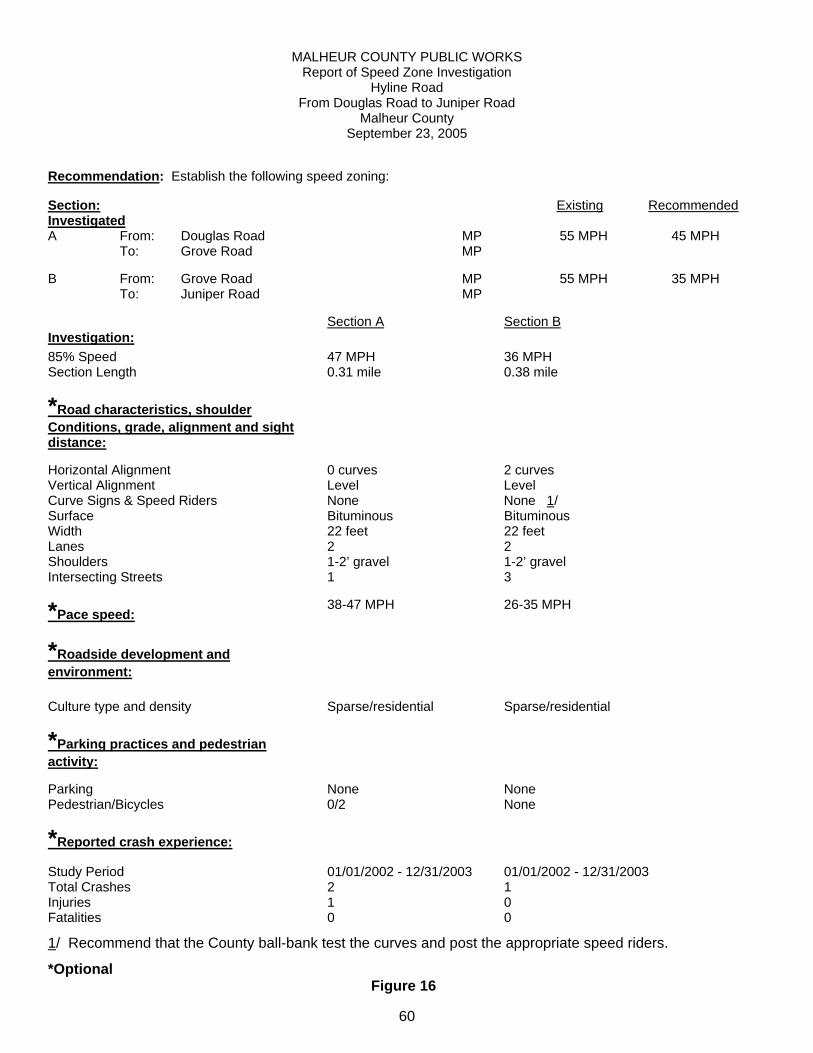
60
MALHEUR COUNTY PUBLIC WORKS Report of Speed Zone Investigation
Hyline Road From Douglas Road to Juniper Road
Malheur County September 23, 2005
Recommendation: Establish the following speed zoning: Section: Existing Recommended Investigated A From: Douglas Road MP 55 MPH 45 MPH To: Grove Road MP B From: Grove Road MP 55 MPH 35 MPH To: Juniper Road MP
Investigation: Section A Section B
85% Speed 47 MPH 36 MPH Section Length 0.31 mile 0.38 mile
*Road characteristics, shoulder Conditions, grade, alignment and sight distance:
Horizontal Alignment 0 curves 2 curves Vertical Alignment Level Level Curve Signs & Speed Riders None None 1/ Surface Bituminous Bituminous Width 22 feet 22 feet Lanes 2 2 Shoulders 1-2’ gravel 1-2’ gravel Intersecting Streets 1 3
*Pace speed: 38-47 MPH 26-35 MPH
*Roadside development and environment:
Culture type and density Sparse/residential Sparse/residential
*Parking practices and pedestrian activity:
Parking None None Pedestrian/Bicycles 0/2 None
*Reported crash experience:
Study Period 01/01/2002 - 12/31/2003 01/01/2002 - 12/31/2003 Total Crashes 2 1 Injuries 1 0 Fatalities 0 0
1/ Recommend that the County ball-bank test the curves and post the appropriate speed riders.
*Optional Figure 16

61
Figure 17

62
Figure 18
63
EMERGENCY SPEED ZONES Emergency speed zones may be established due to natural or other disasters once an agency has declared an emergency. Emergency speed zones are restricted to a period not to exceed 120 days. An engineering investigation must be completed and a temporary or permanent speed established by written order to maintain a change in speed after 120 days.
Local Roadways An emergency speed zone may be established by a local agency having road authority. If the emergency speed zone is established on a local agency’s facility as a temporary route of a state highway, state forces and state materials may accomplish speed zone signing. The emergency speed zone shall be removed when the condition necessitating the designation has been removed or corrected. To provide consistency for emergency speed zone signing, the Department has adopted the criteria listed below.
State Highways Emergency speed zones on state highways shall be established at such levels that the State Traffic Engineer deems prudent. The emergency speed zone shall be removed when the condition necessitating the designation has been removed or corrected. To provide consistency for emergency speed zone signing, the Department has adopted the criteria listed below.
Criteria To determine reasonable and prudent speeds, the State Traffic Engineer will consider the following: • Traffic Volumes
• Condition of the roadway
• Weather
• Any other conditions which should be considered to insure that traffic passes through the area safely The speed zone shall have full force and effect of law as long as needed (up to 120 days) to insure safe traffic conditions in the area. After a temporary speed zone has been established on a specific section of roadway where the speed of traffic is connected with or contributes to the relief of a problem, a field investigation shall be initiated. The findings of the investigation shall be utilized to provide basis for termination of the emergency speed zone by the end of the 120-day limit or the Department’s decision to make the temporary action permanent. In the event that the investigation is not completed by the end of the 120 day period, the temporary speed zone shall terminate and the previously posted speed shall be reestablished by the appropriate agency.

64
APPENDIX A: Crash Data Request Information The following crash data products are available by contacting:
Crash Analysis and Reporting Unit Mill Creek Office Park
555 13th St. Salem, OR 97310
COLLISION DIAGRAMS: This is a schematic representation of all crashes occurring on a simple plan view at a given location. Date, time, environmental conditions, vehicle directions and injuries are included. End intersection and side street information are included. A PRC that goes with a collision diagram will include end intersections and side street information. MANUAL LISTINGS: Motor Vehicle Crash Listing. Summarizes crashes by year by type. The requested area is put as one lump sum unless you specify breaks. Breaks do not have to be at an intersection. PRC: County Roads or Urban Continuous Crash Listings. This is the original crash listing but, as many listings now exist, it is called the PRC. This listing gives the most information. Included with the PRC is a summary. You receive information on crash location, date, event cause, type of crash, road characteristics, vehicle type and direction; also the participants’ ages, sex, license and injuries. 3R: Crash Characteristics Summary. This program reports on crashes in three different ways. The first report is the crash characteristics summary and reports on the characteristics of the crashes on each location that has had a crash. The second report is the collision type summary and reports on the collision types on each location that has had a crash. The third report is the single crash characteristics list and reports on several characteristics of each individual crash. This report is available only for system crashes. BY YEAR: Crash Summary By Year. This listing gives a crash count by year of intersection and non-intersection crashes by type for a stretch of roadway. This report is available only for state system crashes. SUMMARY: Crash Summary by year and type. This program summarizes crashes by year and type of crash. Gives a count on class of crash, people killed and injured, trucks involved, surface condition, day or night, intersection, and off roadway crashes. Special summaries or counts of specific interest can be generated as needed. VDL: Vehicle Directional Listing. This program lists crashes by highway and milepost. Gives date, time, light, surface, character of road, collision type with object struck, persons injured by severity of injury, vehicle types and direction of travel of the first three vehicles and the total number of any additional vehicles involved in the crash. This report is available only for state system crashes. LISTINGS: This information concerns all listings: • End intersections and side street information are not included except when a single intersection is
requested. If end intersections are included in the request you will receive intersection crashes coded to that highway only.
• When highways are requested by mile points, they will be run without verification. • Intersection crashes are those crashes coded within the center of the highway or those turning on or off the
roadway. • All intersection crashes are coded to the lowest street number. • When two highways are involved they are coded to the highway of greater importance which is usually the
lowest numbered one. • Only mainline crashes are included on listings so when needing connections, frontage roads, or spurs
please specify what is needed. DATA EXTRACT: Raw crash data for use with another program.

65
APPENDIX B: Speed Zone Field Investigation Checklist Have before starting field investigation: Request: - from local jurisdiction OTC - from local agency or private citizen Approval: - from State Traffic Engineer or Region Traffic Supervisor Compile before heading into the field: • All relevant established speed zones on the road being investigated.
• Previous investigations of the requested area.
• Up-to-date map showing all road connections and jurisdiction changes.
• Crash history if possible (3 year minimum), Identify types of crashes, locations, problem areas, severity. Field Review: Calibrate the distance meter, preferably for 1 mile, in feet. Be sure to use a surveyed set of marks. Drive through: 1) Note topography, culture, high crash areas, traffic flow, and comfortable speeds. 2) Document the following
• Number of horizontal curves: on state highways, ball bank if not signed or advisory speed is questionable
• Vertical alignment
• Sight distances less than adequate if no advance signing
• Other areas where driving requirements are different than majority of the roadway
• Parking prohibitions
• Bicycle/Pedestrian facilities Milepoint log: Milepost and describe all accesses, traffic control and driver information: • Use centerline of intersections noting intersection type and alignment (It./rt.), type of stop or signal, surface
type of intersecting street.
• Use centerline of driveways. If there are too many to note practically, note 'avg. 100 feet left" or "numerous" if at very irregular intervals, with begin/end milepoints.
• Log all traffic signs: location, logo, condition and sizing (if nonstandard or oversize). NOTE: The point is to document driving conditions, conflicts, instructions and information.
Typical Sections: • Take shoulder-to-shoulder sections along the length of the investigation.
• Determine where the roadway/shoulder width extremes are in each investigated portion and take the sections at these locations.
66
• Record the widths, at right angles to centerline, of each: shoulder (including gutters), bike lane, travel lane median, island, etc.
Photos: • Take both road ahead and road back at reasonable intervals to establish the character of the road and
roadside culture, and to pick up any signing or features to be noted in the report text. Intervals should generally be 1/4 mile minimum. Photos should be taken from centerline, if safe to do so, or from the outside of a curve.
• Keep a log listing each photo by film strip number and photo location (distance from nearest cross street and/or milepoint).
• Keep numbering of photos in the report consistent for ease of understanding. For instance, all odd photos face north and even # photos face south.
• Photos should be numbered and listed on the map and photo pages in the same direction as you list the speed zones.
Spot speed checks: See both the report and spot speed guidelines. Plan your parking places and radar cone direction from the drive-through data. Try to park in an inconspicuous area, and avoid signalized and stopped intersection vicinities. Record speeds on free flow vehicles only; single vehicles, the first vehicle in a pod, etc. Do not record speeds of passing vehicles -- the radar reading is not reliable. Also record the number of pedestrians and bicycles. Commercial vehicle speeds should be recorded separately, and included in the report only if a significant (>=20%) traffic source, specifically named in complaint or disproportionately represented in the crash data. Checks should normally be taken every 1/2 mile. Take them closer together if there is a definite change for over 1/4 mile in driving conditions such as roadside culture, road cross section, etc., such that speeds could be expected to change. Checks can be taken farther apart if driving conditions remain virtually the same. Curves are not speed checked. It is safest to allow the curves themselves to be the deciding factor for the driver. Curves should be signed if the safe speed around the curve is 10 or more mph less than the posted speed (55 mph statutory if not posted). When the road alignment is all curves and a speed can be maintained which is the safe driving speed through the curves, it can be recommended. Caution should be observed in deciding this recommendation. If there are curves with safe speeds below the recommendation, particularly if they are without warning signing, it is better not to post a speed which drivers then may expect to be able to maintain. To get reliable data, spot speed checks should be taken in normal weather, at free flow periods rather than “rush hours”. Be sure to record the weather conditions and beginning/ending times for each speed check. Reporting Cover letter: The submittal letter should describe any features affecting your recommendations that are not specifically stated in the report data. Reporting: Writing the report is covered in the report guidelines. Documents that should always be included are:
1) Report
2) Map
3) Photo pages
4) Crash data

67
5) Spot speed check graph(s) In addition, always send in copies of:
• Correspondence • Original (able to be edited) map if not created in CAD or some other electronic program • Spot speed check raw data sheets • Copies of the existing orders you used • Crash data computer run, and • Milepoint logs
68
APPENDIX C: Guidelines for Spot Speed Survey Reports
1) All names and directions are to be spelled out in full, unless they are too long to fit in the blank. Only standard English abbreviations are to be used.
2) When indicating the direction of traffic, use the general run of the entire road rather than try to indicate the
orientation of each section. 3) Milepoints are to be listed only for state highways, and always should be indicated under “Location” on
state highways. 4) City and/or county information is filled in only when involved in the jurisdiction of the section you are
investigating. 5) For "Location" information, always give a measured distance from the nearest cross street or permanent
feature, such as a creek, that can be located on existing maps of the area. Don't use political boundaries (e.g., city limits), buildings, fences, sign, pullout areas, driveways, etc.
6) At least 75 vehicles each way are necessary for a statistically valid speed check. However, 3 hours is the
maximum time you should spend in one location. Lower counts can be used on some low volume roads. For approval to do this, call the Traffic-Roadway Sections’ Traffic Engineering Services Unit. Low volume cutoff is 25 vehicles in three hours or 8 total vehicles in one hour.
7) Speed checks are to be taken every 1/2 mile through the investigated section(s). Speed checks may be
spaced up to 1 mile or further if there is no change in the roadway or roadside culture. 8) Trucks/Commercial vehicle counts are not included in the report unless specifically named in the request
for investigation.

69
APPENDIX D: Procedure For Changing A Speed Zone Boundary Description
Speed zone boundary descriptions may need to be updated for various reasons. If the current description only refers to a milepoint, city or other jurisdictional limit, or a building or other structure that description will need to be rewritten to reference a distance from a fixed feature such as a street or bridge.
Other changes that should be addressed are the results of recent development or jurisdictional changes. These include:
• street name changes,
• new streets such that the existing reference street is no longer the closest street, or
• realignment of the existing road or an existing intersection such that the position of the described boundary point is no longer at the same place in the main road.
To update the first example, finding a description to fit an old city limit for instance, research the position on the roadway of that old boundary by the closest side street existing at the time of the old speed zone order and distance from that side street. You may need to contact the local agency to find the historical information and/or interpret from right-of-way descriptions. The new description will have to be verified in the field by measuring the location and then determining the current closest side street and distance. Write the new description in the speed zone report. In the transmittal letter, discuss the change as to why it was changed and how the new description was researched and determined.
For street name changes, note the change on the speed zone report and on the map as New Street (Old Street). The old street name will not show up on the new order. Also report the change in the transmittal letter, giving the details of why the change, the authoritative reference for how it was changed and when the change occurred. New development that has changed the intersections and/or alignment of the road in a way to require a new boundary description will require field work to establish the best description. Measure where the boundary is on the roadway using the old information, then determine the nearest cross street and distance from that cross street. Use the new description in the report and on the map. Be sure to have both the new and old street name references noted on the map. Again, the old description will not show up in the new order. Include a discussion of the changes made, why and how they were determined in the transmittal letter. If a speed zone boundary description needs to be updated but you aren’t going to be doing any field work, note the change on the office copy of the speed zone order. Additionally, submit a memo to the state traffic engineer on the changes, recommending they be field verified the next time there is a speed zone review of any portion of that order.
70
GLOSSARY Crash Rate Deviation The positive difference, in number of crashes per million vehicle miles, between the crash rate for the investigated road section and the statewide rate for comparable highway types. If the crash rate for the section is equal to or less than the statewide average rate, the deviation is zero. There is no crash rate deviation for city and county roads since there is no comparable statewide classification of data. Crash Rate The number of crashes per million vehicle miles traveled on a section of roadway. Ahead on Line Following the road centerline, the direction of increasing milepoints. Arterial or arterial highway means a highway that is used primarily by through traffic. (ORS 801.127) Average Speed The mean speed of all vehicles included in a given spot speed check. Average Daily Traffic Volume (ADT) The total annual volume of vehicles in all lanes of traffic, regardless of direction, divided by the number of days in the year on a section or roadway. AASHTO defines ADT as the total volume during a given time period (in whole days), greater than 1 day and less than 1 year, divided by the number of days in that time period. Back on Line Following the road centerline, the direction of decreasing milepoints. Basic Rule See violation of the basic speed rule in this glossary. Business District Territory contiguous to a highway when 50 percent or more of the frontage thereon for a distance of 600 feet or more on one side or 300 feet or more on both sides, is occupied by buildings used for business. (ORS 801.170) Collector or collector highway means a highway that serves primarily to funnel traffic from one local highway to another or between arterials and local highways. (ORS 801.197) Eighty-fifth Percentile Speed (85% SPEED) The speed at or below which 85 percent of the vehicles for which speeds were recorded are traveling. Established Speed Zone A posted speed zone established by Order. Industrial District An area contiguous to the road with mainly warehouse, distribution and manufacturing development. Not defined in ORS. Local Roadway A public facility that serves mainly as local property access. Not defined in ORS. Maximum Speed The highest speed recorded in a spot speed check. Median Speed The speed at or below which 50% of the vehicles in a spot speed check were observed to travel. Milepost Log A log of text and graphics representing road features, traffic control, access and construction details of a road by milepost along the road alignment. For state highways, there is a milepost log on each highway, frontage road, or connection, published by Inventory & Mapping Unit, ODOT. The state milepoint log doesn't include traffic control or all road features. The current version is automated and available on the mainframe. Mode Speed The most frequently occurring speed for a spot speed check.

71
OTC Oregon Transportation Commission: The Oregon Department of Transportation governing body whose duties include setting speed zones on rural State highways. The State Traffic Engineer has delegated authority from the OTC to set speed zones within established guidelines designated in OAR 734-20-015. Pace A 10-mph increment that includes the greatest percentage of vehicles observed in a spot speed check. Prima Facie Evidence Information or material that would, if uncontested, establish a fact or raise a presumption of a fact. In the case of speed zoning, some statutory speeds are designated as prima facie evidence of basic rule violation or of the maximum speed limit. ORS 811.105 & 811.111. Residence District means territory not comprising a business district that is contiguous to a highway that: (1) Has access to property occupied primarily by multifamily dwellings; or (2) Has an average of 150 feet or less between accesses or approaches to: (a) Dwellings, churches, public parks within cities or other residential service facilities; or (b) Dwellings and buildings used for business. (ORS 801.430) Residence Districts are limited to certain classifications of roads per ORS 811.100(2)(d) and ORS 811.111(1)(d)(D). School Zone Exception That portion of a speed zone which is signed as a school zone or school crossing, where the designated speed shall be 20 mph per provisions of ORS 811.111. Speed Limit Maximum speed limits, as opposed to Basic Rule speeds, that are authorized by statute. See ORS 811.111 for more information. Speed Zone Review Panel The Speed Zone Review Panel was formed by ODOT to act as a hearing body to decide contested speed zoning decisions. Members include representatives from League of Oregon Cites (LOC), Association of Oregon Counties (AOC), Oregon State Police (OSP), Oregon Transportation Safety Committee and ODOT. State Speed control Board (SSCB) The former established board with the authority to set speed zones on all city streets and county roads. The SSCB was replaced in 1994 by the Speed Zone Review Panel. Statutory Speed The speed which is set as a maximum speed limit or prima facie evidence of basic rule violation by statute. The statutory speed is the legal speed, whether posted or not, on any section of road if there is no written speed zone order establishing a different designated speed. Examples of a statutory speed would be a “residence district”, “business district”, etc. See ORS 811.105 & 811.111. Straightline Chart A graphical representation of the mile post log. Transition Speed Zone A speed zone(s) established to make a change in legal speed less abrupt for drivers. For example, instead of going directly from a 55 mph section to a 25 mph, it may be necessary to establish one or more transition speed zones in between, such as 45 mph and 35 mph. Transition speed zones must be a minimum of 1000 feet in length. Unestablished Speed Zone A posted speed zone not established by Order or statute. Urban Area Developed area inside an urban growth boundary. Written Order The legal document which designates the boundaries and speed(s) of speed zoning on a single road or continuous route. Violation of the basic speed rule When a person drives a vehicle upon a highway at a speed greater than is reasonable and prudent, having due regard to all of the following: Traffic, surface and width of the highway, the hazard at intersections, weather, visibility and any other conditions then existing. (ORS 811.105)