oregon population forecast program - portland state … · –oregon population forecast program...
TRANSCRIPT

Oregon Population Forecast Program Regional Forecast Meeting - September 23, 2014
Presentation by
Population Forecast Program Team CURRY COUNTY

Oregon Population Forecast Program Project Team
Xiaomin Ruan, Population Forecast Program Coordinator
Risa S. Proehl, Population Estimates Program Manager
Jason R. Jurjevich, Assistant Director Population Research Center
Kevin Rancik, GIS Analyst
Janai Kessi, Research Analyst
Marisol Caceres Lorenzo, Research Assistant
Carson Gorecki, Research Assistant

Agenda
• Population Research Center (PRC)
• Forecast Program overview – Forecast regions
– Schedule
– Deliverables
– Forecasting methods and data sources
– Process for local input
• Demographic and economic trends

Population Research Center (PRC)
PRC Research areas:
– Oregon Population Forecast Program
– Oregon Population Estimates Program
– Oregon State Data Center (SDC)
– Demographic Research and Advisory Services
– Applied Demography Instruction
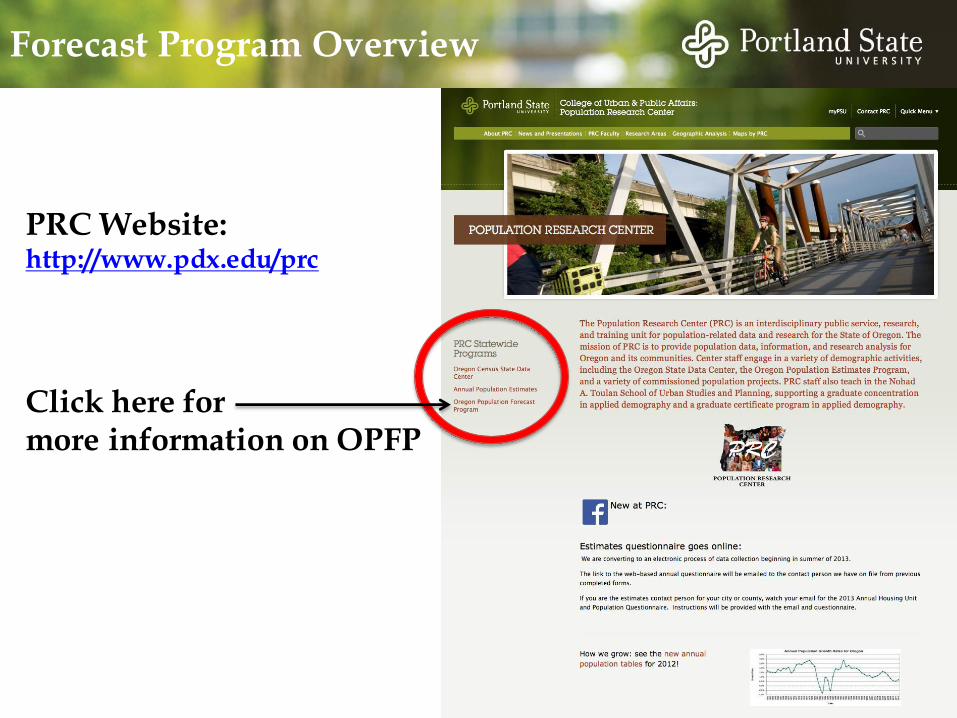
Click here for more information on OPFP
PRC Website: http://www.pdx.edu/prc
Forecast Program Overview
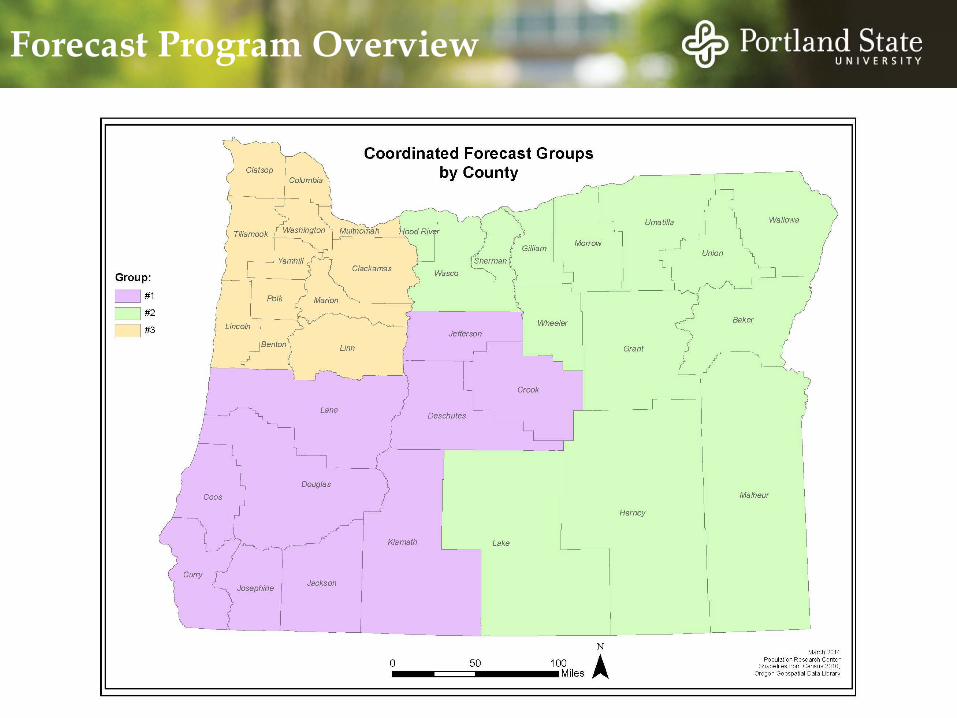
Forecast Program Overview
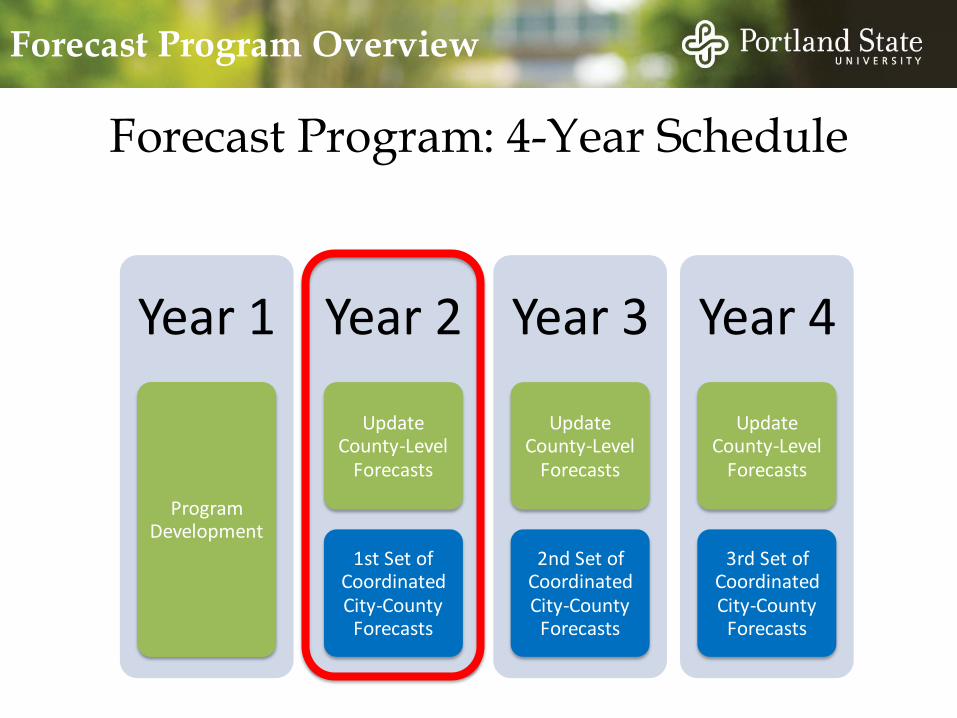
Forecast Program: 4-Year Schedule
Year 1
Program Development
Year 2
Update County-Level
Forecasts
1st Set of Coordinated City-County
Forecasts
Year 3
Update County-Level
Forecasts
2nd Set of Coordinated City-County
Forecasts
Year 4
Update County-Level
Forecasts
3rd Set of Coordinated City-County
Forecasts
Forecast Program Overview
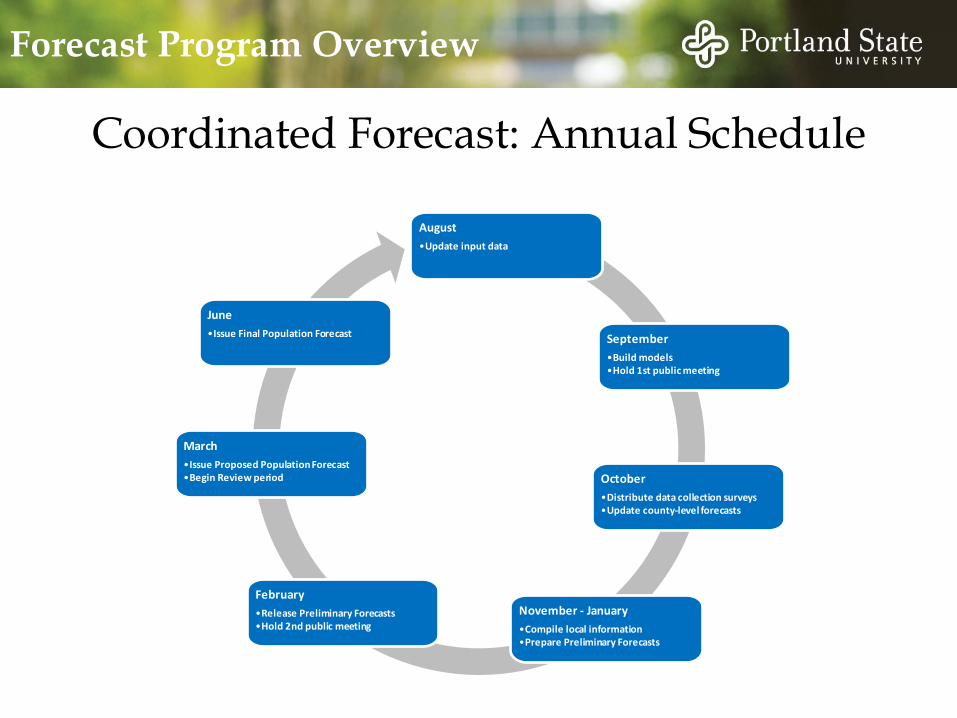
Coordinated Forecast: Annual Schedule
August
•Update input data
September
•Build models •Hold 1st public meeting
October
•Distribute data collection surveys •Update county-level forecasts
November - January
•Compile local information •Prepare Preliminary Forecasts
February
•Release Preliminary Forecasts •Hold 2nd public meeting
March
•Issue Proposed Population Forecast •Begin Review period
June
•Issue Final Population Forecast
Forecast Program Overview
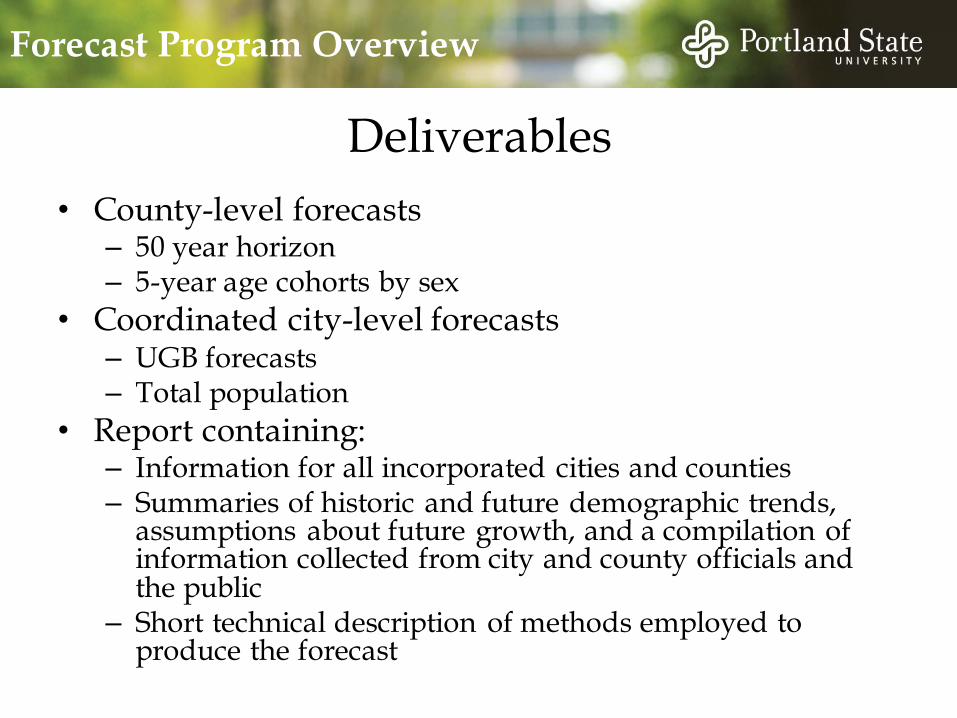
Deliverables
• County-level forecasts – 50 year horizon – 5-year age cohorts by sex
• Coordinated city-level forecasts – UGB forecasts – Total population
• Report containing: – Information for all incorporated cities and counties – Summaries of historic and future demographic trends,
assumptions about future growth, and a compilation of information collected from city and county officials and the public
– Short technical description of methods employed to produce the forecast
Forecast Program Overview

• Develop demographic models using historic and recent data
• Analyze past and current population trends ― Reasons for change, continuous or short-term?
• Gather information about existing and planned future housing, and about population change ― Housing developments ― Construction of new GQ facilities ― New employers
• Make assumptions about future housing and population change
• Revise forecasts on a regular basis
Process for Population Forecasts
Forecast Program Overview
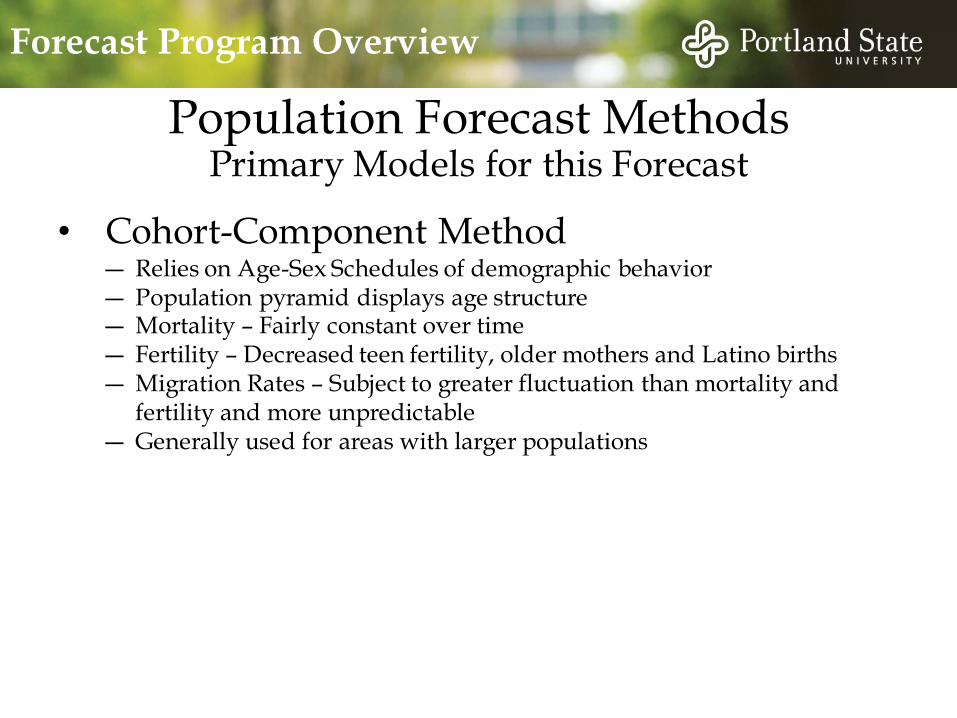
Population Forecast Methods Primary Models for this Forecast
• Cohort-Component Method ― Relies on Age-Sex Schedules of demographic behavior ― Population pyramid displays age structure ― Mortality – Fairly constant over time ― Fertility – Decreased teen fertility, older mothers and Latino births ― Migration Rates – Subject to greater fluctuation than mortality and
fertility and more unpredictable ― Generally used for areas with larger populations
Forecast Program Overview
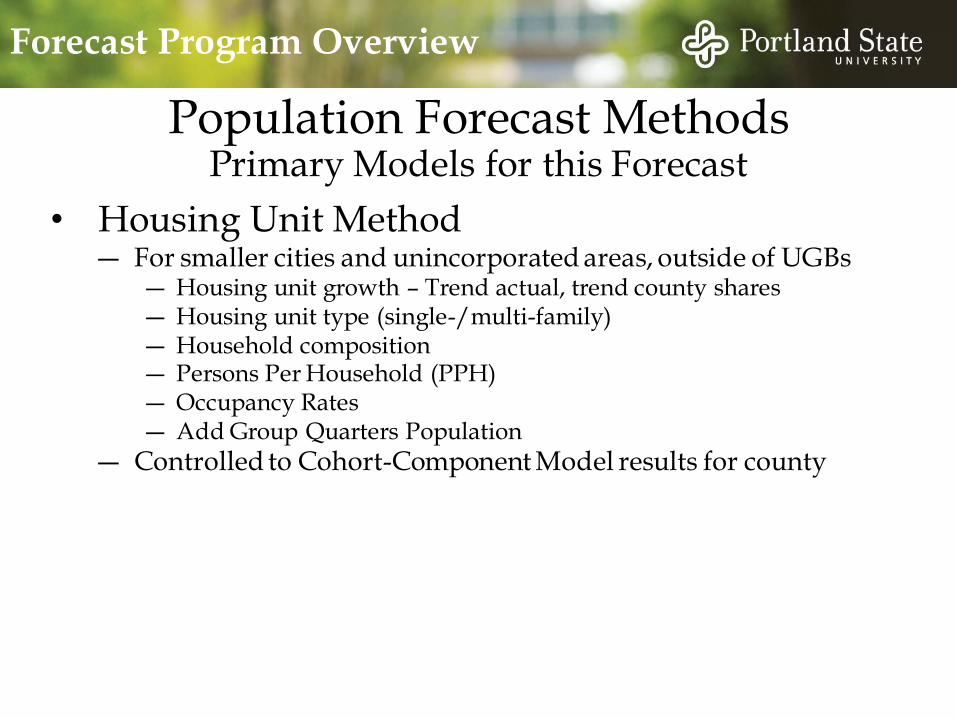
• Housing Unit Method ― For smaller cities and unincorporated areas, outside of UGBs
― Housing unit growth – Trend actual, trend county shares ― Housing unit type (single-/multi-family) ― Household composition ― Persons Per Household (PPH) ― Occupancy Rates ― Add Group Quarters Population
― Controlled to Cohort-Component Model results for county
Forecast Program Overview
Population Forecast Methods Primary Models for this Forecast
Forecast Program Overview
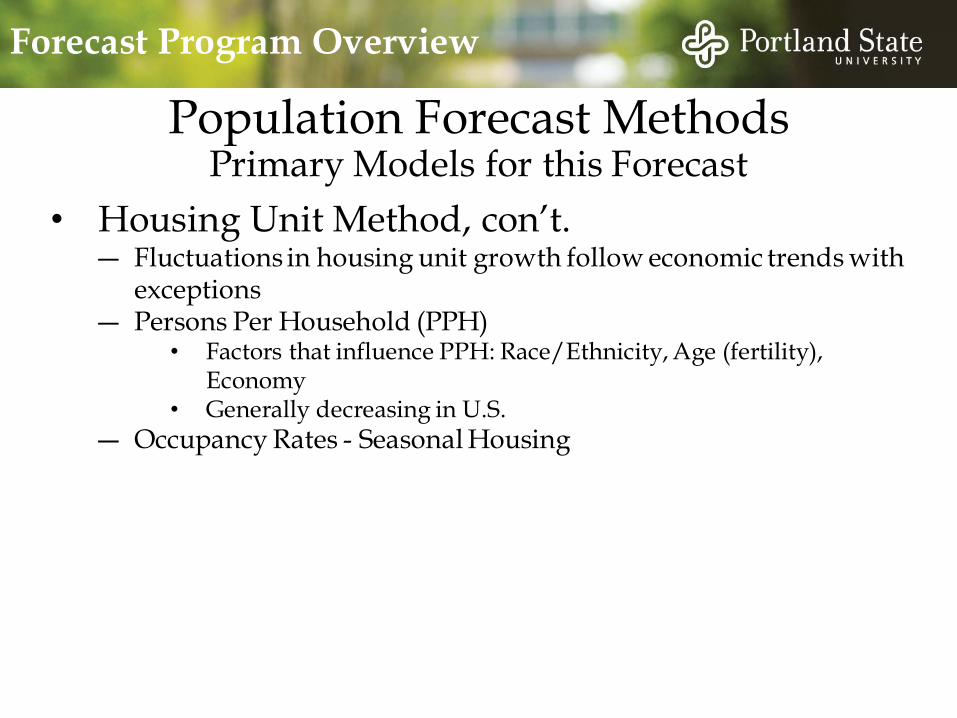
• Housing Unit Method, con’t. ― Fluctuations in housing unit growth follow economic trends with
exceptions ― Persons Per Household (PPH)
• Factors that influence PPH: Race/Ethnicity, Age (fertility), Economy
• Generally decreasing in U.S.
― Occupancy Rates - Seasonal Housing
Population Forecast Methods Primary Models for this Forecast

• For comparison and to serve as a check • Shift-Share and other Ratio Methods • Trend Extrapolation • Simple Economic/Employment Model • Additional Housing Unit Models (in addition to
CC models)
Forecast Program Overview
Population Forecast Methods Other Models/Methods to Consider

Primary Sources:
• U.S. Census Bureau, Decennial Censuses
• Population Research Center (PRC), Oregon Population Estimates Program
• Oregon Health Authority, Center for Health Statistics
• Incorporated counties, Assessors Office
• Incorporated cities, Community Development/Planning Department
• Oregon Geospatial Enterprise Office (GEO), Spatial Data Library
Secondary Sources:
• State of Oregon, Office of Economic Analysis
• U.S. Census Bureau, American Community Survey (ACS)
• U.S., Internal Revenue Service
• State of Oregon, Department of Revenue
• Oregon Department of Education
• U.S., Centers for Medicare and Medicaid Services
• State of Oregon, Employment Department
Forecast Program Overview
Population Forecast Data Sources

Process for Local Input
• Hold regional meetings – Receive feed back on:
• Historical and current demographic and economic trends • Local land use and growth management planning
• Local survey – Collect local observations
• Population composition; recent change • Planned housing development plus group quarters facilities • Future employers • Infrastructure
– Existing capacity – Planned expansion
• Anything that might promote or hinder population growth
– Survey will be posted on website and emailed to each jurisdiction
– Issued in October, 2014
Forecast Program Overview
Demographic and Economic Trends
Curry County

Source: U.S. Census Bureau, 1930 to 2010 Decennial Censuses. Calculated by Population Research Center (PRC).
Note: Average annual grow th rate is used for simplicity. In actuality the rate is an annualized rate calculated w ith this formula = [(Year1/Year2)̂ (1/10) ]-1
Demographic and Economic Trends
-2%
1%
3%
5%
7%
9%
11%
13%
15%
0
5,000
10,000
15,000
20,000
1930 1940 1950 1960 1970 1980 1990 2000 2010
Total Pop 3,257 4,301 6,048 13,983 13,006 16,992 19,327 21,137 22,364
AAGR 0.74% 2.82% 3.47% 8.74% -0.72% 2.71% 1.30% 0.90% 0.57%
Ave
rag
e a
nn
ua
l p
op
ula
tio
n g
row
th
To
tal
po
pu
lati
on
Curry County – Historical Census Population

Source: Population Research Center Annual Estimates 2000-2013. Calculated by Population Research Center (PRC).
Demographic and Economic Trends
-1.5%
-0.5%
0.5%
1.5%
2.5%
3.5%
4.5%
5.5%
18,000
18,500
19,000
19,500
20,000
20,500
21,000
21,500
22,000
22,500
23,000
2000 2001 2002 2003 2004 2005 2006 2007 2008 2009 2010 2011 2012 2013
Total Pop 21,168 21,741 21,557 21,523 21,689 21,845 22,135 22,361 22,512 22,458 22,355 22,335 22,295 22,300
AGR 0.2% 2.7% -0.8% -0.2% 0.8% 0.7% 1.3% 1.0% 0.7% -0.2% -0.5% -0.1% -0.2% 0.0%
An
nu
al
gro
wth
ra
te
To
tal
po
pu
lati
on
Curry County – Recent Annual Population Trend – July 1st Estimate

Demographic and Economic Trends
Source: Population Research Center, July 1st Annual Estimates 1998-2013. Oregon Health Authority, Center for Health Statistics. Calculated by Population Research
Center (PRC).
-1.5%
-1.0%
-0.5%
0.0%
0.5%
1.0%
1.5%
2.0%
2.5%
3.0%
-400
-200
0
200
400
600
800
1998 1999 2000 2001 2002 2003 2004 2005 2006 2007 2008 2009 2010 2011 2012 2013
Nat Inc -154 -191 -177 -153 -181 -197 -139 -108 -150 -196 -210 -198 -179 -162 -152 -178
Net Mig 154 281 225 726 -3 163 305 264 441 422 361 144 76 142 112 183
AGR 0.0% 0.4% 0.2% 2.7% -0.8% -0.2% 0.8% 0.7% 1.3% 1.0% 0.7% -0.2% -0.5% -0.1% -0.2% 0.0%
An
nu
al
po
pu
lati
on
gro
wth
ga
te
Ch
an
ge
in
po
pu
lati
on
(N
et
mig
rati
on
an
d n
atu
ral
incre
ase
)
Curry County - Natural Increase and Net Migration
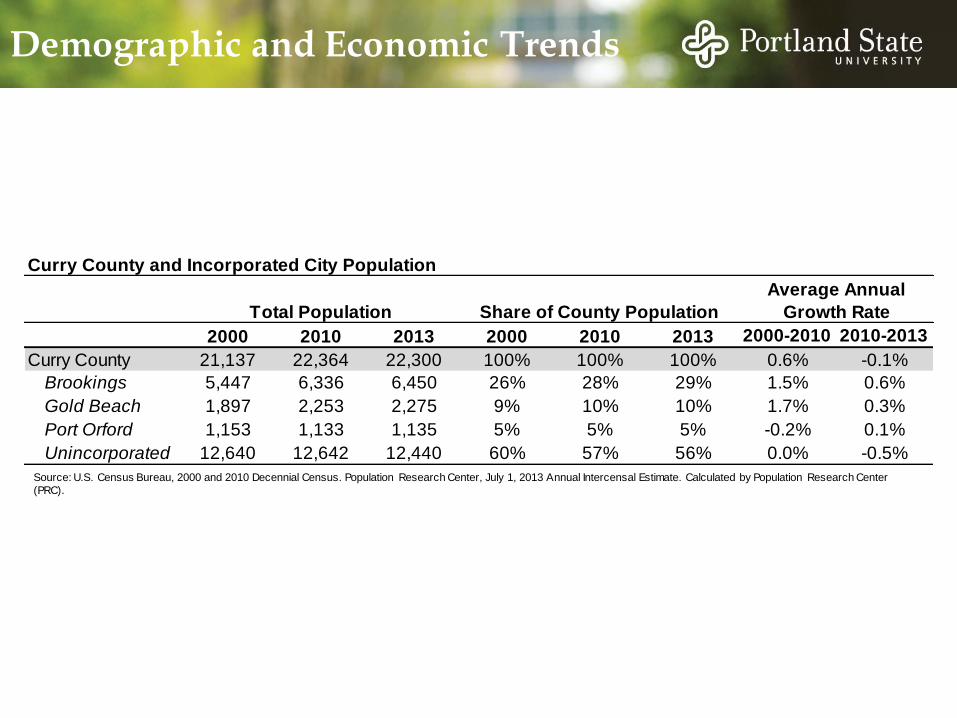
Curry County and Incorporated City Population
2000 2010 2013 2000 2010 2013 2000-2010 2010-2013
Curry County 21,137 22,364 22,300 100% 100% 100% 0.6% -0.1%
Brookings 5,447 6,336 6,450 26% 28% 29% 1.5% 0.6%
Gold Beach 1,897 2,253 2,275 9% 10% 10% 1.7% 0.3%
Port Orford 1,153 1,133 1,135 5% 5% 5% -0.2% 0.1%
Unincorporated 12,640 12,642 12,440 60% 57% 56% 0.0% -0.5%
Total Population Share of County Population
Average Annual
Growth Rate
Source: U.S. Census Bureau, 2000 and 2010 Decennial Census. Population Research Center, July 1, 2013 Annual Intercensal Estimate. Calculated by Population Research Center
(PRC).
Demographic and Economic Trends

0%
10%
20%
30%
40%
50%
60%
70%
80%
90%
100%
1980 1990 2000 2001 2002 2003 2004 2005 2006 2007 2008 2009 2010 2011 2012 2013
Sh
are
of
To
tal
Co
un
ty P
op
ula
tio
n
Curry County - City Share of Population
Unincorporated
Port Orford
Gold Beach
Brookings
Demographic and Economic Trends
Source: U.S. Census Bureau. 1980, 1990, 2000 and 2010 Decennial Census. Population Research Center, July 1st Annual Estimates 2001-2009 and 2011-2013.
Calculated by Population Research Center (PRC).

Demographic and Economic Trends
0%
10%
20%
30%
40%
50%
60%
70%
80%
90%
100%
1980 1990 2000 2001 2002 2003 2004 2005 2006 2007 2008 2009 2010 2011 2012 2013
Sh
are
of
To
tal
Co
un
ty P
op
ula
tio
n
Curry County - City Share of Population
Unincorporated
Port Orford
Gold Beach
Brookings
Source: U.S. Census Bureau. 1980, 1990, 2000 and 2010 Decennial Census. Population Research Center, July 1st Annual Estimates 2001-2009 and 2011-2013.
Calculated by Population Research Center (PRC).
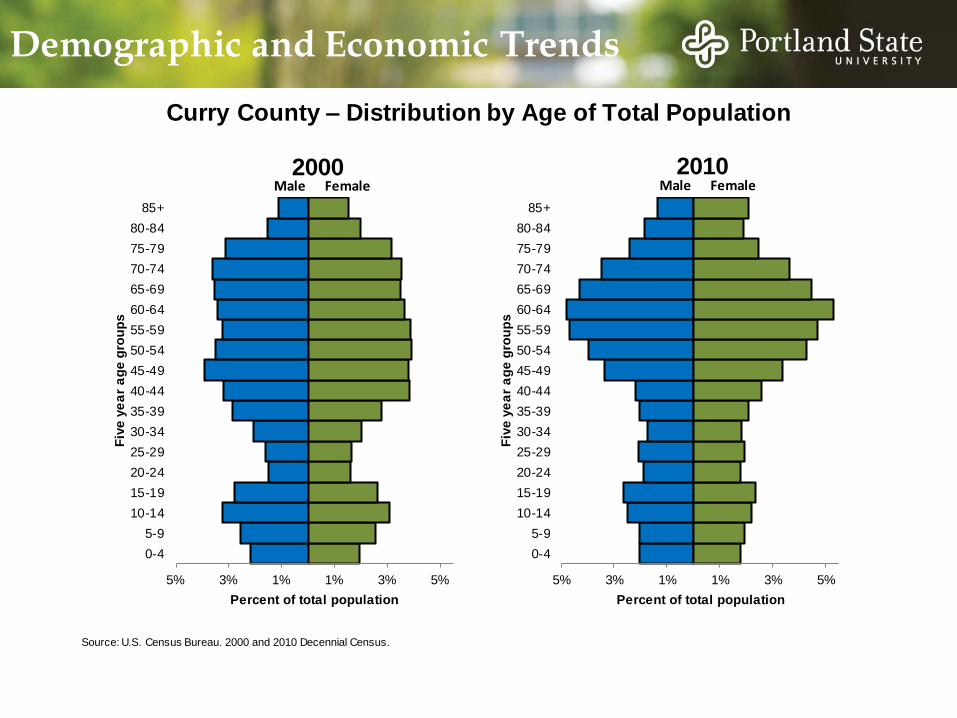
Source: U.S. Census Bureau. 2000 and 2010 Decennial Census.
Curry County – Distribution by Age of Total Population
Demographic and Economic Trends
5% 3% 1% 1% 3% 5%
0-4
5-9
10-14
15-19
20-24
25-29
30-34
35-39
40-44
45-49
50-54
55-59
60-64
65-69
70-74
75-79
80-84
85+
Percent of total population
Fiv
e y
ea
r a
ge
gro
up
s
2000 Male Female
5% 3% 1% 1% 3% 5%
0-4
5-9
10-14
15-19
20-24
25-29
30-34
35-39
40-44
45-49
50-54
55-59
60-64
65-69
70-74
75-79
80-84
85+
Percent of total population
Fiv
e y
ea
r a
ge
gro
up
s
2010 Male Female

Source: U.S. Census Bureau. 2000 and 2010 Decennial Census. Calculated by Population Research Center (PRC).
-0.30
-0.20
-0.10
0.00
0.10
0.20
0 t
o 4
5 t
o 9
10
to
14
15
to
19
20
to
24
25
to
29
30
to
34
35
to
39
40
to
44
45
to
49
50
to
54
55
to
59
60
to
64
65
to
69
70
to
74
75
to
79
80
to
84
85
+
Mig
rati
on
ra
te
(In
co
me
rs p
er
pe
rso
n)
Five year age group
Oregon – 5yr Migration Rates for Total Population, 2000-2010
Demographic and Economic Trends
-0.30
-0.20
-0.10
0.00
0.10
0.200 t
o 4
5 t
o 9
10
to
14
15
to
19
20
to
24
25
to
29
30
to
34
35
to
39
40
to
44
45
to
49
50
to
54
55
to
59
60
to
64
65
to
69
70
to
74
75
to
79
80
to
84
85
+
Mig
rati
on
ra
te
(In
co
me
rs p
er
pe
rso
n)
Five year age group
Curry County – 5yr Migration Rates for Total Population, 2000-2010

0.00
0.02
0.04
0.06
0.08
0.10
0.12
0.14
0.16
10-14 15-19 20-24 25-29 30-34 35-39 40-44 45-49
Fe
rtil
ity r
ate
(B
irth
s p
er
wo
ma
n b
y f
ive
ye
ar
ag
e g
rou
p)
Five year age group
Curry County – Age Specific Fertility Rates
2000
2010
Source: U.S. Census Bureau, 2000 and 2010 Decennial Census. Oregon Health Authority, Center for Health Statistics. Calculated by Population Research Center
(PRC).
2000 2010
Total fertility rate 1.812 2.106
Demographic and Economic Trends
0.00
0.02
0.04
0.06
0.08
0.10
0.12
0.14
0.16
10-14 15-19 20-24 25-29 30-34 35-39 40-44 45-49
Fe
rtil
ity r
ate
(B
irth
s p
er
wo
ma
n b
y f
ive
ye
ar
ag
e g
rou
p)
Five year age group
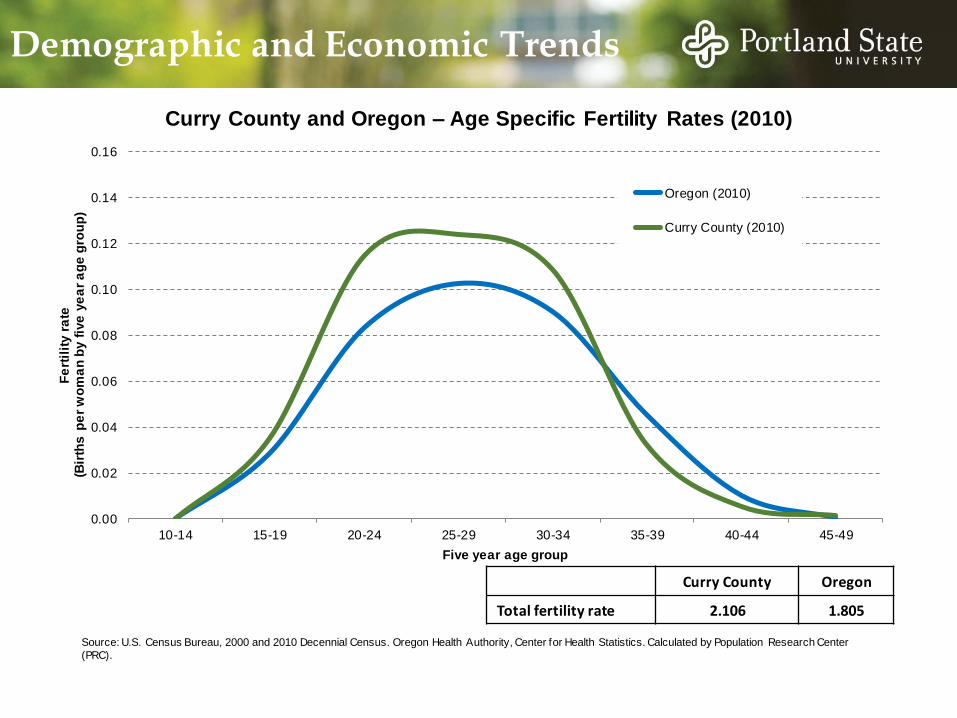
Curry County and Oregon – Age Specific Fertility Rates (2010)
Oregon (2010)
Curry County (2010)
Source: U.S. Census Bureau, 2000 and 2010 Decennial Census. Oregon Health Authority, Center for Health Statistics. Calculated by Population Research Center
(PRC).
Curry County Oregon
Total fertility rate 2.106 1.805
Demographic and Economic Trends

Source: U.S. Census Bureau, 2000 and 2010 Decennial Census. Oregon Health Authority, Center for Health Statistics. Calculated by Population Research Center
(PRC).
Demographic and Economic Trends
0.50
0.55
0.60
0.65
0.70
0.75
0.80
0.85
0.90
0.95
1.00
0 1-4 5-9 10-14 15-19 20-24 25-29 30-34 35-39 40-44 45-49 50-54 55-59 60-64 65-69 70-74 75-79 80-84 85+
Su
rviv
al
ra
te
(Pe
rce
nt
surv
ive
d e
ach
fiv
e y
ea
r a
ge
gro
up
)
Five year age group
Curry County – Age Specific Survival Rates
2000
2010
Source: U.S. Census Bureau, 2000 and 2010 Decennial Census. Oregon Health Authority, Center for Health Statistics. Calculated by Population Research Center
(PRC).
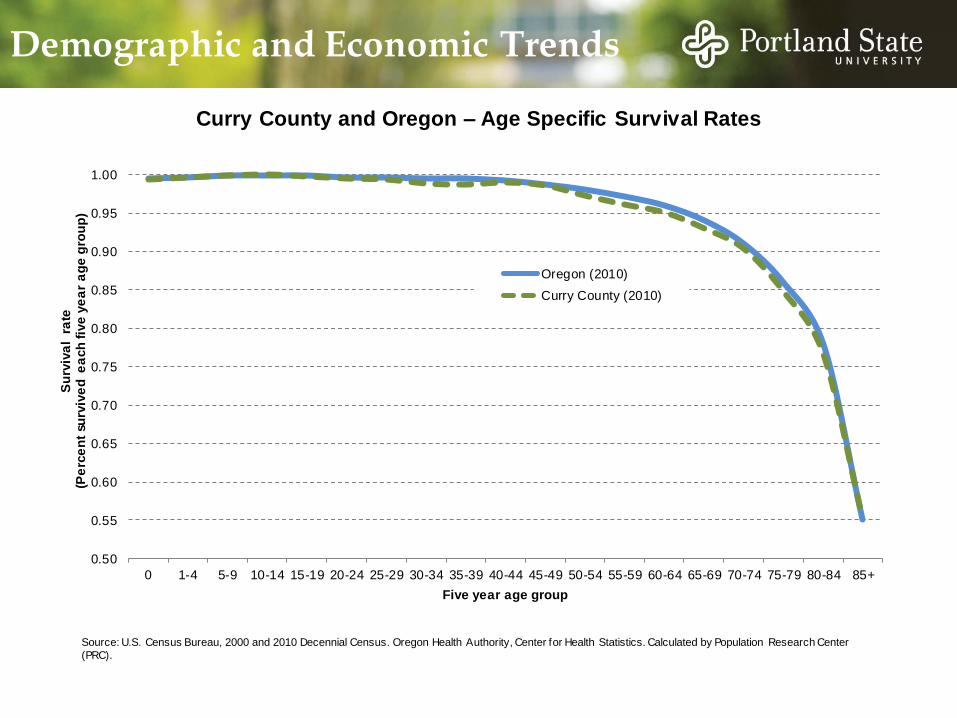
Demographic and Economic Trends
0.50
0.55
0.60
0.65
0.70
0.75
0.80
0.85
0.90
0.95
1.00
0 1-4 5-9 10-14 15-19 20-24 25-29 30-34 35-39 40-44 45-49 50-54 55-59 60-64 65-69 70-74 75-79 80-84 85+
Su
rviv
al
ra
te
(Pe
rce
nt
surv
ive
d e
ach
fiv
e y
ea
r a
ge
gro
up
)
Five year age group
Curry County and Oregon – Age Specific Survival Rates
Oregon (2010)
Curry County (2010)

Source: U.S. Census Bureau, 1980, 1990, 2000, and 2010 Decennial Census. Calculated by Population Research Center (PRC).
Note: Dependency Ratio = {[(Population Age 0-14) + (Population Age 65 or older)] / (Population Age 15-64)} x 100
Demographic and Economic Trends
0
10
20
30
40
50
60
70
1980 1990 2000 2010
De
pe
nd
en
ts p
er
100 w
ork
ing
ag
e p
ers
on
s
Curry County - Dependency Ratio
Total Youth Elderly
Source: U.S. Census Bureau. 2000 and 2010 Decennial Census.
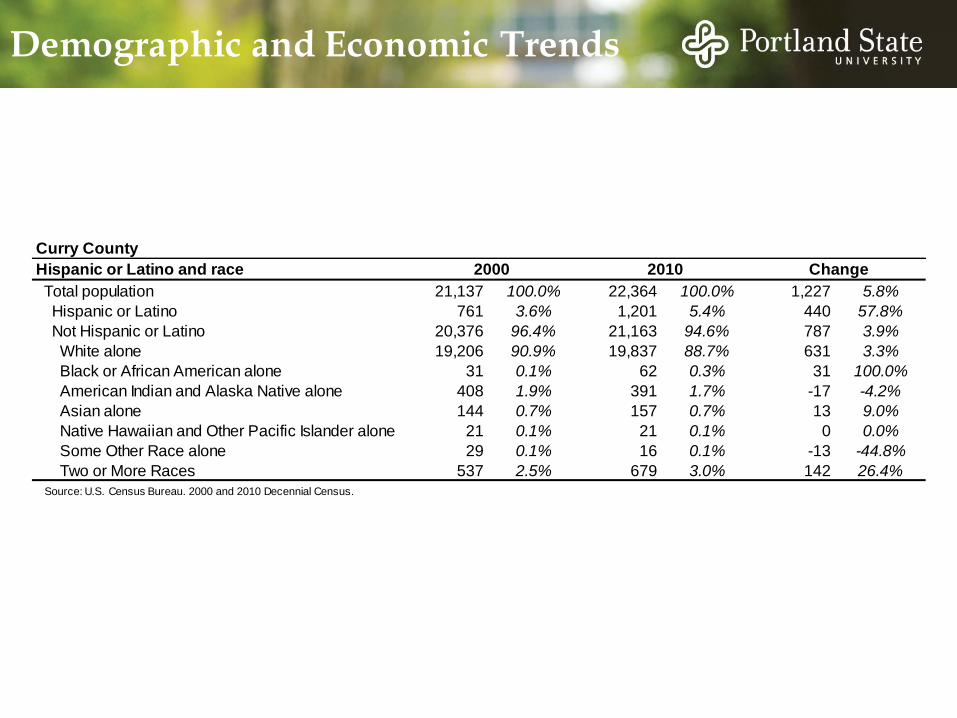
Demographic and Economic Trends
Curry County
Hispanic or Latino and race 2000 2010 Change
Total population 21,137 100.0% 22,364 100.0% 1,227 5.8%
Hispanic or Latino 761 3.6% 1,201 5.4% 440 57.8%
Not Hispanic or Latino 20,376 96.4% 21,163 94.6% 787 3.9%
White alone 19,206 90.9% 19,837 88.7% 631 3.3%
Black or African American alone 31 0.1% 62 0.3% 31 100.0%
American Indian and Alaska Native alone 408 1.9% 391 1.7% -17 -4.2%
Asian alone 144 0.7% 157 0.7% 13 9.0%
Native Hawaiian and Other Pacific Islander alone 21 0.1% 21 0.1% 0 0.0%
Some Other Race alone 29 0.1% 16 0.1% -13 -44.8%
Two or More Races 537 2.5% 679 3.0% 142 26.4%
Source: U.S. Census Bureau. 2000 and 2010 Decennial Census.
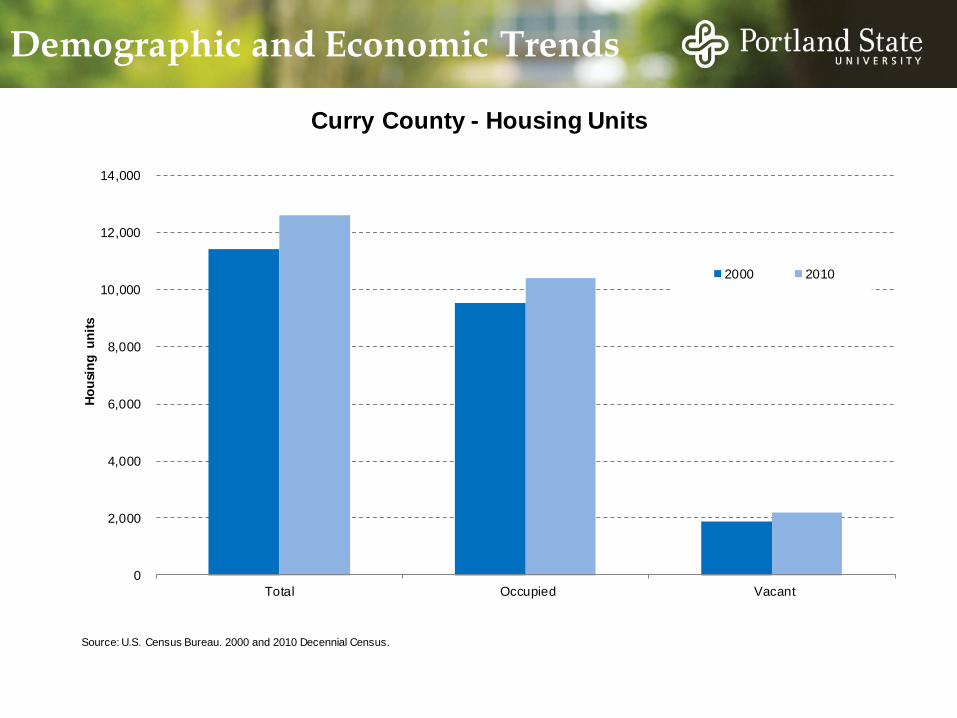
Demographic and Economic Trends
0
2,000
4,000
6,000
8,000
10,000
12,000
14,000
Total Occupied Vacant
Ho
usi
ng
un
its
Curry County - Housing Units
2000 2010

Source: U.S. Census Bureau. 2000 and 2010 Decennial Census. Calculated by Population Research Center (PRC).
*Note: Percent Seasonal Housing is the proportion of total housing units in 2010 that are identif ied as vacant “for seasonal, recreational, or occasional use.”
Demographic and Economic Trends
Percent
Seasonal
Housing*
2000 2010 2000 2010 2000 2010 2010
Oregon 2.51 2.47 91.8% 90.7% 2.3% 2.3% 3.31%
Curry County 2.19 2.12 83.7% 82.6% 1.3% 1.4% 8.96%
Brookings 2.30 2.26 88.3% 85.4% 2.7% 2.9% 6.91%
Gold Beach 2.19 2.05 84.0% 80.9% 4.2% 2.5% 7.41%
Port Orford 2.02 1.86 86.3% 78.6% 0.0% 1.1% 10.17%
Unincorporated 2.16 2.09 81.7% 82.1% 0.4% 0.5% NA
Persons Per
Household (PPH) Occupancy Rate
Percent Group
Quarters

Source: U.S. Census Bureau. 2013. Quarterly Workforce Indicators Data. Longitudinal-Employer Household Dynamics Program. http://ledextract.ces.census.gov/.
Calculated by Population Research Center (PRC).
Demographic and Economic Trends
-2%
8%
18%
28%
38%
48%
Pe
rce
nt
em
plo
ym
en
t g
row
th a
ll in
du
stri
es
(I
nd
ex
ed
to
1991)
Curry County - Employment Growth since 1991
Recession
Oregon
Curry

Source: Oregon Employment Department. Local Area Employment Statistics. Oregon Labor Market Information System. http://w ww.qualityinfo.org/olmisj/labforce.
Note: The rate represents the percent of the labor force seeking w ork but not employed.
Demographic and Economic Trends
0
2
4
6
8
10
12
14
Un
em
plo
ym
en
t ra
te
Curry County and Oregon - Unemployment Rate
Recession
Oregon
Curry
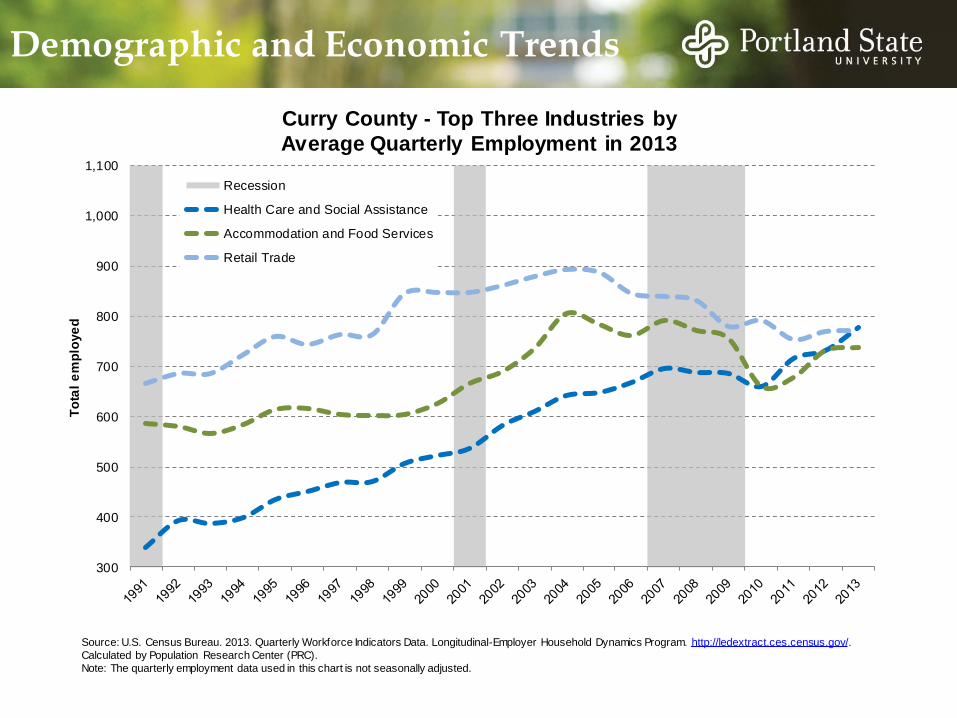
Source: U.S. Census Bureau. 2013. Quarterly Workforce Indicators Data. Longitudinal-Employer Household Dynamics Program. http://ledextract.ces.census.gov/.
Calculated by Population Research Center (PRC).
Note: The quarterly employment data used in this chart is not seasonally adjusted.
Demographic and Economic Trends
300
400
500
600
700
800
900
1,000
1,100
To
tal
em
plo
ye
d
Curry County - Top Three Industries by
Average Quarterly Employment in 2013
Recession
Health Care and Social Assistance
Accommodation and Food Services
Retail Trade

• Questions?
• Discussion time
Local Input and Additional Information