organic acids pineapple and papaya-r1 - · pdf file2 determination of organic acids in papaya...
TRANSCRIPT
1
Factors affecting sample extraction in the liquid chromatographic 1
determination of organic acids in papaya and pineapple 2
3
Yurena Hernández, M. Gloria Lobo, Mónica González* 4 Post-harvest and Food Technology Laboratory, Department of Tropical Fruit Crops, Instituto Canario de 5
Investigaciones Agrarias, Apdo. 60, 38200 La Laguna, Spain 6 7
Abstract 8
A solvent extraction method was developed for the extraction of organic acids (oxalic, citric, tartaric, 9
L-malic, quinic, succinic and fumaric acids) in papaya and pineapple. Central composite design “2n + star” 10
was used in order to optimise the following extraction parameters: number of extractions, composition of the 11
extractant mixture, extraction time and extraction temperature. Optimal conditions for extraction were 12
determined by experimental design using response surface methodology. The results suggest that the 13
extractant composition is statistically the most significant factor and that the optimum values for the variables 14
are: 3 (number de extractions), water as extractant, 60 min (extraction time) and 65 ºC (extraction 15
temperature). The separation and determination of the organic acids was carried out by liquid chromatography 16
with UV-VIS detection. 17
18
Keywords: Food analysis; Tropical fruits; Solvent extraction; Experimental design; LC with UV-VIS 19
detection. 20
21
* Corresponding author. Tel.: +34-922-476310; fax: +34-922-476303. 22
E-mail address: [email protected] (Mónica González) 23

2
1. Introduction 24
Organic acids are widely distributed in fruits and originate from biochemical 25
processes or from the activity of some microorganisms such as yeasts and bacteria. These 26
carboxylic acids determine pH and total acidity of fruits, inhibit the action of enzymes and 27
are chelating agents of metals and therefore impede chemical precipitation and oxidation. 28
Moreover, the non-volatile organic acids influence fruit sensorial properties (flavour, colour 29
and aroma). Therefore, the determination of organic acids allows different fruit cultivars 30
(Usenik, Fabcic & Stampar, 2008) and the effect of pre-harvest factors (Keutgen & 31
Pawelzik, 2007) on the organoleptic quality of the fruit to be evaluated. It also allows the 32
development (Saradhuldhat & Paull, 2007) or ripening (Sturm, Koron & Stampar, 2003) of 33
the fruit to be monitored, as well as provides a way to check and control the fermentation 34
processes (Avenoza, Busto, Canal & Peregrina, 2006). Moreover, their analysis is a 35
powerful tool to characterise the authenticity of fruit products (Saavedra, Rupérez & 36
Barbas, 2001) or to control post-harvest (Beirao-Da-Costa, Steiner, Correia, Leitao, Empis 37
& Moldao-Martins, 2008) or technological processes (Silva, Andrade, Mendes, Seabra & 38
Ferrerira, 2002) and storage (Marsh, Attanayake, Walker, Gunson, Boldingh & MacRae, 39
2004) based on their relative stability. 40
A variety of analytical methods for determining organic acids in fruits and fruit juices 41
have been reported to date. The individual determination of organic acids in these food 42
matrices is usually carried out using a spectrophotometric detector (Luque-Pérez, Ríos & 43
Valcárcel, 1998) but the resolution of complex mixtures requires the use of chemometric 44
techniques or near infrared spectroscopy (Chen, Zhang & Matsunaga, 2006). The non-45
specificity of classical electrochemical methods applied to determine organic acids has 46
been surpassed by their combination with enzymatic biosensors (Kim, 2006). However, 47

3
because the organic acids are present in mixtures, the preferred choice for organic acids 48
determination is the use of separation techniques: capillary electrophoresis (Saavedra et al., 49
2001; Mato, Suárez-Luque & Huidobro, 2007), gas chromatography (GC) and liquid 50
chromatography (LC). In spite of its high sensitivity and selectivity, GC has been less used 51
for the determination of organic acids than LC, because these compounds need to be 52
derivatised (Chan, Chenchin & Vonnahme, 1973; González-Aguilar, Buta & Wang, 2003). 53
Most of the liquid chromatographic methods to determine organic acids have been carried 54
out by ion-exclusion (Cano, Torija, Marín & Cámara, 1994; Bartolomé, Rupérez & Fúster, 55
1995; Bartolomé, Rupérez & Fúster, 1996; Saradhuldhat et al., 2007). 56
To ensure that analysis by LC is effective, it is very important to optimise the sample 57
extraction when analysing organic acids in complex samples such as fruits, because of their 58
diverse matrices. Moreover, fruits contain large amounts of potentially interfering 59
compounds. For these reasons considerable caution should be exercised in the employment 60
of methods that have been developed for the analysis of specific plant tissue types. To 61
provide clean extracts, fruits require a pre-treatment that includes organic solvent extraction 62
and cleanup processes by solid-phase extraction. A critical step in the analytical 63
determination of organic acids in tropical fruits such as papaya and pineapple, which has 64
not been studied in detail, is the solvent extraction of these compounds as a function of 65
these vegetable matrices. Several solvents have been used to extract organic acids from 66
fruits: water (Sturm et al., 2003; Usenik et al., 2008), methanol (Cano et al., 1994; 67
Bartolomé et al., 1995; Bartolomé et al., 1996; Silva et al., 2002) and mixtures 68
ethanol:water (Pérez, Olías, Espada, Olías & Sanz, 1997; Holcroft & Kader, 1999; 69
Saradhuldhat et al., 2007). Other variables that influence the organic acids extraction are 70
time and temperature. So, it has been used extraction times between 1 and 30 min (Cano et 71

4
al., 1994; Bartolomé et al., 1995; Pérez et al., 1997; Holcroft et al., 1999; Usenik et al., 72
2008) and extraction temperatures between room temperature and 65 ºC (Cano et al., 1994; 73
Bartolomé et al., 1995; Silva et al., 2002; Usenik et al., 2008). 74
Experimental designs are used to select influential factors, optimise conditions and 75
assess the impact of those factors. In traditional strategies, only one variable is changed 76
while all the others remain constant. This approach does not allow the study of changes in 77
the response that may occur when two or more factors are modified simultaneously. 78
Experimental design is an alternative to this strategy because it allows a large number of 79
factors to be screened simultaneously and provides less ambiguous data. Furthermore, 80
experimental designs combined with response surface methodology help to visualise 81
relationships between responses and factor levels which allows researchers to locate the 82
region of highest response values. 83
The objective of this research was to establish the optimal conditions for extracting 84
organic acids from papaya and pineapple using solvent extraction before determining of 85
these compounds via LC. The use of central composite designs to optimise four variables 86
(number of extractions, composition of the extractant mixture, extraction time and 87
extraction temperature) determines an optimal set of operational conditions. 88
89
2. Materials and methods 90
2.1. Plant material 91
Papaya (Carica papaya L., cv. ‘‘Baixinho do Santa Amalia’’) was harvested from 92
fields located in Tejina in northwest Tenerife (Canary Islands, Spain) and pineapple 93
(Ananas comosus L., cv. ‘‘Red Spanish”) from Frontera in El Hierro (Canary Islands). 94
Papaya was harvested at physiological maturity stage (mature-green) and allowed to ripen 95

5
(full-ripeness or consumption stage) at 18 ºC and 80-90% relative humidity; however, 96
pineapple (which is a non-climacteric fruit) was collected at full-ripeness. 97
The assay was performed using nine homogeneous units of each fruit in a similar 98
ripening stage, characterised by peel and pulp colour, firmness, total soluble solids (TSS), 99
pH and titratable acidity. Lightness, hue angle and chromaticity of papaya peel, at full 100
ripeness, were 63 ± 2, 80 ± 1 and 60 ± 2, respectively. These colour attributes in pineapple 101
peel (51 ± 2, 72 ± 3 and 34 ± 1, respectively) were lower than in papaya. The colours of 102
papaya and pineapple pulp were characterised by a lightness of 60 ± 2 and 75 ± 5, a hue 103
angle of 70 ± 2 and 109 ± 2 and a chromaticity of 46 ± 2 and 16 ± 2, respectively. Pulp 104
firmness, measured as penetration force, was 4.3 ± 0.2 N and 15 ± 2 N for papaya and 105
pineapple, respectively. TSS were similar for both fruits: 13 ± 1 ºBrix for papaya and 15 ± 106
1 ºBrix for pineapple. However, acid content was higher for pineapple (pH 3.5 ± 0.1; and 107
titratable acidity 1,175 ± 83 mg citric acid/100 g) than for papaya (pH 5.6 ± 0.1; and 108
titratable acidity 90 ± 3 mg citric acid/100 g). 109
For organic acids determination, fruits pulp was sliced, frozen into liquid nitrogen 110
and stored at -80 ºC until the analyses were carried out. 111
112
2.2. Solvent extraction method 113
Four grams of accurately weighed of frozen pulverised fruit samples were mixed 114
with 8 ml of extractant [concentration of ethanol (Panreac, Madrid, Spain) and water varied 115
depending on the particular experiment; ranging between 0 and 100%]. The mixture was 116
homogenised with a Politron PT 6000 (Kinematica AG, Lucerne, Switzerland) high speed 117
blender at 12,000 g for 1 min. Then organic acids present in the fruits were extracted 118
(extraction time varied depending on the particular experiment; ranging between 5 and 60 119
6
min) in a water bath (extraction temperature varied depending on the particular experiment; 120
ranging between 25 and 100 ºC). Extracts were centrifuged at 5,000 g for 30 min in a Jouan 121
CR 312 centrifuge (Thermo Electron Corporation, Madrid, Spain). Depending on the 122
experiment, this procedure was repeated (ranging between 1 and 3 times); the resulting 123
supernatants were mixed together and a final volume of 25-ml was achieved. An aliquot of 124
4 ml of the extract was evaporated to dryness at 45°C (approximately 20 h) in a Heto VR 1 125
evaporator (Allerod, Denmark). The residue was re-dissolved in 4 ml of water milli-Q and 126
passed through a 300 mg Alltech (Laarne, Belgium) Sep-pack RP-C18 column to eliminate 127
possible interferences. The eluate was collected, an aliquot of 1 ml was filtered through a 128
0.45 μm nylon membrane and subsequently used to analyse organic acids. After each 129
determination, the adsorbent was cleaned with 6 ml of water to remove interfering 130
compounds adsorbed; finally, the adsorbent was conditioned with 2 ml of ethanol. 131
132
2.3. Chromatographic determination of organic acids 133
The liquid chromatographic method used for the determination of organic acids 134
(oxalic, citric, tartaric, pyruvic, L-malic, quinic, succinic and fumaric acid) consisted of an 135
isocratic elution procedure with UV-visible detection. The analyses were carried out on a 136
Shimadzu modular chromatographic system (Kyoto, Japan) equipped with a LC-10AD 137
pump, a SPD-10AV UV-VIS detector and controlled via Class LC-10 data acquisition 138
software (also from Shimadzu). The injection valve was a Rheodyne 7725i (Cotati, USA) 139
with an injection loop of 20 μl. Organic acid separation was carried out on a Shodex 140
(Showa Kenko, Tokyo, Japan) RSpack KC-811 column (5 μm particle size, 250 x 4.6 mm 141

7
i.d.), using an isocratic 0.1% orthophosphoric acid (Panreac) mobile phase at a flow rate of 142
0.8 ml/min. Detection wavelength for the UV-visible detector was set at 210 nm. 143
Organic acid peaks were identified by comparing their UV-VIS spectral 144
characteristics and retention times with those from commercial standards supplied by 145
Sigma (Madrid, Spain). The spectra (detection wavelengths from 200 to 700 nm) were 146
recorded for the peaks identified as a particular organic acid by retention time, using a 147
Shimadzu SPD-M6A UV-VIS diode array detector. For each fruit type the efficiency of 148
peak separation was checked by the peak purity test carried out at maximum absorbance. 149
Stock standard solutions containing 1 mg/ml of each organic acid were prepared in milli-Q 150
water and stored in glass stoppered bottles at 4 ºC in the dark. Solutions of variable 151
concentrations were prepared by diluting the stock standard solution in milli-Q water. 152
153
2.4. Experimental design 154
Statgraphics Plus version 4.1 (Statistical Graphics, Rockville, USA) was employed 155
to generate design, regression analysis and to obtain the response surface plots. A central 156
composite design (CCD) “24 + star” projected on a face-centred star design with two centre 157
points was chosen to evaluate the combined effects of four independent variables on the 158
organic acid extraction from two tropical fruits (papaya and pineapple). The variables 159
(number of extractions, ethanol concentration in the extractant mixture, extraction time and 160
extraction temperature) were set at three separate coded levels (see Section 2.2.). The 161
design consisted of 26 randomised runs, doing each experiment in triplicate (n = 78). The 162
unknown function was assumed to be approximated by a second-order polynomial equation 163
such as: 164

8
εββββ +⋅⋅+⋅+⋅+= ∑ ∑∑∑==
k
i i jjiijiii
k
iii xxxxy
1
2
10 165
(i < j) 166
where y is the organic acid content; β0 (centre point of system), βi, βii and βij (coefficients 167
of variables for linear, quadratic and interaction regression effects) are the different 168
constant coefficients of the model; xi and xj are levels of independent variables; and ε is the 169
error of the model. An analysis of variance (ANOVA) table was generated to determine 170
individual linear, quadratic and interaction regression coefficients. The significances of 171
polynomial relations were examined statistically by computing the F-value at a probability 172
(p) of 0.050. The regression coefficients were then used to make statistical analysis and to 173
generate contour maps of the regression models. 174
175
3. Results and discussion 176
3.1. Chromatographic conditions to analyse organic acids and analytical features 177
Initially, the chromatographic conditions described by Cano et al. (1994) and 178
Bartolomé et al. (1995) were followed to analyse organic acids (oxalic, citric, tartaric, 179
pyruvic, L-malic, quinic, succinic and fumaric acid) in papaya and pineapple fruits. 180
However, due to the differences on the stationary phase used for the separation of the 181
organic acids, some chemical, hydrodynamic, and physical variables had to be optimised to 182
improve the resolution between the different organic acids. Good results were obtained 183
using a mixture of water and orthophosphoric acid as the mobile phase. The concentration 184
of orthophosphoric acid was studied over the range 0-1% and a concentration of 0.1% was 185
found to be optimal. The flow-rate significantly influenced organic acids retention time and 186
resolution; the best flow value was 0.8 ml/min (optimised between 0.2 and 1.8 ml/min) 187

9
because of the better resolution achieved. The oven temperature was studied over the range 188
25-60 ºC. The control of temperature was not considered necessary because it did not 189
improve the separation of the different analytes. 190
Calibration graphs for organic acids were constructed by plotting the peak area 191
against the organic acid concentration at seven concentration levels (analysed in triplicate). 192
Quality parameters for the chromatographic determination of the different organic acids are 193
reported in Table 1. Detection limit, defined as the minimum concentration capable of 194
giving a chromatographic signal three times higher than background noise, is also listed in 195
Table 1. The repeatability of the chromatographic procedure, expressed as relative standard 196
deviation (RSD), was checked on eleven consecutive injections of a standard solution 197
containing 100 mg/l of the different organic acids analysed. 198
199
3.2. Optimisation of the organic acid extraction 200
In accordance with our previous experience in the treatment of papaya and pineapple 201
fruits, four variable factors that can potentially affect extraction efficiency were chosen: 202
number of extractions, ethanol concentration in the extractant mixture, extraction time and 203
extraction temperature. Although organic acids have been extracted from papaya and 204
pineapple, the analytical methods used were not optimised for this specific fruits (Chan, 205
Chang, Stafford & Brekke, 1971; Cano et al., 1994; Bartolomé et al., 1995; Bartolomé et 206
al., 1996). In order to optimise organic acids extraction specifically from papaya and 207
pineapple, the minimum and maximum levels (Table 2 and Table 3) given to each factor 208
were chosen based on the experience of other authors in the pre-treatment of different types 209
of plant materials (Cano et al., 1994; Holcroft et al., 1999; Silva et al., 2002; Sturm et al., 210

10
2003; Usenik et al., 2008). Other factors implicated in the extraction were kept constant: 211
amount of fruit, volume of extractant and final volume of the extract. 212
Table 2 and Table 3 show the design matrix, which include the factors that influence 213
organic acid extraction and the amounts [expressed as mg/100 g fresh weight (FW)] of the 214
different organic acids obtained in the different experiments carried out in papaya and 215
pineapple, respectively. The sequential listing of the experimental design parameters 216
represents the statistically randomised order in which the experimental treatments were 217
undertaken. All organic acids analysed, except pyruvic acid, were identified in papaya 218
(Table 2); however in pineapple five organic acids were identified: oxalic acid, citric acid, 219
L-malic acid, quinic acid and succinic acid (Table 3). Chan et al. (1971) identified and 220
quantified citric and malic acids (as the main acids) and α-ketoglutaric acid in type Solo 221
papaya. Cano et al. (1994) described the presence of oxalic, citric, galacturonic, ascorbic, 222
L-malic, quinic, succinic, fumaric and D-malic acid in papaya cv. “Sunrise”. Regarding to 223
pineapple cv. “Red Spanish”, Bartolomé et al. (1996) identified oxalic, citric, L-malic, 224
quinic and succinic acids but only quantified oxalic, citric and L-malic acid. Citric and L-225
malic acid have been identified and quantified in cultivar “Smooth Cayenne” by Cano et al. 226
(1994), Bartolomé et al. (1995), Bartolomé et al. (1996), Brat, Hoang, Soler, Reynes & 227
Brillouet (2004) and Saradhuldhat et al. (2007). Moreover, Cano et al. (1994), Bartolomé et 228
al. (1996) and Brat et al. (2004) quantified oxalic acid in this pineapple cultivar. Bartolomé 229
et al. (1996) also quantified quinic and succinic acid. 230
It should be noted that the modification of the experimental conditions used for the 231
extraction did not affect all of the organic acids equally (Table 2 and Table 3). In fact, 232
different chromatographic profiles were obtained for different extraction conditions. The 233

11
comparison of the experimental values of organic acids content with the predicted values 234
shown that the two sets of values, for each organic acid in the two fruits analysed, were 235
very close, indicating that the experimental model was valid. The coefficients of 236
determination (R2) indicated that the model (predicted values) explains between 95 and 237
99% of the variability observed in organic acids contents (experimental values). The 238
standard error of the estimates shown a standard deviation of the residuals between 1.9 and 239
7.6 and the Durbin-Watson statistic tests indicated that, since the p value was greater than 240
0.050 for all the acids, there was no indication of serial autocorrelation in the residuals. 241
ANOVA was used to estimate the statistical significance of the factors that had the 242
greatest effect on the extraction and interactions between them (Table 4). In papaya, the 243
extractant composition and the number of extractions influenced the extraction efficiency 244
of all acids contained in this fruit. Extraction time was statistically significant for oxalic, 245
tartaric, quinic and fumaric acids and extraction temperature for all the acids mentioned 246
previously plus succinic acid. So, neither time nor temperature affected the extraction 247
efficiency of citric acid and L-malic acid from papaya. In pineapple, the extractant 248
composition and the extraction temperature influenced the extraction efficiency of all acids 249
contained in this fruit. The number of extractions was not statistically significant for quinic 250
and succinic acids and time did not affect the extraction of citric acid. Analysis of the 251
experimental results shown that in the majority of cases the most notable effect was caused 252
by the extractant composition (Table 4). So, its contribution was higher than 40% for citric 253
acid, L-malic acid, succinic acid and fumaric acid in papaya and for oxalic acid and quinic 254
acid in pineapple. Among the factors studied, the number of extractions had the second 255
greatest impact on how efficiently organic acids were extracted from papaya (Table 4). It 256
was especially relevant in the extraction of oxalic acid, L-malic acid and fumaric acid, with 257

12
a contribution to the extraction efficiency of 25-30%. However, in pineapple, extraction 258
temperature was the second most important factor (Table 4) for oxalic acid (next to the 259
interaction between the extraction temperature and the extractant composition), citric acid, 260
quinic acid and succinic acid (factor contribution, 17-24%). This fact could indicate that 261
pineapple matrix makes more difficult the extraction of organic acids (mostly stored in the 262
vacuoles of cells) from pineapple than from papaya. 263
Significant equation models (Table 4) were obtained by applying statistical analysis 264
to the organic acid contents of papaya: 265
Oxalic acid = 3.8 + 3.4 · next + 0.085 · % EtOH - 0.13 · text + 0.074 · Text + 0.033 266
· next · text + 0.00056 · text · Text - 0.89 · next2 - 0.0012 · % EtOH2 + 0.0011 · 267
text2 - 0.00062 · Text
2 268
Citric acid = 964 + 578 ·next - 0.44 · % EtOH - 1.7 · next · % EtOH + 0.028 % 269
EtOH · Text 270
Tartaric acid = 163 - 29 ·next - 0.26 · % EtOH + 0.62 · text - 0.58 ·Text - 0.072 · 271
next · % EtOH + 0.12 · next · text + 0.13 ·next · Text - 0.0071 · % EtOH · text - 272
0.0021 · % EtOH · Text - 0.0033 · text · Text + 6.0 · next2 + 0.0066 · % EtOH2 - 273
0.010 · text2 274
L-malic acid = 52 + 109 · next - 0.61 · % EtOH - 0.13 · next · % EtOH + 0.16 · next 275
· text - 0.12 · next · Text + 0.0042 · text · Text - 22 · next2 + 0.0047 · % EtOH2 - 276
0.010 · Text2 277
Quinic acid = 27 - 40 · next + 1.2 · % EtOH - 0.37 · text - 0.061 · Text - 0.13 · next · 278
% EtOH + 0.25 · next · text + 0.19 · next · Text - 0.0046 · % EtOH · text - 0.0034 · 279
% EtOH · Text + 0.0066 · text · Text + 8.6 · next2 - 0.0075 · % EtOH2 280
13
Succinic acid = 1227 + 330 · next - 23 · % EtOH - 8.1 · Text + 3.0 · next · text + 281
0.092 · % EtOH · Text + 0.15 · % EtOH2 282
Fumaric acid = 10 + 2.0 · next - 0.026 · % EtOH + 0.014 · text - 0.089 · Text - 283
0.0094 · next · % EtOH + 0.011 · next · text + 0.0052 · next · Text + 0.00030 · % 284
EtOH · text - 0.00011 · % EtOH · Text - 0.00036 · text · Text - 0.00082 · text2 + 285
0.00067 · Text2 286
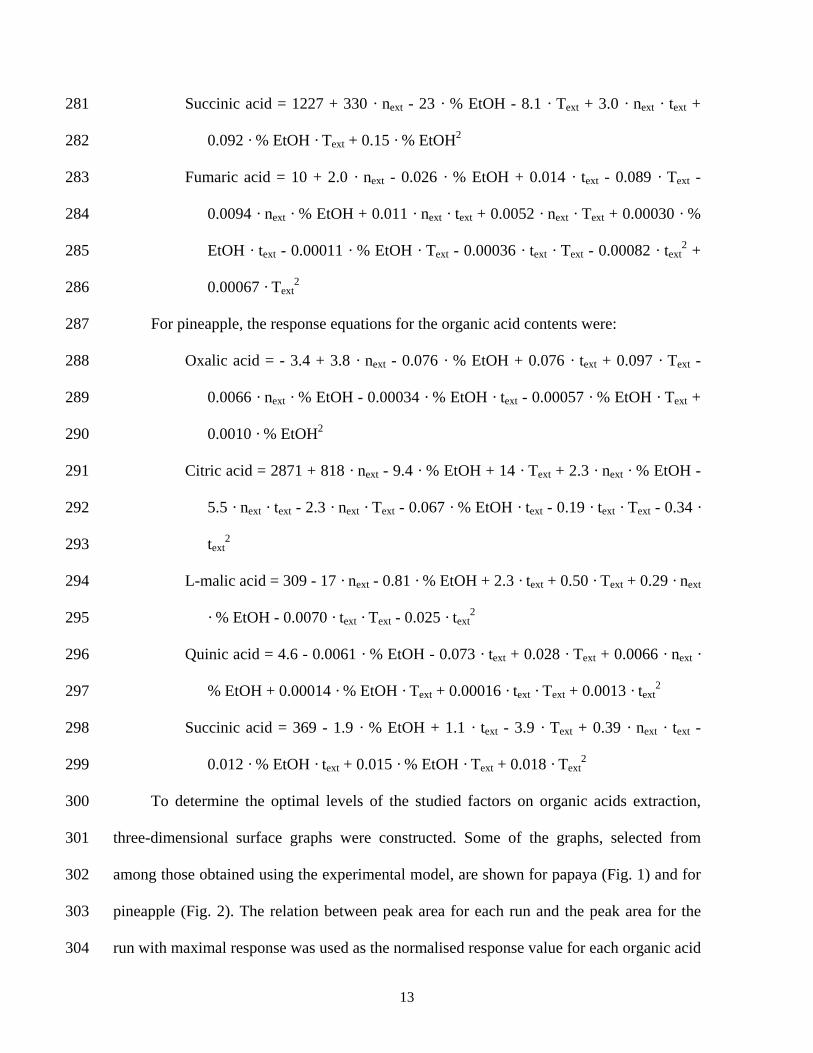
For pineapple, the response equations for the organic acid contents were: 287
Oxalic acid = - 3.4 + 3.8 · next - 0.076 · % EtOH + 0.076 · text + 0.097 · Text - 288
0.0066 · next · % EtOH - 0.00034 · % EtOH · text - 0.00057 · % EtOH · Text + 289
0.0010 · % EtOH2 290
Citric acid = 2871 + 818 · next - 9.4 · % EtOH + 14 · Text + 2.3 · next · % EtOH - 291
5.5 · next · text - 2.3 · next · Text - 0.067 · % EtOH · text - 0.19 · text · Text - 0.34 · 292
text2 293
L-malic acid = 309 - 17 · next - 0.81 · % EtOH + 2.3 · text + 0.50 · Text + 0.29 · next 294
· % EtOH - 0.0070 · text · Text - 0.025 · text2 295
Quinic acid = 4.6 - 0.0061 · % EtOH - 0.073 · text + 0.028 · Text + 0.0066 · next · 296
% EtOH + 0.00014 · % EtOH · Text + 0.00016 · text · Text + 0.0013 · text2 297
Succinic acid = 369 - 1.9 · % EtOH + 1.1 · text - 3.9 · Text + 0.39 · next · text - 298
0.012 · % EtOH · text + 0.015 · % EtOH · Text + 0.018 · Text2 299
To determine the optimal levels of the studied factors on organic acids extraction, 300
three-dimensional surface graphs were constructed. Some of the graphs, selected from 301
among those obtained using the experimental model, are shown for papaya (Fig. 1) and for 302
pineapple (Fig. 2). The relation between peak area for each run and the peak area for the 303
run with maximal response was used as the normalised response value for each organic acid 304

14
as a way to measure the extraction efficiency. In these graphics, the variable with the 305
greatest effect on the extraction, composition of the extractant, is shown along with number 306
of extractions (Fig. 1a and Fig. 2a). The extraction efficiency increased when the 307
percentage of ethanol in the extractant decreased. Thus, the optimum percentage of ethanol 308
in the extractant was 0% (extraction with water). This conclusion is similar for all of the 309
organic acids detected in the fruits except for the extraction of oxalic acid from papaya 310
(Fig. 1a) and for quinic acid from pineapple (Fig. 2a) were the extraction was optimum 311
when the extractant was 50% ethanol (in water) and 100% ethanol, respectively. The 312
number of extractions affected the extraction of organic acids from papaya more than from 313
pineapple. The extraction efficiency improved generally by increasing the number of 314
extractions. This effect was also noticed in Fig. 1b and Fig. 2b which represent extraction 315
temperature versus number of extractions. This fact suggested that 3 was the optimal 316
number of extractions. Extraction temperature versus extraction time is represented in Fig. 317
1c and Fig. 2c. The temperature of the extraction mainly affected pineapple. It can be 318
observed that at a fixed extraction time the optimum extraction efficiency was reached at 319
high extraction temperatures for acids such as oxalic and quinic; however, the highest 320
extraction of citric and succinic acids was obtained with low extraction temperatures. In 321
papaya, the highest extraction was obtained with high extraction temperatures for quinic 322
acid (Fig. 1b and Fig. 1c) and with low extraction temperatures for succinic acid (Fig. 1c). 323
Regarding extraction time, it was clear that in the cases in which it was a significant factor 324
the highest extraction efficiency was reached at high extraction times, so, the optimal 325
extraction time was found to be 60 min. 326

15
3.3. Verification of the model: analysis of organic acids in papaya and pineapple 327
In order to determine all the different acids in the same extract a pragmatic approach 328
must be used when selecting the extraction conditions. Using water as extractant, 3 329
extractions, a temperature of 65 ºC and a time of 60 min, the highest extraction was 330
obtained for the whole acids. In those conditions, the extraction for most of the acids 331
(oxalic, citric, tartaric, L-malic and fumaric acids in papaya or pineapple) was higher than 332
85% (compared to extractions obtained using the optimal conditions for the extraction of 333
each acid); the extraction of succinic acid was 75% from papaya and 85% from pineapple. 334
However, the lower extraction of quinic acid (60% from both types of fruit) was due to the 335
important influence, on the extraction of this acid, of the extractant composition (optimal 336
extraction with a percentage of ethanol in the extractant of 30-60% for papaya and of 100% 337
for pineapple) and of the temperature (optimal extraction at 100 ºC). The differences on the 338
extraction of quinic acid could be related to the chemical structure of this acid since it is the 339
only acid that has an aromatic ring with one carboxylic and four hydroxyl groups. 340
Therefore, the optimal extraction of quinic acids was obtained with 60% of ethanol (in 341
water), at 100 ºC for 60 min and with 3 repetitions of the extraction procedure. In case that 342
quinic acid was determined in the extract obtained to determine all the organic acids (water 343
as extractant, 3 extractions, 65 ºC, 60 min), a more accurate content for quinic acid could be 344
calculated using a correction factor (f = 1.67). This correction was estimated from the 345
equation derived from the experimental design used to optimise quinic acid extraction and 346
it is defined as the ratio between mg quinic acid/100 g obtained in optimal conditions for 347
extracting quinic acid and mg quinic acid/100 g obtained in selected conditions for 348
extracting all the organic acids. 349

16
To determine the accuracy of the extraction method, five independent extractions 350
were carried out using the newly established experimental conditions. The experimental 351
values for organic acids, except for quinic acid, were quite close to the predicted values 352
which proved that the model was valid. Citric acid was the main organic acid in ripe papaya 353
(335 ± 32 mg/100 g FW) and in ripe pineapple (891 ± 15 mg/100 g FW) followed by L-354
malic acid [209 ± 12 (papaya) and 356 ± 8 (pineapple) mg/100 g FW, respectively]. The 355
amounts of these acids found in this study were similar to those found by Cano et al. (1994) 356
for papaya cv. “Sunrise” and by Bartolomé et al. (1996) for pineapple cv. “Red Spanish”. 357
However, lower amounts of citric and L-malic acids were established in papaya (Harvey et 358
al., 1971; González-Aguilar et al., 2003) and in pineapple cv. “Smooth Cayenne” (Cano et 359
al., 1994; Brat et al., 2004; Saradhuldhat et al., 2007). Oxalic, tartaric, quinic, succinic and 360
fumaric acid contents in papaya were: 10 ± 1, 13 ± 2, 52 ± 5, 52 ± 3 and 1.1 ± 0.1 mg/100 g 361
FW, respectively. The corrected value for quinic acid was 87 ± 4 mg/100 g FW. Cano et al. 362
(1994) and González-Aguilar et al. (2003) reported lower quantities of quinic acid. 363
Moreover, Cano et al. (1994) could not detect the presence of tartaric acid in papaya cv. 364
“Sunrise”. In pineapple, oxalic, quinic and succinic acids were quantified as: 8.5 ± 0.8, 4.2 365
± 0.1 (corrected value, 7.0 ± 0.6) and 4.5 ± 0.2 mg/100 g FW, respectively. Bartolomé et al. 366
(1996) described four times less amount of oxalic acid in the same pineapple cultivar 367
analysed in this work and quinic and succinic acids could not be quantified. These 368
discrepancies on organic acid contents described are probably related with the different 369
methods used to extract these compounds from the fruit matrices. 370

17
4. Conclusions 371
Organic acids found in papaya and pineapple can be efficiently extracted using an 372
adequate selection of the experimental conditions optimised in this study. The most 373
important factor among the optimised conditions is the extractant composition, although the 374
number of extractions and the extraction temperature contribute notably to the extraction 375
efficiency from papaya and pineapple, respectively. Optimum values of the variables that 376
influence the extraction of organic acids from these fruits are: 3 extractions, water as 377
extractant, a 60 min extraction time and a 65 ºC extraction temperature. The results of this 378
work confirm the necessity to optimise the solvent extraction as a critical step in the 379
analytical determination of organic acids in tropical fruits such as papaya and pineapple. 380
381
Acknowledgements 382
Y. Hernández wishes to thank Instituto Nacional de Investigación y Tecnología 383
Agraria y Alimentaria (INIA) for the PhD INIA grant. M. Gonzalez would like to thank the 384
INIA for awarding the contract within the framework of the “Recursos y Tecnologías 385
Agrarias del Plan Nacional de Investigación Científica, Desarrollo e Innovación 386
Tecnológica 2000-2003” strategic action, financed with the involvement of the European 387
Social Fund. This research was supported through the I+D+i projects RTA04-171-C2 and 388
PROMINCA (financed by Canary Islands Government and by the European Fund for 389
Regional Development). 390

18
References 391
Avenoza, A., Busto, J. H., Canal, N., & Peregrina, J. M. (2006). Time course of the 392
evolution of malic and lactic acids in the alcoholic and malolactic fermentation of 393
grape must by quantitative 1H NMR (qHNMR) spectroscopy. Journal of Agricultural 394
and Food Chemistry, 54(13), 4715-4720. 395
Bartolomé, A. P., Rupérez, P., & Fúster, C. (1995). Pineapple fruit: morphological 396
characteristics, chemical composition and sensory analysis of Red Spanish and 397
Smooth Cayenne cultivars. Food Chemistry, 53, 75-79. 398
Bartolomé, A. P., Rupérez, P., & Fúster, C. (1996). Non-volatile organic acids, pH and 399
titratable acidity changes in pineapple fruit slices during frozen storage. Journal of 400
the Science of Food and Agriculture, 70, 475-480. 401
Beirao-Da-Costa, S., Steiner, A., Correia, L., Leitao, E., Empis, J., & Moldao-Martins, M. 402
(2008). Influence of moderate heat pre-treatments on physical and chemical 403
characteristics of kiwifruit slices. European Food Research and Technology, 226, 404
641-651. 405
Brat, P., Hoang, L. N. T., Soler, A., Reynes, M., & Brillouet, J. M. (2004). 406
Physicochemical characterization of a new pineapple hybrid (FLHORAN41 Cv.). 407
Journal of Agricultural and Food Chemistry, 52(20), 6170-6177. 408
Cano, M. P., Torija, E., Marín, M. A., & Cámara, M. (1994). A simple ion-exchange 409
chromatographic determination of non-volatile organic acids in some Spanish exotic 410
fruits. Zeitschrift für Lebensmittel-Untersuchung und-Forschung, 199, 214-218. 411
Chan, H. T., Chang, T. S. K., Stafford, A. E., & Brekke, J. E. (1971). Nonvolatile acids of 412
papaya. Journal of Agricultural and Food Chemistry, 19(2), 263-265. 413

19
Chan, H. T., Chenchin, E., & Vonnahme, P. (1973). Nonvolatile acids in pineapple juice. 414
Journal of Agricultural and Food Chemistry, 21(2), 208-211. 415
Chen, J. Y., Zhang, H., & Matsunaga, R. (2006). Rapid determination of the main organic 416
acid composition of raw japanese apricot fruit juices using near-infrared 417
spectroscopy. Journal of Agricultural and Food Chemistry, 54(26), 9652-9657. 418
González-Aguilar, G. A., Buta, J. G., & Wang, C. Y. (2003). Methyl jasmonate and 419
modified atmosphere (MAP) reduce decay and maintain postharvest quality of 420
papaya “Sunrise”. Posharvest Biology and Technology, 28, 361-370. 421
Holcroft, D. M., & Kader, A. A. (1999). Controlled atmosphere-induced changes in pH and 422
organic acid metabolism may affect color of stored strawberry fruit. Postharvest 423
Biology and Technology, 17(1), 19-32. 424
Keutgen, A., & Pawelzik, E. (2007). Modifications of taste-relevant compounds in 425
strawberry fruit under NaCl salinity. Food Chemistry, 105(4), 1487-1494. 426
Kim, M. (2006). Determining citrate in fruit juices using a biosensor with citrate lyase and 427
oxaloacetate decarboxylase in a flow injection analysis system. Food Chemistry, 428
99(4), 851-857. 429
Luque-Pérez, E., Ríos, A., & Valcárcel, M. (1998). Flow-injection spectrophotometric 430
determination of citric acid in beverages based on a photochemical reaction. 431
Analytica Chimica Acta, 366(1-3), 231-240. 432
Marsh, K., Attanayake, S., Walker, S., Gunson, A., Boldingh, H., & MacRae, E. (2004). 433
Acidity and taste in kiwifruit. Postharvest Biology and Technology, 32(2), 159-168. 434
Mato, I., Suárez-Luque, S., & Huidobro, J. F. (2007). Simple determination of main organic 435
acids in grape juice and wine by using capillary zone electrophoresis with direct UV 436
detection. Food Chemistry, 102(1), 104-112. 437

20
Pérez, A. G., Olías, R., Espada, J., Olías, J. M., & Sanz, C. (1997). Rapid determination of 438
sugars, nonvolatile acids, and ascorbic acid in strawberry and other fruits. Journal of 439
Agricultural and Food Chemistry, 45(9), 3545-3549. 440
Saavedra, L., Rupérez, F. J., & Barbas, C. (2001). Capillary electrophoresis for evaluating 441
orange juice authenticity: a study on Spanish oranges. Journal of Agricultural and 442
Food Chemistry, 49(1), 9-13. 443
Saradhuldhat, P., & Paull, R. E. (2007). Pineapple organic acid metabolism and 444
accumulation during fruit development. Scientia Horticulturae, 112, 297-303. 445
Silva, B. M., Andrade, P. B., Mendes, G. C., Seabra, R. M., & Ferreira, M. A. (2002). 446
Study of the organic acids composition of quince (Cydonia oblonga Miller) fruit and 447
jam. Journal of Agricultural and Food Chemistry, 50(8), 2313-2317. 448
Sturm, K., Koron, D., & Stampar, F. (2003). The composition of fruit of different 449
strawberry varieties depending on maturity stage. Food Chemistry, 83(3), 417-422. 450
Usenik, V., Fabcic, J., & Stampar, F. (2008). Sugars, organic acids, phenolic composition 451
and antioxidant activity of sweet cherry (Prunus avium L.). Food Chemistry, 107, 452
185-192. 453

21
Figure captions 454
455
Fig. 1. Estimated response surfaces in the design experiment obtained by plotting (a) the 456
ethanol concentration in the extractant mixture and number of extractions for oxalic 457
(OXA), L-malic (MAL) and succinic (SUC) acids fixing temperature at 65 ºC and time at 458
60 min; (b) extraction temperature and number of extractions for citric (CIT), quinic (QUI) 459
and fumaric (FUM) acids fixing ethanol percentage at 0% and time at 60 min; and (c) 460
extraction temperature and extraction time for tartaric (TAR), quinic (QUI) and succinic 461
(SUC) acids fixing ethanol percentage at 0% and number of extractions at 3, from papaya. 462
463
Fig. 2. Estimated response surfaces in the design experiment obtained by plotting (a) the 464
ethanol concentration in the extractant mixture and number of extractions for oxalic 465
(OXA), citric (CIT) and quinic (QUI) acids fixing temperature at 65 ºC and time at 60 min; 466
(b) extraction temperature and number of extractions for citric (CIT), L-malic (MAL) and 467
quinic (QUI) acids fixing ethanol percentage at 0% and time at 60 min; and (c) extraction 468
temperature and extraction time for oxalic (OXA), L-malic (MAL) and succinic (SUC) 469
acids fixing ethanol percentage at 0% and number of extractions at 3, from pineapple. 470

MAL
nextractions1
23
Ethanol (%)
0 20 60 80 10040
a
Nor
mal
ized
area
(%)
0
20
40
60
80
100
SUC
OXA
Nor
mal
ized
area
(%)
0
20
40
60
80
100
Textraction (ºC)
25 45 85 10565
textraction (min) 0
2040
60QUI
SUC
c
TAR
nextractions1
23
b
Nor
mal
ized
area
(%)
0
20
40
60
80
100
Textraction (ºC)
25 45 85 10565
QUI
FUM
CIT

Nor
mal
ized
area
(%)
0
20
40
60
80
100
Textraction (ºC)
25 45 85 10565textraction (min)
020
4060
c
SUCOXA
MAL
nextractions1
23
Ethanol (%)
0 20 60 80 10040
a
Nor
mal
ized
area
(%)
0
20
40
60
80
100
OXA
CIT
nextractions1
23
b
Nor
mal
ized
area
(%)
0
20
40
60
80
100
Textraction (ºC)
25 45 85 10565
QUI
CIT
MAL
QUI

Table 1
Quality parameters for the chromatographic determination of organic acids
Organic acid Slope Intercept R2 Linear range (mg/l)
Detection limit (mg/l)
RSD (%)
Oxalic 16,145 0.64 0.998 0.5-150 0.002 3.4 Citric 275 0.21 0.997 2.5-2,000 0.20 5.8 Tartaric 274 -0.40 0.997 2.5-2,000 0.20 7.3 Pyruvic 4,426 0.02 0.994 2.5-150 0.01 3.8 L-malic 1,372 0.03 0.999 2.5-1,250 0.05 4.0 Quinic 845 -0.12 0.994 2.5-2,000 0.05 5.2 Succinic 99 0.20 0.997 2.5-2,000 0.50 6.1 Fumaric 21,298 0.01 0.997 0.5-150 0.002 2.5

Table 2
Design matrix for the optimization of the extraction of papaya organic acids, experimental valuesa (EV, mg/100 g FW) obtained for each
identified organic acid and predicted values (PV) for the central composite design (24 + star)
Oxalic acid Citric acid Tartaric acid L-malic acid Quinic acid Succinic acid Fumaric acid Experiment next % EtOH text Text EV PV EV PV EV PV EV PV EV PV EV PV EV PV
1 1 0 60 100 9.5 0.023 8.5 248 0.079 259 11 0.043 11 168 0.025 162 21 0.094 24 29 0.12 29 0.70 0.088 0.76 2 3 50 32.5 62.5 11 0.032 11 308 0.029 295 12 0.23 12 178 0.064 173 46 0.076 42 27 0.15 24 0.98 0.065 0.98 3 3 0 60 100 11 0.048 12 332 0.025 332 14 0.071 14 202 0.026 202 86 0.068 82 49 0.15 49 1.1 0.056 1.1 4 2 50 32.5 62.5 11 0.035 11 319 0.041 299 11 0.096 11 182 0.038 182 29 0.12 25 25 0.18 25 0.90 0.073 0.87 5 2 0 32.5 62.5 9.3 0.064 9.2 250 0.0094 338 13 0.020 13 214 0.025 214 11 0.11 13 63 0.010 57 1.0 0.032 1.1 6 3 0 5 100 7.2 0.090 7.0 322 0.079 335 13 0.073 14 177 0.040 180 23 0.054 27 29 0.15 35 1.4 0.013 1.3 7 3 0 5 25 7.2 0.055 7.4 361 0.057 358 13 0.036 13 202 0.057 202 n.d. -1.0 74 0.0092 68 1.3 0.028 1.3 8 3 100 60 100 11 0.029 10 209 0.038 209 8.8 0.11 9.1 144 0.021 146 27 0.066 30 34 0.11 30 0.75 0.11 0.74 9 3 100 60 25 8.1 0.12 8.0 176 0.056 184 11 0.16 11 147 0.068 145 n.d. 0.67 20 0.28 21 0.91 0.075 0.91 10 2 50 5 62.5 11 0.019 11 294 0.032 311 11 0.021 11 189 0.038 182 14 0.14 17 23 0.055 23 0.86 0.054 0.87 11 3 100 5 25 5.0 0.056 5.4 211 0.044 208 14 0.023 14 145 0.12 151 n.d. -1.8 20 0.21 21 0.80 0.051 0.83 12 1 0 5 100 6.5 0.15 7.2 286 0.046 268 12 0.11 12 156 0.021 158 n.d. -2.3 34 0.19 32 1.0 0.071 1.0 13 1 0 5 25 7.6 0.058 7.3 286 0.073 295 14 0.047 13 163 0.069 162 n.d. -1.8 58 0.13 64 1.0 0.054 1.0 14 1 100 60 100 5.7 0.11 6.1 213 0.11 205 7.8 0.087 7.4 132 0.14 131 n.d. -0.62 18 0.20 22 0.45 0.070 0.47 15 1 50 32.5 62.5 9.1 0.0046 9.1 238 0.045 261 11 0.082 11 142 0.022 146 20 0.037 26 14 0.14 18 0.69 0.020 0.71 16 3 100 5 100 5.7 0.084 5.5 235 0.096 227 13 0.080 13 137 0.010 134 n.d. 0.7 22 0.022 22 0.81 0.090 0.80 17 1 100 5 25 4.3 0.087 4.4 223 0.18 213 16 0.029 16 137 0.042 137 21 0.087 24 30 0.21 29 0.78 0.12 0.76 18 2 50 60 62.5 12 0.077 13 300 0.0026 294 9.0 0.020 8.9 176 0.060 182 33 0.12 32 21 0.17 22 0.74 0.011 0.74 19 2 50 32.5 100 11 0.019 11 280 0.059 288 10 0.046 10 162 0.036 166 32 0.072 31 18 0.23 19 0.89 0.017 0.91 20 1 100 60 25 3.7 0.11 3.3 188 0.035 183 12 0.028 12 115 0.071 113 n.d. -2.0 17 0.099 12 0.73 0.11 0.72 21 3 0 60 25 10 0.071 10 344 0.011 349 14 0.027 14 206 0.051 206 23 0.067 26 70 0.015 75 1.2 0.052 1.2 22 2 50 32.5 62.5 11 0.012 11 313 0.020 299 10 0.095 11 179 0.016 182 27 0.14 25 27 0.23 25 0.89 0.080 0.87 23 1 100 5 100 4.9 0.045 4.8 226 0.088 229 13 0.029 13 137 0.019 137 n.d. -2.3 34 0.044 31 0.66 0.091 0.66 24 2 50 32.5 25 9.8 0.039 9.6 287 0.012 289 12 0.058 12 173 0.062 168 14 0.084 16 30 0.12 31 1.0 0.077 1.0 25 2 100 32.5 62.5 6.8 0.088 6.9 212 0.083 236 11 0.088 12 173 0.054 173 n.d. 0.1 23 0.069 30 0.72 0.039 0.73 26 1 0 60 25 5.6 0.044 6.4 286 0.12 279 13 0.098 13 147 0.085 150 n.d. -2.3 56 0.0030 54 0.72 0.065 0.73
R2 0.977 0.953 0.984 0.982 0.979 0.954 0.993 Standard error of the stimate 4.9 4.8 2.3 2.4 5.0 7.6 1.9
Durbin-Watson statistic 1.5 (p = 0.101) 2.3 (p = 0.215) 1.9 (p = 0.375) 1.8 (p = 0.270) 1.9 (p = 0.422) 2.3 (p = 0.192) 1.8 (p = 0.343)
next, number of extractions; % EtOH, ethanol:water ratio in the extractant; text, extraction time (min); Text, extraction temperature (ºC)
a, experimental values are the mean CV (coefficient of variation) of n =3 determinations
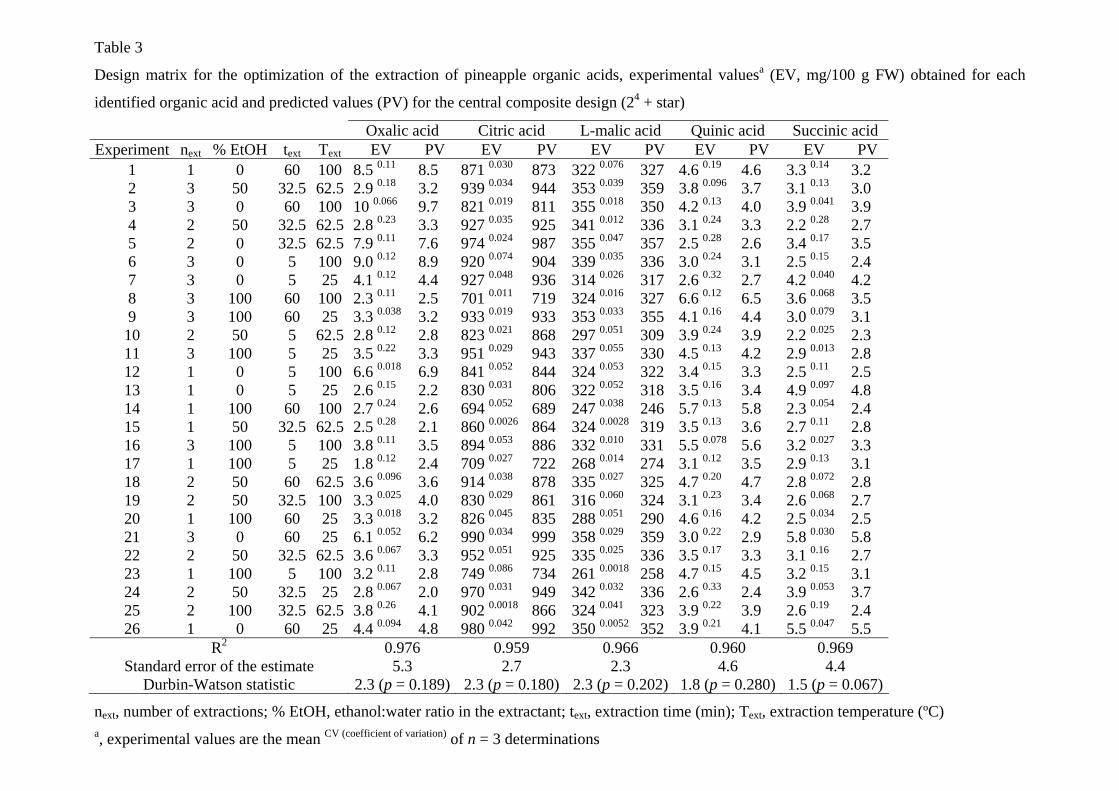
Table 3
Design matrix for the optimization of the extraction of pineapple organic acids, experimental valuesa (EV, mg/100 g FW) obtained for each
identified organic acid and predicted values (PV) for the central composite design (24 + star)
Oxalic acid Citric acid L-malic acid Quinic acid Succinic acid Experiment next % EtOH text Text EV PV EV PV EV PV EV PV EV PV
1 1 0 60 100 8.5 0.11 8.5 871 0.030 873 322 0.076 327 4.6 0.19 4.6 3.3 0.14 3.2 2 3 50 32.5 62.5 2.9 0.18 3.2 939 0.034 944 353 0.039 359 3.8 0.096 3.7 3.1 0.13 3.0 3 3 0 60 100 10 0.066 9.7 821 0.019 811 355 0.018 350 4.2 0.13 4.0 3.9 0.041 3.9 4 2 50 32.5 62.5 2.8 0.23 3.3 927 0.035 925 341 0.012 336 3.1 0.24 3.3 2.2 0.28 2.7 5 2 0 32.5 62.5 7.9 0.11 7.6 974 0.024 987 355 0.047 357 2.5 0.28 2.6 3.4 0.17 3.5 6 3 0 5 100 9.0 0.12 8.9 920 0.074 904 339 0.035 336 3.0 0.24 3.1 2.5 0.15 2.4 7 3 0 5 25 4.1 0.12 4.4 927 0.048 936 314 0.026 317 2.6 0.32 2.7 4.2 0.040 4.2 8 3 100 60 100 2.3 0.11 2.5 701 0.011 719 324 0.016 327 6.6 0.12 6.5 3.6 0.068 3.5 9 3 100 60 25 3.3 0.038 3.2 933 0.019 933 353 0.033 355 4.1 0.16 4.4 3.0 0.079 3.1 10 2 50 5 62.5 2.8 0.12 2.8 823 0.021 868 297 0.051 309 3.9 0.24 3.9 2.2 0.025 2.3 11 3 100 5 25 3.5 0.22 3.3 951 0.029 943 337 0.055 330 4.5 0.13 4.2 2.9 0.013 2.8 12 1 0 5 100 6.6 0.018 6.9 841 0.052 844 324 0.053 322 3.4 0.15 3.3 2.5 0.11 2.5 13 1 0 5 25 2.6 0.15 2.2 830 0.031 806 322 0.052 318 3.5 0.16 3.4 4.9 0.097 4.8 14 1 100 60 100 2.7 0.24 2.6 694 0.052 689 247 0.038 246 5.7 0.13 5.8 2.3 0.054 2.4 15 1 50 32.5 62.5 2.5 0.28 2.1 860 0.0026 864 324 0.0028 319 3.5 0.13 3.6 2.7 0.11 2.8 16 3 100 5 100 3.8 0.11 3.5 894 0.053 886 332 0.010 331 5.5 0.078 5.6 3.2 0.027 3.3 17 1 100 5 25 1.8 0.12 2.4 709 0.027 722 268 0.014 274 3.1 0.12 3.5 2.9 0.13 3.1 18 2 50 60 62.5 3.6 0.096 3.6 914 0.038 878 335 0.027 325 4.7 0.20 4.7 2.8 0.072 2.8 19 2 50 32.5 100 3.3 0.025 4.0 830 0.029 861 316 0.060 324 3.1 0.23 3.4 2.6 0.068 2.7 20 1 100 60 25 3.3 0.018 3.2 826 0.045 835 288 0.051 290 4.6 0.16 4.2 2.5 0.034 2.5 21 3 0 60 25 6.1 0.052 6.2 990 0.034 999 358 0.029 359 3.0 0.22 2.9 5.8 0.030 5.8 22 2 50 32.5 62.5 3.6 0.067 3.3 952 0.051 925 335 0.025 336 3.5 0.17 3.3 3.1 0.16 2.7 23 1 100 5 100 3.2 0.11 2.8 749 0.086 734 261 0.0018 258 4.7 0.15 4.5 3.2 0.15 3.1 24 2 50 32.5 25 2.8 0.067 2.0 970 0.031 949 342 0.032 336 2.6 0.33 2.4 3.9 0.053 3.7 25 2 100 32.5 62.5 3.8 0.26 4.1 902 0.0018 866 324 0.041 323 3.9 0.22 3.9 2.6 0.19 2.4 26 1 0 60 25 4.4 0.094 4.8 980 0.042 992 350 0.0052 352 3.9 0.21 4.1 5.5 0.047 5.5
R2 0.976 0.959 0.966 0.960 0.969 Standard error of the estimate 5.3 2.7 2.3 4.6 4.4
Durbin-Watson statistic 2.3 (p = 0.189) 2.3 (p = 0.180) 2.3 (p = 0.202) 1.8 (p = 0.280) 1.5 (p = 0.067)
next, number of extractions; % EtOH, ethanol:water ratio in the extractant; text, extraction time (min); Text, extraction temperature (ºC) a, experimental values are the mean CV (coefficient of variation) of n = 3 determinations

Table 4
Estimation of the effects and interactions in the central composite design
Papaya acids Pineapple acids Extraction factor Oxalic Citric Tartaric L-malic Quinic Succinic Fumaric Oxalic Citric L-malic Quinic Succinic next F ratio 62 17 17 121 62 5.0 472 18 40 104 0.01 4.2 p valuea 0.000 0.002 0.002 0.000 0.000 0.046 0.000 0.002 0.000 0.000 0.920 0.065 % EtOH F ratio 64 152 44 287 41 106 743 196 51 75 86 84 p valuea 0.000 0.000 0.000 0.000 0.000 0.000 0.000 0.000 0.000 0.000 0.000 0.000 text F ratio 48 4.2 141 0.09 52 0.14 119 9.0 0.38 16 29 14 p valuea 0.000 0.066 0.000 0.773 0.000 0.715 0.000 0.012 0.551 0.002 0.000 0.003 Text F ratio 17 0.00 117 1.2 53 20 69 62 50 11 49 65 p valuea 0.002 1.000 0.000 0.302 0.000 0.001 0.000 0.000 0.000 0.007 0.000 0.000 next · % EtOH F ratio 2.7 16 16 24 37 4.5 62 6.4 11 49 19 2.2 p valuea 0.129 0.002 0.002 0.001 0.000 0.058 0.000 0.029 0.006 0.000 0.001 0.164 next · text F ratio 35 0.13 15 12 42 8.9 22 2.5 20 0.76 2.2 11 p valuea 0.000 0.725 0.003 0.006 0.000 0.013 0.001 0.145 0.001 0.401 0.170 0.007 next · Text F ratio 0.26 0.02 31 10 43 0.07 11 0.11 6.8 4.8 2.5 3.4 p valuea 0.618 0.880 0.000 0.008 0.000 0.796 0.007 0.746 0.024 0.051 0.143 0.094
% EtOH · text F ratio 0.01 0.77 117 3.9 34 1.4 39 12 7.8 4.8 0.00 28 p valuea 0.920 0.399 0.000 0.073 0.000 0.259 0.000 0.005 0.017 0.051 0.958 0.000 % EtOH · Text F ratio 0.67 5.9 18 0.88 36 38 9.4 63 0.87 4.8 11 82 p valuea 0.429 0.034 0.001 0.368 0.000 0.000 0.011 0.000 0.371 0.051 0.009 0.000 text · Text F ratio 15 0.13 15 9.2 41 1.8 36 3.4 33 12 5.0 0.12 p valuea 0.003 0.725 0.003 0.012 0.000 0.213 0.000 0.091 0.000 0.005 0.047 0.737 next
2 F ratio 5.6 4.0 9.5 48 10 1.2 69 3.8 1.2 0.28 3.8 1.4
p valuea 0.037 0.071 0.010 0.000 0.009 0.303 0.203 0.078 0.298 0.605 0.078 0.266 % EtOH2 F ratio 63 1.4 53 14 51 28 1.5 56 1.0 0.78 0.10 3.0 p valuea 0.000 0.266 0.000 0.003 0.000 0.000 0.253 0.000 0.340 0.396 0.756 0.113 text
2 F ratio 4.9 0.10 13 0.01 0.05 0.43 15 0.33 10 13 28 1.1
p valuea 0.048 0.758 0.004 0.928 0.833 0.525 0.002 0.577 0.009 0.004 0.000 0.325 Text
2 F ratio 5.6 1.0 1.8 21 0.49 0.00 35 0.77 1.2 1.5 4.3 10
p valuea 0.037 0.336 0.208 0.001 0.500 0.984 0.000 0.398 0.298 0.250 0.064 0.009
next, number of extractions; % EtOH, ethanol:water ratio in the extractant; text, extraction time (min); Text, extraction temperature (ºC) a, bold numbers denote significant effects or interactions of the extraction method at a 95% confidence level