organic bee pollen - nutritional value, antioxidant activity & microbiological quality
TRANSCRIPT
Molecules 2012, 17, 8359-8377; doi:10.3390/molecules17078359
molecules ISSN 1420-3049
www.mdpi.com/journal/molecules
Article
Organic Bee Pollen: Botanical Origin, Nutritional Value, Bioactive Compounds, Antioxidant Activity and Microbiological Quality
Xesús Feás 1,*, M. Pilar Vázquez-Tato 1, Leticia Estevinho 2, Julio A. Seijas 1
and Antonio Iglesias 3
1 Department of Organic Chemistry, Faculty of Science, University of Santiago de Compostela,
E-27080, Lugo, Spain; E-Mails: [email protected] (M.P.V.-T.); [email protected] (J.A.S.) 2 CIMO-Mountain Research Center, Agricultural College of Bragança, Polytechnic Institute of Bragança,
Campus Santa Apolónia, E-5301-855, Bragança, Portugal; E-Mail: [email protected] 3 Department of Anatomy and Animal Production, Faculty of Veterinary Medicine, University of
Santiago de Compostela, E-27002, Lugo, Galicia, Spain; E-Mail:[email protected]
* Author to whom correspondence should be addressed; E-Mail: [email protected];
Tel.: +34-982-285-900; Fax: +34-982-285-872.
Received: 17 May 2012; in revised form: 29 June 2012 / Accepted: 2 July 2012 /
Published: 11 July 2012
Abstract: Organic bee pollen (BP, n = 22) harvested from the Douro International Natural
Park (DINP, Portugal) was studied. Nine botanical families were found in the mixture of
the samples. The water activity and pH ranged 0.21–0.37 and 4.3–5.2, respectively. The BP
analyses averaged 67.7% carbohydrates, 21.8% crude protein, 5.2% crude fat and 2.9% ash.
The energy ranged from 396.4 to 411.1 kcal/100 g. The principal fatty acid found was
linolenic, followed by linoleic acid, palmitic acid and oleic acid. The phenolic and flavonoid
contents varied from 12.9 to 19.8 mg of gallic acid equivalents/g of extract and from 4.5 to
7.1 mg of catechin equivalents/g of extract, respectively. The scavenger activity and β-carotene
bleaching assays values (EC50) were 3.0 ± 0.7 mg/mL and 4.6 mg/mL ± 0.9 mg/mL,
respectively. E. coli, sulphite-reducing Clostridia, Salmonella and S. aureus were not
found. Since there are studies indicating appreciable differences among BPs from different
regions, the full characterization of BP from diverse origins still appears to be a sound
research priority in order to obtain reliable data about this beehive product.
OPEN ACCESS
Molecules 2012, 17 8360
Keywords: bee pollen; antioxidant capacity; bioactive compound; fatty acids;
microbiological safety; organic food
1. Introduction
Bee honey has been used by man since the beginning of Humanity. Although this is the most
common beehive product, there are other products, such as bee pollen (BP), royal jelly, propolis and
beeswax. These natural goods are well appreciated by consumers due to the high number of quality
checks they go through, as well as for their dietetic and therapeutic qualities.
BP is the result of the agglutination of flower pollens; it is made by worker honey bees with nectar
and salivary substances and stored at the hive entrance [1]. The collection of BP is a relatively recent
development, dependent primarily on the basic concept of scraping pollen off of the bees’ legs as they
enter the hive. When analyzing and studying the nutritional and therapeutic properties of BP, modern
science has made it possible to specify its valuable antimicrobial [2], antifungal [3], antioxidant [4],
anti-radiation [5], hepatoprotective [6], chemopreventive [7], anticancer [8] and antiinflammatory
activities [9].
The major components of BP are carbohydrates, crude fibers, proteins and lipids at proportions
ranging between 13 and 55%, 0.3 and 20%, 10 and 40%, 1 and 10%, respectively. Other minor
components are minerals and trace elements, vitamins and carotenoids, phenolic compounds,
flavonoids, sterols and terpenes [10]. In fact, BP is referred to as the “only perfectly complete food”, as
it contains all the essential amino acids needed for the human organism. However, the composition of
BP depends strongly on the plant source and geographic origin, together with other factors such as
climatic conditions, soil type, and beekeeper activities.
Apiculture is valuable in social, environmental and economic terms and the conservation and
preservation of this practice is essential. The quality and diversity of Portuguese’s landscape should be
considered a valuable and supporting resource for apiculture to achieve international prominence and
competitiveness. Nowadays, honey represents the most highly valued product, since Portugal further
regulates the registration of honey (9 of 18), bearing the European Protected Designation of Origin
(PDO) [11,12]. However, the collection of BP, which as a high quality product and used to be
appreciated, currently suffers from marketing problems because there is a large sector of the public
who are misinformed about its properties.
Presently, in the Portuguese continental territory there are 29 Special Protected Areas and 60 Sites
of Community Importance classified according to the Council Directive 92/43/EEC which deals with
the conservation of natural habitats and wild fauna and flora that are considered to be threatened in the
European Union [13]. The management of such areas must be ecological, economical and socially
sustainable; which makes apiculture one of the most promising activities to develop.
Organic apiculture is an ecologically based system, which encourages the use of good agricultural
practices to maintain the balance and diversity of the agricultural ecosystem, and also promotes the
sustainable use of natural resources, environmental quality, animal welfare and human health [14].
Organic beehive products are free from many problems, such as pollution fallout and chemical
Molecules 2012, 17 8361
residues. Moreover, the use of the beehive products for therapeutic purposes demands it be harvested
in areas with no organic contamination sources [15]. Today, concerns about traces of numerous toxic
substances have prompted some demand for beehive products that are certified as organic [16].
However full characterization of BP is scarce and there is a lack of information about the
characteristics of the product certified as organic [17].
The present study aims to characterize, for the first time, organic AP with respect to: (i) floral origin;
(ii) physico-chemical (water activity and pH), nutritional (ash, protein, fat and carbohydrate) and
energy value; (iii) fatty acid profile; (iv) bioactive compounds (phenolics and flavonoids); (v) antioxidant
activity; and (vi) microbial safety (aerobic mesophiles, moulds and yeasts, fecal coliforms, Escherichia
coli, sulphite-reducing Clostridia, Salmonella and Staphylococcus aureus).
2. Results and Discussion
2.1. Palynological Identification
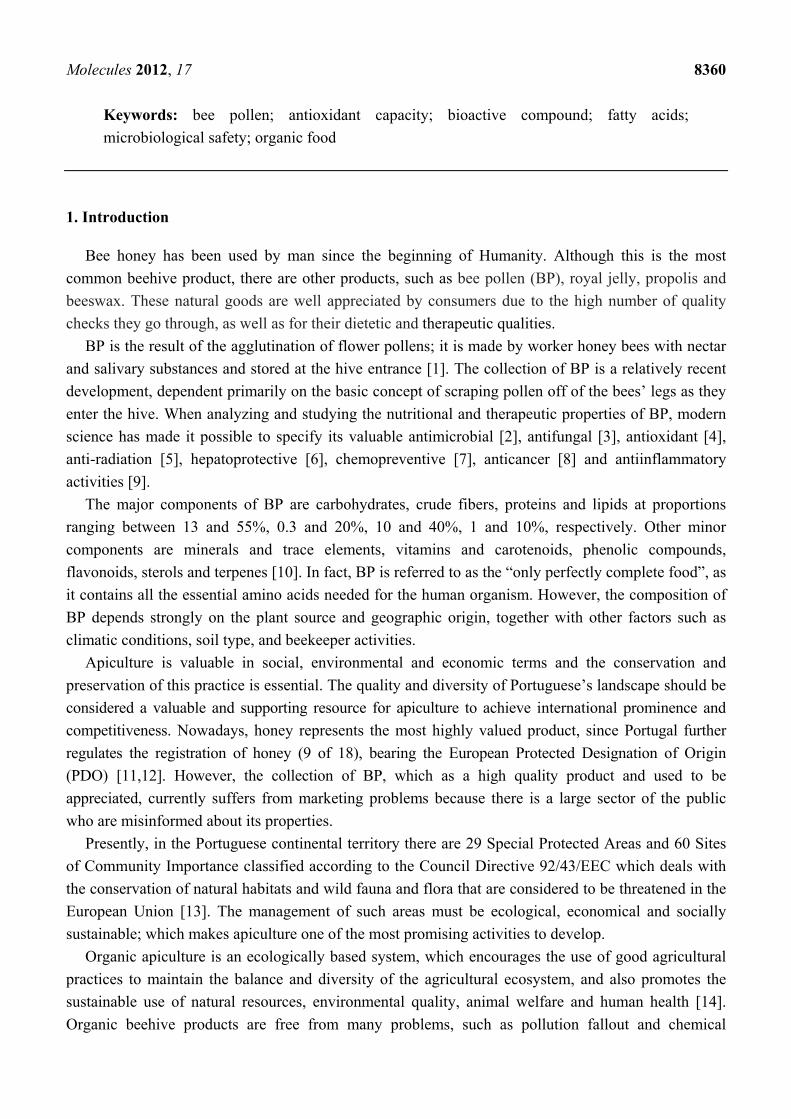
The BP profile analysis results allow us to determinate its floral origin. Table 1 shows the frequency
of occurrence, range and mean values of the 11 pollen types identified in the 23 samples. The BP
analyzed have between three (samples 3 and 4) and seven (sample 13) pollen types; the mean number
is 4.8 with a SD of 1.0. Nine families of PL were found in the BP mixture of: Cistaceae,
Boraginaceae, Rosaceae, Fagaceae, Asteraceae, Fabaceae, Ericaceae, Mimosaceae and Myrtaceae.
None of the botanical families is represented in all the samples studied, since PL can vary according to
the region where they are offered, a factor that depends on the available surrounding bee pasture in the
apiary vegetation.
Table 1. Frequency classes (presence, range and mean ± SD) of the pollen types in the
organic apian pollen.
Family Pollen type Found (n a) Frequency (%) Range (%) Mean ± SD b (%) Cistaceae Cistus 17 77.3 5.2–90.6 44.0 ± 30.0
Boraginaceae Echium 16 72.7 24.5–60.5 24.5 ± 18.7 Rosaceae Prunus 12 54.5 0.8–10.3 5.8 ± 2.7 Fagaceae Castanea 11 50.0 1.2–65.8 23.6 ± 22.6 Asteraceae Leontodon 10 45.5 3.2–49.5 21.6 ± 12.3 Fabaceae Trifollium 10 45.5 4.4–45.6 13.3 ± 12.3 Ericaceae Erica 8 36.4 6.4–68.0 32.7 ± 24.4 Fagaceae Quercus 7 31.8 1.2–16.0 8.3 ± 4.9
Mimosaceae Mimosa 7 31.8 1.2–11.2 5.3 ± 3.6 Myrtaceae Eucalyptus 4 18.2 1.3–5.6 3.2 ± 1.8 Rosaceae Rubus 3 13.6 2.1–5.6 4.0 ± 1.8
a sample size; b SD = standard deviation.
Molecules 2012, 17 8362
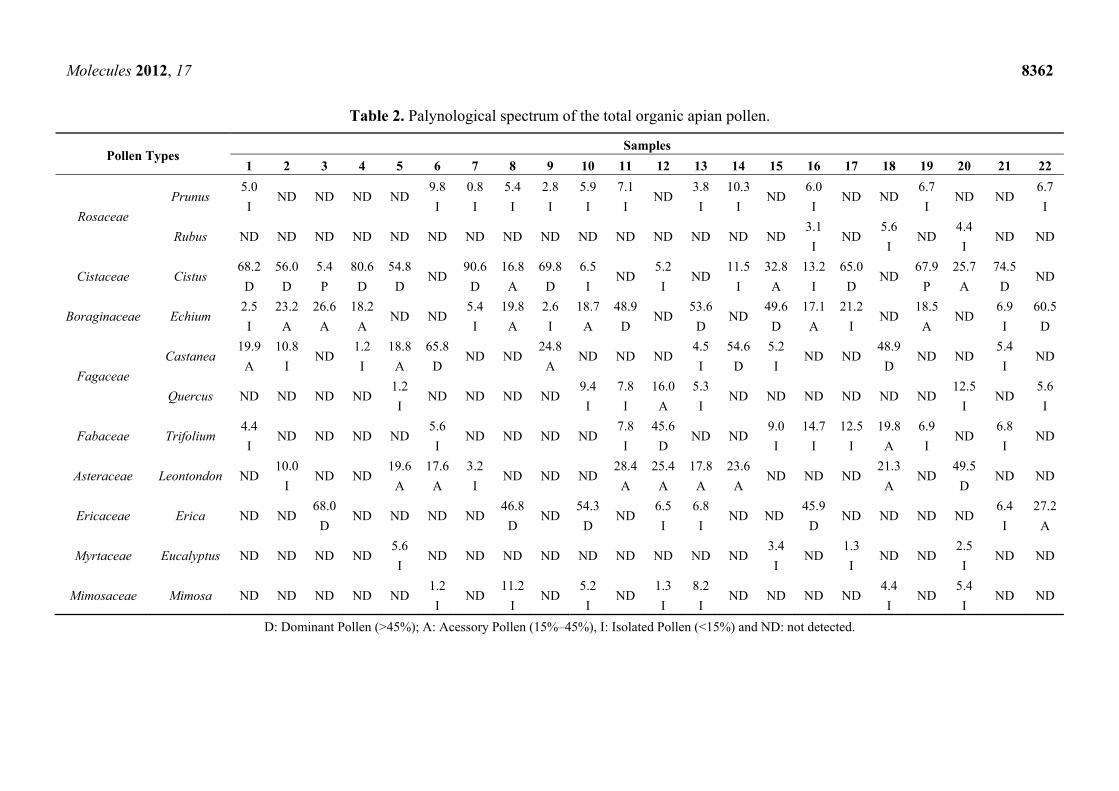
Table 2. Palynological spectrum of the total organic apian pollen.
Pollen Types Samples
1 2 3 4 5 6 7 8 9 10 11 12 13 14 15 16 17 18 19 20 21 22
Rosaceae
Prunus 5.0
I ND ND ND ND
9.8
I
0.8
I
5.4
I
2.8
I
5.9
I
7.1
I ND
3.8
I
10.3
I ND
6.0
I ND ND
6.7
I ND ND
6.7
I
Rubus ND ND ND ND ND ND ND ND ND ND ND ND ND ND ND 3.1
I ND
5.6
I ND
4.4
I ND ND
Cistaceae Cistus 68.2
D
56.0
D
5.4
P
80.6
D
54.8
D ND
90.6
D
16.8
A
69.8
D
6.5
I ND
5.2
I ND
11.5
I
32.8
A
13.2
I
65.0
D ND
67.9
P
25.7
A
74.5
D ND
Boraginaceae Echium 2.5
I
23.2
A
26.6
A
18.2
A ND ND
5.4
I
19.8
A
2.6
I
18.7
A
48.9
D ND
53.6
D ND
49.6
D
17.1
A
21.2
I ND
18.5
A ND
6.9
I
60.5
D
Fagaceae
Castanea 19.9
A
10.8
I ND
1.2
I
18.8
A
65.8
D ND ND
24.8
A ND ND ND
4.5
I
54.6
D
5.2
I ND ND
48.9
D ND ND
5.4
I ND
Quercus ND ND ND ND 1.2
I ND ND ND ND
9.4
I
7.8
I
16.0
A
5.3
I ND ND ND ND ND ND
12.5
I ND
5.6
I
Fabaceae Trifolium 4.4
I ND ND ND ND
5.6
I ND ND ND ND
7.8
I
45.6
D ND ND
9.0
I
14.7
I
12.5
I
19.8
A
6.9
I ND
6.8
I ND
Asteraceae Leontondon ND 10.0
I ND ND
19.6
A
17.6
A
3.2
I ND ND ND
28.4
A
25.4
A
17.8
A
23.6
A ND ND ND
21.3
A ND
49.5
D ND ND
Ericaceae Erica ND ND 68.0
D ND ND ND ND
46.8
D ND
54.3
D ND
6.5
I
6.8
I ND ND
45.9
D ND ND ND ND
6.4
I
27.2
A
Myrtaceae Eucalyptus ND ND ND ND 5.6
I ND ND ND ND ND ND ND ND ND
3.4
I ND
1.3
I ND ND
2.5
I ND ND
Mimosaceae Mimosa ND ND ND ND ND 1.2
I ND
11.2
I ND
5.2
I ND
1.3
I
8.2
I ND ND ND ND
4.4
I ND
5.4
I ND ND
D: Dominant Pollen (>45%); A: Acessory Pollen (15%–45%), I: Isolated Pollen (<15%) and ND: not detected.
Molecules 2012, 17 8363
A full spectrum analysis of the total BP is given in Table 2. On the basis of palynological analysis,
most of the samples were found to be heterofloral, due to their different colours and consequently
different pollen types. However, in two samples the occurrence of over 80% of Cistus pollen type
(samples 4 and 7) characterized them as unifloral. From the economical standpoint, the assessment of a
monofloral origin may increase the commercial value of these BPs. In fact, it has been reported that
bee pollen from Cistus sp. has anabolic and stimulatory effects on bone components in rats in vitro and
in vivo [18–20], a potent anti-inflammatory activity [9], antiallergic action [21] and high antioxidative
and scavenging abilities [22,23].
Bees forage different plants; thus, BP is always a mixture of different sources. However, in food
control, pollen analysis is very efficient for the differentiation of BP produced in distinctly different
geographical and climatic areas, as well as to ascertain the monofloral origin of BP obtained from
intensively cultivated crops.
Moreover, palynology also allows scientists to infer the vegetation present in an area, and to date
and ascertain any biodiversity changes, as for example the presence and distribution of invasive and/or
exotic plants. Results showed that BP from the DINP contained Mimosa and Eucalyptus pollen types,
found in 7 and 4 samples, respectively.
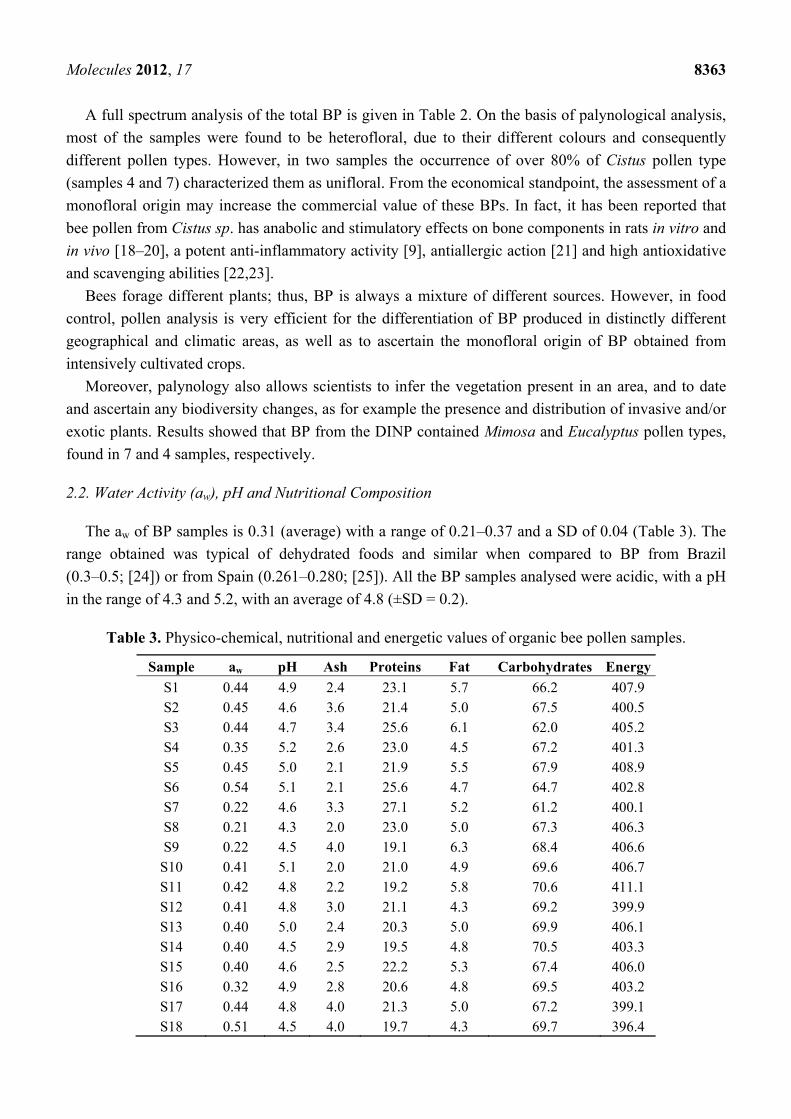
2.2. Water Activity (aw), pH and Nutritional Composition
The aw of BP samples is 0.31 (average) with a range of 0.21–0.37 and a SD of 0.04 (Table 3). The
range obtained was typical of dehydrated foods and similar when compared to BP from Brazil
(0.3–0.5; [24]) or from Spain (0.261–0.280; [25]). All the BP samples analysed were acidic, with a pH
in the range of 4.3 and 5.2, with an average of 4.8 (±SD = 0.2).
Table 3. Physico-chemical, nutritional and energetic values of organic bee pollen samples.
Sample aw pH Ash Proteins Fat Carbohydrates Energy
S1 0.44 4.9 2.4 23.1 5.7 66.2 407.9 S2 0.45 4.6 3.6 21.4 5.0 67.5 400.5 S3 0.44 4.7 3.4 25.6 6.1 62.0 405.2 S4 0.35 5.2 2.6 23.0 4.5 67.2 401.3 S5 0.45 5.0 2.1 21.9 5.5 67.9 408.9 S6 0.54 5.1 2.1 25.6 4.7 64.7 402.8 S7 0.22 4.6 3.3 27.1 5.2 61.2 400.1 S8 0.21 4.3 2.0 23.0 5.0 67.3 406.3 S9 0.22 4.5 4.0 19.1 6.3 68.4 406.6
S10 0.41 5.1 2.0 21.0 4.9 69.6 406.7 S11 0.42 4.8 2.2 19.2 5.8 70.6 411.1 S12 0.41 4.8 3.0 21.1 4.3 69.2 399.9 S13 0.40 5.0 2.4 20.3 5.0 69.9 406.1 S14 0.40 4.5 2.9 19.5 4.8 70.5 403.3 S15 0.40 4.6 2.5 22.2 5.3 67.4 406.0 S16 0.32 4.9 2.8 20.6 4.8 69.5 403.2 S17 0.44 4.8 4.0 21.3 5.0 67.2 399.1 S18 0.51 4.5 4.0 19.7 4.3 69.7 396.4
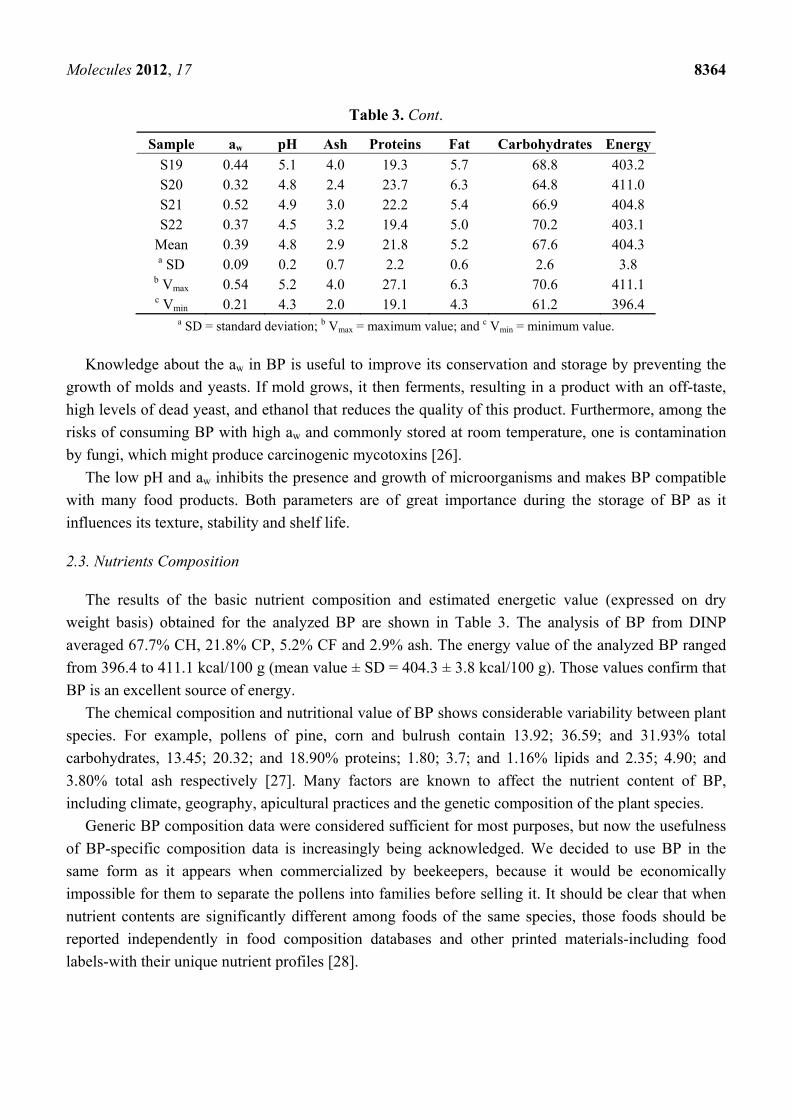
Molecules 2012, 17 8364
Table 3. Cont.
Sample aw pH Ash Proteins Fat Carbohydrates Energy
S19 0.44 5.1 4.0 19.3 5.7 68.8 403.2 S20 0.32 4.8 2.4 23.7 6.3 64.8 411.0 S21 0.52 4.9 3.0 22.2 5.4 66.9 404.8 S22 0.37 4.5 3.2 19.4 5.0 70.2 403.1
Mean 0.39 4.8 2.9 21.8 5.2 67.6 404.3 a SD 0.09 0.2 0.7 2.2 0.6 2.6 3.8
b Vmax 0.54 5.2 4.0 27.1 6.3 70.6 411.1 c Vmin 0.21 4.3 2.0 19.1 4.3 61.2 396.4
a SD = standard deviation; b Vmax = maximum value; and c Vmin = minimum value.
Knowledge about the aw in BP is useful to improve its conservation and storage by preventing the
growth of molds and yeasts. If mold grows, it then ferments, resulting in a product with an off-taste,
high levels of dead yeast, and ethanol that reduces the quality of this product. Furthermore, among the
risks of consuming BP with high aw and commonly stored at room temperature, one is contamination
by fungi, which might produce carcinogenic mycotoxins [26].
The low pH and aw inhibits the presence and growth of microorganisms and makes BP compatible
with many food products. Both parameters are of great importance during the storage of BP as it
influences its texture, stability and shelf life.
2.3. Nutrients Composition
The results of the basic nutrient composition and estimated energetic value (expressed on dry
weight basis) obtained for the analyzed BP are shown in Table 3. The analysis of BP from DINP
averaged 67.7% CH, 21.8% CP, 5.2% CF and 2.9% ash. The energy value of the analyzed BP ranged
from 396.4 to 411.1 kcal/100 g (mean value ± SD = 404.3 ± 3.8 kcal/100 g). Those values confirm that
BP is an excellent source of energy.
The chemical composition and nutritional value of BP shows considerable variability between plant
species. For example, pollens of pine, corn and bulrush contain 13.92; 36.59; and 31.93% total
carbohydrates, 13.45; 20.32; and 18.90% proteins; 1.80; 3.7; and 1.16% lipids and 2.35; 4.90; and
3.80% total ash respectively [27]. Many factors are known to affect the nutrient content of BP,
including climate, geography, apicultural practices and the genetic composition of the plant species.
Generic BP composition data were considered sufficient for most purposes, but now the usefulness
of BP-specific composition data is increasingly being acknowledged. We decided to use BP in the
same form as it appears when commercialized by beekeepers, because it would be economically
impossible for them to separate the pollens into families before selling it. It should be clear that when
nutrient contents are significantly different among foods of the same species, those foods should be
reported independently in food composition databases and other printed materials-including food
labels-with their unique nutrient profiles [28].
Molecules 2012, 17 8365
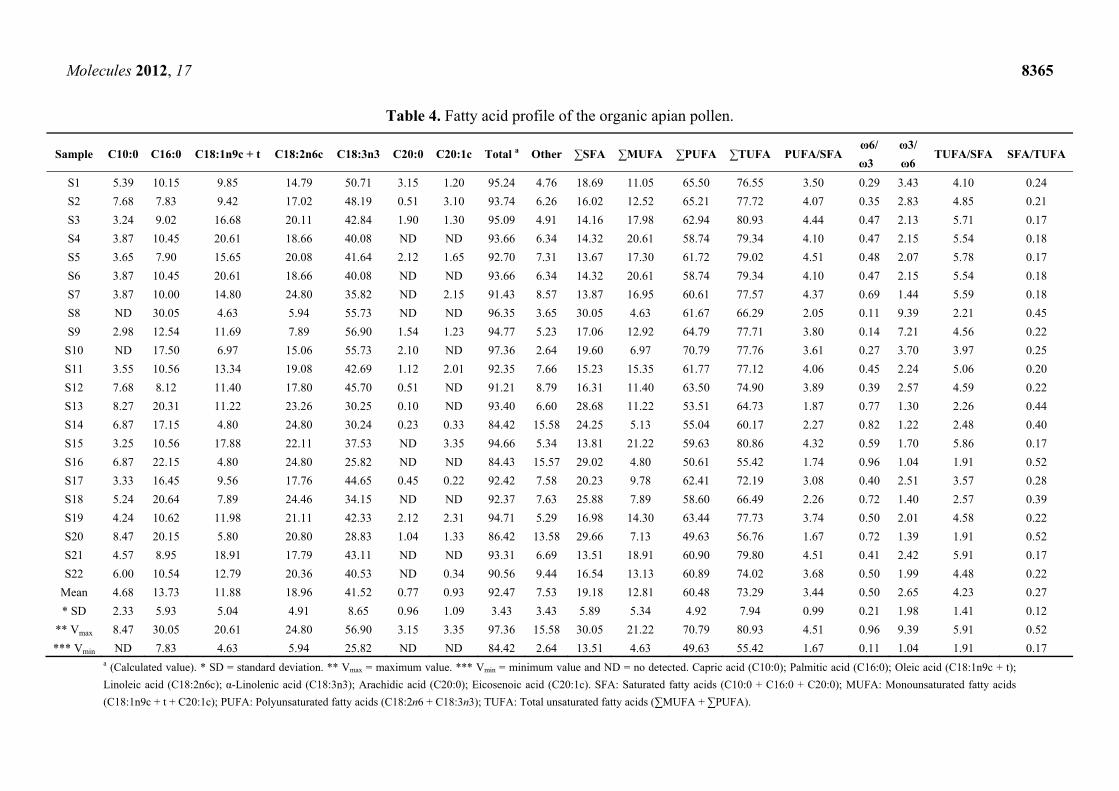
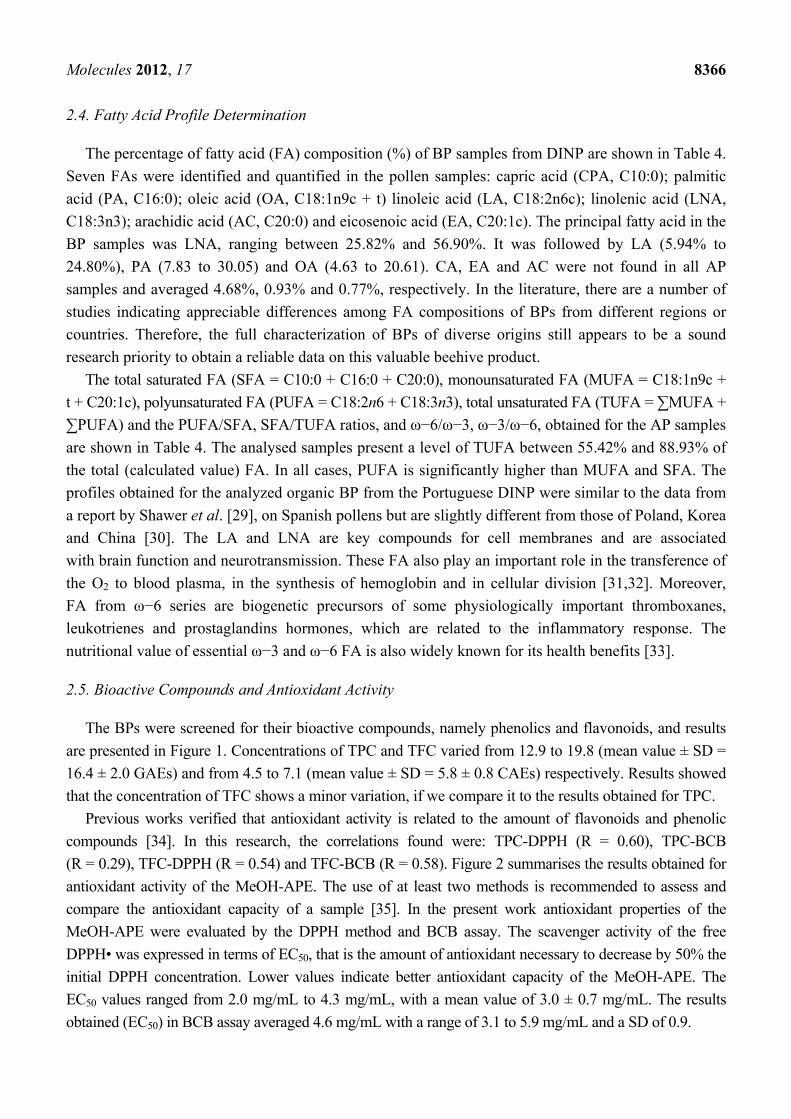
Table 4. Fatty acid profile of the organic apian pollen.
Sample C10:0 C16:0 C18:1n9c + t C18:2n6c C18:3n3 C20:0 C20:1c Total a Other ∑SFA ∑MUFA ∑PUFA ∑TUFA PUFA/SFA ω6/
ω3
ω3/
ω6 TUFA/SFA SFA/TUFA
S1 5.39 10.15 9.85 14.79 50.71 3.15 1.20 95.24 4.76 18.69 11.05 65.50 76.55 3.50 0.29 3.43 4.10 0.24
S2 7.68 7.83 9.42 17.02 48.19 0.51 3.10 93.74 6.26 16.02 12.52 65.21 77.72 4.07 0.35 2.83 4.85 0.21
S3 3.24 9.02 16.68 20.11 42.84 1.90 1.30 95.09 4.91 14.16 17.98 62.94 80.93 4.44 0.47 2.13 5.71 0.17
S4 3.87 10.45 20.61 18.66 40.08 ND ND 93.66 6.34 14.32 20.61 58.74 79.34 4.10 0.47 2.15 5.54 0.18
S5 3.65 7.90 15.65 20.08 41.64 2.12 1.65 92.70 7.31 13.67 17.30 61.72 79.02 4.51 0.48 2.07 5.78 0.17
S6 3.87 10.45 20.61 18.66 40.08 ND ND 93.66 6.34 14.32 20.61 58.74 79.34 4.10 0.47 2.15 5.54 0.18
S7 3.87 10.00 14.80 24.80 35.82 ND 2.15 91.43 8.57 13.87 16.95 60.61 77.57 4.37 0.69 1.44 5.59 0.18
S8 ND 30.05 4.63 5.94 55.73 ND ND 96.35 3.65 30.05 4.63 61.67 66.29 2.05 0.11 9.39 2.21 0.45
S9 2.98 12.54 11.69 7.89 56.90 1.54 1.23 94.77 5.23 17.06 12.92 64.79 77.71 3.80 0.14 7.21 4.56 0.22
S10 ND 17.50 6.97 15.06 55.73 2.10 ND 97.36 2.64 19.60 6.97 70.79 77.76 3.61 0.27 3.70 3.97 0.25
S11 3.55 10.56 13.34 19.08 42.69 1.12 2.01 92.35 7.66 15.23 15.35 61.77 77.12 4.06 0.45 2.24 5.06 0.20
S12 7.68 8.12 11.40 17.80 45.70 0.51 ND 91.21 8.79 16.31 11.40 63.50 74.90 3.89 0.39 2.57 4.59 0.22
S13 8.27 20.31 11.22 23.26 30.25 0.10 ND 93.40 6.60 28.68 11.22 53.51 64.73 1.87 0.77 1.30 2.26 0.44
S14 6.87 17.15 4.80 24.80 30.24 0.23 0.33 84.42 15.58 24.25 5.13 55.04 60.17 2.27 0.82 1.22 2.48 0.40
S15 3.25 10.56 17.88 22.11 37.53 ND 3.35 94.66 5.34 13.81 21.22 59.63 80.86 4.32 0.59 1.70 5.86 0.17
S16 6.87 22.15 4.80 24.80 25.82 ND ND 84.43 15.57 29.02 4.80 50.61 55.42 1.74 0.96 1.04 1.91 0.52
S17 3.33 16.45 9.56 17.76 44.65 0.45 0.22 92.42 7.58 20.23 9.78 62.41 72.19 3.08 0.40 2.51 3.57 0.28
S18 5.24 20.64 7.89 24.46 34.15 ND ND 92.37 7.63 25.88 7.89 58.60 66.49 2.26 0.72 1.40 2.57 0.39
S19 4.24 10.62 11.98 21.11 42.33 2.12 2.31 94.71 5.29 16.98 14.30 63.44 77.73 3.74 0.50 2.01 4.58 0.22
S20 8.47 20.15 5.80 20.80 28.83 1.04 1.33 86.42 13.58 29.66 7.13 49.63 56.76 1.67 0.72 1.39 1.91 0.52
S21 4.57 8.95 18.91 17.79 43.11 ND ND 93.31 6.69 13.51 18.91 60.90 79.80 4.51 0.41 2.42 5.91 0.17
S22 6.00 10.54 12.79 20.36 40.53 ND 0.34 90.56 9.44 16.54 13.13 60.89 74.02 3.68 0.50 1.99 4.48 0.22
Mean 4.68 13.73 11.88 18.96 41.52 0.77 0.93 92.47 7.53 19.18 12.81 60.48 73.29 3.44 0.50 2.65 4.23 0.27
* SD 2.33 5.93 5.04 4.91 8.65 0.96 1.09 3.43 3.43 5.89 5.34 4.92 7.94 0.99 0.21 1.98 1.41 0.12
** Vmax 8.47 30.05 20.61 24.80 56.90 3.15 3.35 97.36 15.58 30.05 21.22 70.79 80.93 4.51 0.96 9.39 5.91 0.52
*** Vmin ND 7.83 4.63 5.94 25.82 ND ND 84.42 2.64 13.51 4.63 49.63 55.42 1.67 0.11 1.04 1.91 0.17 a (Calculated value). * SD = standard deviation. ** Vmax = maximum value. *** Vmin = minimum value and ND = no detected. Capric acid (C10:0); Palmitic acid (C16:0); Oleic acid (C18:1n9c + t);
Linoleic acid (C18:2n6c); α-Linolenic acid (C18:3n3); Arachidic acid (C20:0); Eicosenoic acid (C20:1c). SFA: Saturated fatty acids (C10:0 + C16:0 + C20:0); MUFA: Monounsaturated fatty acids
(C18:1n9c + t + C20:1c); PUFA: Polyunsaturated fatty acids (C18:2n6 + C18:3n3); TUFA: Total unsaturated fatty acids (∑MUFA + ∑PUFA).
Molecules 2012, 17 8366
2.4. Fatty Acid Profile Determination
The percentage of fatty acid (FA) composition (%) of BP samples from DINP are shown in Table 4.
Seven FAs were identified and quantified in the pollen samples: capric acid (CPA, C10:0); palmitic
acid (PA, C16:0); oleic acid (OA, C18:1n9c + t) linoleic acid (LA, C18:2n6c); linolenic acid (LNA,
C18:3n3); arachidic acid (AC, C20:0) and eicosenoic acid (EA, C20:1c). The principal fatty acid in the
BP samples was LNA, ranging between 25.82% and 56.90%. It was followed by LA (5.94% to
24.80%), PA (7.83 to 30.05) and OA (4.63 to 20.61). CA, EA and AC were not found in all AP
samples and averaged 4.68%, 0.93% and 0.77%, respectively. In the literature, there are a number of
studies indicating appreciable differences among FA compositions of BPs from different regions or
countries. Therefore, the full characterization of BPs of diverse origins still appears to be a sound
research priority to obtain a reliable data on this valuable beehive product.
The total saturated FA (SFA = C10:0 + C16:0 + C20:0), monounsaturated FA (MUFA = C18:1n9c +
t + C20:1c), polyunsaturated FA (PUFA = C18:2n6 + C18:3n3), total unsaturated FA (TUFA = ∑MUFA +
∑PUFA) and the PUFA/SFA, SFA/TUFA ratios, and ω−6/ω−3, ω−3/ω−6, obtained for the AP samples
are shown in Table 4. The analysed samples present a level of TUFA between 55.42% and 88.93% of
the total (calculated value) FA. In all cases, PUFA is significantly higher than MUFA and SFA. The
profiles obtained for the analyzed organic BP from the Portuguese DINP were similar to the data from
a report by Shawer et al. [29], on Spanish pollens but are slightly different from those of Poland, Korea
and China [30]. The LA and LNA are key compounds for cell membranes and are associated
with brain function and neurotransmission. These FA also play an important role in the transference of
the O2 to blood plasma, in the synthesis of hemoglobin and in cellular division [31,32]. Moreover,
FA from ω−6 series are biogenetic precursors of some physiologically important thromboxanes,
leukotrienes and prostaglandins hormones, which are related to the inflammatory response. The
nutritional value of essential ω−3 and ω−6 FA is also widely known for its health benefits [33].
2.5. Bioactive Compounds and Antioxidant Activity
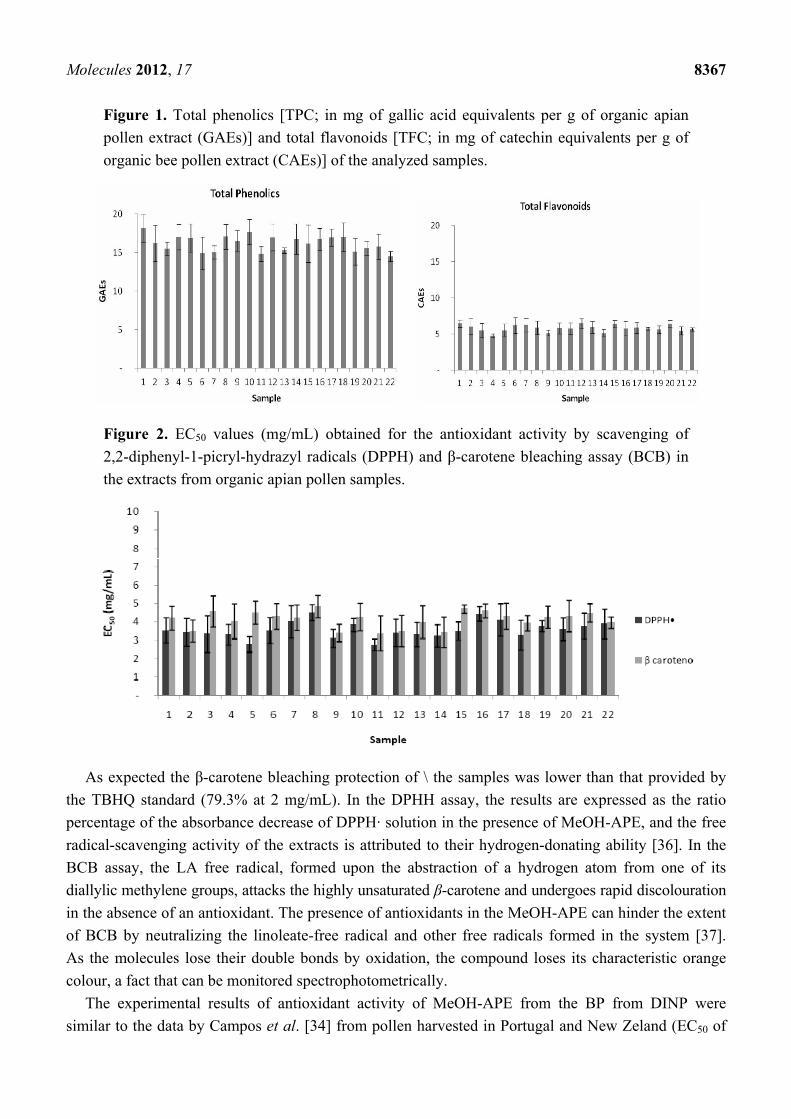
The BPs were screened for their bioactive compounds, namely phenolics and flavonoids, and results
are presented in Figure 1. Concentrations of TPC and TFC varied from 12.9 to 19.8 (mean value ± SD =
16.4 ± 2.0 GAEs) and from 4.5 to 7.1 (mean value ± SD = 5.8 ± 0.8 CAEs) respectively. Results showed
that the concentration of TFC shows a minor variation, if we compare it to the results obtained for TPC.
Previous works verified that antioxidant activity is related to the amount of flavonoids and phenolic
compounds [34]. In this research, the correlations found were: TPC-DPPH (R = 0.60), TPC-BCB
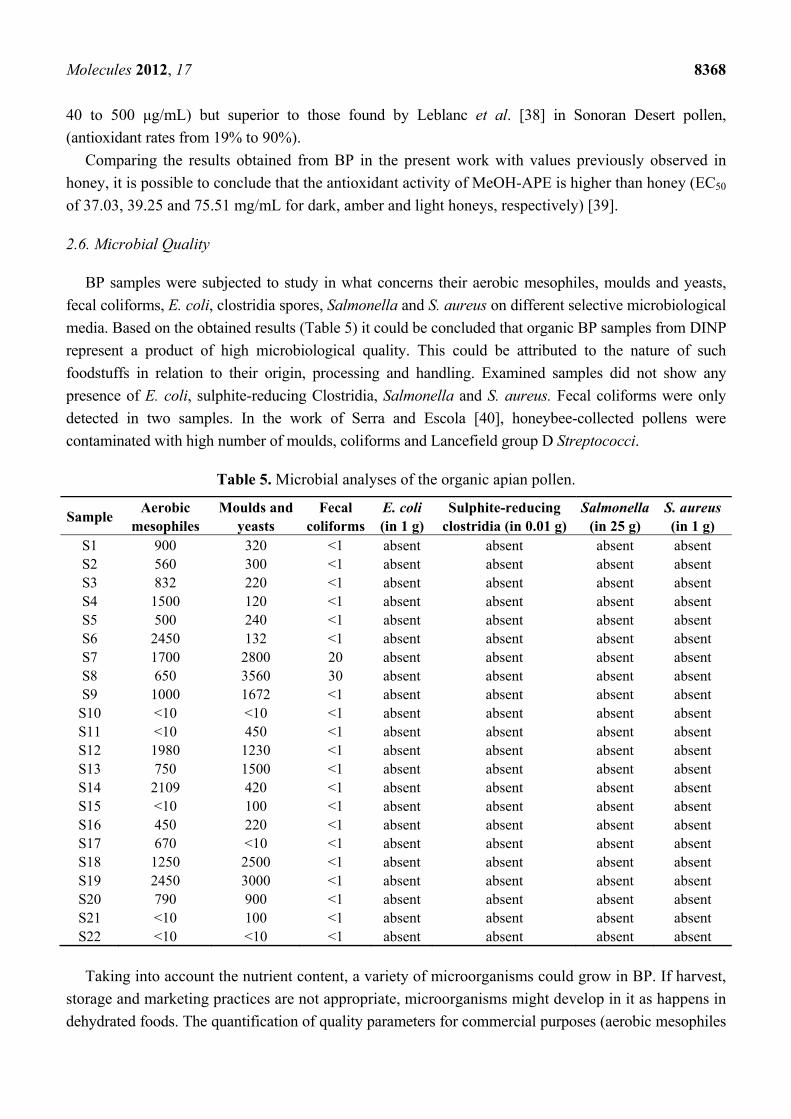
(R = 0.29), TFC-DPPH (R = 0.54) and TFC-BCB (R = 0.58). Figure 2 summarises the results obtained for
antioxidant activity of the MeOH-APE. The use of at least two methods is recommended to assess and
compare the antioxidant capacity of a sample [35]. In the present work antioxidant properties of the
MeOH-APE were evaluated by the DPPH method and BCB assay. The scavenger activity of the free
DPPH• was expressed in terms of EC50, that is the amount of antioxidant necessary to decrease by 50% the
initial DPPH concentration. Lower values indicate better antioxidant capacity of the MeOH-APE. The
EC50 values ranged from 2.0 mg/mL to 4.3 mg/mL, with a mean value of 3.0 ± 0.7 mg/mL. The results
obtained (EC50) in BCB assay averaged 4.6 mg/mL with a range of 3.1 to 5.9 mg/mL and a SD of 0.9.
Molecules 2012, 17 8367
Figure 1. Total phenolics [TPC; in mg of gallic acid equivalents per g of organic apian
pollen extract (GAEs)] and total flavonoids [TFC; in mg of catechin equivalents per g of
organic bee pollen extract (CAEs)] of the analyzed samples.
Figure 2. EC50 values (mg/mL) obtained for the antioxidant activity by scavenging of
2,2-diphenyl-1-picryl-hydrazyl radicals (DPPH) and β-carotene bleaching assay (BCB) in
the extracts from organic apian pollen samples.
As expected the β-carotene bleaching protection of \ the samples was lower than that provided by
the TBHQ standard (79.3% at 2 mg/mL). In the DPHH assay, the results are expressed as the ratio
percentage of the absorbance decrease of DPPH· solution in the presence of MeOH-APE, and the free
radical-scavenging activity of the extracts is attributed to their hydrogen-donating ability [36]. In the
BCB assay, the LA free radical, formed upon the abstraction of a hydrogen atom from one of its
diallylic methylene groups, attacks the highly unsaturated β-carotene and undergoes rapid discolouration
in the absence of an antioxidant. The presence of antioxidants in the MeOH-APE can hinder the extent
of BCB by neutralizing the linoleate-free radical and other free radicals formed in the system [37].
As the molecules lose their double bonds by oxidation, the compound loses its characteristic orange
colour, a fact that can be monitored spectrophotometrically.
The experimental results of antioxidant activity of MeOH-APE from the BP from DINP were
similar to the data by Campos et al. [34] from pollen harvested in Portugal and New Zeland (EC50 of
Molecules 2012, 17 8368
40 to 500 μg/mL) but superior to those found by Leblanc et al. [38] in Sonoran Desert pollen,
(antioxidant rates from 19% to 90%).
Comparing the results obtained from BP in the present work with values previously observed in
honey, it is possible to conclude that the antioxidant activity of MeOH-APE is higher than honey (EC50
of 37.03, 39.25 and 75.51 mg/mL for dark, amber and light honeys, respectively) [39].
2.6. Microbial Quality
BP samples were subjected to study in what concerns their aerobic mesophiles, moulds and yeasts,
fecal coliforms, E. coli, clostridia spores, Salmonella and S. aureus on different selective microbiological
media. Based on the obtained results (Table 5) it could be concluded that organic BP samples from DINP
represent a product of high microbiological quality. This could be attributed to the nature of such
foodstuffs in relation to their origin, processing and handling. Examined samples did not show any
presence of E. coli, sulphite-reducing Clostridia, Salmonella and S. aureus. Fecal coliforms were only
detected in two samples. In the work of Serra and Escola [40], honeybee-collected pollens were
contaminated with high number of moulds, coliforms and Lancefield group D Streptococci.
Table 5. Microbial analyses of the organic apian pollen.
Sample Aerobic
mesophiles Moulds and
yeasts Fecal
coliforms E. coli (in 1 g)
Sulphite-reducing clostridia (in 0.01 g)
Salmonella (in 25 g)
S. aureus (in 1 g)
S1 900 320 <1 absent absent absent absent S2 560 300 <1 absent absent absent absent S3 832 220 <1 absent absent absent absent S4 1500 120 <1 absent absent absent absent S5 500 240 <1 absent absent absent absent S6 2450 132 <1 absent absent absent absent S7 1700 2800 20 absent absent absent absent S8 650 3560 30 absent absent absent absent S9 1000 1672 <1 absent absent absent absent
S10 <10 <10 <1 absent absent absent absent S11 <10 450 <1 absent absent absent absent S12 1980 1230 <1 absent absent absent absent S13 750 1500 <1 absent absent absent absent S14 2109 420 <1 absent absent absent absent S15 <10 100 <1 absent absent absent absent S16 450 220 <1 absent absent absent absent S17 670 <10 <1 absent absent absent absent S18 1250 2500 <1 absent absent absent absent S19 2450 3000 <1 absent absent absent absent S20 790 900 <1 absent absent absent absent S21 <10 100 <1 absent absent absent absent S22 <10 <10 <1 absent absent absent absent
Taking into account the nutrient content, a variety of microorganisms could grow in BP. If harvest,
storage and marketing practices are not appropriate, microorganisms might develop in it as happens in
dehydrated foods. The quantification of quality parameters for commercial purposes (aerobic mesophiles
Molecules 2012, 17 8369
and moulds and yeasts) is generally lower than that reported by other authors. Hervatin [41] found mould
and yeast levels greater (104 CFU/g) than those obtained in the present study. From the microbiological
point of view, the low values of moulds and yeasts are most probably related to environmental
conditions, and are indicative of an appropriate management of organic apiaries.
Microbiological criteria provide guidance on the acceptability of foodstuffs and their manufacturing
processes. From the hygienic point of view, microbiological safety is the main quality criterion in BP.
Destruction of bacteria by irradiation, ozone treatments or chemical fumigants is not necessary and can
lead to toxic residues [10]. The microbiological content should correspond to the hygienic standards:
Salmonella (absent/10 g), S. aureus (absent/1 g), Enterobaceteriaceae (Max. 100/g), E. coli (absent/1 g),
total aerobic plate count (<100,000/g) and moulds and yeast (<50,000/g) [1].
Most primary producers are not directly affected, as specific microbiological criteria have not been
set for beehive products. However, beekeepers may be affected indirectly if their customers require
changes to specifications, as a result of improvements in production hygiene and selection of raw
materials for health purposes.
3. Experimental
3.1. Chemicals
2,2-Diphenyl-1-picrylhydrazyl (DPPH) was obtained from Alfa Aesar (Ward Hill, MA, USA).
3,4,5-Trihydroxybenzoic acid (gallic acid; GA), tert-butylhydroquinone (TBHQ), butylated
hydroxyanisole (BHA), polyoxyethylene (20) sorbitan monooleate (Tween 80), α-tocopherol,
β-carotene, petroleum ether and ethanol were obtained from Sigma Chemical Co. (St. Louis, MO,
USA). Sodium sulfate (Na2SO4, anhydrous, powder, extra pure), H2SO4, KOH, aluminium chloride
(AlCl3), NaNO2 and NaOH were purchased from Acros Organic (Geel, Belgium). Capric acid (CPA,
C10:0) [CAS 334-48-5]; palmitic acid (PA, C16:0) [CAS 57-10-3]; oleic acid (OA, C18:1n9c + t)
[CAS 112-80-1 CAS 112-79-8]; linoleic acid (LA, C18:2n6c) [CAS 60-33-3]; linolenic acid (LNA,
C18:3n3) [CAS 463-40-1]; arachidic acid (AC, C20:0) [CAS 506-30-9] and eicosenoic acid
(EA, C20:1c) [CAS 5561-99-9]) were purchased from Sigma-Aldrich (Tres Cantos, Spain). The
Folin-Ciocalteu reagent (FCR), chloroform (CHCl3) and sodium carbonate (Na2CO3), were obtained
from Merck (Darmstadt, Germany). Methanol (MeOH) and hexane were obtained from Pronolab
(Lisboa, Portugal). High purity water (18 MΩ cm), which was used in all experiments, was obtained
from a Milli-Q purification system (Millipore, Bedford, MA, USA).
3.2. Apian Pollen Material
Twenty-two (n = 22) typical bee pollen samples (AP), from Apis mellifera, were collected by
beekeepers from different apiaries, located inside the Portuguese territory declared as Douro
International Natural Park (IDNP). They were obtained using bottom-fitted pollen traps in May of 2010.
A 10-day-cycle of pollen trapping installation was employed in order to avoid making pollen trapping
difficult to bees: pollen was trapped for 5 days and after that period it was stopped for the next 5 days [42].
After the beekeepers dried the harvested material, a single 200 g jar of bee pollen was delivered to
the Microbiology Lab, where it was stored in a dark place at room temperature (±20 °C) until analysis,
Molecules 2012, 17 8370
which occurred no longer than one month after the extraction from the hives by beekeepers. All BP
samples showed no sign of fermentation or spoilage.
3.3. Sample Floral-Type Identification
The determination of the frequency of pollen load (PL) classes, were determined in the BP, in order
to ascertain the floral origin and to obtain a complete pollen spectrum. The botanical origin of the BP
was based on the method proposed by Almeida-Muradian et al. [43]. Briefly, the analyses are based on
the separation according to colour of PL from 2 g of BP. The PL counted were from 287 to 387 (mean
value ± standard deviation = 335 ± 29 %). Each subsample was weighed to calculate its percentage in
the main BP. Three slides of each subsample were prepared by washing the PL in 50% ethanol and
using glycerin and paraffin for permanent preparations. The examination of the slides was carried out
with a Leitz Diaplan microscope (Leitz Messtechnik GmbH, Wetzlar, Germany) at ×400 and ×1,000.
In order to recognise the pollen grains, we used the reference collection of the CIMO-Mountain
Research Center (Agricultural College of Bragança) and different pollen morphology guides.
3.4. Water Activity and pH
The water activity (aw) was measured using a model Rotronic Hygroskop DP. For pH, 5 g of
grounded AP were diluted with 20 mL of distilled water and mixed thoroughly. The pH values for
these samples were measured using a digital pH Meter (pH 526 Multical, WTW, Weilheim, Germany).
3.5. Chemical Composition and Nutritional Value
Chemical composition of the BP were analysed according to the AOAC procedures [44]. The ash
content was determined after incineration at 600 ± 15 °C, in a SNOL 8.2/1100-1 electric laboratory
furnace (AB “Umega”, Utena, Lithuania). Nitrogen content (N) was determined using the Kjeldahl
method (230-Hjeltec Analyzer, Foss Tecator, Höganäs, Sweden). The crude protein (CP) content was
calculated using the conversion factor of 5.6 (N × 5.6). The crude fat (CF) was determined by
gravimetry after extraction with petroleum ether using an automatic Soxtec device (FOSS, SoxtecTM
2050, Höganäs, Sweden). The total carbohydrate (CH) contents were obtained by difference. Ash, CP,
CF and CH contents of AP were expressed as a percentage of the original sample on a dry weight basis
(g/100 g sample). The total energy (kcal/100 g) was estimated using the Atwater coefficients (4 kcal/g
for CP and CH, 9 kcal/g for CF) [45].
3.6. Fatty Acid Profile Determination
Fatty acid methyl esters (FAMEs) were prepared from the extracted CF fraction by transesterification
using MeOH in the presence of H2SO4 as follows: A sample containing 20 ± 50 mg of lipids was
redissolved in 0.75 mL n-hexane; then 0.1 mL of 2 N KOH in MeOH was added and the solution was
mixed for 2 min in a vortex mixer (Model Reax 2000, Schwabach, Germany), dried over anhydrous
Na2SO4 and left for 25 min. After phase separation the upper layer of n-hexane containing the FAMEs
was removed and immediately injected into the gas-chromatograph (GC). Quantitative and qualitative
analysis of FAMEs, was performed on a DANI model GC 1000 coupled flame-ionization detector
Molecules 2012, 17 8371
(FID) equipped with a Macherey-Nagel (OPTIMA 225: 50% cyanopropyl-methyl–50%
phenylmethylpolysiloxane) column (30 m × 0.32 mm ID × 0.25 μm df). The carrier gas was H2 at a
pressure of 0.61 bar, and the split ratio was 1:40. The flow rate of the carrier gas was set
at 4.0 mL/min. A thermal gradient from 170 to 240 °C at 3.5 °C/min was used with the injector and
FID temperatures at 240 °C. The injection volume was 1 µL. FAMEs were identified by comparing the
retention times of the peaks of the sample with those of known reference esters. Fatty acid (FA)
composition was expressed as percent of major FAMEs from the peak areas with an integrator. Results
were recorded and processed using CSW 1.7 software (DataApex 1.7).
3.7. Bioactive Compounds Quantification
3.7.1. Extracts Preparation
Extracts were prepared according to procedures from Morais et al. [4] with modifications. Briefly,
BPs were ground and a portion of the obtained powder was mixed (1:2) (w/v) with MeOH, sonicated
for 30 min. and left to macerate for 48 h at room temperature. After this time, the solution was
centrifuged for 5 min at 13,000 g (4 °C). The centrifugal supernatant was evaporated under reduced
pressure by a rotavapor system consisting of a rotary vacuum evaporator (Heidolph VV. 2000, Leuven,
Belgium) equipped with a water bath and a B169 vacuum pump (Büchi, Flawil, Switzerland). The
residue was dissolved in H2O and lyophilised. Finally, the obtained AP extract (APE) was stored at
−80 °C, for further analysis.
3.7.2. Total Phenolic Content (TPC)
The total phenolic content in the BPE were recorded by FCR as described by Moreira et al. [46].
Briefly, a dilute solution of each BPE in MeOH (MeOH-APE; 500 μL of 1:10 g/mL) was mixed with
500 μL of the FCR and 500 μL of Na2CO3 (10% w/v). After incubation in dark at room temperature
for 1 h, the absorbance of the reaction mixture at 700 nm is determined against the blank (the same
mixture without the MeOH-APE) using a Unicam Helios Alpha UV-visible spectrometer (Thermo
Spectronic, Cambridge, UK). GA standard solutions (0.01–0.08 mM) were used for constructing the
calibration curve (y = 2.3727x + 0.0022; R2 = 0.9998). Total phenols content were expressed as mg of
GA equivalents per g of BPE (GAEs).
3.7.3. Total Flavonoid Content (TFC)
For flavonoid contents the aluminium chloride method was used. Briefly, MeOH-BPE (250 μL)
was mixed with 1.25 mL of distilled H2O and 75 μL of a 5% NaNO2 solution. After 5 min, 150 μL of a
10% AlCl3·H2O solution was added. After 6 min, 500 μL of 1 M NaOH and 275 μL of distilled H2O
were added to the mixture and vortexed. The intensity of the pink colour of the reaction mixture at
510 nm is determined against the blank (the same mixture without the MeOH-BPE). Catechin (CA)
standard solutions (0.022–0.34 mM) were used for constructing the calibration curve (y = 0.9689x − 0.0092;
R2 = 0.9987). The total flavonoids content (TFC) was expressed as mg of CA equivalents per g of
BPE (CAEs).

Molecules 2012, 17 8372
3.8. Antioxidant Activity
3.8.1. Scavenging of DPPH Radicals
The scavenging of DPPH· was assayed following the method described by Ferreira et al. [39].
Various concentrations of MeOH-APE (300 μL) were mixed with 2.7 mL of MeOH solution containing
DPPH• (6 × 10⁻⁵ mol/L). The mixture was shaken vigorously and left to stand for 60 min in the dark
(until stable absorption values were obtained). The reduction of the DPPH· was measured by continuously
monitoring the decrease of absorption at 517 nm. The radical-scavenging activity (RSA) was calculated
as a percentage of DPPH discoloration using the equation: %RSA = [(ADPPH − AS)/ADPPH] × 100, where
AS is the absorbance of the solution when the MeOH-BPE has been added at a particular level and
ADPPH is the absorbance of the DPPH solution. The MeOH-BPE concentration providing 50% of radical
scavenging activity (EC50) was calculated by interpolation from the graph of RSA percentage against
extract concentration. The standards used were BHA and α-tocopherol.
3.8.2. β-Carotene Bleaching (BCB) Assay
The antioxidant activity of the MeOH-BPE was evaluated by the BCB assay, as described by
Ferreira et al. [39]. A solution was prepared by dissolving 2 mg of β-carotene in 10 mL of CHCl3.
Afterwards 2 mL of the aforesaid solution was pipetted into a 100 mL round-bottom flask. Then the
organic solvent was removed at 40 °C under vacuum. 40 mg of LA, 400 mg of Tween 80 emulsifier
and 100 mL of distilled H2O were added to the flask. The mixture was shaken and 4.8 mL of this
emulsion were transferred into different test tubes containing 200 μL of different concentrations of the
MeOH-BPE. The tubes were shaken and incubated at 50 °C in a water bath. As soon as the emulsion
was added to each tube, the zero time absorbance was measured at 470 nm. Absorbance readings were
then recorded at 20-min intervals until the control sample had changed color. A blank, devoid of
β-carotene, was prepared for background subtraction. Lipid peroxidation inhibition (LPO) was
calculated using the following equation: LPO = (β-carotene content after 2 h of assay/initial β-carotene
content) × 100. The MeOH-BPE concentration providing 50% antioxidant activity (EC50) was calculated
by interpolation from the graph of antioxidant activity percentage. TBHQ was used as standard.
3.9. Microbiological Determinations
Microbiological determinations were carried out as described previously [47]. In short, 10 g of each
BP were aseptically taken and homogenized using a pre-sterilized Stomacher Lab-Blender (Seward
type 400, London, UK) for 3 min with 90 mL of pre-chilled (4 ± 0.5 °C) sterile peptone-physiological
saline solution [0.1% neutral peptone + 0.85% NaCl (Merck, Darmstadt, Germany) in sterile deionized
H2O, pH = 7.0 ± 0.05]. Decimal serial dilutions were prepared from this homogenate in the same
chilled sterile diluents (1:10, by vol). The aerobic mesophile were determined using plate count agar
(PCA), by counting the colony forming units (cfu/g of BP) after incubating the plates at 30 °C for 48 h.
Moulds and yeasts counts followed the protocol of International Organization for Standardization
(ISO) [48]. For sulphite-reducing clostridia counting, aliquots of 10, 5, 1 and 0.1 mL of the initial
suspension were added to an empty tube, thermally treated at 80 °C for 5 min and covered with SPS

Molecules 2012, 17 8373
(sulphite-polymixin-sulfadiazine) agar media, tubes were incubated at 37 °C for 5 days. Fecal coliforms
were enumerated by the Most Probable Number (MPN) technique defined in the protocol ISO [49].
The positive results for fecal coliforms were studied for E. coli. Enumeration was made on Eosin
Methylene Blue Agar-EMB Agar (Oxoid Inc., London, UK) incubated at 35 °C for 24 h. Salmonella
detection followed the ISO protocol [50]. Staphylococcus aureus detection followed the protocol
of [51]. All microbial tests were performed in triplicate.
4. Conclusions
Under European regulations [52], any claims of health or nutritional benefits of a food product must
be supported by science. Different health claims can be made for BP: (a) long term ingestion of pollen
and special pollen preparations can improve the physical performance and fitness of sportsmen and
elderly people and (b) pollen intake can improve gut, gastroenterological and liver health. BP
composition data were considered sufficient for most purposes, but now the usefulness of BP-specific
composition data is increasingly being acknowledged, since the composition of BP varies greatly as a
result of collection from different geographic regions, the time of collection, and the various species of
vegetation from which the pollen is harvested by honeybees. The results obtained in this study
demonstrated that BP constitutes a good source of healthy compounds, namely, phenolics, and
suggests that it might be useful in prevention of diseases in which free radicals are implicated.
Portuguese organic BP from DINP is nutritionally well-balanced and revealed high levels of healthy
fatty acids and good PUFA/SFA ratios. Microbiologically, the commercial quality was considered
good and all samples showed negative results for toxigenic species. The consumption of BP can be
beneficial for the health and, as such, the investigation of its chemical, nutritional and microbiological
composition will contribute to the assessment of this natural product. BP is a food supplement with
potentially beneficial effects for humans.
Conflict of Interest
The authors declare that they have no conflict of interest.
Acknowledgments
We would like to thank the Portuguese beekeepers who kindly supplied us with the samples for this
study. X. F. would also like to thank the Xunta de Galicia (Isidro Parga Pondal Program for Young
Researchers, Grant No.: IPP-020), and JoDee Anderson for the linguistic support she provided.
References
1. Campos, M.R.G.; Bogdanov, S.; de Almeida-Muradian, L.M.B.; Szczesna, T.; Mancebo, Y.;
Frigerio, C.; Ferreira, F. Pollen composition and standardisation of analytical methods. J. Apicult. Res.
2008, 47, 156–163.
2. Basim, E.; Basim, H.; Ozcan, M. Antibacterial activities of Turkish pollen and propolis extracts
against plant bacterial pathogens. J. Food Eng. 2006, 77, 992–996.
Molecules 2012, 17 8374
3. Ozcan, M. Inhibition of Aspergillus parasiticus NRRL 2999 by pollen and propolis extracts.
J. Med. Food 2004, 7, 114–116.
4. Morais, M.; Moreira, L.; Feás, X.; Estevinho, L.M. Honeybee-collected pollen from five
portuguese natural parks: Palynological origin, phenolic content, antioxidant properties and
antimicrobial activity. Food Chem. Toxicol. 2011, 49, 1096–1101.
5. Bevzo, V.; Grygor’eva, N.P. Effect of bee pollen extract on glutathione system activity in mice
liver under X-ray irradiation. Ukr. Biokhim. Zh. 1997, 69, 115–117.
6. Eraslan, G.; Kanbur, M.; Silici, S. Effect of carbaryl on some biochemical changes in rats: The
ameliorative effect of bee pollen. Food Chem. Toxicol. 2009, 47, 86–91.
7. Pinto, B.; Cagiagli, F.; Riccio, E.; Reali, D.; Saric, A.; Balog, T.; Likic, S.; Scarpato, R.
Antiestrogenic and antigenotoxic activity of bee pollen from Cystus incanus and Salix alba as
evaluated by the yeast estrogen screen and the micronucleus assay in human lymphocytes.
Eur. J. Med. Chem. 2010, 45, 4122–4128.
8. Furusawa, E.; Chou, S.C.; Hirazumi, A.; Melera, A. Antitumour potential of pollen extract on lewis
lung carcinoma implaned intraperitoneally in syngeneic mice. Phytother. Res. 1995, 9, 255–259.
9. Maruyama, H.; Sakamoto, T.; Araki, Y.; Hara, H. Anti-inflammatory effect of bee pollen ethanol
extract from Cistus sp of Spanish on carrageenan-induced rat hind paw edema. BMC Complement.
Altern. Med. 2010, 10, doi:10.1186/1472-6882-10-30.
10. Bogdanov, S. Pollen: Nutrition, Functional Properties, Health: A Review. Bee Product Science,
2011. Available online: http://www.bee-hexagon.net/files/file/fileE/Health/PollenBook2Review.pdf
(accessed on 11 May 2012).
11. Feás, X.; Pires, J.; Estevinho, M.L.; Iglesias, A.; Pinto de Araujo, J.P. Palynological and
physicochemical data characterisation of honeys produced in the Entre-Douro e Minho region of
Portugal. Int. J. Food Sci. Technol. 2010, 45, 1255–1262.
12. Feás, X.; Pires, J.; Iglesias, A.; Estevinho, M.L. Characterization of artisanal honey produced on
the Northwest of Portugal by melissopalynological and physico-chemical data. Food Chem. Toxicol.
2010, 48, 3462–3470.
13. EU. Council Directive 92/43/EEC on the conservation of natural habitats and of wild fauna and
flora. Off. J. Eur. Commun. L 1992, 206, 7–50.
14. EU. Council Directive 834/2007 on organic production and labelling of organic products. Off. J.
Eur. Commun. L 2007, 189, 1–23.
15. Feás, X.; Estevinho, L.M. A survey of the in vitro antifungal activity of heather (Erica Sp.)
organic honey. J. Med. Food 2011, 14, 1–5.
16. Rial-Otero, R.; Gaspar, E.M.; Moura, I.; Capelo, J.L. Chromatographic-based methods for
pesticide determination in honey: An overview. Talanta 2007, 71, 503–514.
17. Magkos, F.; Arvaniti, F.; Zampelas, A. Organic food: Nutritious food or food for thought?
A review of the evidence. Int. J. Food Sci. Nutr. 2003, 54, 357–371.
18. Yamaguchi, M.; Hamamoto, R.; Uchiyama, S.; Ishiyama, K.; Hashimoto, K. Anabolic effects of
bee pollen Cistus ladaniferus extract on bone components in the femoral diaphyseal and
metaphyseal tissues of rats in vitro and in vivo. J. Health Sci. 2006, 52, 43–49.

Molecules 2012, 17 8375
19. Hamamoto, R.; Ishiyama, K.; Yamaguchi, M. Inhibitory effects of bee pollen Cistus ladaniferus
extract on bone resorption in femoral tissues and osteoclast-like cell formation in bone marrow
cells in vitro. J. Health Sci. 2006, 52, 268–275.
20. Yamaguchi, M.; Hamamoto, R.; Uchiyama, S.; Ishiyama, K.; Hashimoto, K. Preventive effects of
bee pollen Cistus ladaniferus extract in bone loss in streptozotocin-diabetic rats in vivo. J. Health Sci.
2007, 53, 190–195.
21. Ishikawa, Y.; Tokura, T.; Ushio, H.; Niyonsaba, F.; Yamamoto, Y.; Tadokoro, T.; Ogawa, H.;
Okumura, K. Lipid-soluble components of honeybee collected pollen exert antiallergic effect by
inhibiting IgE-mediated mast cell activation in vivo. Phytother. Res. 2009, 23, 1581–1586.
22. Nagai, T.; Inoue, R.; Inoue, H.; Suzuki, N. Scavenging capacities of pollen extracts from cistus
ladaniferus on autoxidation, superoxide radicals, hydroxyl radicals, and DPPH radicals. Nutr. Res.
2002, 22, 519–526.
23. Nagai, T.; Inoue, R.; Suzuki, N.; Myoda, T.; Nagashima, T. Antioxidative ability in a linoleic
acid oxidation system and scavenging abilities against active oxygen species of enzymatic
hydrolysates from pollen Cistus ladaniferus. Int. J. Mol. Med. 2005, 15, 259–263.
24. Carpes, S.T.; Mourão, G.B.; de Alencar, S.M.; Masson, M.L. Chemical composition and free
radical scavenging activity of Apis mellifera bee pollen from Southern Brazil. Braz. J. Food
Technol. 2009, 12, 220–229.
25. Bonvehi, J.S.; Jordà, R.E. Nutrient composition and microbiological quality of honeybee-collected
pollen in Spain. J. Agric. Food Chem. 1997, 45, 725–732.
26. Morgano, M.A.; Milani, R.F.; Martins, M.C.T.; Rodriguez-Amaya, D.B. Determination of water
content in Brazilian honeybee-collected pollen by Karl Fischer titration. Food Control 2011, 22,
1604–1608.
27. Hassan, H.M.M. Chemical composition and nutritional value of palm pollen grains. Global J.
Biotechnol. Biochem. 2011, 6, 1–7.
28. Toledo, I.; Burlingame, B. Biodiversity and nutrition: A common path toward global food security
and sustainable development. J. Food Compos. Anal. 2006, 19, 477–483.
29. Shawer, M.B.; Au, S.M.; Abdellatif, M.A.; El-Refai, A.A. Biochemical studies of bee-collected
pollen in Egypt 2. Fatty acids and non saponifiables. J. Apicult. Res. 1987, 26, 133–136.
30. Szczęsna, T. Long-chain fatty acids composition of honeybee-collected pollen. J. Apicult. Sci.
2006, 50, 65–79.
31. Yehuda, S.; Rabinovitz, S.; Carasso, R.L.; Mostofsky, D.I. The role of polyunsaturated fatty acids
in restoring the aging neuronal membrane. Neurobiol. Aging 2002, 23, 843–853.
32. Youdim, K.A.; Martin, A.; Joseph, J.A. Essential fatty acids and the brain: Possible halth
implications. Int. J. Dev. Neurosci. 2000, 18, 383–399.
33. Guil, J.L.; Torija, M.E.; Giménez, J.J.; Rodriguez, I. Identification of fatty acids in edible wild
plants by gas chromatography. J. Chromatogr. A 1996, 719, 229–235.
34. Campos, M.G.; Webby, R.F.; Markham, K.R.; Mitchell, K.A.; Da Cunha, A.P. Aged induced
diminution of free radicals scavenging capacity in bee-pollens and the contribution of constituents
favonoids. J. Agric. Food Chem. 2003, 51, 742–745.

Molecules 2012, 17 8376
35. Sakanaka, S.; Ishihara, Y. Comparison of antioxidant properties of persimmon vinegar and some
other commercial vinegars in radical-scavenging assays and on lipid oxidation tuna homogenates.
Food Chem. 2008, 107, 739–744.
36. Silva, T.M.S.; Câmara, C.A.; Lins, A.C.; Barbosa-Filho, J.M.; Silva, E.M.S.; Freitas, B.M.;
Santos, F.A.R. Chemical composition and free radical scavenging activity of pollen loads from
stingless bee Melipona subnitida Ducke. J. Food Compos. Anal. 2006, 19, 507–511.
37. Pereira, J.A.; Oliveira, I.; Sousa, A.; Valentão, P.; Andrade, P.; Ferreira, I.; Ferreres, F.; Bento, A.;
Seabra, R.; Estevinho, L. Walnut (Juglans regia L.) leaves: Phenolic compounds, antibacterial
activity and antioxidant potential of different cultivars. Food Chem. Toxicol. 2007, 45, 2287–2295.
38. LeBlanc, B.W.; Davis, O.K.; Boue, S.; de Lucca, A.; Deeby, T. Antioxidant activity of sonoran
desert bee pollen. Food Chem. 2009, 115, 1299–1305.
39. Ferreira, I.C.F.R.; Aires, E.; Barreira, J.C.M.; Estevinho, L.M. Antioxidant activity of Portuguese
honey samples: Different contributions of the entire honey and phenolic extract. Food Chem.
2009, 114, 1438–1443.
40. Serra, J.; Escola, R. Nutrient composition and micrnbiological quality of honeybee-collected
pollen in Spain. J. Agric. Food Chem. 1997, 45, 725–732.
41. Hervatin, H.L. Microbiológica e Físico-Quimica do Pólen Apícola in Natura e Desidratado sob
Diferentes Temperaturas. Tese de Mestrado em Ciência de Alimentos. Universidade Estadual de
Campinas, Campinas, SP, Brazil, 2009.
42. Bratkowski, J.; Wilde, J. Effect of changing of colony structure on trapped pollen. J. Apicult. Sci.
2003, 47, 11–19.
43. Almeida-Muradian, L.B.; Pamplona, L.C.; Coimbra, S.; Barth, O. Chemical composition and
botanical evaluation of dried bee-pollen pellets. J. Food Compos. Anal. 2005, 18, 105–111.
44. Association of Official Analytical Chemists (AOAC). Official Methods of Analysis, 16th ed.;
AOAC: Arlington, VA, USA, 1995.
45. Merill, A.L.; Watt, B.K. Energy Value of Foods, Basis and Derivation. In Agriculture Handbook,
Volume 74; United States Department of Agriculture: Washington, DC, USA, 1995.
46. Moreira, L.; Dias, L.G.; Pereira, J.A.; Estevinho, L. Antioxidant properties, total phenols and
pollen analysis of propolis samples from Portugal. Food Chem. Toxicol. 2008, 46, 3482–3485.
47. Gomes, S.; Dias, L.; Moreira, L.; Rodrigues, P.; Estevinho, L. Physicochemical, microbiological
and antimicrobial properties of commercial honeys from Portugal. Food Chem. Toxicol. 2010, 48,
544–548.
48. ISO 21527-2:2008. Microbiology of Food and Animal Feeding Stuffs—Horizontal Method for
the Enumeration of Yeasts and Moulds—Part 2: Colony Count Technique in Products with Water
Activity Less Than or Equal to 0.95. International Standards Organization, Geneva, Switzerland,
2008.
49. ISO 4831:2006. Microbiology of Food and Animal Feeding Stuffs—Horizontal Method for the
Detection and Enumeration of Coliforms—Most Probable Number Technique. International
Standards Organization, Geneva, Switzerland, 2006.
50. ISO 6579:2002(E). Microbiology of Food and Animal Feeding Stuffs—Horizontal Method for the
Detection of Salmonella spp. International Standards Organization, Geneva, Switzerland, 2002.

Molecules 2012, 17 8377
51. NP 4400-1:2002. Microbiologia Alimentar. Regras gerais para contagem de Estafilococos
coagulase positiva (Staphylococcus aureus e outras espécies). Parte 1: Técnica com confirmação
de colónias (método corrente). Instituto Português da Qualidade, Caparica, Portugal, 2002.
52. EU. Council Directive 1924/2006 on nutrition and health claims made on foods. Off. J. Eur.
Commun. L 2007, 404, 12–17.
Sample Availability: Samples of the compounds are available from the authors.
© 2012 by the authors; licensee MDPI, Basel, Switzerland. This article is an open access article
distributed under the terms and conditions of the Creative Commons Attribution license
(http://creativecommons.org/licenses/by/3.0/).