organic growth and international expansion: the way to...
TRANSCRIPT
Organic growth and shareholder value: A case study of the insurance
industry
Gerhard Klinga, Abby Ghobadianb, and Nicholas O’Reganc
a University of Southampton, b University of Reading, c Bristol Business School
THIS IS NOT THE FINAL (POST-REVIEW) VERSION
YOU FIND THE FINAL VERSION HERE:
Kling, G., O’Regan, N., and A. Ghobadian (2009) Organic growth and
shareholder value: A case study of the insurance industry, International
Journal of Research in Marketing 26(4), 276-283
This paper examines organic growth and its impact on shareholder value creation. At a
conceptual level organic and external growth are readily defined; yet, at a practical level
decomposing revenue growth into its constituent elements presents methodological
challenges. We develop a method to decompose revenue growth into organic growth,
external growth, exchange rate effects, and under or outperformance. Using extensive
data from three insurance companies, AXA, Generali and ING, we analysed the period
from 1995 to 2005. Exchange rate effects were of minor importance, except if companies
entered markets at inopportune times. Primarily, the findings indicate that only organic
revenue growth enhanced shareholder value. Therefore, managers should focus on
marketing as a key driver of organic growth to create value.
Keywords: Insurance industry, growth strategy, organic growth, revenue growth
decomposition
1
1. Introduction
The realisation of superior growth is of paramount importance to managers and
shareholders (Stremersch & Tellis, 2004; Srivastava, Shervani, & Fahey, 1999). Growth
strategies fall into two broad categories: organic or core growth, and non-organic or
external growth (Dalton & Dalton, 2006; Pecotich, Laczniak, & Inderrieden, 1985).
Effective marketing can contribute to a firm’s organic growth through better anticipation
of market opportunities and calibration of risks, a tighter linkage of technological
possibilities with market concepts, faster adjustments to shifting market needs and
competitive moves, and winning and retaining customers (Day, 2003; Day & Fahey,
1988). Defining and decomposing revenue growth is the first critical step in assessing
marketing’s contribution to growth and value creation. At a conceptual level it is possible
to clearly define organic and external growth; though, at present there is no widely
accepted method of delineating between the medium and long-term impact of organic and
external growth strategies or a methodology to decompose revenue growth (Hess, 2006).
This paper fills a gap in the literature by developing a method to decompose
revenue growth into three components: organic revenue growth, external revenue growth
(due to mergers, acquisitions and divestitures), and exchange rate effects. After
identifying the components of revenue growth, the impact on shareholder value can be
assessed. As marketing is one of the main drivers of organic revenue growth, determining
organic revenue growth and its impact on shareholder value is an indirect approach to
measuring the relevance of marketing. The study focuses on the insurance industry due to
the good access to market and firm-specific data on revenue growth. The method of
decomposing revenue growth can be applied to any industry, and the persistence
2
modelling could be extended by inserting marketing related variables to obtain a direct
measure of the impact of marketing on organic growth and value creation.1 We analysed
the revenue growth of three leading European insurance companies, namely AXA, ING
and Generali, and addressed two research questions. (1) Do insurance companies rely
primarily on organic or external revenue growth? (2) Does organic or external revenue
growth enhance shareholder value?
The paper is structured as follows. First, following Srinivasan and Hanssens
(2009) and Srivastava et al. (1999) who analysed the relation between marketing and
shareholder value creation, the conceptual framework is established. Second, a
methodological discussion follows highlighting the sample selection and the approach to
defining and decomposing revenue growth. Third, the empirical analysis shows the
importance of organic revenue growth in the insurance industry and assesses the impact
of revenue growth on value creation. The concluding remarks stress main contributions
and limitations of this research and identify directions for future research.
2. The conceptual framework
2.1 Value drivers, marketing and value creation
Srinivasan and Hanssens (2009) highlighted the marketing assets and action metrics that
could affect shareholder value, and Srivastava et al. (1999) focused on a business process
perspective of marketing. These studies established the relationship between marketing
and value creation. A number of marketing scholars have focused on the cash flow
implications of marketing (Anderson, Fornell, & Mazvancheryl, 2004) and the ability of
1 Using marketing related variables is not feasible in the insurance industry due to reporting issues (see
section 2.3).
3
marketing to enhance cash flows by increasing revenues, reducing costs, and reducing
working capital and fixed assets (Rappaport, 1998). In addition, Rappaport (1998) stated
that marketing could reduce the volatility of cash flows, which in turn would lower risk
and thus reduce the cost of capital. Furthermore, Rappaport (1998) argued that marketing
increases the speed of cash flows.
Despite a stream of research focusing on the impact of marketing on cash flows
and the cost of capital, questions regarding its efficacy persist due to the influence of
other firm and industry-specific factors, which leads to endogeneity and causality issues.
In particular, the impact of marketing on the cost of capital seems to be rather small,
where capital structure, interest coverage, and risk premiums predominate as discussed in
the finance literature. While, marketing can influence cash flows, its effect on costs and
fixed assets (e.g. property, plant and equipment) – as suggested by Rappaport (1998) –
does not seem to be of major importance. Although Rao and Bharadwaj (2008) argued
that marketing might reduce working capital and thus limit invested capital, which in turn
would increase profitability (ROIC),2 the magnitude of impact is likely to be small due to
other drivers of ROIC (e.g. asset utilization, industry-specific effects). According to Day
and Fahey (1988), who stressed that the main function of marketing is winning and
retaining customers, revenue growth seems to be the main lever for the marketing-
shareholder value relationship.
External macroeconomic shocks (e.g. inflation, interest rates) cause exchange rate
changes and affect reported revenue growth; meaning that growth due to currency effects
does not reflect marketing practice. Companies can deliver revenue growth through
mergers and acquisitions (M&A) or retrench business through divestitures. These
2 ROIC refers to the return on invested capital.
4

external means of revenue growth depend on financial considerations (e.g. valuation
levels, synergies, costs, and sources of finance) with marketing playing a subordinate role
in these transactions (e.g. assessment of revenue synergies though cross-selling).
Contrarily, organic revenue growth is influenced mainly by marketing (e.g. distribution
channels); thus, we need to isolate organic revenue growth to determine the role of
marketing in value creation. Figure 1 illustrates the theoretical underpinning of the
relationship between marketing and shareholder value creation.
(Insert Fig. 1)
2.2 Organic and external revenue growth
Interestingly, the most frequently used growth strategy in the past two decades has been
M&A (McNamara, Haleblain, & Johnson, 2008), although mergers often fail to deliver
the expected increase in shareholder value (Dunis & Klein, 2005; Andre, Kooli, & L'Her,
2004). Meer (2005) suggested that organic revenue growth is the most important driver of
shareholder value. These empirical findings and past experience seem to affect decision-
makers. For instance, Wulf Bernotat (CEO of E.ON) stressed that “Following years of
mainly growing through acquisitions, E.ON will focus on organic growth going forward”
(13th May 2009).
Organic revenue growth is defined as an organization’s growth rate excluding any
scale increases from M&A (Dalton & Dalton, 2006). This is sometimes referred to as
core growth and is derived internally by harnessing an organization’s competencies and
capabilities. Core growth is often manifested in improving customer relationships,
building new relationships, and enhancing innovation capacity. Pursuing an organic
5
growth strategy requires the organization to focus on its core competencies and
capabilities and leverage them with a focus on customer needs (Beijerse, 2000; Kautz &
Thaysen, 2001).
Achieving high organic revenue growth is more of a challenge in mature product
markets, and thus many organizations in these markets rely on international expansion
(Lynch, 2006). Moreover, organic revenue growth presents unique problems in the case
of firms offering services because of intangibility, cross border barriers to transfer
services, limited economies of scale, and the importance of reputation. These limitations
are especially relevant in the insurance industry.
2.3 Peculiarities of the insurance industry
As the study focused on the insurance industry, we need to consider industry-specific
peculiarities, which could influence the role of marketing and value creation. At a first
glance, it could be argued that marketing does not play an important role in the growth
process, since the insurance industry has traditionally low advertising to sales ratios of
0.03% in the life insurance business and 1.09% in the non-life segment.3 From a business
processes perspective, Srivastava et al. (1999) stressed three main processes affected by
marketing: new customer solutions and product development, enhancement of the
acquisition of inputs and transformation to desirable output, and creation and leveraging
of linkages to external market places. Only the third business process, namely distribution
channels and networks, is a key success factor in the insurance industry.
A major concern of insurance companies is to secure and maintain an efficient
distribution network, which traditionally relied on sales representatives selling insurance
3 These figures refer to the UK market in 2005 provided by the World Advertising Research Center.
6

products and receiving commissions in exchange. Interestingly, commissions paid to
sales representatives are not reported as marketing expenses but as acquisition
commissions. Apart from distribution networks, direct marketing is essential due to
substantial data on consumer behaviour and claims (Keet & Mercer, 1998). Some
insurance companies report direct marketing activities and provide country-specific
details.4 For instance, in 1998 AXA reported that 13.9% of revenues were generated by
general agents, 37.0% by brokers, 38.3% by specialized networks and 10.8% by other
networks. Direct marketing and alliances with banks were less relevant for AXA. In
contrast, Generali only reported acquisition commissions but no breakdown of
distribution networks. In 1998, Generali spent 11% of gross written premiums (GWP) on
commissions. As commissions relative to GWP are rather similar in our sample, the
observed differences in revenue growth do not seem to be related to marketing expenses,
but might be due to distribution networks. Marketing related figures are not consistently
reported; hence, we cannot measure marketing assets and action metrics like in other
industries (e.g. R&D expenditures).
From a customer perspective, trust seems to be the key aspect for choosing a life
insurance company, as customers have to rely on the survival of insurance companies due
to long-term contracts (Bejou, Ennew, & Palmer, 1998; Crosby & Stephens, 1987). Yet
in non-life businesses, customers seem to be willing to shop for the best deal and are far
more price sensitive. Firm size seems to be essential for insurance companies to signal
survival prospects and trust to their customers.
This study focused on revenue growth measured in gross written premiums
(GWP). Using profits is not feasible in the insurance industry, as it does not directly
4 However, reporting is not consistent over time, and direct marketing is usually not reported before 1998.
7
depend on revenues (GWP); instead it is a result of investment activities, which are not
country specific and depend on bond and stock market conditions, and insurance claims.
In addition, profits are influenced by the management of reserves; hence, reported profits
do not reflect actual profits, and – even after adjusting profits for reserve management –
determining the segment or geographic split of profits is impossible.
3. Methodology
3.1 Sample selection
We chose three cases to illustrate revenue growth and value creation in the insurance
industry. Decomposing revenue growth by business segments (life and non-life) and
countries requires detailed information on revenues and the impact of M&A and
divestitures on revenue growth. This information is not readily available from financial
statements, and hence additional sources such as analysts’ reports need to be examined.
We selected three major European insurance companies that pursued three different
growth strategies in the period 1995 to 2005. Due to the deregulation of the European
insurance market, companies had easier access to foreign markets, which initiated a
period of high growth. All three were strong in their domestic markets, and in terms of
market capitalisation ING was the largest insurance group in Europe followed by AXA,
Allianz and Generali. The business mix was rather different, as ING had strong banking
activities accounting for 50% of revenues, whereas Generali focused on life insurance
with banking services representing only 7% of revenues. In contrast, AXA has ceased
providing any banking services after the divestiture of Donaldson, Lufkin & Jenrette in
2000.
8
The methodology followed Glaser and Strauss (1967) and Eisenhardt (1989).
Firstly, we examined various sources of published data for each firm to ensure that we
had a detailed overview of the firm and its activities. Secondary sources of information
including annual reports, company presentations, analysts’ conference presentations and
market research data were collected. We were particularly interested in the geographic
split of the insurance business to determine premiums earned in different countries and
services offered in different segments (life and non-life business, banking activities). This
information is essential to identify market growth rates in the respective market segment
provided by SwissRe Sigma studies (1995-2007). To measure external growth, we
evaluated mergers, acquisitions and divestitures and their impact on revenues and the
business mix. In addition, we accounted for exchange rate effects and adjusted reported
revenue figures for unit-linked products as explained in the appendix.
3.2 Decomposition of revenue growth
Defining and measuring organic growth seems to be straightforward, as only the scale
effect of M&A has to be excluded from reported growth rates (Dalton & Dalton, 2006).
Yet, Hess (2006) noted that there is no consensus on defining organic growth. Prior
research tended to identify organic growth by labelling firms that had only one minor
acquisition, for instance less than 5% of market value, as organic growth firms (Meer,
2005; Cools & Van de Laar, 2006). A precise decomposition of growth into organic and
external growth has not been developed. We define organic growth as follows:
Organic growth refers to growth over a certain period arising from a firm’s
existing business at the beginning of the period. Organic growth does not include: (1)
9

growth from M&A and divestitures, and (2) currency effects. Organic growth is driven
by market growth rates and changes in market share. External growth consists of the
initial acquisition or disposition of revenues and the subsequent growth due to market
growth rates and changes in market share. The growth of business in line with market
growth rates is called momentum, whereas deviating from market growth rates indicates
out or underperformance.
There are two views on the definition of organic growth. Our view is that the
whole period from 1995 to 2005 has to be considered; thus, only the existing business in
1995 can generate organic growth. Business subsequently acquired or sold represents
external growth. This also applies to the subsequent growth (momentum) of acquired or
sold business. The alternative view is that after the initial acquisition or divestiture took
place subsequent growth (momentum) could be regarded as organic growth. Hence, we
report both in our tables.
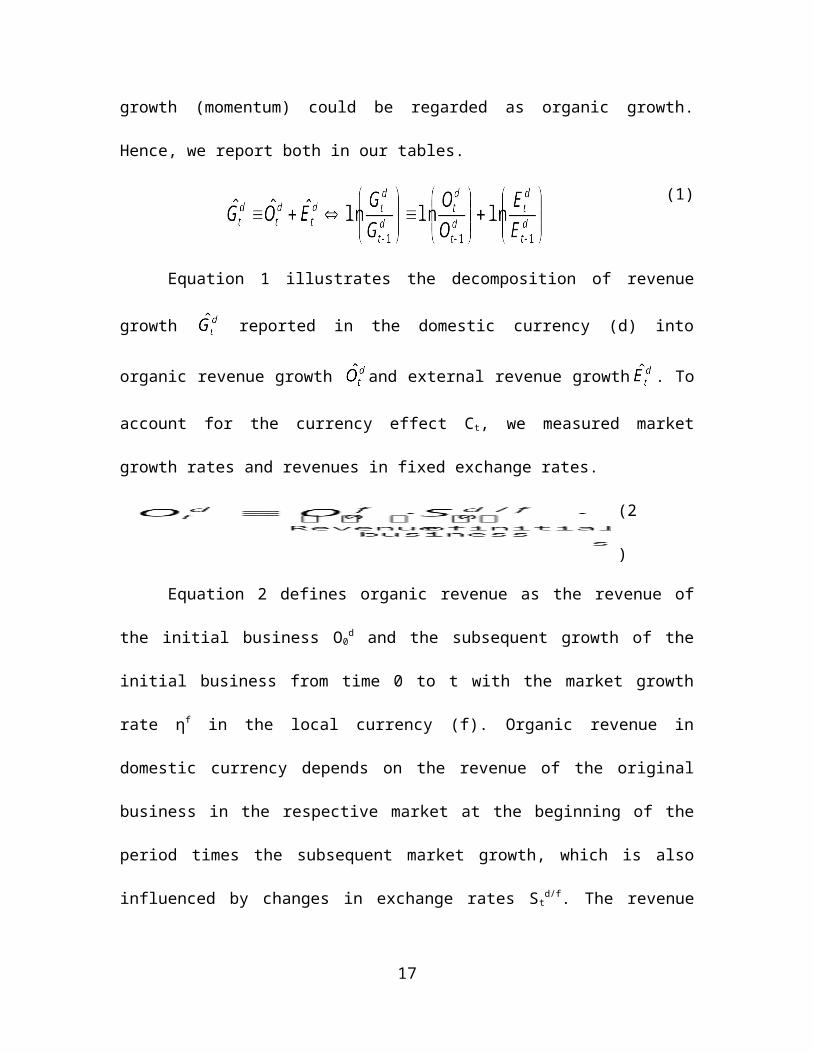
(1)
Equation 1 illustrates the decomposition of revenue growth reported in the
domestic currency (d) into organic revenue growth and external revenue growth .
To account for the currency effect Ct, we measured market growth rates and revenues in
fixed exchange rates.
(2)
Equation 2 defines organic revenue as the revenue of the initial business O0d and
the subsequent growth of the initial business from time 0 to t with the market growth rate
10
ηf in the local currency (f). Organic revenue in domestic currency depends on the revenue
of the original business in the respective market at the beginning of the period times the
subsequent market growth, which is also influenced by changes in exchange rates S td/f.
The revenue growth of the initial portfolio due to market growth is called momentum.
(3)
External revenue Etd refers to acquiring or selling business units A t
f. The dummy
variable Dt indicates whether an event (e.g. M&A) occurs. Similar to organic revenues,
acquired revenues grow with the respective market growth rate η f. Currency fluctuations
influence the value of the acquired business and subsequent growth. Accordingly,
equation 3 defines external revenue as the value of acquired or sold business and its
subsequent growth (momentum).
Based on equations 2 and 3, we decompose revenue growth into organic revenue
growth and external revenue growth assuming fixed exchange rates. The difference in
growth rates between fixed and variable exchange rates defines the currency effect C t. As
we used market growth rates ηf to determine the momentum of growth, comparing the
reported revenue with the potential revenue based on equation 2 and 3 detects
outperformance if the company grew faster than the market or underperformance if the
company grew below market growth rates.
4. Empirical findings
4.1 Decomposition of revenue growth: descriptive findings
11

Panel A of Table 1 shows the revenues in GWP of the initial business in 1995 combining
the life and non-life segment and reports the components of revenues based on the growth
decomposition. As discussed in section 3.2, there are two views on organic growth.
Hence, Table 1 reports organic revenue growth that includes the momentum of acquired
business and divestitures (see Panel B). One year after the acquisition, subsequent growth
of acquired business would be regarded as organic growth. In contrast, our more
conservative view is that subsequent growth of acquired entities reflects external growth,
since this growth would not have been achieved without acquiring the business in the first
place (see Panel C).
(Insert Table 1)
ING experienced the highest annualized revenue growth rate of 16.1% followed
by Generali (14.2%) and AXA (13.5%) mainly as a result of their aggressive external
growth strategy. ING’s M&A activities increased its initial business by 222% compared
to less aggressive growth patterns pursued by AXA (112%) and Generali (91%). The
momentum of external revenue growth contributes 67% to the growth of the initial
business in the case of AXA followed by ING (60%) and Generali (31%).
Based on the more liberal definition, organic revenue growth including the
momentum of acquired or sold business reached 9.4% in the case of Generali and ING
(see Panel B), whereas AXA only exhibited 7.5%. If one follows the stricter definition of
organic growth excluding the momentum of M&A and divestitures (see Panel C), organic
growth rates are lower. Generali managed to achieve organic growth rates of 7.8%,
whereas ING grew by 6.6% and AXA by only 4.0%. External growth is a substantial
12
component of overall growth, but the question is which type of growth can enhance
shareholder value.
In the short-run controlling for exchange rate effects is essential, but in the long-
run exchange rate changes seem to offset previous changes and thus have little impact on
growth. ING suffered from exchange rate changes considerably, which lowered growth
rates by 3.6% per year. This result highlights the importance of timing, as ING expanded
their US business in 2000 at the peak of the market. Due to the pronounced depreciation
of the US dollar, subsequent growth rates were affected negatively. AXA also had a
considerable stake in the US market, but exchange rate effects hardly influenced revenue
growth, which is attributable to AXA growing their US business organically. They only
acquired a one small US life insurance firm (MONY) in 2005. Accordingly, the exchange
rate effect that hampered ING’s US expansion had only a mild effect on AXA’s growth
trajectory. To illustrate this finding, Fig. 2 depicts the exposure to exchange rate changes
of AXA in EUR millions. In spite of severe fluctuations, the cumulated exchange rate
effect is only €67m. Accordingly, timing seems to be an important determinant for
successful growth.
(Insert Fig. 2)
The decomposition of growth allows identifying the reasons for revenue growth.
AXA exhibited the lowest annual growth rate, which is partly explained by its
underperformance, which indicates a decline in market share and points to poor
attainment of growth potential. Underperformance lowers AXA’s annual growth by
0.5%, and outperformance increases Generali’s growth by 0.7% and ING’s growth by
13
1.0%. Apart from underperformance, the disappointing growth of AXA’s business was
due to operating in low growth markets and entering markets at inopportune times.
4.2 Change of growth before and after acquisitions: a micro-level analysis
To assess how firms managed their acquired business, Table 2 reports growth rates of the
acquired entity before and after the transaction. Table 2 also shows the size of the
acquired business in terms of revenues in different countries and segments and stock
performance measured by total returns to shareholders (R). Total returns to shareholders
combine the change in share prices and dividend payments. The acquisition strategies
differed in that ING focused on less frequent but larger acquisitions compared to Generali
and AXA. Concerning the change in growth after acquisitions, we observe a general
decline of growth rates by 0.4%. Generali’s external growth strategy led to 1.5% less
growth after business was acquired, whereas AXA managed to enhanced growth rate on
average by 0.5%.
(Insert Table 2)
The correlation between stock performance and the change of growth is
significant and positive only in the case of ING. Assessing the implications for
shareholder value creation based on individual transactions proves to be challenging, as
companies conduct several transactions at the same time.
4.3 Growth and shareholder value creation
After identifying the components of growth, we focus on the interrelation between
organic growth and shareholder value creation. The change in share prices and dividend
14
payments determine the total return to shareholders (Rit), which measures shareholder
value creation. Following Srinivasan and Hanssens (2009), the first step is to separate
expected and unexpected components of stock returns, as various firm-specific and
macroeconomic factors could influence stock returns, which would bias any analysis on
the impact of growth on value creation. For a large sample of firms and different
industries, Fama and French’s (1996) three-factor model or the extended four-factor
model by Carhart (1997) are widely accepted methods to decompose stock returns into
expected and unexpected components. The three-factor model explains stock returns by
market excess returns (stock market returns minus risk-free rate), differences in firm size
and valuation levels measured by market-to-book ratios. Accordingly, the three and four-
factor model account for cross-sectional differences in stock returns. In our study, cross-
sectional differences are not essential, as we focused on three companies in the same
industry that were of similar size and had similar valuation levels.5
Nevertheless, macroeconomic factors might affect stock returns; therefore, the
arbitrage pricing model (APM) that controls for unexpected macroeconomic shocks
provides the theoretical basis of our approach. In particular, Chen, Roll, and Ross (1986)
used unexpected changes in oil prices, industry production (IP t), term structure (TSt)6,
inflation rates (IRt), and risk premium (RPt)7 to control for macroeconomic shocks. In
addition, Chen et al. (1986) incorporated the stock market return (RtM) to capture the
5 We also estimated a three and four-factor model - but due to the low number of firms, market-to-book,
size and the stock market momentum are insignificant. Results are available from the authors on request.
6 The term structure is defined as spread, namely the difference between the yield of ten-year government
bonds and the three-month Treasury bill rate.
7 The risk premium refers to the difference between the average yield of Aaa ranked (rated by Moody’s)
corporate bonds and Baa ranked corporate bonds.
15
systematic market risk. Consequently, we used the same set of variables as Chen et al.
(1986) – except oil price shocks, which do not seem to affect the insurance industry. To
identify unexpected changes in macroeconomic variables, we specified autoregressive
integrated moving average (ARIMA) models for each time series and forecasted the
respective macroeconomic variable. The residuals of the ARIMA models reflect the
unexpected macroeconomic shock. Based on our panel dataset covering eleven years, we
ran regressions that link company’s value creation Rit to the performance of the European
stock market index RtM (EuroStoxx) and unexpected changes in the macroeconomic
environment Xjt (IPt, TSt, IRt, RPt). Besides unexpected inflation, Chen et al. (1986) also
included expected inflation to control for the so-called Fisher effect, which describes the
impact of expected inflation on asset prices. Regression equation (4) defines the APM for
our sample based on which abnormal returns (ARit) can be defined as observed return
minus expected stock returns given the information available at time t labelled Ω t.8
(4)
(5)
We estimated this regression model using panel OLS and ran Ramsey RESET
tests to detect omitted variables or non-linearities. The Ramsey RESET test does not
indicate any omitted variable bias or hidden non-linear relationships. In addition, the
8 An alternative approach would be to use a Buy and Hold Abnormal Return (BHAR), which refers to
aggregating our annual abnormal returns to cumulated abnormal returns. As our study is limited to three
companies, aggregating abnormal returns would reduce our observations to three BHARs, and thus we
would loose a considerable amount of information (Barber & Lyon, 1997).
16
Breusch-Pagan heteroscedasticity test did not reject the null hypothesis of
homoscedasticity, and thus our model fulfils the assumptions of OLS regressions.
Dekimpe and Hanssens (2000) and Pauwels, Silva-Risso, Srinivasan, and
Hanssens (2004) contended that using a single-equation approach does not model the
marketing – value creation relationship adequately, as it only captures a one-directional
causal relation. In particular, the impact of shareholder value (the dependent variable) on
management decisions including marketing related decisions is not considered in a
single-equation approach. Persistence modelling based on vector autoregressive (VAR)
models captures the complex interrelation between abnormal stock returns (AR it), organic
and external revenue growth . In particular, companies with strong share price
performance tend to conduct more M&A, as they can use their own overvalued stock as
acquisition currency (Shleifer & Vishny, 2003). In addition, there could be an impact of
past performance on organic revenue growth through reputation effects. Consequently,
we specified the following panel VAR model and tested for Granger causality. As our
investigation period spans eleven years, specifying more than one time lag (t-1) would
limit our sample size considerably; hence, we used the following VAR specification with
one lag.
(6)
Table 3 shows that organic revenue growth influences performance (p-value
0.047), but past performance does not affect organic revenue growth (p-value 0.377) or
external revenue growth (p-value 0.406).
(Insert Table 3)
17

Apparently, organic growth is more predictable (higher adjusted R-squared) and
follows a long-term trend. Interestingly, companies with prior acquisitions tend to acquire
more in future. Past stock performance does not affect organic or external growth, which
has interesting implications. Firms with bad past stock performance could achieve
organic growth, which would in turn boost future stock performance. Besides testing for
causality, the VAR detects dynamic relationships. The impulse response functions (Fig.
3) indicate whether the impact on the unexpected total return to shareholders (AR it) is
driven by higher organic or external revenue growth.
(Insert Fig. 3)
Based on the impulse response functions (see Fig. 3), 1% additional organic
revenue growth triggers an increase in shareholder value of 1.8% one year afterwards.9
The effect declines to 0.3% two years after the increase in organic revenue growth, but
the cumulated impact over a five-year period reaches 2.3%. Additional organic revenue
growth had a pronounced and long-lasting impact on shareholder value, whereas external
revenue growth did not contribute to value creation. Therefore, our findings support
Meer’s (2005) contention that organic revenue growth is the main value driver.
From a theoretical perspective, our findings can be supported. With regard to the
theoretical link between revenue growth rates and shareholder value, we argue that
shareholder value reflects the net present value of future cash flows. Ceteris paribus,
higher revenue growth rates enhance cash flows and contribute directly to shareholder
value creation. Moreover, our findings support the ‘Merger Paradox’ literature (Andrade,
Mitchell, & Stafford, 2001) that showed that acquiring firms exhibit negative or at best
9 Using a three-factor model, the impact of organic growth on shareholder value would be 2.4% compared
to 1.8% based on our APM model. The difference is not significant.
18
insignificant abnormal returns after acquisitions. These findings were based on event
studies that capture the abnormal market response triggered by merger announcements.
Our methodology differs from event studies in that we measure the impact of M&A on
revenue growth rates, which in turn drives shareholder value. From a theoretical
perspective, several studies explain the ‘Merger Paradox’ with the principal agent theory.
Managers may conduct mergers to fulfil their own aims, for instance building their
empire or maximizing their short term bonus, even if shareholders suffer losses (Shleifer
& Vishny, 1988).
5. Conclusions
Our main contribution is a definition of organic growth and developing a method to
decompose revenues. The revenue decomposition can isolate organic revenue growth,
which is of particular interest because of the central role of marketing in fostering organic
growth. Based on the decomposed revenues, persistence modelling uncovers the impact
of external and organic revenue growth on shareholder value. The model could be
extended by adding one additional equation that relates marketing assets and metrics to
the components of growth and stock performance. Consequently, the study provides a
framework which could be applied to other industries and time periods.
Referring to the three insurance companies analysed, the findings indicate that
external growth accounts for 82% of the total growth of ING and 70% of AXA’s growth
yet only 44% for Generali. Apart from isolating organic and external revenue growth, we
detected that exchange rate effects play a minor role in the long-term, as currency
19
fluctuations offset previous movements. Nevertheless, market timing is crucial, as ING
suffered from entering the US market in 2000 at the peak of the market.
Finally, the persistence model quantifies the impact of organic and external
revenue growth on shareholder value creation. Interestingly, only organic revenue growth
has a significant and pronounced effect on shareholder value. Adding 1% more organic
revenue growth increases shareholder value by 2.3% in the long-run. In contrast, external
revenue growth fails to contribute to value creation. This finding underlines the
importance of organic growth and marketing for shareholder value creation.
Restricting our analysis to three companies in the insurance industry is an
important limitation. Apart from providing findings for the insurance industry, which
stress the dominance of external growth but also the positive impact of organic growth on
shareholder value creation, our method could be applied to other industries. Hopefully,
future research will use the growth decomposition technique described here over a broad
sample of firms and economic conditions to isolate external and organic growth and their
impact on value creation.
Acknowledgements
We thank the editor Donald Lehmann, the area editor and the two reviewers for their
valuable comments that helped to improve our paper considerably. We also thank David
Boughey for his comments.
20
References
Anderson, E. W., Fornell, C., & Mazvancheryl, S. K. (2004). Customer satisfaction and
shareholder value. Journal of Marketing, 68(4), 172–185.
Andrade, G., Mitchell, M., & Stafford, E. (2001). New evidence and perspectives on
mergers. Journal of Economic Perspectives, 15(2), 103–120.
Andre, P., Kooli, M., & L'Her, J. F. (2004). The long-run performance of mergers and
acquisitions: Evidence from the Canadian stock market. Financial Management,
33(4), 27-43.
Barber, B., & Lyon, J. D. (1997). Detecting long-run abnormal stock returns: The
empirical power and specification of test statistics. Journal of Financial
Economics, 43(3), 341–372.
Beijerse, R. P. (2000). Knowledge management in small and medium-sized companies:
knowledge management for entrepreneurs. Journal of Knowledge Management,
4(2), 162-179.
Bejou, D., Ennew, C. T., & Palmer, A. (1998). Trust, ethics and relationship satisfaction.
International Journal of Bank Marketing, 16(4), 170-175.
Carhart, M. M. (1997). On persistence in mutual fund performance. Journal of Finance,
52(1), 57-82.
Chen, N., Roll, R., & Ross, S. (1986). Economic forces and the stock market. The
Journal of Business, 59(3), 383-403.
Cools, K., & Van de Laar, M. (2006). The performance of acquisitive companies. In:
Duffhues, P. & Renneboog, L. (Eds.), Advances in corporate finance and asset
pricing (pp. 77-104). Elsevier.
21

Crosby, L. A., & Stephens, N. (1987). Effects of relationship marketing on satisfaction
retention, and prices in the life insurance industry. Journal of Marketing
Research, 24(4), 404-411.
Dalton, D. R., & Dalton, C. M. (2006). Corporate growth. Journal of Business
Strategy, 27(2), 5-7.
Day, G. S. (2003). Feeding the growth strategy. Marketing Management, 12(6), 15-21.
Day, G. S., & Fahey, L. (1988). Valuing market strategies. Journal of Marketing, 52(3),
45-57.
Dekimpe, M. G., & Hanssens, D. M. (2000). Time series models in marketing: Past,
present and future. International Journal of Marketing, 17(2-3), 183-193.
Dunis, C.L., & Klein, T. (2005). Analysing mergers and acquisitions in European
financial services: An application of real options. European Journal of
Finance, 11(4), 339-355.
Eisenhardt, K. M. (1989). Building theories from case study research. Academy of
Management Review, 14(4), 532-550.
Fama, E. F., & French, K. R. (1996). Multifactor explanations of asset pricing anomalies.
Journal of Finance, 51(1), 55-84.
Glaser, B. G., & Strauss, A. L. (1967). The discovery of grounded theory: Strategies for
qualitative research. New York: Aldine.
Hess, E. D. (2006). Defining and measuring organic growth. In: Hess, E. D. & Kazanjian,
R. K. (Eds.), The search for organic growth (pp. 103-123), Cambridge:
Cambridge University Press.
22
Kautz, K., & Thaysen, K. (2001). Knowledge, learning, and IT support in a small
software company. Journal of Knowledge Management, 5(4), 349-357.
Keet, P. O., & Mercer, A. (1998). The direct marketing of insurance, European Journal
of Operational Research, 109(3), 541-549.
Lynch, R. (2006). International acquisition and other growth strategies: Some lesson
from food and drink industry. Thunderbird International Business Review, 54(5),
605-622.
McNamara, G. M., Haleblain, J. J., & Johnson, D. B. (2008). The performance
implications of participating in an acquisition wave; early mover advantages,
bandwagon effects, and the moderating influence of industry characteristics
and acquirer tactics. Academy of Management Journal, 51(1), 113-130.
Meer, D. (2005). Enter the “Chief Growth Officer”: Searching for organic growth.
Journal of Business Strategy, 26(1), 13-17.
Pauwels, K., Silva-Risso, J., Srinivasan, S., & Hanssens, D. M. (2004). New products,
sales promotions and firm value, with application to the automobile industry.
Journal of Marketing, 68(4), 142–156.
Pecotich, A., Laczniak, G. R., & Inderrieden, E. J. (1985). Growth versus retrenchment
strategies in marketing: The Australian experience. International Journal of
Research in Marketing, 2(4), 273-287.
Rao, R. K. S., & Bharadwaj, N. (2008). Marketing initiatives, expected cash flows, and
shareholders’ wealth. Journal of Marketing, 72 (1), 16-26.
Rappaport, A. (1998). Creating shareholder value (2nd ed.) New York: The Free Press.
23

Shleifer, A., & Vishny, R. W. (2003). Stock market driven acquisitions. Journal of
Financial Economics, 70(3), 295-311.
Shleifer, A. & Vishny, R. W. (1988). Value maximization and the acquisition
process. Journal of Economic Perspective, 2, 7-20.
Srinivasan, S., & Hanssens, D. M. (2009). Marketing and firm value: metrics, methods,
findings, and future directions. Journal of Marketing Research, 46, 293-312.
Srivastava, R. K., Shervani, T. A., & Fahey, L. (1999). Marketing, business processes,
and shareholder value: an organisationally embedded view of marketing activities
and the discipline of marketing. Journal of Marketing, 63(Special Issue), 168-179.
Stremersch, S., & Tellis, G. J. (2004). Understanding and managing international growth
of new products. International Journal of Research in Marketing, 21(4), 421-438.
SwissRe Sigma studies (1995-2007). World insurance in 1995-2007.
24

Table 1Decomposition of revenue growth, 1995-2005.
Panel A: Decomposition of revenue GWP in EUR millions
AXA Generali INGInitial business in 1995 20,262 16,358 10,309Momentum of the initial business 17,966 21,505 10,843M&A and divestitures 22,666 14,874 22,928Momentum of M&A /divestitures 13,538 5,021 6,214Exchange rate effect -391 371 -8,063Out or underperformance -2,689 3,366 3,648Current business in 2005 71,743 61,495 45,880Panel B: Organic growth rates - including the momentum of M&A and divestituresOrganic growth 7.5% 9.4% 9.4%External growth 5.9% 4.7% 10.4%Exchange rate effect 0.0% 0.1% -3.6%Panel C: Organic growth rates - excluding the momentum of M&A and divestituresOrganic growth 4.0% 7.8% 6.6%External growth 9.5% 6.2% 13.2%Exchange rate effect 0.0% 0.1% -3.6%Total growth rates 13.5% 14.2% 16.1%
25
Table 2Growth before and after acquisitions.
Panel A: AXAGrowth
Year Target Country Segment Size Before After Change R1995 National Mutual Life Association of Australasia Australia Life 151 21% 16% -5% 37%1995 National Mutual Life Association of Australasia New Zealand Life 14 5% 1% -3% 37%1995 National Mutual Life Association of Australasia Hong Kong Life 34 17% 11% -6% 37%1996 National Mutual Life Association of Australasia Australia Life 1814 16% 9% -7% 7%1996 National Mutual Life Association of Australasia New Zealand Life 172 1% 0% -2% 7%1996 National Mutual Life Association of Australasia Hong Kong Life 404 11% 14% 2% 7%1997 UAP France Life 6179 15% 18% 3% 45%1997 UAP UK Life 2347 22% 30% 7% 45%1997 UAP Germany Life 2331 12% 4% -8% 45%1997 UAP Belgium Life 626 21% 29% 8% 45%1997 UAP Other Life 1618 22% 15% -7% 45%1999 Guardian Royal Exchange UK Life 1046 -14% 1% 15% 13%2000 Nippon Dantai Life Japan Life 3132 -3% -3% 1% 17%1997 UAP France Non-life 2569 2% 4% 2% 45%1997 UAP Germany Non-life 2904 1% 2% 1% 45%1997 UAP Other Non-life 2254 5% 11% 6% 45%1997 UAP Transnational Non-life 1414 3% 2% -1% 45%1998 Royale Belge Belgium Non-life 927 6% 10% 4% 77%1999 Guardian Royal Exchange UK Non-life 1311 14% 13% -2% 13%Panel B: Generali1997 Leumi Insurance Holding (Migal group), Israel Rest of world Life 336 12% 7% -5% 53%1998 Aachener und Münchner Beteiligung Germany Life 5038 4% 2% -2% 71%1998 Aachener und Münchner Beteiligung France Life 874 18% -6% -24% 71%1999 Caja de Ahorro y Seguro Rest of world Life 260 -5% 7% 11% -12%
26
1999 Secura Allgemeine / Secura Leben Switzerland Life 165 5% 5% -1% -12%2000 INA Italy Life 1496 19% 14% -6% 37%1997 Leumi Insurance Holding (Migal group), Israel Rest of world Non-life 336 3% 2% -1% 53%1998 Aachener und Münchner Beteiligung Germany Non-life 3310 2% 4% 2% 71%1998 Aachener und Münchner Beteiligung France Non-life 262 4% 7% 3% 71%1999 Caja de Ahorro y Seguro Rest of world Non-life 260 5% 12% 8% -12%1999 Secura Allgemeine / Secura Leben Switzerland Non-life 165 4% 4% 0% -12%2000 INA Italy Non-life 2043 8% 5% -3% 37%Panel C: ING1997 Iowa USA Life 3331 3% 4% 1% 41%2000 Reliastar USA Life 12137 9% 13% 3% 44%2000 Reliastar Asia/Pacific Life 1506 12% 13% 2% 44%2000 Reliastar S. America Life 3015 11% 15% 4% 44%2001 Tiel Utrecht to De Goudse Netherlands Life 135 3% 3% -1% -31%2000 Reliastar Asia/Pacific Non-life 167 12% 13% 2% 44%2001 Tiel Utrecht to De Goudse Netherlands Non-life 135 12% 6% -6% -31%2001 Acquisition of Seguros Comercial America Mexico Non-life 2262 20% 8% -11% -31%Panel D: Correlations
All AXA Generali INGStock performance - change in growth rate -4.7% 7.8% -50.6% 82.9%Average change of growth rates -0.4% 0.5% -1.5% -0.8%Average size of acquired business 1756 1645 1212 2836Note: The total return to shareholders labelled R refers to the annual change in share prices and dividend payments. AXA's acquisition of MONY in 2005 was excluded, as the acquisition occurred at the end of the investigation period. Generali's acquisition of Le Continent Group in 2004 was excluded due to the lack of appropriate data. Size refers to the acquired revenue in EUR millions.
27
Table 3Persistence modelling using a vector autoregression.
Equations of VAR – dependent variablesARit Oit Eit
ARit-1 -0.0987 (0.543)
0.0296(0.377)
-0.7055(0.406)
Oit-1 1.7792**(0.047)
0.2269(0.220)
5.8479(0.212)
Eit-1 0.0155(0.282)
-0.0015(0.616)
0.3341***(0.000)
Constant -0.1306(0.115)
0.0571***(0.001)
-0.3066(0.479)
Adjusted R2 0.19 0.37 0.00Observations 30 30 30
P-values in parentheses* p<.1, ** p<.05, *** p<.01
28

Fig. 1. Conceptual framework.
29
No direct impact of marketing
Limited impact of marketing
Working capital (Rao & Bharadwaj, 2008).
Winning and retaining customers (Day & Fahey, 1988).
Shareholder value
NPV of future cash flow
Cash flow
Cost of capital
Reduction of risk and volatility of cash flows (Rappaport, 1998; Srivastava et al., 1998).Acceleration of cash flows (Rappaport, 1998).
Cash flow consequences of marketing (Anderson et al., 2004).Enhancement of cash flows (revenues, costs, working capital and fixed investments) (Rappaport, 1998).
Growth
ROIC
External growth
Currency effect
Organic growth
Current markets
New markets
Business processes (Srivastava et al., 1999).Marketing assets and action metrics (Srinivasan & Hanssens, 2009).
FinanceM&A
Macro-factors
Direct impact of marketing

Fig. 2. Cumulated and annual exposure of AXA’s US business to exchange rate effects.
30
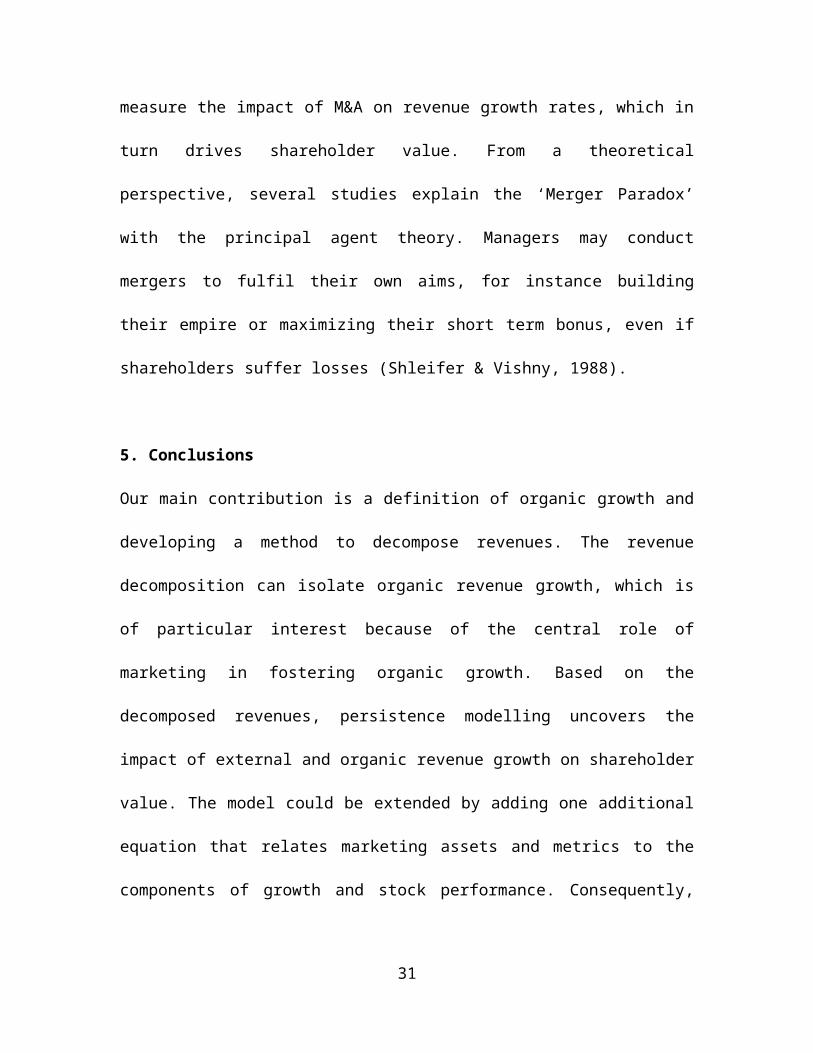
Fig. 3. Impulse response functions.
31
Appendix
Definition of variables and data sources.
Variable Definition Data sourceGt
d Reported revenues GWP (gross written premiums) in domestic currency. We adjust GWPs for unit-linked products (see below)
Annual reports, segment reports (country level and segment level)
, , Annual growth rate of revenues (gross written premiums) in domestic currency are defined as the log ratio of current and past revenues; hence, we use log returns to determine growth rates.
See components of equation (1)
Otd Revenues from the initial business portfolio
are regarded as organic revenues. Based on equation (2), organic revenues in domestic currency grow over time with market growth rates and are influenced by exchange rate changes.
See components of equation (2)
Etd We define revenues from external sources
(M&A, divestitures) as the revenue initially acquired or sold and the subsequent growth of acquired or sold business units based on market growth rates.
See components of equation (3)
Std/f Exchange rate (spot market) in domestic
currency (d) for one unit of the respective foreign currency (f). We used the average exchange rate based on monthly data for the given year.
Datastream
ηtf Market growth rate in the respective local
currency (f).SwissRe Sigma reports on the world insurance market (1995-2007)
Dt Dummy variable that indicates whether the company conducts M&A or a divestiture in period t.
Mergermarket, annual reports
Atf Acquired or sold revenues in the respective
local currency (f). We allocated bought (sold) revenues according to business segments (life and non-life insurance) and countries affected.
Annual reports, company presentations, analysts’ reports, reports of target firm
Rit The total return to shareholder combines the annual change in share price (capital gain) and dividend payments.
Datastream
RtM Return of the EuroStoxx performance index,
which includes dividend payments. The EuroStoxx serves as benchmark for
Datastream
32

assessing systematic risk based on the capital asset pricing model (CAPM).
IPt Annual growth of industrial production in the respective home market.
Datastream
TSt The term structure of interest rates (spread) is defined as long-term yield based on 10-year government bonds minus short-term yield based on three-month treasury bills.
Datastream
IRt Inflation is based on the annual change of the consumer price index in the respective home market.
Datastream
RPt The risk premium is defined as the difference in yields of Baa and Aaa rated corporate bonds (Moody’s).
Datastream
Adjustments for unit-linked products
Unit-linked products combine an insurance policy with an associated asset and can be
regarded as a life insurance policy based on mutual funds. The contract is expressed in
units and unit prices, which depend on the market value of the underlying assets. These
rather new life insurance products are usually not included in revenue measures like gross
written premiums (GWP), but companies report unit-linked products in the notes of
annual reports and adjust GWP accordingly. For instance, AXA reported 157 billion FF
in GWPs in 1995 and corrected their reported GWP by 9.7 billion FF because of unit-
linked products. Accordingly, we use adjusted GWP to measure revenue growth of
insurance companies. The main difference between a standard life insurance policy (with-
profits policy) and a unit-linked product is that the insurance company can invest the
premium in any product in the case of a with-profits policy. A unit-linked product implies
that premiums are invested in a specific asset (e.g. a mutual fund selected by the
customer).
33