organic matter quantity, quality and maturity studies of
TRANSCRIPT

Journal of Environment and Earth Science www.iiste.org
ISSN 2224-3216 (Paper) ISSN 2225-0948 (Online)
Vol.4, No.23, 2014
118
Organic Matter Quantity, Quality and Maturity Studies of the
Paleocene Ewekoro Formation, Southwestern Nigeria
Henry Madukwe
Department of Geology, Ekiti State University, Ado-Ekiti, Nigeria
Email: [email protected]
Abstract
Organic matter quantity, quality and maturity studies was carried out on the Paleocene Ewekoro Formation to
assess its source rock potentiality using organic geochemical and petrographic techniques. Organic richness
assessment based on Total Organic Carbon content (TOC), Genetic Potential, Soluble Organic Matter (SOM),
hydrocarbons generated before pyrolysis (S1) and residual petroleum potential (S2) indicates that the carbonate
facies of the Paleocene Ewekoro Formation are organic matter lean and has very poor hydrocarbon generation
potential. Type of Organic Matter evaluation using hydrogen and oxygen indices, plot of HI against Tmax and S2/
S3 ratio shows that they are predominantly kerogen type IV and some type III; of terrestrial organic matter, a
characteristic of oxic depositional milieu. Maturity studies presents their status as immature or over mature with
low level of convertibility to hydrocarbons. S2-TOC cross-plot indicates that the organic matter is composed
mainly of ‘dead’ organic carbon with no potential for hydrocarbon generation.
Keywords: Organic matter, kerogen, source rock, hydrocarbon
1. Introduction
Organic geochemical modelling is applicable in the study of origin, migration, generation, accumulation, and
alteration of petroleum (Tissot & Welte, 1984). They defined petroleum source rocks as rocks that are capable of
generating petroleum given the right maturity. The depositional controls on organic carbon accumulation in
carbonate systems are similar to clastic systems, but differs in that carbonate systems can create the
physiogeographic restriction necessary for the development of anoxia and enhanced preservation of organic
matter by their response to rapid relative sea-level rise. The search for crude oil and natural gas is a costly and
risky enterprise, after finding most of the easily detectable reservoirs in the readily accessible areas, hydrocarbon
exploration is now proceeding into frontier areas. The Benin basin in southwestern Nigeria is one of the frontier
areas that has the potential for hydrocarbon production. Many of the world's most prolific source rocks are
developed in marine carbonate depositional systems. Although they constitute a small percentage of all
carbonate rocks, organic-rich, fine-grained carbonate rocks are widespread in both time and space and are the
probable source of 30-40% or more of the petroleum reserves of the world (Jones, 1984). The Ewekoro
limestone in Ogun State, southwestern Nigeria is used as raw material for cement production, this present
inquisition assesses the organic facies and source rock potential of the carbonate facies of the Ewekoro formation.
2. General geology The evolution of the Benin basin is generally believed to be due to rifting phenomenon associated with the
separation of the mega-continent called Gondwanaland. According to (Agagu, 1985), the stratigraphy in most
parts of the basin is dominated by alternating sands and shales with minor proportion of limestone. The Ewekoro
Formation is one of the formations deposited in the Benin Basin (also known as Dahomey Basin or Dahomey
Embayment) and assigned Paleocene age based on flora and fauna. The Ewekoro Formation consists of thick
fossiliferous limestone. Adegoke (1977), described the formation as consisting of shaly limestone about 13m
thick which tends to be sandy and divided into three microfacies.
Detailed stratigraphy of the basin has been delineated by several workers (Jones & Hockey, 1964;
Adegoke, 1969; Ogbe, 1970; Billman, 1976; Ako et al., 1980; Omatsola and Adegoke, 1981; Okosun, 1990).
However, there is still no unified stratigraphic system for the basin; there are still geological polemics about age
and lithological classifications.
Table 1 shows the lithostratigraphy from the oldest to the youngest according to (Jones & Hockey, 1964;
Omatsola and Adegoke, 1981; Agagu, 1985): the Cretaceous Abeokuta Group—made up of the Ise Formation,
Afowo Formation and Araromi Formation. Shallow marine Paleocene Ewekoro Formation deposited during
transgressive episode overlies the Abeokuta Group. The Ewekoro Formation is widespread covering a distance
of about 32km from Ghana, eastwards towards the eastern margin of the basin. It finally becomes fine grained
into the dominantly

Journal of Environment and Earth Science www.iiste.org
ISSN 2224-3216 (Paper) ISSN 2225-0948 (Online)
Vol.4, No.23, 2014
119
Table1. Stratigraphy of the Benin Basin
shelly Araromi formation which pinches out against the Western flank of Okitipupa ridge (Adegoke,
1969; 1977). The Akinbo Formation (Paleocene-Eocene) overlies the Ewekoro Formation. The Eocene Oshosun
Formation overlies the Akinbo Formation and Oshosun Formation is overlain by the regressive arenaceous Ilaro
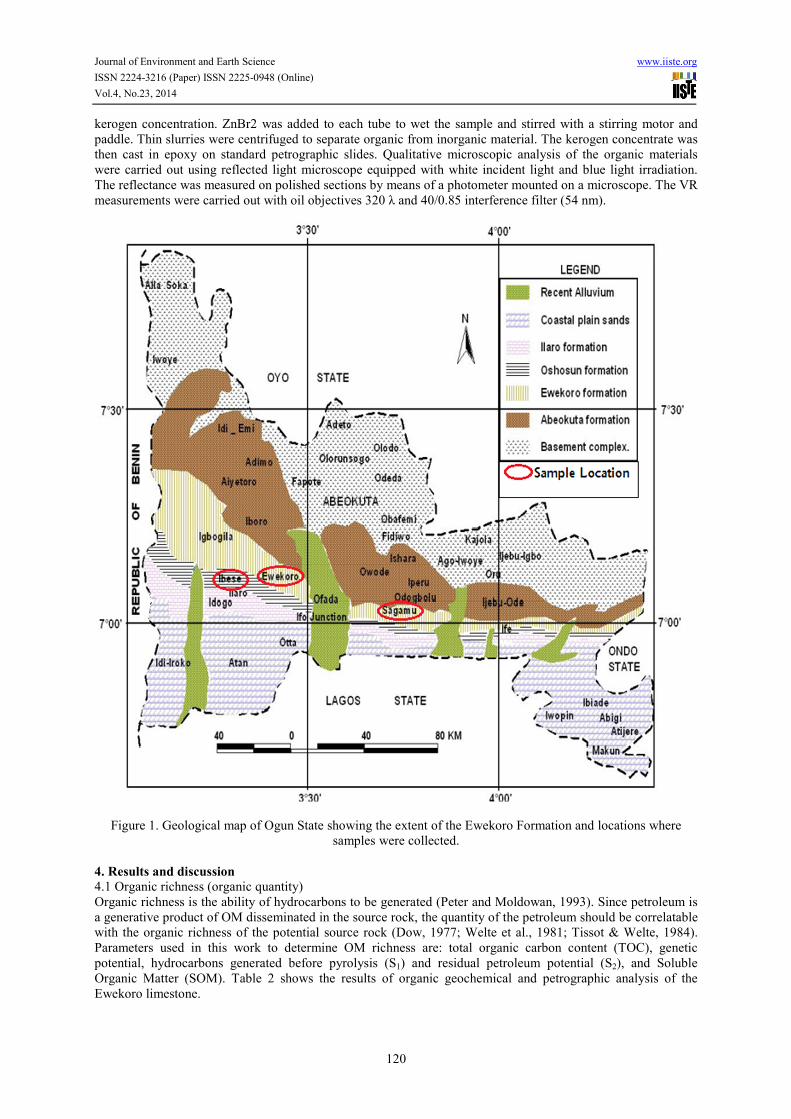
Formation. Figure 1 is a geological map of Ogun State showing the extent of the Ewekoro Formation and
locations where samples were collected.
3. Materials and methods
Limestone samples were collected from outcrops from Ewekoro, Shagamu and Ibese quarries. The samples were
taken for organic geochemical and petrographic analysis, to evaluate organic matter richness, maturity, type and
facies.
3.1 Total organic carbon content
The total organic carbon contents of the rock samples were determined on powdered samples, using LECO CS –
244 analyzer. About 100mg of the powdered sample was weighed in a special porous ceramic crucible and
placed on a cold sand bath. The weighed sample was then wetted with few drops of ethanol (to avoid sporadic
reactions) and treated with some drops of 10% diluted HCl until no further reactions occurred. The sample was
left on the sand bath for 12 hours at 800C in order to evaporate the excess water. Thereafter, the sample was
transferred into a laboratory vacuum oven where it was kept for another 12 hours at the temperature of 500C.
Before bringing the sample in the combustion chamber ca. 1g of copper turnings was added as catalyst. The
sample was then burnt in the LECO CS-244 analyzer, in the presence of oxygen at a temperature of about
13000C. The evolved gas was measured quantitatively and simultaneously by infrared detectors and recorded as
percent carbon. Before the samples were analyzed, the instrument was calibrated with standards of known
percent carbon.
3.2 Rock-Eval-Pyrolysis
According to Espitalie et al., (1977), Rock-Eval Pyrolysis offers a rapid method for the characterization of
kerogen types and for the determination of the maturity of organic matter. The measurement was carried out with
the Rock-Eval II device of Delsi Instrument. The weight of the sample to be evaluated was based on the total
organic carbon content of the sample. The samples were weighed in a metal crucible that was previously burnt
out at a temperature of 6000C under nitrogen atmosphere. The crucible and the content were then transported
automatically into the oven room and flushed for 3 minutes with helium to remove oxygen and CO2.
Subsequently the samples were placed in the oven for 3 minutes and heated to a temperature of 3000C. During
this assay, free and absorptive hydrocarbon and hydrocarbon-like compounds were volatilized and quantitatively
determined with the help of flame ionization detector (FID). This was then registered as the S1 – peak.
The oven temperature was again increased to 5500C at a programmed rate of 25
0C/minute and held
constant for 1 minute. At this second temperature phase (300-5500C) the solid organic matter was pyrolyzed and
the mobilized hydrocarbon and hydrocarbon like compounds were measured simultaneously and quantitatively
with FID as S2-peak. The CO2 produced during the temperature interval (300-3900C) was registered with the
thermal conductivity detector TCD as the S3-peak. The mobilized products of S1 and S2-peaks could be
normalized to the weight of rock (mgHC/g rock) and to the total organic carbon (mgHC/g TOC). Tmax-value
corresponds to the temperature at which the pyrolytic yield of hydrocarbon (S2-peak) reaches its maximum. The
Tmax – value increases with increasing maturity (Espitalie et al., 1985).
3.3 Vitrinite Reflectance
The sample was crushed and milled after which the sample was placed in a 50- mL polycarbonate test tube for
Journal of Environment and Earth Science www.iiste.org
ISSN 2224-3216 (Paper) ISSN 2225-0948 (Online)
Vol.4, No.23, 2014
120
kerogen concentration. ZnBr2 was added to each tube to wet the sample and stirred with a stirring motor and
paddle. Thin slurries were centrifuged to separate organic from inorganic material. The kerogen concentrate was
then cast in epoxy on standard petrographic slides. Qualitative microscopic analysis of the organic materials
were carried out using reflected light microscope equipped with white incident light and blue light irradiation.
The reflectance was measured on polished sections by means of a photometer mounted on a microscope. The VR
measurements were carried out with oil objectives 320 λ and 40/0.85 interference filter (54 nm).
Figure 1. Geological map of Ogun State showing the extent of the Ewekoro Formation and locations where
samples were collected.
4. Results and discussion
4.1 Organic richness (organic quantity)
Organic richness is the ability of hydrocarbons to be generated (Peter and Moldowan, 1993). Since petroleum is
a generative product of OM disseminated in the source rock, the quantity of the petroleum should be correlatable
with the organic richness of the potential source rock (Dow, 1977; Welte et al., 1981; Tissot & Welte, 1984).
Parameters used in this work to determine OM richness are: total organic carbon content (TOC), genetic
potential, hydrocarbons generated before pyrolysis (S1) and residual petroleum potential (S2), and Soluble
Organic Matter (SOM). Table 2 shows the results of organic geochemical and petrographic analysis of the
Ewekoro limestone.

Journal of Environment and Earth Science www.iiste.org
ISSN 2224-3216 (Paper) ISSN 2225-0948 (Online)
Vol.4, No.23, 2014
121
4.1.1 Total Organic Matter content (TOC)
It is known that adequate amount of organic matter, measured as percentage total organic carbon (TOC), is a
necessary pre-requisite for sediment to generate oil & gas (Cornford, 1986). The TOC is the weight percent of
carbon in the source rock and is measured as the amount of carbon dioxide produced when acid-leached rock
sample is combusted in the presence of oxygen. Average carbonate source rocks have TOC of 0.7% (Tissot, &
Welte, 1984). The studied Ewekoro limestone have TOC values between 0.04 and 0.23 (Av. 0.16), which
indicates that they are not rich in organic matter and have poor petroleum potential. According to (Leythaeuser,
1973; Reed, 1977; Clayton & Swetland, 1978), organic matter in outcrops that had previously been buried to
great depths, do undergo alterations because of sub-aerial exposure. Based on the study of the Upper Cretaceous
shales of Utah (Leythaeuser, 1973) concluded that there was 25% loss of TOC and 50% loss of soluble organic
matter with sub aerial weathering. Clayton & Swetland (1978), also showed that in the Permian Phosphoria
Formation, there was a 60% loss in TOC and 50% loss in the C15 hydrocarbon at depths ≤ 0.79m, but such
effects were hardly noticed below depths of 0.79m. Also large sedimentary basins may have different geothermal
heat flows in certain parts of the basin; timing of oil generation and the composition of the products may vary
even if the source rock is the same all over the basin (Rȕllkőtter, 1992). Though for this present inquisition, fresh
samples were sought for as much as possible, but based on the aforementioned observations, it is possible that
the OM values of the rocks studied may be higher if 100% fresh samples were utilized.
Table 2. Results of organic geochemical and petrographic analysis
4.1.2 Hydrocarbons generated before pyrolysis (S1)
This is the amount of hydrocarbon in the source rock already generated by geospheric maturity and merely
distilled out of the rock during pyrolysis. The value of S1 could be used to measure the source rock generative
potential (Peters, 1986). S1 minimum value for good source rocks is 1.0 mgHC/g dry rock (Pennsylvania State
geology survey, 2011). The S1 values range from 0.01 and 0.04 (Av. 0.01), which indicates that they have poor
generative potential (Peters and Cassa, 1994).
4.1.3 Residual Petroleum Potential (S2)
S2 represents the bitumen that would be generated if burial and maturation continued to completion and
decreases with increasing maturation (Leckie et al., 1988). The S2 corresponds to the hydrocarbons that would
evolve from the sample during the second programmed heating stage of pyrolysis. These hydrocarbons result
from cracking heavy hydrocarbon and from the thermal breakdown of kerogen (McCarthy et al., 2011). S2
minimum value for good source rocks is 5.0 mgHC/ dry rock (Pennsylvania State geology survey, 2011). S2
values for the samples range from 0 and 0.09 (Av. 0.02)—they have poor generative potential (Peters and Cassa,
1994).

Journal of Environment and Earth Science www.iiste.org
ISSN 2224-3216 (Paper) ISSN 2225-0948 (Online)
Vol.4, No.23, 2014
122
4.1.4 Genetic Potential (Pyrolytic or Potential Yield)
Genetic Potential is the summation of free hydrocarbon and hydrocarbon generation through thermal cracking
(Peter & Moldowan, 1993). It is derived from Rock Eval pyrolysis from the summation of S1 and S 2 values.
According to Dymann et al., (1996) a good source rock should have a GP of 2kgHc / ton of rock. GP values for
the Ewekoro limestone range from 0.01 and 0.13 (Av. 0.03). Classification based on Genetic Potential by Tissot
& Welte (1984), suggests no hydrocarbon source rock potential. A cross plot of S2 versus TOC, (Figure 2) also
indicates that the limestones are OM lean.
Figure 2. Kerogen quality
4.1.5 Soluble Organic Matter (SOM)
Soluble organic matter is used to determine the source rock potential, maturity and depositional environment.
The significant of this is that extraction and the determination of yield of SOM allow for identification of
hydrocarbon-rich sediment (Peter and Cassa, 1994). The SOM values range between 360 – 420 ppm (average
385 ppm). This shows that the limestone has a poor petroleum generation potential (Peter and Cassa, 1994).
4.2 Type of Organic Matter (Organic Matter Quality)
Many organisms contribute to the OM present in petroleum source rocks. Since these organisms differ in their
contents of lignin, carbohydrates, lipids, protein, resin, etc., the preserved organic matter exhibits parallel
diversity. Sedimentary, diagenetic, catagenetic and metagenetic processes modifies the original constituents
further. The diversity influences the convertibility of kerogen to petroleum: some being oil-prone or gas-prone,
while others are not convertible to petroleum (Dow, 1977). Quality organic materials must be present for a
geologic unit to be considered a potential source rock (Pennsylvania State geology survey, 2011). The
parameters used here for the evaluation of the type of OM are: hydrogen and oxygen indices (HI & OI), plot of
HI against Tmax and S2/ S3 ratio
4.2.1 Hydrogen and oxygen indices
Hydrogen index (HI) represents the hydrogen richness and oxygen index (OI) depicts the oxygen content of the
kerogen, both relative to the total organic carbon content (Snowdon, 1989). HI values for range from 0 and 180
mgHC/g TOC (Av. 30). Oxygen index values ranges between 20 – 150 mgCo2/g TOC, with an average of 52
mgCo2/g TOC. McCarthy et al., (2011) classified source rocks with HI between 50 and 200 as gas-prone.
According to McCarthy et al. (2011), the null values (HI) for the Ewekoro limestones (except for two samples)
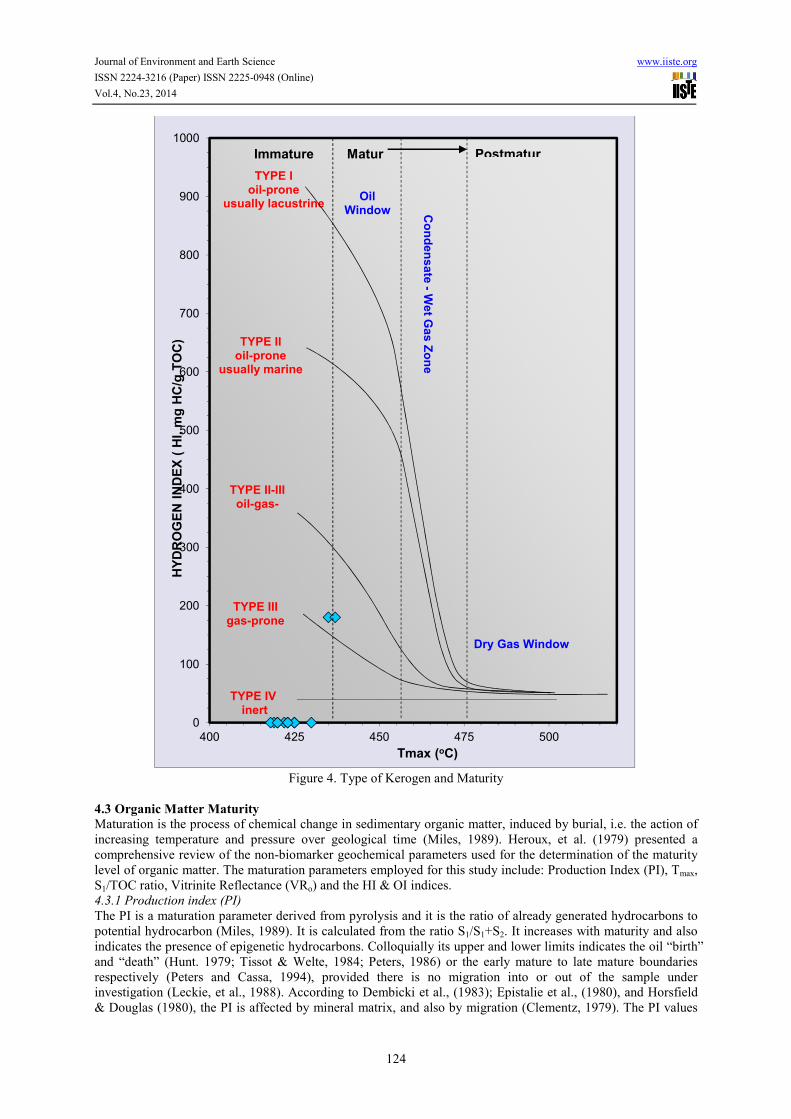
shows that the type of OM present (Type IV) cannot generate hydrocarbon. Figures 3 and 4 shows that they
contain kerogen type IV which indicates an oxic depositional milieu.
0
2
4
6
8
10
12
14
16
18
0.0 0.5 1.0 1.5 2.0 2.5 3.0 3.5 4.0 4.5 5.0RE
MA
ININ
G H
YD
RO
CA
RB
ON
PO
TE
NT
IAL
(S
2, m
g H
C/g
ro
ck)
TOTAL ORGANIC CARBON (TOC, wt.%)
TYPE IIoil-prone
Mixed TYPE II -
TYPE IIIgas-prone
OrganicLean
TYPE IVinert
TYPE Ioil-prone

Journal of Environment and Earth Science www.iiste.org
ISSN 2224-3216 (Paper) ISSN 2225-0948 (Online)
Vol.4, No.23, 2014
123
Figure 3. Type of Kerogen
4.2.2 S2/ S3 Ratio
This ratio is theoretically equivalent to the ratio HI/OI and useful for describing the kerogen type and the type of
hydrocarbon product likely to be expelled by a rock (Peters, 1986; Leckie, et al., 1988; Peters & Cassa, 1994).
S2/S3 ratio for the limestones range from 0 to 2 (Av. 0.3), which is of Type IV OM—it is inert and cannot
generate hydrocarbon (Weber and Green, 1981; Peters, 1986; Peters & Cassa, 1994).
Journal of Environment and Earth Science www.iiste.org
ISSN 2224-3216 (Paper) ISSN 2225-0948 (Online)
Vol.4, No.23, 2014
124
Figure 4. Type of Kerogen and Maturity
4.3 Organic Matter Maturity
Maturation is the process of chemical change in sedimentary organic matter, induced by burial, i.e. the action of
increasing temperature and pressure over geological time (Miles, 1989). Heroux, et al. (1979) presented a
comprehensive review of the non-biomarker geochemical parameters used for the determination of the maturity
level of organic matter. The maturation parameters employed for this study include: Production Index (PI), Tmax,
S1/TOC ratio, Vitrinite Reflectance (VRo) and the HI & OI indices.
4.3.1 Production index (PI)
The PI is a maturation parameter derived from pyrolysis and it is the ratio of already generated hydrocarbons to
potential hydrocarbon (Miles, 1989). It is calculated from the ratio S1/S1+S2. It increases with maturity and also
indicates the presence of epigenetic hydrocarbons. Colloquially its upper and lower limits indicates the oil “birth”
and “death” (Hunt. 1979; Tissot & Welte, 1984; Peters, 1986) or the early mature to late mature boundaries
respectively (Peters and Cassa, 1994), provided there is no migration into or out of the sample under
investigation (Leckie, et al., 1988). According to Dembicki et al., (1983); Epistalie et al., (1980), and Horsfield
& Douglas (1980), the PI is affected by mineral matrix, and also by migration (Clementz, 1979). The PI values
0
100
200
300
400
500
600
700
800
900
1000
400 425 450 475 500
HY
DR
OG
EN
IN
DE
X (
HI,
mg
HC
/g T
OC
)
Tmax (oC)
TYPE Ioil-prone
usually lacustrine
TYPE IIoil-prone
usually marine
TYPE II-IIIoil-gas-
Co
nd
en
sa
te -
We
t Ga
s Z
on
e
Dry Gas Window
Immature Postmatur
TYPE IIIgas-prone
TYPE IVinert
Matur
OilWindow

Journal of Environment and Earth Science www.iiste.org
ISSN 2224-3216 (Paper) ISSN 2225-0948 (Online)
Vol.4, No.23, 2014
125
for Ewekoro samples ranges between 0.25 – 1 (Av. 0.88). These values correspond to peak to late mature stage
(Miles, 1989; Peters and Cassa, 1994), meaning that they attained thermal maturity for oil but no oil was
generated, which may be due to the type (two types of organic facies) and quantity of organic matter.
4.3.2 S1/TOC ratio
The S1/TOC ratio (bitumen content) is the Normalized Oil Content and significant as an indicator of the
approach of the “oil window” and in conjunction with the Production Index (PI), enables the recognition of the
presence of migrated hydrocarbons (Babaie et al., 1992). S1/TOC ratios is between 4 and 80, with an average of
18.7. Only 2 samples have values >50 which corresponds to mature tight source rock (Jarvie and Tobey, 1999;
Jarvie and Baker, 1984), while the rest have ratios <50 indicating lean source rock (Jarvie and Baker, 1984); and
low or overmature source rock (Ruble, et al.). A cross plot of S1 versus TOC (Figure 5) reveals that whatever
hydrocarbon that might be present in the rock samples were indigenous without migration from outside source.
Figure 5. Plot of S1 versus TOC illustrating the indigenous nature of potential hydrocarbons in the Ewekoro
Formation. Modified from Al-Ameri, et al., (2011).
4.3.3 Tmax
This the temperature at which the pyrolytic yield of hydrocarbons from a rock sample reaches its maximum,
using Rock Eval pyrolysis and it is kerogen dependent. It is affected by mineral matrix (Epistalie et al.,1980;
Horsfield & Douglas, 1980); organic contamination (Peters, 1986); and migration (Clementz, 1979). Acording to
to Snowdon, (1995), the observed Tmax values from Rock Eval pyrolysis may be anomalous (depressed). The
lowest and highest Tmax values are 418 and 437 oC (Av. 425), which indicates that all the samples are thermally
immature (Peters and Cassa, 1994) except for one sample with Tmax value of 437 0C, which might be due to the
presence of type III organofacies. A plot of Hydrogen Index against Tmax (Figure 4) shows that the kerogens are
of Type IV and immature.
4.3.4 Vitrinite Reflectance (VRo)
It is a measure of the amount of light reflected by vitrinite present in the rocks organic component, it is used as
maturity indicator but dependent on kerogen type (Peter and Moldowan 1993). This parameter is based on the
change in the reflectance of polished vitrinite particles with increasing time and temperature. Increase in
reflectance are caused by the progressive aromatization of the kerogen with accompanying loss of hydrogen in
the form of hydrocarbon gases; the end product of the process is graphite (Miles, 1989). VRO values range from
0.13-0.25 %, (Av. 0.20)—they are thermally immature and a plot of Hydrogen Index (HI) against Vitrinite
Reflectance (Figure 6) also shows that the samples are immature. Also, figures 7 and 8 shows that the kerogen
are immature and has low level of convertibility to hydrocarbons.
4.3.5 Hydrogen (HI) and Oxygen indices (OI)
The Hydrogen Index (HI) can be used to indicate maturity if the kerogen type is known (Miles, 1989). The
Hydrogen Index is between 0 and 180 mg HC/g TOC (Av. 30), while Oxygen index 22 – 150 mg HC/g TOC
(Av. 52)—these OI values are less than 200 mg CO2/g rock and indicate that there is no intensive weathering or
mineral decomposition in analyzed rock samples (Jarvie and Tobey, 1999). According to Miles (1989), immature
Type III kerogen has HI ranges between 0-300 mg HC/TOC and OI values greater than fifty (>50) mgCo2/g
TOC are characteristics of immature kerogen. Using the HI and OI parameters, the limestone samples are
immature, although some of the OI values are below 50, this status could be either Late or post mature.

Journal of Environment and Earth Science www.iiste.org
ISSN 2224-3216 (Paper) ISSN 2225-0948 (Online)
Vol.4, No.23, 2014
126
5. S2-TOC cross-plot
Oil and gas potential can also be determined using the method of Dahl et al. (2003). This approach uses Rock-
Eval and TOC data in a simple S2-TOC cross-plot to determine the oil and gas potential of a specific source rock
section (Justwan & Dahl, 2005). The slope of the regression line represents the average hydrogen index of the
sample population. Often, the regression line does not intersect the origin and the intersection with the TOC-axis
represents the ‘dead’ organic carbon (Cornford 1998). Figure 9 shows that regression line did not intercept the
origin but intercepts the TOC-axis, which represents type IV inert kerogens with no hydrocarbon potential.
Figure 6. Kerogen Maturity based on Vitrinite Reflectance
0
100
200
300
400
500
600
700
800
900
1000
0.2 0.4 0.6 0.8 1.0 1.2 1.4 1.6 1.8 2.0 2.2
HY
DR
OG
EN
IN
DE
X (
HI,
mg
HC
/g T
OC
)
MEASURED VITRINITE REFLECTANCE in oil (%Ro)
Dry Gas Window
Immatur
Type Ioil-prone
usually lacustrine
Type IIoil-proneusually
Type IIIgas-prone
PostmatureMature
Type II - IIIoil -gas-prone
Oil Window
Co
nd
en
sa
te-W
et G
as
Zo
ne
Type IV

Journal of Environment and Earth Science www.iiste.org
ISSN 2224-3216 (Paper) ISSN 2225-0948 (Online)
Vol.4, No.23, 2014
127
Figure 7. Kerogen Maturity based on PI and Tmax
Figure 8. Kerogen Maturity based on PI and Vitrinite Reflectance

Journal of Environment and Earth Science www.iiste.org
ISSN 2224-3216 (Paper) ISSN 2225-0948 (Online)
Vol.4, No.23, 2014
128
Figure 9. S2-TOC cross-plot
6. Conclusions
Organic richness assessment indicates that the Paleocene Ewekoro limestone are organic matter lean and has
very poor hydrocarbon generation potential. Type of Organic Matter (Organic Matter Quality) evaluation shows
that they are predominantly kerogen type IV and some type III terrestrial organic matter, a characteristic of oxic
depositional milieu. Maturity studies on the kerogens presents their status as immature or overmature with low
level of convertibility to hydrocarbons. S2-TOC cross-plot indicates that the OM is composed mainly of ‘dead’
organic carbon with no potential for hydrocarbon generation. Thus, the Paleocene Ewekoro Formation is not a
good carbonate source rock.
Acknowledgement
The author wish to thank the management of Lafarge Cement quarry at Ewekoro and Shagamu; and also the
management of Dangote cement quarry at Ibeshe for their assistance. Dr. Mike Akaegbobi of University of
Ibadan is also acknowledged for his contribution to this study.
References Adegoke, O.S, (1969): Eocene Stratigraphy of Southern Nigeria. Extrait de memories du Bur Rech – Geol, Min.
No. 69, pp. 23-47.
Adegoke, O.S. (1977): Stratigraphy and Paleontology Western Nigeria. Bull. Of American Paleontology. Vol. 71,
No. 295, P. 1 – 379.
Agagu, 0.A. (1985): A geological guide to Bituminous sediments in Southwestern Nigeria. Unpublished Report,
Department of Geology University of Ibadan.
Ako, B. D., Adegoke, O. S. and Petters, S. W. (1980): Stratigraphy of the Oshosun Formation in South-Western
Nigeria. Jour. Min. Geol. v. 17, p. 97-106.
Al-Ameri, T.K., Jafar, M.S.A. and Pitman, J. (2011): Hydrocarbon Generation Modeling of the Basrah Oil Fields,
Southern Iraq. AAPG Search and Discovery Article #20116. p. 1- 48.
Babaie, H.A, Speed, R.C., Larue, D.K. and Claypool, G.E. (1992): Source rock maturation evaluation of
Barbados accretionary prism. Marine and petroleum Geology, 9. p. 623-632.
Billman, H. G. (1976): Offshore stratigraphy and paleontology of the Dahomey embayment. Proc. 7th Afri.
Micropal. Coll. Ile-Ife, p. 27-42.
Clayton, J.L. & Swetland, P.J. (1978): Sub aerial weathering of sedimentary organic matter. Geochim.
Cosmochim. Acta., 42, p. 305-312.
Clementz, D.M. (1979): Effect of oil and bitumen saturation on source rock pyrolysis. Am. Assoc. Petr. Geol.
Bull., 63, p.2227-2232.
Conford C. (1986): Source Rocks and Hydrocarbons of the North, Sea. In K.W. Glannic (ed.) Introduction to the
Petroleum Geology of the North Sea. Oxford U.K. p.197-236
Cornford, C. 1998. Source rocks and hydrocarbons of the North Sea. In: Glennie, K. W. (ed.) Petroleum Geology
of the North Sea; Basic Concepts and Recent Advances. Blackwell, Oxford, p. 376–462.
Dahl, B., Bojesen-Koefoed, J., Holm, A., Justwan, H., Rasmussen, E. & Thomsen, E. (2003): Analysing Rock
0
0.05
0.1
0.15
0.2
0.25
0 0.02 0.04 0.06 0.08 0.1
TO
C (
wt
%)
S2 (g HC/kg rock)

Journal of Environment and Earth Science www.iiste.org
ISSN 2224-3216 (Paper) ISSN 2225-0948 (Online)
Vol.4, No.23, 2014
129
Eval Pyrolysis S2 and TOC data for source rock property modelling. In: Book of Abstracts Part I, 21st
International Meeting of Organic Geochemistry, Krakow. Society of Research on Environmental Changes
“Geosphere”, Krakow, p. 307–308.
Dembicki H., Horsfield, B. & Ho, T,TY. (1983): Source Rock Evaluation by pyrolysis – Gas Chromatography.
AAPG Bulletin, v. 67, p. 1094-1103.
Dow, W. G. (1977): Kerogen studies and geological interpretations. Journal of Geochemical Exploration, 7: 79-
99.
Dymann, T. S., Palacos, J. G., Tysdal, R. G., Perry, W. J. And Pawlewicz, M. J. (1996): Source Rock Potential
of Middle Cretaceous Rocks in Southwestern Montana: AAPG Bulletin, v. 80, p. 1177-1184.
Espitalie J., Laporte J. L., Madec M., Marquis F., Leplat, P., Paulet J. and Boutefeu A. (1977): Methode rapide
de caracterisation des roches meres, de leur potential petrolier et de leur degre d'evolution. Rev. Inst. Fr. Per. 32,
23-42.
Espitalie, J., Deroo, G, and Marquis, F. (1985): Rock Eval pyrolysis and its Applications. Institut Français du
Pétrole no. 27299.
Espitalie, J., Madec, M. and Tissot, B. (1980): Role of mineral matrix in kerogen pyrolysis: Influences on
petroleum generation and migration. .AAPG Bulletin, 64, p.59-66.
Heroux, Y., Chagnon, A. and Betrand, R. (1979): Compilation and Correlation of major thermal maturation
indicators. AAPG Bulletin, 63 (12), p.2128-2144
Horsfield, B & Douglas, A.G. (1980): Influence of mineral on pyrolysis of kerogens. Geochem. Cosmichim.
Acta., 44, p. 1119-1131.
Hunt, J.M. (1995): Petroleum geochemistry and geology. W.H. Freeman and Company, New York, 743 pp.
Jarvie, D. M., and Baker, D. R. (1984). Application of the Rock-Eval III oil show analyzer to the study of
gaseous hydrocarbons in an Oklahoma gas well. 187th ACS National Meeting, St. Louis, MO, April 9–12.
Jarvie, D. M., and Tobey, M. H. (1999). TOC, Rock-Eval, or SR Analyzer Interpretive Guidelines. Humble, TX:
Humble Geochemical Services. Application Note 99-4.
Jones R. W. (1984): Comparison of Carbonate and Shale Source Rocks. In: AAPG Special Volumes: Petroleum
Geochemistry and Source Rock Potential of Carbonate Rocks. AAPG Spec. Vol., SG 18: p.163-180
Jones, H.A. & Hockey, R.D. (1964): The geology of part of S.W. Nigeria. Geological Survey of Nigeria Bulletin
No. (1)31 pp. 1-16.
Justwan, H. & Dahl, B. (2005): Quantitative hydrocarbon potential mapping and organofacies study in the
Greater Balder Area, Norwegian North Sea. In: Dore, A.G. & Vining, B.A. (eds) Petroleum Geology: North-
West Europe and Global Perspectives—Proceedings of the 6th Petroleum Geology Conference. p. 1317–1329.
Leckie, D.A., Kalkrueth, W.D. & Snowdon., L.R. (1988): Source rock potential and thermal maturity of Lower
Cretaceous Strata: Monk Pass Area, British Columbia. Am. Assoc. Petr. Geol. Bull., 72 (7), p. 820-838.
Leythaeuser, D. (1973): Effects of weathering on organic matter in shales. Geochim. Cosmochim. Acta. 37, p.
113-120.
McCarthy, K., Rojas, K., Niemann, M., Palmowsky, D., Peters, K., Stankiewicz, A. (2011): Basic Petroleum
Geochemistry for Source Rock Evaluation. Oilfield Review, 23, no. 2. p. 32-43
Miles, J.A. (1989): Illustrated glossary of petroleum geochemistry. Oxford Science Publication, Oxford
University Press, New York, 137pp
Ogbe, F.G.A (1970): Stratigraphy of strata exposed in Ewekoro quarry, Western Nigeria. In T.F.J Dessauvagie
and A.J. Whiteman (Editors), African Geology, University of Ibadan press. p. 305 – 324.
Okosun, E. A. (1990): A review of the Cretaceous stratigraphy of the Dahomey Embayment, West Africa.
Cretaceous Research, v. 11, p. 17-27.
Omatsola, M. E. and Adegoke, O. S. (1981): Tectonic evolution and Cretaceous Stratigraphy of the Dahomey
Basin. Jour. Min. Geol. v. 8, p. 30-137.
Pennsylvania State Department of Conservation and Natural Resources - The Pennsylvania Petroleum Source
Rock Geochemistry Database (2011): Available on:
<http://www.dcnr.state.pa.us/topogeo/econresource/oilandgas/marcellus/sourcerock-
index/sourcerock_rockeval/index.htm>
Peters K. E. (1986): Guidelines for evaluating petroleum source-rocks using programmed pyrolysis. Bull. Am.
Assoc. Pet. Geol. 70, 318-329.
Peters, K. E., and Moldowan. J. M. (1993): The Biomarker Guide, Interpreting molecular fossils in
Peters, K.E. and Cassa M.R. (1994). Applied source rock geochemistry. In: The Petroleum System – from Source
to Trap, Magoon L.B. and Dow W.G. (Eds.), AAPG Memoir, 60, 93-120. petroleum and ancient sediments,
Prentice Hall, 363 pp.
Reed, W.E. (1977): Molecular composition of weathered petroleum and comparison with its possible source.
Geochim. Cosmochim. Acta., 41, p. 237-247
Ruble, T., Drozd, R.J. and Heck, W.A - Practical Geochemical Methods to Assess Unconventional Reservoirs: A

Journal of Environment and Earth Science www.iiste.org
ISSN 2224-3216 (Paper) ISSN 2225-0948 (Online)
Vol.4, No.23, 2014
130
Case Study from the Permian Basin, Texas. Available on: http://www.wtgs.org
Rȕllkőtter, J. (1992): Encyclopedia of physical science and Technology. Academic Press Inc., New York, 7, p.
165-152
Snowdon L. R. (1989): Organic Matter Properties and Thermal Evolution. In: Short Course in Burial Diagenesis.
Edited by: Hutcheon, I. E. Mineralogical Association of Canada, Short Course Handbook 15, 39-40.
Snowdon L. R. (1995): Tmax suppression: Documentation and Amelioration. AAPG Bulletin, 79 (9), p.1337-
1348..
Tissot, B. & Welte, D. (1984). Petroleum Formation and Occurrence (2nd Ed.), Springer-Verlag Berlin, 699 pp.
Weber G. and Green J. (1981): “Guide to Oil Shale” National Conference of State Legislatures. Washington D.
C. USA., p. 21
Welte, D.H., Yukler, M.A., Radke, M. & Leythaeuser, D. (1981): Application of organic geochemistry and
quantitative basin analysis to Petroleum exploration. In: Origin and Chemistry of Petroleum (ed. By Gordon, A
and Zuckeramm, A.J). Pergamon Press, p. 67-88

The IISTE is a pioneer in the Open-Access hosting service and academic event management.
The aim of the firm is Accelerating Global Knowledge Sharing.
More information about the firm can be found on the homepage:
http://www.iiste.org
CALL FOR JOURNAL PAPERS
There are more than 30 peer-reviewed academic journals hosted under the hosting platform.
Prospective authors of journals can find the submission instruction on the following
page: http://www.iiste.org/journals/ All the journals articles are available online to the
readers all over the world without financial, legal, or technical barriers other than those
inseparable from gaining access to the internet itself. Paper version of the journals is also
available upon request of readers and authors.
MORE RESOURCES
Book publication information: http://www.iiste.org/book/
Academic conference: http://www.iiste.org/conference/upcoming-conferences-call-for-paper/
IISTE Knowledge Sharing Partners
EBSCO, Index Copernicus, Ulrich's Periodicals Directory, JournalTOCS, PKP Open
Archives Harvester, Bielefeld Academic Search Engine, Elektronische Zeitschriftenbibliothek
EZB, Open J-Gate, OCLC WorldCat, Universe Digtial Library , NewJour, Google Scholar