organic matter stocks in temperate forest soils
TRANSCRIPT

Lehrstuhl für Bodenkunde, Technische Universität München
Organic matter stocks in temperate forest soils:
Composition, radiocarbon age and spatial variability
Ingo Schöning
Vollständiger Abdruck der von der Fakultät Wissenschaftszentrum Weihenstephan für Ernährung, Landnutzung und Umwelt der Technischen Universität München zur Erlangung des akademischen Grades eines
Doktors der Naturwissenschaften (Dr. rer. nat.)
genehmigten Dissertation.
Vorsitzender: Univ.-Prof. Dr. Reinhard Mosandl
Prüfer der Dissertation: 1. Univ.-Prof. Dr. Ingrid Kögel-Knabner
2. Univ.-Prof. Dr. Ernst-Detlev Schulze,
Friedrich-Schiller-Universität Jena
3. Prof. Dr. Francisco González-Vila,
Universität Servilla/ Spanien
(schriftliche Beurteilung)
Die Dissertation wurde am 1. August 2005 bei der Technischen Universität München eingereicht und durch die Fakultät Wissenschaftszentrum Weihenstephan für Ernährung, Landnutzung und Umwelt am 14. Oktober 2005 angenommen.


SUMMARY I
Summary
In temperate forests, more than 60% of the total carbon reserves are located in forest
floor and mineral soil. The main objectives of this study were (1) to investigate the
composition and radiocarbon age of organic matter (OM) pools of different stability in
mineral soils, (2) to identify associations between iron oxides and specific carbon
species, and (3) to analyse the small scale spatial variability of soil organic carbon
(SOC) stocks. Composition, radiocarbon age and associations between iron oxides and
SOC were studied in various soil profiles under managed beech (Fagus sylvatica L.)
and spruce (Picea abies L.) forest sites along a European North-South transect. Soils
comprised Cambisols, Leptosols, Luvisols and a Phaeozem. Specific methods used were
particle size fractionation in combination with accelerator mass spectroscopy (AMS),
solid state 13C nuclear magnetic resonance (13C CPMAS NMR) spectroscopy and lignin
analysis (CuO-oxidation). Spatial variability of organic carbon (OC) stocks was studied
in a stone free Luvisol under a 10,000 m2 managed beech (Fagus sylvatica L.) forest
site located at Leinefelde, Germany. Starting from 9 randomly chosen primary stations,
substations in distances of 0.2, 0.6, 1.8, 5.4 and 16.2 m were sampled, resulting in a
total of 54 sampling points. At all sampling points, OC stocks in the litter and the
complete solum were determined. Variability of OC stocks was analysed by descriptive
statistics and variogram analysis.
Due to the high enrichment of OC and the high contribution of clay to the mineral soil,
OC in mineral soils was preferentially associated with clay fractions (<2 μm fractions).
In all horizons clay fractions contained more than 27% of the total C stock. Throughout
Cambisol and Luvisol profiles the contribution of OC in the clay fraction to the total OC
increased from 27-53% in the A horizons to 44-86% in B and E horizons. This suggests
that with increasing depth the magnitude of leaf and root litter incorporated into coarse
particle size fractions decreased. The OC in the 200-2000 μm fractions from all sites
and all depths had a percentage of modern carbon (pmC) of >100. They were enriched
in 14C owing to high inputs of recent material from leaves and roots. Clearly less active
material was associated with <2 μm and 2-20 μm fractions. This showed that the
particle size fractionation was capable to separate young and old OC fractions. The
pmC values were strongly decreasing with depth but the decrease was much more
pronounced in the fine fractions. <2 μm and 2-20 μm fractions of B and E horizons

SUMMARY II
from two Luvisols and one Cambisol revealed radiocarbon ages between 512 and 4745
years before present which indicated that the soil organic matter (SOM) in those
horizons was only little affected by the recent vegetation.
The structure of both, labile and stable SOM pools was dominated by alkyl C (14-48%)
and O/N-alkyl C (28-53%). Strongest resonances in 13C CPMAS NMR spectra of the
bulk soil samples and the particle size fractions appeared in the O/N-alkyl C region at
72 ppm and 105 ppm and were most probably assigned to C2, C3, C5 and C1 in
cellulose and non-crystalline polysaccharides. Further strong resonances occurred in the
alkyl C region at 30 ppm, typical for methylene in long chain aliphatic compounds. The
spectra of the coarse fractions had strong features of lignin and tannins with resonances
around 56, 130 and 150 ppm. The signals attributed to lignin and tannins decreased with
decreasing particle size, indicative of a complete decomposition and/or transformation
with a loss of the phenolic and aromatic structures. Although lignin is believed to be
highly recalcitrant, only low amounts of lignin were found in clay fractions. These
results pointed to stabilisation processes operating specifically on polysaccharides
(O/N-alkyl C) and alkyl C, but not on aryl C. Positive site specific relations were
obtained between the O-aryl C intensity and the pmC values at all sites. Fractions
containing the youngest C were enriched in O-aryl C, whereas the fractions with the
oldest C were depleted in O-aryl C. However, a correlation between pmC values and
O/N-alkyl C, alkyl C, aryl C or carbonyl C intensities in particle size fractions
throughout soil profiles could not be observed. This indicated that the long term
stabilisation of SOM was mainly controlled by the existence of various mechanisms of
protection offered by the soil matrix and soil minerals but not by the chemical structure
of the SOM itself.
In many 13C CPMAS NMR spectra of untreated clay fractions the signal intensities of
O/N-alkyl C (45-110 ppm) were diminished. After removal of Fe oxides by
demineralisation with hydrofluoric acid (HF), 13C CPMAS NMR spectra of clay
fractions from A horizons of Leptosols and Luvisols showed increases of O/N-alkyl C
intensities between 3% to 20%. The difference in O/N-alkyl C intensity before and after
demineralisation was strongly correlated with the ratio of the concentration of
dithionite-extractable iron oxides and the OC concentration. A variable contact time
experiment with an untreated clay fraction from a Luvisol revealed that protons in the

SUMMARY III
vicinity of O/N-alkyl C relaxed faster than in the vicinity of other functional groups
since paramagnetic iron shortened the relaxation of O/N-alkyl C. This demonstrated an
intimate association between iron oxides and O/N-alkyl C, which most probably
contributed to the stabilisation of O/N-alkyl C in clay fractions.
The spatial analysis of OC stocks in minerals soils at a beech forest stand in Leinefelde
showed that the range of OC stocks was higher than its average value. Subsoils
contained more than 50% of OC and should, therefore, be considered if estimating OC
stocks. Variogram analysis failed to demonstrate a spatial pattern in the litter layer,
whereas semivariograms of OC stocks in the solum 0-0.12 m and the solum >0.12 m
showed a spatial continuity of less than 5.4 m. The nugget variance accounted for 30%
of the sill in the solum 0-0.12 m and for more than 50% of the sill in the solum >0.12 m.
These results emphasised the high small scale variability at the stand scale, which
should be considered in quantitative analyses of OC stocks. Spatial correlations
indicated that the OC stocks were strongly affected by the thickness of the solum,
whereas a relation between the distance to the next tree and the magnitude of OC stocks
was not found. Considering statistical independence and the variability of the study
area, the minimum detectable difference of OC stocks ranged between 0.2 kg m-2 in the
litter layer and 4.5 kg m-2 in the complete soil profile. At this site more than 300
samples would be required to detect a relative OC stock change of 10% in the solum.
Based on above results, the following conclusions can be drawn: A major proportion of
OC in temperate forest soils is stored in the subsoil, reveals high radiocarbon ages and
consists of O/N-alkyl C and alkyl C. The chemical composition of OC stocks falls short
of explaining the variation of radiocarbon age of SOC. In fact, the interaction with soil
minerals such as the adsorption to iron oxides most probably controls long term
stabilisation of SOC. Due to the high small scale variability of soil OC stocks an
extensive soil sampling is required to detect small changes of OC stocks in mineral
soils.
ZUSAMMENFASSUNG IV
Zusammenfassung
In Wäldern der gemäßigten Breiten sind mehr als 60% der Kohlenstoffvorräte in der
organischen Auflage und im Mineralboden gespeichert. Hautziel dieser Arbeit war es,
(1) die chemische Zusammensetzung und das Radiokohlenstoffalter von
Kohlenstoffpools unterschiedlicher Stabilität in Mineralböden zu untersuchen, (2)
Assoziationen zwischen Eisenoxiden und Bestandteilen der organischen Substanz zu
identifizieren und (3) die kleinräumige Variabilität von Kohlenstoffvorräten zu
analysieren. Zusammensetzung, Radiokohlenstoffalter und Assoziationen zwischen
Eisenoxiden und organischer Bodensubstanz wurden an Bodenprofilen unter
bewirtschafteten Rotbuchen- (Fagus sylvatica L.) und Fichten- (Picea abies L.)
Beständen entlang einer europäischen Nord-Süd Transekte untersucht. Die Böden
wurden als Cambisole, Leptosole, Luvisole und Phaeozem klassifiziert. Als
Hauptmethoden wurden die Korngrößenfraktionierung in Kombination mit der 14C
Radiokohlenstoffdatierung, der Festkörper 13C-Kernresonanzspektroskopie
(13C CPMAS NMR Spektroskopie) sowie der Ligninanalyse (CuO-Oxidations
Methode) angewendet. Die räumliche Variabilität der Kohlenstoffvorräte wurde in
einem steinfreien Luvisol unter einem 10.000 m2 Rotbuchenbestand (Fagus sylvatica
L.) untersucht. Ausgehend von 9 zufällig ausgewählten Startpunkten, wurden jeweils
Proben in Abständen von 16.2 m, 5.4 m, 1.8 m, 0.6 m and 0.2 m entnommen, so dass
sich eine Gesamtzahl von 54 Entnahmestellen ergab. An allen Entnahmestellen wurden
die organischen Kohlenstoffvorräte in der Streu und im gesamten Solum bestimmt. Die
Variabilität der organischen Kohlenstoffvorräte wurde mit Methoden der deskriptiven
Statistik und der Variogrammanalyse analysiert.
Aufgrund der hohen Anreicherung von organischem Kohlenstoff in der Tonfraktion und
des hohen Beitrags von Ton zu der Gesamtbodenmasse, war der größte Anteil des
organischen Kohlenstoffes in den Tonfraktionen (<2 μm Fraktionen) zu finden. Alle
Tonfraktionen enthielten mehr als 27% des jeweiligen Gesamtvorrats an organischem
Kohlenstoff. Innerhalb der Cambisol und Luvisol Profile nahm der Anteil des in der
Tonfraktion gespeicherten organischen Kohlenstoffs von den A Horizonten (27-53%)
zu den B und E Horizonten (44-86%) zu. Dies deutete darauf hin, dass mit
zunehmender Bodentiefe weniger Blatt- und Wurzelstreu in die gröberen Fraktionen
eingetragen wurde. Der organische Kohlenstoff in der 200-2000 μm Fraktion aller

ZUSAMMENFASSUNG V
Untersuchungsflächen und -tiefen zeigte pmC Werte >100 (pmC = Prozentanteil von
modernem Kohlenstoff). Dies lässt sich durch die dieser Fraktion zugeführte frische
Pflanzenstreu mit ihren hohen 14C Gehalten erklären. Die <2 μm und 2-20 μm
Fraktionen waren dagegen durch deutliche niedrigere 14C Gehalte gekennzeichnet. Dies
zeigte sehr deutlich, dass die hier verwendete Korngrößenfraktionierung geeignet war,
junge und alte Kohlenstofffraktionen voneinander zu trennen. Mit zunehmender Tiefe
nahmen die pmC Werte stark ab, wobei die Abnahme in den feinen Fraktionen am
deutlichsten ausgeprägt war. Die <2 μm und 2-20 μm Fraktionen der B und E Horizonte
von zwei Luvisolen und einem Cambisol wiesen ein Radiokohlenstoffalter zwischen
512 und 4745 Jahren „vor heute“ auf, was darauf hindeutet, dass die organische
Substanz in diesen Horizonten nur wenig durch die derzeitige Vegetation beeinflusst
war.
Die Struktur sowohl der labilen als auch der stabilen Pools der organischen Substanz
war dominiert durch Alkyl C (14-48%) und O/N-Alkyl C (28-53%). Die stärksten
Signale in 13C CPMAS NMR Spektren waren sowohl in Gesamtböden als auch in den
spezifischen Korngrößenfraktionen in dem Bereich von O/N-Alkyl C bei 72 ppm und
105 ppm vorzufinden und sind höchstwahrscheinlich den C2, C3, C5 und C1
Kohlenstoffatomen in Cellulose und nicht kristallinen Polysacchariden zuzuordnen.
Weitere deutliche Signale traten im Alkyl C Bereich bei 30 ppm auf und sind typisch
für Methylen in langkettigen aliphatischen Verbindungen. Die 13C CPMAS NMR
Spektren der groben Fraktionen enthalten zusätzlich Signale, die bei 56, 130 und
150 ppm vorzufinden sind. Diese auf Lignin und Tannin zurückzuführenden Signale
wurden kleiner mit abnehmender Korngröße, was auf den Abbau bzw. die chemische
Umwandlung von Lignin und Tannin und den Verlust phenolischer und aromatischer
Strukturen hindeutete. Obwohl Lignin als schwer abbaubare Substanz angesehen wird,
wurden nur geringe Ligninmengen in den Tonfraktionen vorgefunden. Dies deutet auf
Prozesse hin, die spezifisch Polysaccharid und Alkyl C Verbindungen stabilisieren,
jedoch nicht für Aryl C relevant sind. Positive standortspezifische Beziehungen wurden
zwischen den O-Aryl C Intensitäten und den pmC Gehalten in A Horizonten
nachgewiesen. Während in Fraktionen mit „jungem“ Kohlenstoff O-Aryl C angereichert
war, enthielten Fraktionen mit „älterem“ Kohlenstoff deutlich geringe Mengen
O-Aryl C. Eine Korrelation zwischen den pmC Gehalten und den O/N-Alklyl C,
Alkyl C, Aryl C und Carbonyl C Intensitäten in den Korngrößenfraktionen der

ZUSAMMENFASSUNG VI
Gesamtbodenprofile konnte jedoch nicht nachgewiesen werden. Dies verdeutlicht, dass
nicht die chemische Struktur der organischen Substanz, sondern hauptsächlich die
Stabilisierung durch Bodenmatrix und Bodenminerale für die Langzeitstabilisierung der
organischen Substanz ausschlaggebend ist.
In 13C CPMAS NMR Spektren von unbehandelten Tonfraktionen waren die
O/N-Alkyl C Signale vielfach unterdrückt. Nach der Entfernung von Eisenoxiden durch
Demineralisierung mittels Flußsäure (HF) Behandlung zeigten die 13C CPMAS NMR
Spektren jedoch Zunahmen der relativen O/N-Alkyl C Signalintensitäten, die zwischen
3 und 20% lagen. Der Unterschied in der O/N-Alkyl C Intensität vor und nach der
Demineralisierung war eng mit dem Quotienten aus der Konzentration des dithionit-
extrahierbaren Eisens und der organischen Kohlenstoffkonzentration korreliert. Ein
Kontaktzeitexperiment mit einer unbehandelten Tonfraktion eines Luvisols zeigte, dass
Protonen in der Umgebung von O/N-Alkyl C deutlich schneller relaxierten als in der
Umgebung von anderen funktionalen Gruppen, da paramagnetisches Eisen die
Relaxationszeit von O/N-Alkyl C verkürzte. Ein Teil der O/N-Alkyl C Verbindungen
war folglich nicht sichtbar, wenn nicht sehr kurze Kontaktzeiten gewählt wurden. Dies
ist ein deutlicher Hinweis darauf, dass enge Assoziationen zwischen Eisenoxiden und
O/N-Alkyl C Verbindungen vorlagen, die höchstwahrscheinlich zur Stabilisierung von
O/N-Alkyl C in der Tonfraktion beitrugen.
Die räumliche Analyse der organischen Kohlenstoffvorräte zeigte, dass die Spannbreite
der Kohlenstoffvorräte höher war als ihr Mittelwert. Unterböden enthielten mehr als
50% des Gesamtkohlenstoffvorrates und sollten deswegen bei Kohlenstoffbilanzen
unbedingt berücksichtigt werden. Variogrammanalysen verdeutlichten, dass es nicht
möglich war, ein räumliches Muster für die Streuschicht zu identifizieren. Dagegen
zeigten Semivariogramme der Kohlenstoffvorräte im Solum von 0-0.12 m und im
Solum >0.12 m eine Aussagereichweite (Range) von weniger als 5.4 m. Die
Nuggetvarianz betrug ca. 30% des Schwellenwertes (Sill) im Solum von 0-0.12 m and
über 50% des Schwellenwertes (Sill) im Solum >0.12 m. Diese Ergebnisse
unterstreichen die hohe kleinräumige Variabilität der Kohlenstoffvorräte auf der Skala
eines Waldbestandes. Räumliche Korrelationen zeigten, dass die organischen
Kohlenstoffvorräte sehr stark von der Mächtigkeit des Solums abhängen, während eine
Korrelation zwischen der Höhe des organischen Kohlenstoffvorrates und dem Abstand

ZUSAMMENFASSUNG VII
zum nächsten Baum nicht vorlag. Unter Berücksichtigung des Kriteriums der
räumlichen Unabhängigkeit und der Variabilität der Kohlenstoffvorräte betrug die
minimale nachweisbare Differenz der Kohlenstoffvorräte zwischen 0.2 kg m-2 in der
Streuschicht und 4.5 kg m-2 im Gesamtprofil. Um eine 10%ige Veränderung des
organischen Kohlenstoffvorrates mit statistischen Mitteln nachzuweisen, würden auf der
untersuchten Fläche Proben von mehr als 300 Beprobungspunkten benötigt.
Auf Grundlage der beschriebenen Untersuchungsergebnisse konnten folgende
Schlussfolgerungen gezogen werden: Ein großer Teil des organischen Kohlenstoffs in
Mineralböden unter Wäldern der gemäßigten Breiten wird in Unterböden gespeichert,
hat ein hohes Radiokohlenstoffalter und liegt in Form von O/N-alkyl C und Alkyl C
vor. Die Streuung des Radiokohlenstoffalters in Mineralböden ist nicht alleine durch die
chemische Zusammensetzung der organischen Kohlenstoffvorräte erklärbar. Vielmehr
wird die Langzeitstabilisierung von organischem Kohlenstoff in Mineralböden
höchstwahrscheinlich durch Interaktionen mit der Mineralphase, zum Beispiel durch
Adsorption an Eisenoxide, kontrolliert. Aufgrund der hohen räumlichen Variabilität der
im Boden gebundenen Kohlenstoffvorräte sind aufwendige Beprobungen notwendig,
um kleine Veränderungen der Kohlenstoffvorräte in Mineralböden festzustellen.

TABLE OF CONTENTS VIII
Table of Contents
Organic matter stocks in temperate forest soils: Composition, radiocarbon age and
spatial variability ............................................................................................................... I
1. Introduction and state of the art.................................................................................1
1.1. Composition of soil organic matter in particle size fractions........................... 1
1.2. Radiocarbon age of soil organic matter in particle size fractions .................... 2
1.3. Interactions between iron oxides and soil organic matter ................................ 3
1.4. Spatial variability of soil organic carbon stocks .............................................. 5
2. Objectives..................................................................................................................7
3. Materials and Methods ..............................................................................................9
3.1. Study sites ........................................................................................................ 9
3.2. Soil sampling.................................................................................................. 10
3.3. Basic soil parameters...................................................................................... 12
3.4. Particle size fractionation ............................................................................... 13
3.5. Radiocarbon dating ........................................................................................ 13
3.6. 13C CPMAS NMR spectroscopy.................................................................... 14
3.7. Lignin analysis (Alkaline CuO oxidation) ..................................................... 16
3.8. Determination of specific surface area........................................................... 17
3.9. Statistics ......................................................................................................... 18
4. O/N-alkyl and alkyl carbon are stabilised in fine particle size fractions of soils
under beech .....................................................................................................................21
4.1. Major proportion of total OC is stored in clay fractions ................................ 21
4.2. Decreasing lignin contents with progressing decomposition......................... 24
4.3. Chemical composition and turnover .............................................................. 32
5. Chemical composition of young and old organic carbon pools throughout Luvisol
and Cambisol profiles......................................................................................................36
5.1. Organic carbon in coarse particle size fractions decreases with depth .......... 36
5.2. Young OC fraction is isolated by particle size fractionation ......................... 40
5.3. Significant proportion of OC in clay fraction is HF soluble .......................... 43
5.4. Dominance of O/N-alkyl carbon and alkyl carbon throughout soil profiles.. 45
6. Intimate association between iron oxides and O/N-alkyl carbon in clay fractions.53
6.1. Effect of demineralisation on organic carbon and nitrogen ........................... 53
6.2. Selective signal loss ....................................................................................... 57
TABLE OF CONTENTS IX
6.3. Control parameter of signal loss .....................................................................65
7. Small scale spatial variability of organic carbon stocks in litter and solum of a
forested Luvisol at Leinefelde ........................................................................................ 69
7.1. Magnitude of organic carbon stocks...............................................................69
7.2. Spatial structure of organic carbon stocks ......................................................72
7.3. Minimum detectable difference (MDD) of organic carbon stocks.................79
7.4. Implications for future sampling and monitoring ...........................................82
8. Conclusions............................................................................................................. 83
9. References............................................................................................................... 86
10. Acknowledgement (Danksagung)..................................................................... 108

LIST OF ABBREVIATIONS X
Abbreviations
AAS Atomic Absorption Spectrometry (Ac/Al)s Acid-to-aldehyde ratio of syringyl units Ald Dithionite-extractable aluminium Alo Oxalate-extractable aluminium AMS Accelerator Mass Spectrometry BET Brunauer-Emmett-Teller Method for surface area measurement B.P. Before Present CECe Effective Cation Exchange Capacity CV Coefficient of Variation CPMAS Cross Polarisation Magic Angle Spinning DOC Dissolved Organic Matter EOC Enrichment ratio of OC EVSC Enrichment ratio of CuO-oxidation products (Vanillyl, Syringyl- and Cinnamyl units) FAO Food and Agriculture Organization of the United Nations Fed Dithionite-extractable iron Feo Oxalate-extractable iron γ (h) Semivariance for distance class h γGR (h) General relative semivariance for distance class h γM (h) Semivariance in madograms for distance class h Γ (h) Crossvariance for distance class h IC Inorganic Carbon ISSS International Society of Soil Science MDD Minimum Detectable Difference MDDrel. Relative Minimum Detectable Difference NMR Nuclear Magnetic Resonance OC Organic Carbon OM Organic Matter pmC Percent Modern Carbon Q Ratio of C/N ratios before and after demineralisation rs Spearman correlation coefficient SOM Soil Organic Matter SOC Soil Organic Carbon SSA Specific Surface Area SSAoxides Specific Surface Area of mineral oxides SSAsilicates Specific Surface Area of silicates T1ρH Spin-lattice relaxation time in the rotating frame of protons T1ρC Spin-lattice relaxation time in the rotating frame of carbon TCH Carbon-proton cross polarisation time TC Total Carbon VCT Variable Contact Time VSC Sum of CuO-oxidation products (Vanillyl, Syringyl- and Cinnamyl units) WRB World Reference Base for soil resources

LIST OF FIGURES XI
List of Figures
Figure 1: Location of sampling points at the site in Leinefelde/Germany .......................... 11
Figure 2: 13C CPMAS NMR spectra of bulk soils and particle size fractions of Ah horizons
from the sites in Collelongo (a), Hesse (b), Sorø (c) and Leinefelde (62 years old
stand) (d) ...................................................................................................................... 25
Figure 3: Relative intensity of O-aryl C in relation to C/N ratios in L horizons (L) and in
bulk soil samples and particle size fractions of Ah horizons (Ah) (a) from the
Chronosequence Leinefelde and (b) from the sites in Collelongo, Hesse, Sorø and
Leinefelde (62 years old stand) .................................................................................... 27
Figure 4: Relative intensity of H/C-aryl C in relation to relative intensity of O-aryl C in L
horizons (L) and in bulk soil samples and particle size fractions of Ah horizons (Ah)
(a) from the Chronosequence Leinefelde and (b) from the sites in Collelongo, Hesse,
Sorø and Leinefelde (62 years old stand)..................................................................... 27
Figure 5: Relative intensity of O-aryl C in relation to concentrations of alkaline CuO
oxidation products (VSC) in the particle size fractions of Ah horizons (a) from the
Chronosequence Leinefelde and (b) from the sites in Collelongo, Hesse, Sorø and
Leinefelde (62 years old stand). ................................................................................... 29
Figure 6: Alkaline CuO oxidation products (VSC) in relation to OC concentration in the
particle size fractions of Ah horizons from the Chronosequence Leinefelde. ............. 30
Figure 7: Relative intensity of O-aryl C in relation to pmC values in <2 μm, 2-20 μm and
200-2000 μm fractions of Ah horizons ........................................................................ 33
Figure 8: Relative intensity of O/N-alkyl C in relation to pmC values in <2 μm, 2-20 μm,
200-2000 μm fractions of Ah horizons ........................................................................ 34
Figure 9: Distribution of organic carbon between particle size fractions in Cambisols and
Luvisols ........................................................................................................................ 38
Figure 10: OC recovery after HF treatment of bulk soil samples of Cambisols and Luvisols
against (a) %OC in the <2 μm fraction and (b) dithionite-extractable iron (Fed) ........ 44
Figure 11: 13C CPMAS NMR spectra of particle size fractions acquired from bulk soils and
particle size fractions of a Cambisol and two Luvisols. 13C CPMAS spectra of the bulk
soil and the particle size fractions of the Btg horizon from Hesse could not be
obtained, since the OC content was too low. ............................................................... 45
Figure 12: Alkyl C in HF treated samples of Cambisols and Luvisols against pH in topsoil
and transition/subsoil horizons..................................................................................... 47

LIST OF FIGURES XII
Figure 13: PmC values against alkyl C, O/N-alkyl C, aryl C and carbonyl C intensities in
2-20 μm and 200-2000 μm fractions of a Cambisol from Tharandt (97) and of Luvisols
from Hesse (34) and Leinfelde (62)..............................................................................49
Figure 14: Concentration of dithionite extractable Fe oxide in relation to the 10%
hydrofluoric acid (HF) soluble OC in A horizon clay fractions. The sample from Sorø
was considered as an outlier..........................................................................................56
Figure 15: Solid state 13C NMR spectra of A horizon clay fractions before and after
demineralisation with 10% hydrofluoric acid (HF). .....................................................58
Figure 16: Cross polarisation behaviour of O/N-alkyl C and alkyl C in the A horizon clay
fraction from Hesse before and after demineralisation with 10% hydrofluoric acid
(HF): (+) measured intensity values, (—) modelled intensity values. ..........................61
Figure 17: Ratio of dithionite extractable Fe and OC concentration in relation to O/N-alkyl
C quotient of A horizon clay fractions (Eq. 4)..............................................................65
Figure 18: Ratio of specific surface area of oxides (SSAoxides) and OC concentration in
relation to O/N-alkyl C quotient of A horizon clay fractions (Eq. 4) ...........................66
Figure 19: Frequency distribution of OC stocks in litter, solum 0-0.12 m and
solum >0.12 m ..............................................................................................................71
Figure 20: Semivariograms of OC stocks in litter, solum 0-0.12 m and solum >0.12 m with
lag distance intervals of 5.0 m ......................................................................................72
Figure 21: Madograms of OC stocks in litter, solum 0-0.12 m and solum >0.12 m with lag
distance intervals of 5.0 m. ...........................................................................................73
Figure 22: Semivariograms of OC stocks in litter, solum 0-0.12 m and solum >0.12 m with
explicit lag distances of 0.2, 0.6, 1.8, 5.4 and 16.2 m. ..................................................73
Figure 23: (a) General relative variograms for OC concentration, OC stock and bulk
density in the solum 0-0.12 m; (b) Crossvariogram between OC stock and OC
concentration in the solum 0-0.12 m.............................................................................74
Figure 24: (a) General relative variograms for OC concentration, OC stock, bulk density
and solum thickness in the solum >0.12 m; (b) Crossvariogram between OC stock and
thickness of the solum >0.12 m. ...................................................................................75
Figure 25: Relative minimum detectable difference of organic carbon stocks in relation to
sample size (a) under consideration of statistically independent sampling points
(distance between sampling points 16.2 m), and (b) under consideration of statistically
dependent sampling points (distance between sampling points 0.2 m) ........................81

LIST OF TABLES XIII
List of Tables
Table 1: Study sites................................................................................................................ 9
Table 2: Characteristics of Ah horizon samples from 8 beech forest sites.......................... 22
Table 3: OC concentrations, OC enrichment ratios (EOC), OC stocks and C/N ratios in bulk
soils and particle size fractions of Ah horizons............................................................ 23
Table 4: Relative signal distributions of OC species in bulk soils and particle size fractions
of Ah horizons determined by 13C CPMAS NMR spectroscopy ................................. 26
Table 5: Concentrations, enrichment ratios (EVSC) and stocks of phenolic CuO-oxidation
products (VSC) and acid-to-aldehyde ratios of syringyl units (Ac/Al)s in bulk soil and
particle size fractions of Ah horizons........................................................................... 28
Table 6: Percent modern carbon in particle size fractions of Ah horizons.......................... 33
Table 7: Characteristics of Cambisols and Luvisols from 2 spruce and 4 beech forest sites
...................................................................................................................................... 37
Table 8: OC concentrations in bulk soil and particle size fractions, OC stocks in bulk soils
and distribution of OC between particle size fractions in Cambisols and Luvisols..... 39
Table 9: Percent modern carbon (pmC) and radiocarbon age in particle size fractions of
Cambisols and Luvisols ............................................................................................... 41
Table 10: OC recovery after HF treatment and distributions of OC species in bulk soils of
Cambisols and Luvisols as determined by 13C CPMAS NMR spectroscopy .............. 46
Table 11: OC recovery after HF treatment and distribution of OC species in particle size
fractions of a Cambisol and two Luvisols as determined by 13C CPMAS NMR
spectroscopy................................................................................................................. 48
Table 12: Characteristics of samples to study association between Fe oxides and SOM ... 54
Table 13: Recovery of mass, organic carbon (OC) and nitrogen (N) after demineralisation
of Ah horizon clay fractions with 10% hydrofluoric acid (HF)................................... 55
Table 14: Relative signal intensity distribution in the 13C CPMAS NMR spectra of A
horizon clay fractions before and after demineralisation with 10% hydrofluoric acid
(HF). ............................................................................................................................. 59
Table 15: Quotient of relative signal intensity ratios of A horizon clay fractions before and
after demineralisation with 10% hydrofluoric acid (HF). ............................................ 60
Table 16: Results of modelling of cross polarisation behaviour for O/N-alkyl carbon (72
ppm) and alkyl carbon (30 ppm) of the A horizon clay fraction from Hesse before and
after demineralisation with 10% hydrofluoric acid (HF). ............................................ 62

LIST OF TABLES XIV
Table 17: The specific surface area (SSA) of A horizon clay fractions from beech forest
sites after removal of SOM (SSAminerals) and after removal of SOM and dithionite
extractable minerals (SSAsilicates) ...................................................................................67
Table 18: General properties of a representative soil pit at the 111 yrs old beech stand in
Leinefelde .....................................................................................................................69
Table 19: Summary statistics of soil OC stocks...................................................................70
Table 20: Relation between distance to the nearest tree and soil OC stock .........................76
Table 21: Absolute and relative minimum detectable difference of soil OC stocks taking
into account sampling points separated by 16.2 and 0.2 m...........................................80
1. INTRODUCTION 1
1. Introduction and state of the art
In temperate forest ecosystems, more than 60% of the total carbon reserves (~159 Gt)
are stored in forest floor and mineral soil (Watson et al., 2000). Some of the carbon is
located in relatively labile pools and can rapidly be used by microbes and respired back
to the atmosphere. Other pools of soil C are either resistant to microbial utilization
and/or physically protected, so that the carbon can reside in the soil as organic matter
(OM) for long periods of time (Pregitzer, 2003). Soil organic matter (SOM) in bulk
soils is a heterogeneous mixture of labile, stable and inert SOM (Wang and Hsieh,
2002). Thus, many researchers have attempted to separate SOM pools of different
turnover using chemical and physical means in order to study stabilisation of SOM.
1.1. Composition of soil organic matter in particle size fractions
The application of physical fractionation as a tool to separate SOM pools of different
turnover has increased steadily over the past 25 years (Hedges and Oades, 1997;
Christensen, 2001). This development arises from an increasing awareness of the
importance of the interaction between SOM and inorganic soil components for the long-
term protection of SOM against microbial decomposition (Sollins et al., 1996; Baldock
and Skjemstad, 2000; Six et al., 2002; Lützow et al., 2005). Different density and
particle size fractionations have been used to study the protection offered by the soil
matrix and soil minerals. Density fractionation is based on the isolation of SOM which
is not firmly associated with the mineral part of the soil. The light fraction is taken to
include labile plant and animal residues that turn over rapidly, whereas the heavy
fraction is expected to comprise organo-mineral complexes in which SOM is stabilised
(Christensen, 1992; Golchin et al., 1994; Golchin et al., 1995). Particle size
fractionation, in contrast, relies on the concept that SOM associated with particles of
different size and mineralogical composition differs in structure and function and,
therefore, plays different roles in SOM turnover (Kögel-Knabner, 2000; Christensen,
2001).
C/N ratios and data on the chemical composition of SOM in particle size fractions show
that decomposition of SOM increases from coarse to fine particle size fractions
(Spycher et al., 1983; Kögel-Knabner and Ziegler, 1993; Zech and Guggenberger,
1996). Analyses from Eutrochrepts under spruce and mixed deciduous forest exhibit
1. INTRODUCTION 2
that carbohydrates in sand are mainly of plant origin, whereas microbial-synthesised
carbohydrates show a significant enrichment in clay (Guggenberger et al., 1994).
Compared to bulk soils, clay of various soils under temperate and tropical forests is
depleted and sand enriched in lignin oxidation products (Guggenberger and Zech, 1994;
Solomon et al., 2002; Schöning et al., 2005b). Using results from solid state 13C nuclear
magnetic resonance (13C CPMAS NMR) spectroscopy, Baldock et al. (1992) found
increasing amounts of alkyl C from large (250-2000 μm) to small particle sizes (<2 μm)
in arable soils, in peat and in soils under tropical forests. They suggested a selective
preservation mechanism or an in-situ synthesis of alkyl C in the clay fraction. The
textural differences in A horizons have been ascribed to the breakdown of coarse
vascular plant fragments within the sand fraction and sequential conversion of vascular
plant tissues via microbial biomass to residual “metabolites” (Hedges and Oades, 1997).
Although both, the A horizons and the subsoil horizons are relevant in the context of
carbon storage (Batjes, 1996), most of the previous studies on the composition of SOM
in particle size fractions of forest soils have been limited to A horizons (e.g. Baldock et
al. (1992), Guggenberger et al. (1994), Guggenberger et al. (1995), Quideau et al.
(2001a), Chen & Chiu (2003)). In subsoils, the input of SOM mainly derives from plant
roots and from translocated dissolved SOM (Kögel-Knabner, 2002; Lützow et al.,
2005). Similar to various A horizons (Baldock et al., 1992), alkyl C compounds such as
cutin/suberin-derived hydroxyalkanoic acids are preserved in the fine particle size
fractions of B horizons of a Dystric Cambisol and a Haplic Podzol (Rumpel et al., 2002;
Rumpel et al., 2004). Comparable studies with particle size fractions from subsoil
horizons of Luvisols have not been conducted until now.
1.2. Radiocarbon age of soil organic matter in particle size fractions
Accelerated mass spectroscopy (AMS) has made it possible to 14C date organic carbon
(OC) fractions that were too small to be dated by the conventional decay counting
method (Wang and Hsieh, 2002). However, although particle size fractionation is
frequently applied to forest soils, information on the radiocarbon age of SOM associated
with sand, silt, and clay sized separates is surprisingly rare. In two lysimeters, which
were covered by pine and oak for a period of >50 years, highest mean residence time for
OC in A horizons was determined in the coarse clay and the fine silt fraction (Quideau
et al., 2000). Similar results obtained from two arable soils are presented by Anderson

1. INTRODUCTION 3
& Paul (1984). In contrast, 14C-data of particle size fractions from two Mollisols under
different land use show age maxima in the medium and fine clay fractions
(Scharpenseel et al., 1986). Moreover, the lowest 14C contents in particle size fractions
of forested Oxidsols and Ultisols were detected alternately in sand, silt and clay
fractions. Therefore, it was recommended to use density and chemical separation
methods instead of particle size fractionation (Trumbore and Zheng, 1996). The study
of Trumbore and Zheng (1996) is the only one in which radiocarbon contents of subsoil
fractions were published so far. However, carbon dating of bulk soil samples from
subsoil horizons of four Luvisols revealed maximum radiocarbon ages between 2,340
and 3,320 years which indicated a high degree of stabilisation of SOM in subsoils
(Becker-Heidmann et al., 1996).
Reports combining results of composition of SOM with results of carbon turnover are
rare. Gleixner et al. (2002) performed studies on the molecular residence time of SOM
from bulk soils and found a very high life time for N-containing and polysaccharide-
derived pyrolysis products. Quideau et al. (2000) combined 14C radiocarbon dating, 13C CPMAS NMR spectroscopy and particle size fractionation to investigate soils under
oak and a pine forest. The turnover rates of SOM under pine corresponded to an
increase in the alkyl C/ O/N-alkyl C ratio from the fresh litter to the clay fraction
(Quideau et al., 2000). Some studies related the carbon turnover assessed by the 13C abundance to chemical characteristics. Data on the degree of microbial alteration
match well with the increasing age in particulate OM fractions and density fractions of
fine silt associated carbon (Six et al., 2001). Combining 13C CPMAS NMR and 13C
abundance data of occluded organic materials, Golchin et al. (1995) found that the
O-alkyl C content of occluded organic materials was inversely related to their stabilities
whereas their aromatic C content was directly related to their stabilities.
1.3. Interactions between iron oxides and soil organic matter
Isotope studies have shown that SOM is stabilised in fine particle size fractions of A
horizons (Anderson and Paul, 1984; Scharpenseel et al., 1986; Schöning et al., 2005b).
The stabilisation of SOM in fine fractions can be attributed to adsorption and chemical
binding of OC on mineral surfaces as well as aggregate formation which lead to a
reduced decomposition rate of SOM relative to similar unprotected carbon material
(Baldock and Skjemstad, 2000). Among other mechanisms, the adsorption of SOM on

1. INTRODUCTION 4
Fe oxide surfaces contributes to a decreased turnover of SOM (Sollins et al., 1996).
Several correlations between Fe oxides and SOM emphasise the importance of Fe
oxides with respect to SOM storage. The OC concentrations in mineral horizons of the
main soil orders under temperate forests, such as Spodosols, Vertisols, Mollisols,
Alfisols, Inceptisols and Entisols, are closely related to dithionite-extractable Fe (Kaiser
and Guggenberger, 2000). Correlation was also found for OC and the oxalate-
extractable Fe in silt fractions of an Alfisol and an Oxisol (Shang and Tiessen, 1998).
Finally, in subsoil horizons of a loamy Podzol the amounts of resistant OC, as
determined after oxidation with Na2S2O8, increased with increasing concentrations of
dithionite-extractable Fe (Eusterhues et al., 2003). Oades (1989) highlighted the
importance of interaction between SOM and Fe oxides with respect to the accessibility
of organic compounds to organisms. In incubation studies, Ferrihydrite reduced the
decomposition of carbohydrates from beech litter by 15% (Miltner and Zech, 1998).
Organic compounds interact with minerals mainly through the O and N atoms of their
functional groups, since both O and N atoms have lone electron pair(s) (Deng and
Dixon, 2002). Interactions between organic materials and Fe oxides involve ligand
exchange reactions, anion exchange and non-coulombic interactions (Greenland, 1970).
Solid state 13C NMR spectroscopy allows examining for association between iron
oxides and SOM. The solid state NMR technique relies on the cross polarisation (CP)
mechanism. In such an experiment, after polarisation of the 1H spin system, the
magnetisation is transferred to the 13C spin system during a contact time after which the 13C signal is detected. The time required for a complete transfer of magnetisation is
called carbon-proton cross polarisation time (TCH). However, already during the
magnetisation transfer, the excited 1H spin system tries to relax to its thermal
equilibrium and thus looses polarisation. The time required for a complete loss of 1H
magnetisation is called the spin-lattice relaxation time in the rotating frame (T1ρH). The
values of T1ρH can be determined by a variable contact time experiment in which the 13C intensity is measured as a function of the contact time. Fe3+ may compromise the
cross polarisation process by shortening T1ρH values with the consequence that some 13C nuclei relax before being observed. Therefore, 13C in the vicinity of fast relaxing 1H
nuclei may be underestimated by cross polarisation unless very short contact times are
applied (Kinchesh et al., 1995). Signal loss and broadening by Fe3+ have been reported
for many spectra from soil samples of different origin (Vassallo et al., 1987; Goncalves

1. INTRODUCTION 5
et al., 2003; Keeler and Maciel, 2003). According to Smernik and Oades (2000), the
presence of paramagnetic compounds affects solid state NMR spectra via three
mechanisms: Long range effects of paramagnetic centres operate on 13C nuclei of the
whole sample. They arise due to decreases in magnetic field homogeneity. Therefore,
signal loss via this mechanism is equal for all resonances in the spectrum. In contrast,
medium range (within coupled spin systems) and short range effects (within few bonds)
can explain selective suppression of specific carbon species and can be used to identify
carbon species which are intimately associated with paramagnetic iron.
1.4. Spatial variability of soil organic carbon stocks
The magnitude of SOM is controlled by the balance between OM production by the
vegetation and decomposition of OM by soil organisms. It is strongly linked to various
factors, including temperature, moisture, OC structure, texture, soil type and topography
(Parton et al., 1987; Tan et al., 2004). The multitude of factors illuminates why spatial
variability is an inherent constraint when detecting short term changes in soil OC
stocks. Changes of soil OC stocks are often calculated as the difference between net
ecosystem exchange determined by eddy covariance and changes in vegetation C stocks
(Post et al., 2001). In order to verify these calculations direct measurements of soil OC
stocks are required (Smith, 2004). Detection of temporal changes of soil OC stocks
might be difficult, because changes are typically small in comparison to the total
amount of soil OC. In forest land, for example, soil OC may be sequestered at a rate of
around 0.053 kg OC m-2 yr-1 by means of forest regeneration, fertilization, species
choice and reduced forest degradation, against a background of around 9.6 kg C m-2 in
the top 1 m of temperate forest soils (Watson et al., 2000).
Spatial variability of OC concentrations and stocks in soils is scale dependent. The
coefficient of variation (CV) in grassland soils in the USA decreased with scale and was
39% at the county-scale (Dundy County) and 63% at the national-scale (Conant and
Paustian, 2002). A strong logarithmic relationship between relative plot size and
variance of soil OC stocks was described by Conen et al. (2004). This relationship
indicated that reducing the plot size by six orders of magnitude would only halve the
variance. Regardless of this correlation, the percentage of the overall variance of total
soil OC stocks determined for subplots in a 10,000 m2 pine forest stand was only
marginally lower than for 30 plots distributed across the whole state of Georgia (Palmer

1. INTRODUCTION 6
et al., 2002). Changes of carbon dynamics in forests are often studied on the stand scale.
At the stand scale, small scale spatial variability is of particular interest. In an old field
soil, Amador et al. (2000) observed a high variability of OC stocks even at a centimetre
scale, but the majority of studies upon spatial variability of soil OC neglects the small
scale variability by sampling in distances ≥ 1 m (Riha et al., 1986; Järvinen et al., 1993;
Conen et al., 2004).
Although some studies have been conducted on spatial variability of soil OC stocks
beneath forest stands, many questions still remain open. So far, most research on spatial
variability of OC stocks in forest soils has been carried out in conifer stands (e.g. Ruark
& Zarnoch (1993), Liski (1995), Homann et al. (2001), Palmer et al. (2002), Conant et
al. (2003), Conen et al. (2004), Oliver et al. (2004)). Only few studies on the spatial
variability in soil under deciduous forests are available (e.g. Riha et al. (1986), Conant
et al. (2003), Davis et al. (2004)). The dominant soils studied were Podzols (e.g., Liski
(1995), Conen et al. (2004)). Up to now, available data have often precluded worldwide
calculations of the less dynamic reserves of soil carbon (Batjes, 1996). In most studies
on the variability of OC stocks in forest soils only the forest floor material and several
underlying layers within the upper 0.3 m of mineral soil were considered (Hewitt et al.,
1998; Homann et al., 2001; Conen et al., 2004). This may be due to high stone contents,
which are often encountered in subsoils of forest soils, and compromise the sampling of
volumetric samples.

2. OBJECTIVES 7
2. Objectives
In view of above state of the art, the primary objective of this dissertation was to
characterise the chemical composition of OC pools in mineral soils under temperate
forest. Moreover, the spatial variability of soil OC stocks at an even aged beech forest
stand was studied. The following topics were addressed:
Combined study of composition and radiocarbon age of SOM pools
As explained above, previous studies often focused either on SOM composition or on
radiocarbon age. This study aimed to fill the gap between studies on the dynamics of
SOM and the chemical composition of SOM. Thus, a combined analysis was performed
on (1) OC pools in bulk soil samples and particle size fractions, (2) their radiocarbon
contents, and (3) their chemical composition (13C CPMAS NMR spectroscopy and
lignin analysis) (Chapters 4 and 5).
SOM pools in subsoils
Up to present little information is available on OC in subsoils. Therefore in this study
composition of OC pools of different stability throughout Cambisol and Luvisol profiles
was elucidated. It was examined if young and old OC pools can be separated by particle
size fractionation and if radiocarbon age in particle size fractions was related to the
chemical composition of SOM (Chapter 5).
Interaction between iron oxides and SOM
Mineral oxides with high specific surface areas promote the stabilisation of SOM. This
study aimed to identify associations between iron oxides and specific carbon species.
For this purpose 13C CPMAS NMR spectra of clay fractions before and after removal of
Fe by demineralisation with hydrofluoric acid (HF) were compared to examine short
and medium range effects of paramagnetic Fe (Chapter 6).
Small scale variability of SOC stocks
Organic carbon stocks are highly variable, which makes spatial estimates of OC stocks
difficult. Few data are available on the spatial variability in Luvisols under beech forest.
This holds true most notably for the variability of OC stocks in subsoils. The objective
of this study was to analyse the small scale variability of OC stocks of an almost stone
free Luvisol under a beech forest stand. This included (1) an estimation of the

2. OBJECTIVES 8
magnitude of OC stocks in the forest floor and the complete solum including the
subsoil, (2) an analysis of the spatial continuity with the smallest sampling distance
being 0.2 m, and (3) an investigation of the fundamental factors that account for the
spatial variability (Chapter 7).

3. MATERIALS AND METHODS 9
Collelongo (I) Hesse (F) Sorø (DK) Leinefelde (D) Tharandt (D)
Location
Latitude, longitude
41°52’N/ 13°38’E
48°40’N/ 07°05’E
55°29’N/ 11°38’E
51°20’N/ 10°22’E
50°56’N/ 13°29’E
Elevation (m a.s.l)
1550 300 40 450 380
Climate
Rainfall (mm)
1180 820 660 725 820
Annual mean temperature (°C)
6.3 9.2 8.2 7.0 7.5
Forest
Dominant species
Fagus sylvatica L.
Fagus sylvatica L.
Fagus sylvatica L.
Fagus sylvatica L.
Picea abies L.
Age (years) 109 34 60 30/62/111/ 153+16
5/24/97
Soil
Humus type Mull Mull Mull Mull Moder
Soil type Leptosol Luvisol Phaeozem Leptosol /Luvisol
Cambisol
Parent material
Limestone Loess/ shell limestone
Calcareous glacial material
Limestone/ loess
Porphyry
3. Materials and Methods
3.1. Study sites
Soil samples were collected from managed forest sites in Collelongo/Italy (41°52’N/
13°38’E), Hesse/France (48°40’N/ 07°05’E), Sorø/Denmark (55°29’N/ 11°38’E),
Leinefelde/Germany (51°20’N/ 10°22’E), and Tharandt/Germany (50°56’N/ 13°29’E)
(Table 1). Soils in Collelongo, Hesse, Sorø and Leinefelde were covered with European
beech (Fagus sylvatica L.), whereas spruce (Picea abies L.) was the dominant tree
species in Tharandt. The humus form was mull at the beech forest sites and moder at the
spruce forest site. At Leinefelde and Tharandt samples were taken from
chronosequences including subsites with different tree age classes. The selected sites
Table 1: Study sites

3. MATERIALS AND METHODS 10
were characterised by an altitude between 40-1550 m a.s.l., a mean annual temperature
of 6.3-9.2 °C and a mean annual precipitation of 660-1180 mm. The parent material was
lime stone in Collelongo and Leinefelde (30/1), shell limestone in Hesse, calcareous
glacial material in Sorø, loess in Leinefelde (30/2, 62, 111 and 153+16) and porphyry in
Tharandt (5, 24, 97).
3.2. Soil sampling
Samples to study composition and radiocarbon age of SOM were taken from one
representative soil pit at each site. Only at the 30 years old stand in Leinefelde samples
were taken from two profiles because of the great soil heterogeneity. All soil pits were
sampled by horizons. Soil groups, classified according to ISSS-ISRIC-FAO (1998) and
FAO (1990), comprised Cambisols, Leptosols, Luvisols and a Phaeozem (Table 1).
Samples from A horizons of the beech forest sites were selected to study
composition of SOM as determined by 13C CPMAS NMR spectroscopy and
lignin analysis in bulk soils and particle size fractions and radiocarbon age in
particle size fractions (Chapter 4).
Samples from A, E and B horizons from Haplic and Stagnic Luvisols in Hesse
und Leinefelde as well as Dystric Cambisols in Tharandt were selected to study
composition and radiocarbon age of SOM throughout soil profiles (Chapter 5).
Clay fractions of the A horizons from all sites were taken to study associations
between iron oxides and functional groups of SOM (Chapter 6)
The study on the spatial variability of OC stocks was conducted at a 10,000 m2 beech
forest site located at Leinefelde/Germany (51°20’N/ 10°22’E) (Anthoni et al., 2004;
Bascietto et al., 2004) (Chapter 7). The forest has been managed as a shelterwood
system since 1838 (Anthoni et al., 2004). The dominant vegetation consisted of 111
years-old, even aged beech trees (Fagus sylvatica L.). The forest stand exhibited a stand
basal area of 35.2 m2 ha-1, a mean top height of 36.5 m, and a tree density of 224
treesּha-1 (Anthoni et al., 2004; Bascietto et al., 2004). Thus the average distance
between beech trees was around 7 m.
3. MATERIALS AND METHODS 11
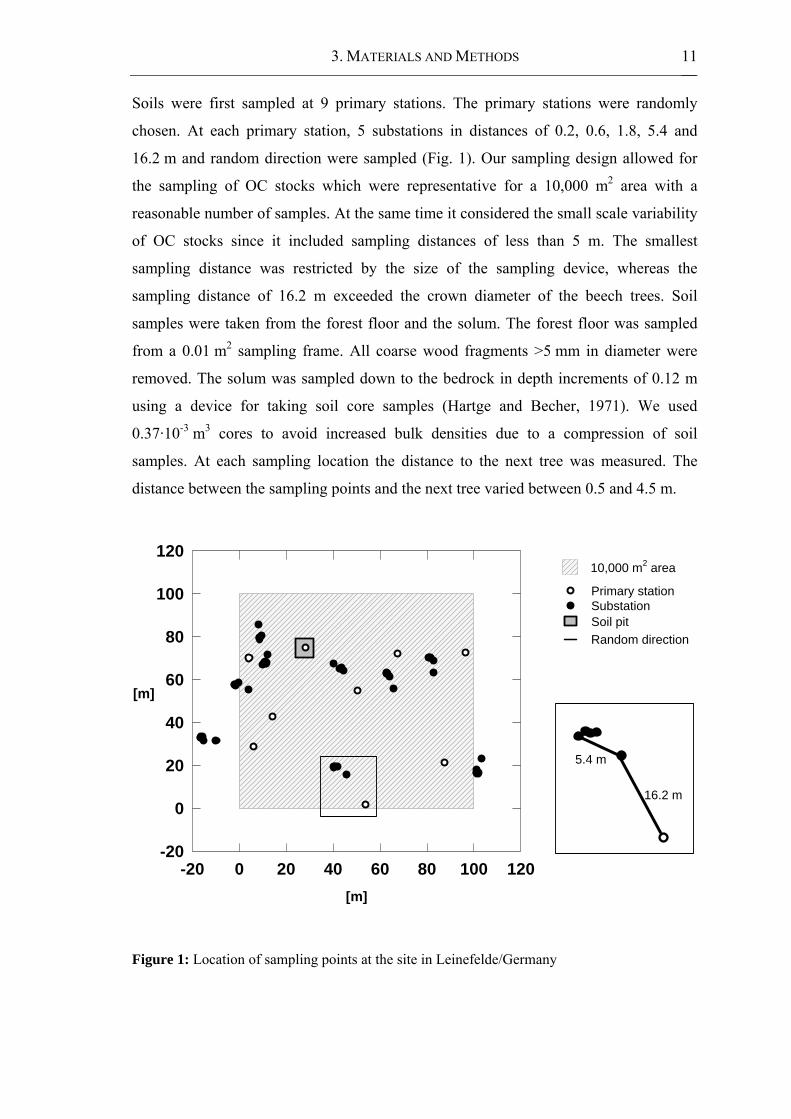
Soils were first sampled at 9 primary stations. The primary stations were randomly
chosen. At each primary station, 5 substations in distances of 0.2, 0.6, 1.8, 5.4 and
16.2 m and random direction were sampled (Fig. 1). Our sampling design allowed for
the sampling of OC stocks which were representative for a 10,000 m2 area with a
reasonable number of samples. At the same time it considered the small scale variability
of OC stocks since it included sampling distances of less than 5 m. The smallest
sampling distance was restricted by the size of the sampling device, whereas the
sampling distance of 16.2 m exceeded the crown diameter of the beech trees. Soil
samples were taken from the forest floor and the solum. The forest floor was sampled
from a 0.01 m2 sampling frame. All coarse wood fragments >5 mm in diameter were
removed. The solum was sampled down to the bedrock in depth increments of 0.12 m
using a device for taking soil core samples (Hartge and Becher, 1971). We used
0.37·10-3 m3 cores to avoid increased bulk densities due to a compression of soil
samples. At each sampling location the distance to the next tree was measured. The
distance between the sampling points and the next tree varied between 0.5 and 4.5 m.
[m]
-20 0 20 40 60 80 100 120
[m]
-20
0
20
40
60
80
100
120
Primary stationSubstationSoil pit
10,000 m2 area
Random direction
16.2 m
5.4 m
Figure 1: Location of sampling points at the site in Leinefelde/Germany

3. MATERIALS AND METHODS 12
3.3. Basic soil parameters
3.3.1. Bulk density
Bulk density of the forest floor was calculated using the thickness of the forest floor
(corrected for coarse wood fragments), the sampling area and the mass of the air dried
forest floor. Bulk density of the mineral soil was calculated with the mass of the oven-
dry soil (105°C) and the core volume (Hartge and Horn, 1989). Bulk density was
corrected for roots (>2 mm) and stones taking into account a density of the parent
material of 2.7 g cm-3 to calculate the bulk density of the fine earth.
3.3.2. Sample preparation
After drying, soil samples were sieved to <2 mm. Prior to C and N analyses, 13C CPMAS NMR spectroscopy, and alkaline CuO oxidation, aliquots of bulk samples
were ground to a size of <100 μm using a ball mill.
3.3.3. Determination of pH, particle size distribution and effective cation
exchange capacity
The pH values were determined in duplicate with a glass electrode in the supernatant of
a soil suspension obtained by mixing soil with 0.01 M CaCl2 in a mass to volume ratio
of 1:2.5. Determination of soil texture was carried out in duplicate according to
Schlichting & Blume (1966). The proportions of fractions <63 μm were measured with
a Sedigraph 5100 (Micromeritics Corp., Nocross, USA). The effective cation exchange
capacity (CECe) and the base saturation (BS) were determined in triplicate
corresponding to Trüby and Aldinger (1989).
3.3.4. Determination of C, N, Fe and Al
Determination of total carbon (TC) and nitrogen was performed in duplicate by dry
combustion on a Vario EL elemental analyser (Elementar Analysensysteme GmbH,
Hanau, Germany). The coefficient of variation of replicated analyses was below 4 %.
Most samples were carbonate free. In those samples the TC concentration equalled the
OC concentration. In the remaining samples the inorganic carbon (IC) concentrations of
samples were determined after ignition of samples for 3 hours at 550°C. The OC
concentration was calculated from the difference between TC and IC. For 13C CPMAS
NMR spectroscopy, the carbonate of the samples from Collelongo was removed with

3. MATERIALS AND METHODS 13
1M HCl. The total amounts of pedogenic Fe oxides, the dithionite-extractable Fe (Fed),
were extracted using the strong reductant sodium dithionite (Mehra and Jackson, 1960).
The poorly crystalline fraction of Fe oxides, the oxalate-extractable Fe (Feo), was
extracted by acid ammonium oxalate (Schwertmann, 1964). Both, the dithionite and the
oxalate extracts were analysed for Fe and Al (Ald, Alo) by atomic absorption
spectrometry using an AAS UNICAM 939 (Unicam AAS-UV, Offenbach, Germany).
3.4. Particle size fractionation
Air dried <2 mm soil (30 g) was suspended in 150 ml deionised water with a soil
mass (g) to water volume (ml) ratio of 1:5. An ultrasonic treatment with a Branson
Sonifier 250 (Branson Ultrasonics Corp., Danbury, USA) was applied to break up
aggregates. To prevent a redistribution of coarse particulate organic matter to finer size
classes, ultrasonic dispersion was carried out in two steps as described by Amelung and
Zech (1999). Macroaggregates were first destroyed with a low energy input of 60 J/ml.
Particles >200 μm – including particulate organic matter – were then removed by wet
sieving. A second, complete dispersion was achieved with an ultrasonic treatment using
an energy input of 440 J/ml and a soil mass (g) to water volume (ml) ratio of 1:10.
Subsequently, the 20-200 μm fraction was isolated by wet sieving. The remaining part
of the sample was further separated in a 2-20 μm and <2 μm fraction by repeated
gravitational sedimentation using Atterberg cylinders filled with deionised water. The
clay fraction was recovered from the solution by pressure filtration (0.2 μm
polypropylene filter) and freeze dried. All size separates >2 μm were oven dried at
40°C. Aliquots of particle size fractions taken for C and N analyses, radiocarbon dating, 13C CPMAS NMR spectroscopy and lignin analysis (alkaline CuO-oxidation) were
homogenised and ground with agate mortar and pestle to a size of <100 μm.
3.5. Radiocarbon dating
Radiocarbon activity was determined with the AMS facility at the Physics Department
of the University of Erlangen, Germany. A complete description of the AMS facility
was published by Kretschmer et al. (1997). Briefly, after dry combustion of the samples,
a small aliquot of the arising carbon dioxide and nitrogen was bled into a mass
spectrometer where the stable isotope ratios δ13C and δ15N were measured. The
remaining part of CO2 was reduced to graphite by heating a mixture of H2 and CO2 with
iron powder at 625°C. The graphite was pressed into targets and measured with the

3. MATERIALS AND METHODS 14
AMS. The amount of radiocarbon enrichment is expressed in percent modern carbon
(pmC) and in years before present (yrs B.P.) which refer to the 1950 14C activity. The
average error was 0.5 pmC and 55 yrs B.P., respectively. All values were corrected for
isotope fractionation using the δ13C values. Samples from Collelongo were treated with
4%HCl during 24 hours to remove CaCO3 prior to radiocarbon analysis (Mook and
Streurman, 1983).
3.6. 13C CPMAS NMR spectroscopy
3.6.1. Pre-treatment with HF (demineralisation)
Prior to NMR spectroscopy, bulk soil samples, <2 μm and 2-20 μm fractions were
treated with 10% hydrofluoric acid (HF) (v/v) to remove mineral material including
paramagnetic compounds such as Fe and to concentrate the SOM (Schmidt et al., 1997).
An HF concentration of 10% offers a reasonable compromise between maximal mineral
dissolution efficiency and OC losses (Gélinas et al., 2001). Five gram of bulk soil
samples and 1-2 g of particle size fractions were thoroughly mixed with 50 ml of
10% HF and stirred for 2 hours. The soil/HF samples were centrifuged for 10 min at
3000 rpm and the supernatant was removed and discarded. The demineralisation
procedure was repeated on the same sample four times. Subsequently, the residual solid
phase was rinsed with deionised water five times, freeze dried and homogenised with
agate mortar and pestle. The Fed concentration after demineralisation was determined
for clay fractions from Leinefelde (62, 111, 153+16) and from Hesse. The recovery of
Fed after demineralisation ranged between 3 and 8% (0.7-1.5 g Fed kg-1 soil). OC and N
determinations before and after demineralisation allowed the recovery of OC and N to
be calculated (Eq. 1):
(1)
The HF soluble OC was calculated as the difference between OC mass in untreated and
HF treated samples. The enrichment ratios of OC and N (Eq. 2) facilitate a comparison
of the OC and N concentration before and after demineralisation:
100(massOC(N)⋅=
sample) (untreatedmassOC(N)sample) treatedHF(in%)recov.OC(N)
3. MATERIALS AND METHODS 15
(2)
In addition, Q (Eq. 3), the ratio of OC/N weight ratios before and after demineralisation,
was calculated and used to assess possible changes in SOM quality:
(3)
3.6.2. Standard 13C CPMAS NMR measurements
Solid state 13C CPMAS NMR spectra were obtained from bulk soils and particle size
fractions. Due to low OC concentrations it was not possible to obtain spectra from the
20-200 μm fractions. Ground 200-2000 μm fractions containing negligible
concentrations of paramagnetics were taken for 13C CPMAS NMR spectroscopy
without pre-treatment. All other samples were treated with 10% HF. Solid state 13C CPMAS NMR spectra were acquired using a Bruker DSX 200 spectrometer (Bruker
BioSpin GmbH, Karlsruhe, Germany) at a 13C resonance frequency of 50.3 MHz.
Samples were filled into zirconium dioxide rotors and spun in a magic angle spinning
probe at a rotation speed of 6.8 KHz to minimise chemical anisotropy. A ramped 1H
pulse was used during a contact time of 1 ms to prevent Hartmann-Hahn mismatches.
The total number of scans ranged from 8⋅103 to 333⋅103 with a constant recycle delay of
400 ms. Prior to Fourier transformation and phasing the spectra were processed with a
line broadening of 50 Hz. Chemical shifts are referenced to tetramethylsilane
(TMS = 0 ppm). Solid state 13C CPMAS NMR spectra were divided into five chemical
shift regions, representing alkyl C (0-45 ppm), O/N-alkyl C (45-110 ppm), C/H-aryl C
(110-140 ppm), O-aryl C (140-160 ppm) and carbonyl C (160-220 ppm). The relative
intensities of the chemical shift regions were determined by integration of 13C CPMAS NMR spectra over given chemical shift ranges after phase and baseline
correction. The variation of the relative intensities due to Fourier transformation, phase
and baseline correction was lower than 4%. Changes of proportions of different carbon
species in relation to the alkyl C proportion, which was the second most important
carbon species, were investigated by calculating O/N-alkyl C, aryl C and carbonyl C
quotients (Eq. 4). They were calculated from the O/N-alkyl C/alkyl C, aryl C/alkyl C
and carbonyl C/alkyl C ratios before and after demineralisation:
sample) (untreatedconc.OC(N)sample) treated(HFconc.OC(N)
=OC(N)E
sample) (untreatedratioOC/Nsample) treated(HFratioOC/N
=Q

3. MATERIALS AND METHODS 16
sample) (untreatedCalkyl
C)carbonylC,(arylCalkylO/N
)sample treated(HFCalkyl
C)carbonylC,(arylCalkylO/N
Quotient−
−
= (4)
Quotients >1 indicated, that during demineralisation the proportion of O/N-alkyl C,
aryl C or carbonyl C increased relative to the alkyl C intensity. A decrease of the carbon
species relative to alkyl C accounted for quotients <1. If the ratio between the carbon
species and alkyl C was identical before and after demineralisation, the quotient
equalled 1.
3.6.3. Variable contact time experiment
A variable contact-time (VCT) experiment was performed to compare spin-lattice
relaxation times in the rotating frame (T1ρH) of the untreated and HF treated clay
fraction from Hesse. This sample was chosen for a VCT experiment because of its high
Fed/OC ratio (Table 12). Solid state 13C CPMAS NMR spectra were acquired with an
array of 17 different contact times varying from 0.03 ms to 4 ms. The values of T1ρH in
the vicinity of alkyl C and O/N-alkyl C were determined from the loss of 13C magnetisation as a function of increasing contact times. Plots for carbonyl C and
aryl C were not displayed, since low signal to noise ratios of the carbonyl C and aryl C
signals in the spectra of the untreated sample did not allow for quantification. The
curves of intensity of the different carbon species vs. contact time were fitted with a two
component model using the sum of two Mehring terms (Mehring, 1983; Abelmann et
al., 2004). The two component model considered that fast and slow relaxing
components might be present in the sample. The fitting was performed with the
software Mathcad 2000 Professional (Adept Scientific plc, Letchworth, UK) according
to the procedure described by Abelmann et al. (2004). T1ρH and T1ρC values from
experiments with coal samples (Abelmann et al., 2004) were found to be suitable as
initial values for the modelling.
3.7. Lignin analysis (Alkaline CuO oxidation)
Lignin derived phenols were determined in duplicate using a modification of the CuO
oxidation method developed by Hedges and Ertel (1982). The extraction by ethyl ether
was replaced by an extraction with C18 columns introduced by Kögel and Bochter

3. MATERIALS AND METHODS 17
(1985). Depending on OC concentrations between 50 and 500 mg of ground soil,
250 mg CuO, 50 mg Fe(NH4)2(SO4)2·6H2O and 50 mg C6H12O6 were weighed into
teflon vessels and mixed with 15 ml 2 M NaOH. Subsequently, lignin was digested in a
pressure bomb (Groteklaes GmbH, Jülich, Germany) under a nitrogen atmosphere at
172°C for 2 h. After cooling of the pressure bomb, samples were acidified to pH 2 with
6 M HCl and allowed to stand in the dark overnight. During this time humic acids
precipitated and were separated by centrifugation. Aliquots of the supernant, containing
the lignin derived phenols, were extracted with C18 reversed phase columns. After
drying of columns in a nitrogen stream for 1 h, the lignin derived phenols were
extracted with five times 0.5 ml ethyl acetate. Ethyl acetate was evaporated in a
nitrogen atmosphere, CuO oxidation products were dissolved in pyridine and
derivatised with bis(trimethylsilyl)trifluoroacetamide. The lignin derived phenols were
analysed on an Agilent 6890 gas chromatograph with a flame ionisation detector
equipped with a HP5 fused silica capillary column (30 m length, 0.25 mm ID, 0.25 μm
film thickness). 1 μl of samples was injected using the split mode (split ratio 1:50) at an
injector temperature of 300°C. The initial column temperature was set to 100°C and the
oven was programmed to 200°C at 5°C/min and to 300°C at 10°C/min. The final
temperature was kept for 15 min. The detector temperature was 300°C. During the
whole analysis a constant helium flow of 1.0 ml/min was maintained. The sum of
vanillyl, syringyl and cinnamyl (VSC) units was taken to represent the lignin content.
The coefficient of variation for the sum of VSC is usually 7 % (Kiem and Kögel-
Knabner, 2003). The acid-to-aldehyde ratio of syringyl units was taken as an indicator
for the degree of lignin modification (Ertel and Hedges, 1984).
3.8. Determination of specific surface area
The specific surface area (SSA) was determined by an Autosorb 1 surface area analyser
(Quantachrome GmbH, Odelzhausen, Germany). Prior to determination of SSA, the
samples were outgased in a He flow for 24 h at a temperature of 343 K to remove
adsorbed water. The specific surface area was calculated from the adsorption isotherm
of N2 at 77 K, using the BET equation (Brunauer et al., 1938) and a 11 point
measurement in the p/p0 range of 0.05 to 0.30. SSA was first measured after removal of
soil organic matter with 30% H2O2 to estimate the SSA of the total mineral
matrix (SSAminerals). After subsequent removal of dithionite extractable Fe oxides the
SSA of silicates (SSAsilicates) was measured taking into account the mass loss due to the

3. MATERIALS AND METHODS 18
dithionite extraction. Mineral oxides are often present as coatings that might mask a
fraction of the silicate surfaces. However, an estimation of the SSA of mineral oxides
(SSAoxides) can be obtained by calculating the difference between SSAminerals and
SSAsilicates (Borggaard, 1982; Kiem and Kögel-Knabner, 2002).
3.9. Statistics
3.9.1. Correlation analysis
Calculation of correlation coefficients was performed with the software package
Statistica 6.1 (Statsoft Inc., Tulsa, USA). We used the Pearson’s correlation coefficient
(r) and the Spearman rank correlation coefficient (rs), which is a distribution-free
analogue of correlation analysis.
3.9.2. Analysis of spatial variation
The spatial variation of OC stocks was described by ordinary statistics and geostatistics.
Mean, median, skewness, kurtosis and coefficient of variation (CV) of OC stocks were
calculated as basic statistical parameters. The solum >0.12 m, i.e. the solum from a
depth of 0.12 m down to the bedrock, was taken to estimate the OC stocks in the
subsoil. OC stocks are presented in kg m-2 because extrapolation over large scales (e.g.
using the unit Mg/ha) is complicated due to unknown correction factors for large roots,
stumps, skeleton, and spatial variation. The minimum detectable difference (MDD) of
OC stocks was calculated for the forest floor and the solum. MDD is defined as the
smallest difference that can be detected between means of OC stocks (Eq. 5) (Zar,
1984):
(5)
where sp2 is the variance estimate, n is the sample size and t is the t-statistic at a given
significance level (α), probability of type II error (β) and degree of freedom (v). In our
study, we used a statistical power (1-β) of 0.90 and a significance level (α) of 0.05. As
variability increases, the minimum number of samples needed to detect a given level of
change increases. In order to enable a comparison of MDD values of depth increments
with different magnitudes of OC stocks, the MDDrel. was calculated (Eq. 6) as follows:
212
2
)tt(ns
MDD v),(v),(p
βα +=

3. MATERIALS AND METHODS 19
(6)
where MDD is the minimum detectable difference and is the mean OC stock. The
magnitude of OC stocks in soils varies from location to location. The experimental
semivariogram describes the rate of change of OC stocks as a function of the distance
between sampling points and measures the degree of spatial continuity. Usually one
distinguishes between directional (considering sampling points in one specific direction)
and omnidirectional (considering sampling points in all directions) semivariograms
(Webster and Oliver, 2001). Observations of OC stocks located close to one another
often tend to be more similar compared to observations separated by a larger distance.
Therefore the semivariance γ (h) increases as distance between observations increases
(Nielsen and Wendroth, 2003). The semivariogram was calculated in the following
way (Eq.7):
(7)
where N (h) is the number of pairs of data points separated by the lag distance h. Ai (xi)
and Ai(xi + h) represent values of Ai at the locations xi and xi + h. The experimental
semivariogram was calculated for distances from 0 to 60 m taking into account
distances between all pairs of sampling points. For this purpose, distances between
sampling points were grouped into distance classes which cover 5 m each (1st class:
0-5 m, 2nd class: 5-10 m, and so on). In order to resolve the small scale variability, an
additional semivariogram for the lag distances ≤ 16.2 m was calculated using the
spatially explicit distances between primary stations and substations. Since sampling
points are distributed all-over the study area, the semivariogram for the small lag
distances is representative for the entire forest stand. For all semivariogram calculations,
it was assumed that the intrinsic hypothesis of geostatistics holds. Most semivariograms
reach an upper limit at which the semivariance remains nearly constant after the initial
increase. The maximum semivariance is denominated as the sill variance. The range, in
turn, is defined as the distance at which the variogram reaches the sill. The calculated
values often appear to approach some positive value as the lag distance approaches
zero, whereas theoretically the semivariance should be zero. This discrepancy is known
x
∑=
+−=)h(N
iiiii )]hx(A)x(A[
)h(N)h(
1
2
21γ
%x
MDDMDD .rel 100⋅=

3. MATERIALS AND METHODS 20
as the nugget variance and reflects the micro-heterogeneity and the measurement error.
In addition to the traditional experimental semivariogram, more robust measures of
spatial continuity such as madograms were plotted. Madograms are similar to traditional
semivariograms, but they respond less sensitive to extreme data values. Instead of the
square of differences, absolute differences between Ai (xi) and Ai (xi + h) were
calculated (Eq.8) (Goovaerts, 1997):
(8)
In order to examine spatial relations between different types of variables, the
experimental crossvariogram is defined by an extension of the calculation of ordinary
semivariograms (Eq.9) (Nielsen and Wendroth, 2003):
(9)
where Ai(xi) and Bi(xi) are the values of variable Ai and Bi at location (xi). Ai (xi + h)
and Bi (xi + h) represent values of Ai and Bi at the location xi + h. To enable a
comparison of the spatial continuity of different variables that are characterised by
different magnitudes of variability, the general relative variogram was calculated, which
is the traditional semivariogram as described in (Eq. 7), standardised by the square
mean of the data used for each lag distance (Eq. 10) (Goovaerts, 1997):
(10)
where m-h is the mean of Ai (xi) values and m+h is the mean of Ai (xi + h) values.
∑=
+−=)h(N
iiiii |)]hx(A)x(A[|
)h(N)h(M
121γ
)]hx(B)x(B[)]hx(A)x(A[)h(N
)h( iiii
)h(N
iiiii +−+−= ∑
=121Γ
2
2⎟⎠⎞
⎜⎝⎛ +
=+− hh
GRmm
)h()h( γγ

4. O/N-ALKYL C AND ALKYL C ARE STABILISED 21
4. O/N-alkyl and alkyl carbon are stabilised in fine particle size
fractions of soils under beech
Soil samples to study the composition of Ah horizons under beech (Fagus sylvatica L.)
forest originated from sites in Collelongo/Italy, Hesse/France, Sorø/Denmark and
Leinefelde/Germany (Table 2). In Leinefelde samples were collected from a
chronosequence including stands with an average tree age of 30, 62, 111 and 153+16
years (153+16 refers to a mixture of 153 years old trees with 16 years old trees) (Table
2). In all figures of this chapter, the results of the chronosequence are presented
separately (“Chronosequence Leinefelde”). For the comparison of “European Sites” the
sites in Collelongo, Hesse, Sorø and the 62 years old stand from Leinefelde were
selected. The 62 years old stand from Leinefelde versus the other Leinefelde sites was
chosen to be included in the “European Sites comparison”, because it represents a stand
with neither very young nor very old trees. The humus form at all sites was mull. The
thickness of the Ah horizons varied between 0.07 and 0.25 m. Soil types comprised
Rendzic Leptosols in Collelongo and Leinefelde (30/1), Stagnic Luvisols in Hesse and
in Leinefelde (30/2, 62 and 153+16), a Haplic Luvisol in Leinefelde (111), and a
Stagnic Phaeozem in Sorø (ISSS-ISRIC-FAO, 1998). Soil pH ranged from 4.1 in Hesse
to 6.9 in Collelongo. According to the Soil Science Society of America nomenclature
(SSSA, 2001) the soil texture in the Ah horizons corresponded to sandy clay loam in
Sorø, silt clay loam in Hesse and Leinefelde (30/2, 62 and 111), silty clay in Leinefelde
(30/1 and 153+16) and clay in Collelongo.
4.1. Major proportion of total OC is stored in clay fractions
The OC concentrations in the A horizons samples ranged from 31 to 96 g kg-1 in the
bulk soils and from 8 to 406 g kg-1 in the particle size fractions (Table 3). To facilitate a
comparison of carbon enrichments in fractions of soils with different OC levels in the
bulk soils, enrichment factors for OC (EOC) were calculated (g kg-1 of OC in fraction/
g kg-1 of OC in bulk soil) (Table 3). Most of the <2 μm and 200-2000 μm fractions were
enriched, whereas most of the 2-20 μm and 20-200 μm fractions were depleted in OC.
The OC stocks in the total Ah horizons ranged from 1.8 to 8.1 kg m-2 (Table 3). The
Ah horizons at Collelongo, Leinefelde (30/1) and Sorø which were thicker than 0.15 m
exhibited the highest carbon stocks (more than 4.9 kg m-2).
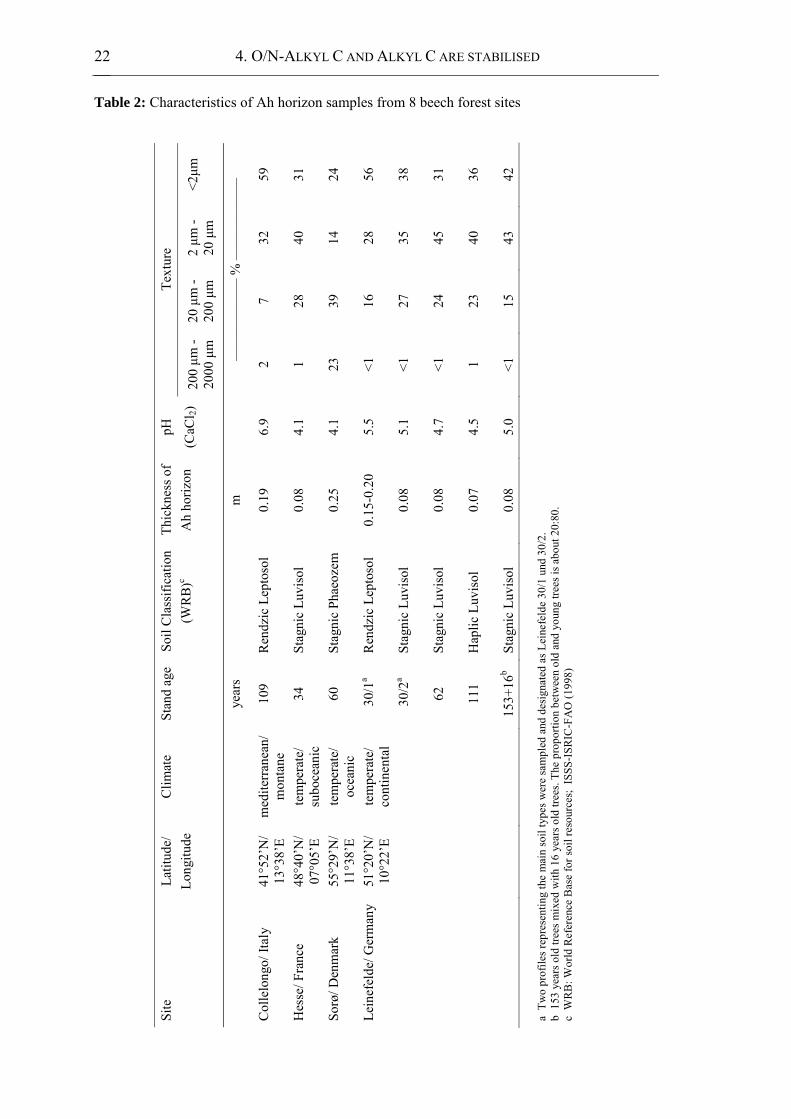
4. O/N-ALKYL C AND ALKYL C ARE STABILISED 22
Table 2: Characteristics of Ah horizon samples from 8 beech forest sites
Site
La
titud
e/
Clim
ate
Stan
d ag
e So
il C
lass
ifica
tion
Thic
knes
s of
pH
Text
ure
Lo
ngitu
de
(WR
B)c
Ah
horiz
on
(CaC
l 2)
200 μm
- 20
00 μ
m
20 μ
m -
200 μm
2 μm
- 20
μm
<2μm
ye
ars
m
——
——
——
% —
——
——
—
Col
lelo
ngo/
Ital
y 41
°52’
N/
13°3
8’E
med
iterr
anea
n/
mon
tane
10
9 R
endz
ic L
epto
sol
0.19
6.
9 2
7 32
59
Hes
se/ F
ranc
e 48
°40’
N/
07°0
5’E
tem
pera
te/
subo
cean
ic
34
Stag
nic
Luvi
sol
0.08
4.
1 1
28
40
31
Sorø
/ Den
mar
k 55
°29’
N/
11°3
8’E
tem
pera
te/
ocea
nic
60
Stag
nic
Phae
ozem
0.
25
4.1
23
39
14
24
Lein
efel
de/ G
erm
any
51°2
0’N
/ 10
°22’
E te
mpe
rate
/ co
ntin
enta
l 3
0/1a
Ren
dzic
Lep
toso
l 0.
15-0
.20
5.5
<1
16
28
56
3
0/2a
Stag
nic
Luvi
sol
0.
08
5.1
<1
27
35
38
62
St
agni
c Lu
viso
l
0.08
4.
7 <1
24
45
31
11
1 H
aplic
Luv
isol
0.07
4.
5 1
23
40
36
15
3+16
b St
agni
c Lu
viso
l 0.
08
5.0
<1
15
43
42
a T
wo
prof
iles r
epre
sent
ing
the
mai
n so
il ty
pes w
ere
sam
pled
and
des
igna
ted
as L
eine
feld
e 30
/1 u
nd 3
0/2.
b
153
yea
rs o
ld tr
ees m
ixed
with
16
year
s old
tree
s. Th
e pr
opor
tion
betw
een
old
and
youn
g tre
es is
abo
ut 2
0:80
. c
WR
B: W
orld
Ref
eren
ce B
ase
for s
oil r
esou
rces
; IS
SS-I
SRIC
-FA
O (1
998)

4. O/N-ALKYL C AND ALKYL C ARE STABILISED 23
The variability of carbon stocks on volume basis (22 to 41 kg m-3) was lower than on
horizon basis. The highest proportions of the total OC stock of the respective
Ah horizons were accumulated in the <2 μm and 2-20 μm fractions. The contribution of
the 200-2000 μm fraction to the total OC stocks was higher under the young stands in
Table 3: OC concentrations, OC enrichment ratios (EOC), OC stocks and C/N ratios in bulk soils and particle size fractions of Ah horizons
Site (Stand age)
Fraction OC EOC OC stock
OC stock
% of bulk soil OC stock
C/N
μm g kg-1 kg m-2 kg m-3 %
Collelongo Bulk soil 96 7.7 41 11.8 (109) 200-2000 154 1.7 0.4 2 5 29.4 20-200 102 1.1 0.7 4 9 20.1 2-20 88 0.9 2.8 15 36 12.4 <2 88 0.9 3.8 20 50 9.7 Hesse Bulk soil 31 1.8 22 13.4 (34) 200-2000 109 3.5 0.3 5 18 27.8 20-200 9 0.3 0.1 3 8 16.5 2-20 14 0.4 0.4 7 21 12.0 <2 51 1.6 0.9 17 53 6.7 Sorø Bulk soil 45 8.1 32 12.8 (60) 200-2000 17 0.4 0.8 3 10 15.4 20-200 8 0.2 0.7 3 8 11.7 2-20 84 1.9 2.5 10 31 13.4 <2 163 3.6 4.1 17 51 10.7 Leinefelde Bulk soil 47 4.9 29 11.1 (30/1) 200-2000 114 2.8 0.8 4 16 18.4 20-200 30 0.6 0.5 3 11 20.7 2-20 43 0.9 1.1 7 23 16.3 <2 62 1.3 2.4 15 50 9.5 Leinefelde Bulk soil 48 3.0 38 14.4 (30/2) 200-2000 406 8.4 0.7 9 22 30.2 20-200 15 0.3 0.3 3 9 18.7 2-20 26 0.5 0.7 9 23 17.3 <2 74 1.5 1.4 17 46 10.9 Leinefelde Bulk soil 49 3.1 38 13.8 (62) 200-2000 203 4.1 0.3 4 11 20.7 20-200 20 0.4 0.3 4 10 19.1 2-20 42 0.9 1.2 15 40 17.0 <2 75 1.5 1.2 15 39 8.6 Leinefelde Bulk soil 32 1.9 27 12.9 (111) 200-2000 214 6.7 0.3 4 13 22.3 20-200 15 0.5 0.3 4 14 20.4 2-20 24 0.7 0.6 8 30 17.5 <2 60 1.9 0.8 12 43 8.9 Leinefelde Bulk soil 34 2.1 27 13.1 (153+16) 200-2000 245 7.2 0.4 4 16 25.6 20-200 9 0.3 0.1 1 5 24.3 2-20 23 0.7 0.6 8 30 21.4 <2 45 1.3 1.0 13 49 8.7

4. O/N-ALKYL C AND ALKYL C ARE STABILISED 24
Leinefelde (30/1, 30/2 and 153+15) and in Hesse. In almost all samples the C/N ratios
were decreasing in finer particle size separates (Table 3). Only the C/N ratios of the
200-2000 μm fractions under the 30 years old stand in Leinefelde (30/1) and of the
20-200 μm fraction of Sorø did not fit in this trend.
The wide range of EOC’s (Table 3), also shown by Christensen (1996) and
Amelung et al. (1998), suggests that carbon pools of different structure and function
were separated by particle size fractionation. The distribution of OC stocks between the
particle size fractions was similar to that described for acid forest soils by
Kaiser et al. (2002). A major proportion of OC was stored in the clay fractions
(Table 3), but the contribution of the clay fraction to the total OC stock in Ah horizons
was lower than in arable soils, where contributions of 50% and more are common
(Christensen, 1996). This is most probably due to a comparatively high proportion of
plant residues in forest soils, which are mainly associated with the 200-2000 μm
fraction (Balesdent et al., 1998). The greater relative proportions of OC in the
200-2000 μm fractions of the young stands in Leinefelde and Hesse suggest that a high
tree density in young stands affected the soil OC stock by providing higher litter inputs
to the coarse fraction. However, a relation between bulk soil OC stocks and stand age
was not observed (Table 3). The comparison of OC stocks per square meter and per
cubic meter showed that the main factor controlling the magnitudes of the total OC
stocks in the bulk soil was the thickness of the Ah horizon. As previously described, e.g.
by Baldock et al. (1992), Balesdent et al. (1998) and Guggenberger et al. (1994), the
C/N ratios decrease in the fine fractions of forest soils (Table 3). This is usually
ascribed to a higher contribution of microbial derived compounds to SOM (Amelung et
al., 1998; Haider, 1999; Schmidt and Kögel-Knabner, 2002).
4.2. Decreasing lignin contents with progressing decomposition
Solid state 13C CPMAS NMR spectra of particle size fractions of the Ah horizons from
the four European beech forest sites are presented in Fig. 2. Main resonances occured at
30, 56, 72, 105, 130, 150 and 173 ppm. Resonances at 72 ppm and 105 ppm are most
probably assigned to C2, C3, C5 and C1 in cellulose and non-crystalline
polysaccharides (Preston et al., 1998). The resonance at 30 ppm is typical for methylene
C in long chain aliphatic compounds, the features around 56, 130 and 150 ppm are
attributed to methoxyl, H-/C-substituted and phenolic C in lignin and tannins (Kögel-

4. O/N-ALKYL C AND ALKYL C ARE STABILISED 25
Knabner, 1997). N-alkyl of amino acids may also contribute to the signal at 56 ppm.
High signal intensities at 130 ppm often arise from the presence of condensed
aromatic C structures, such as in charred organic matter, but may also be explained by C
in C-C double bonds. Carbonyl C in carboxyl, amide, and ester groups of various
compounds contributes to the peak at 173 ppm.
�����������
�������
������
������������
�� ��� �� � ���
�� �����
������� ������������
�����������
�������
������
���� ��
�� ��� �� � ���
�� �����
������� ������������
�����������
�������
������
��������
�� ��� �� � ���
�� �����
������� ������������
�����������
�������
������
��������������
�� ��� �� � ���
�� �����
������� ������������
Figure 2: 13C CPMAS NMR spectra of bulk soils and particle size fractions of Ah horizons from the sites in Collelongo (a), Hesse (b), Sorø (c) and Leinefelde (62 years old stand) (d)

4. O/N-ALKYL C AND ALKYL C ARE STABILISED 26
Table 4 presents the relative intensities of the chemical shift areas. Integration of the
chemical shift regions showed high relative intensities of O/N-alkyl C (37 to 53%) and
alkyl C (22 to 34%) in the bulk soils as well as in the particle size fractions. Lower
intensities were found for aryl C (9-22 %) and carbonyl C (7-17%). The highest
variations between the relative intensities of particle size fractions were detected for
O/N-alkyl C and aryl C (Table 4). The contribution of O/N-alkyl C in all A horizons
decreased from the 200-2000 μm fraction (42-52%) to the 2-20 μm fraction (37-45%)
and increased from the 2-20 μm fraction to the <2 μm fraction (42-53%). Relative
intensities of aryl C declined from 19-21% in the 2000-200 μm fractions to 9-12% in
Table 4: Relative signal distributions of OC species in bulk soils and particle size fractions of Ah horizons determined by 13C CPMAS NMR spectroscopy
Site (Stand age)
Fraction Alkyl C
(0-45 ppm)
O/N-alkyl C
(45-110 ppm)
Aryl C
(110-160 ppm)
Carbonyl C
(160-220 ppm)
μm —————————% OC —————————
Collelongo Bulk soil 26.1 42.9 15.4 15.5 (109) 200-2000 22.1 43.2 18.1 16.5 2-20 21.6 40.5 21.5 16.4 <2 28.8 45.6 11.6 14.0 Hesse Bulk soil 26.4 48.6 14.5 10.5 (34) 200-2000 24.7 47.6 21.3 7.6 2-20 26.7 44.3 17.7 11.3 <2 29.4 53.2 8.9 8.5 Sorø Bulk soil 31.3 41.3 13.6 13.7 (60) 200-2000 29.1 41.9 19.2 9.8 2-20 33.3 37.4 13.8 15.4 <2 33.6 42.3 10.8 13.3 Leinefelde Bulk soil 24.9 47.9 13.5 13.7 (30/1) 200-2000 21.6 46.1 20.8 11.4 2-20 26.6 41.6 18.1 13.6 <2 22.2 52.6 11.1 14.1 Leinefelde Bulk soil 26.0 47.8 14.2 12.0 (30/2) 200-2000 23.0 50.9 18.7 7.4 2-20 27.3 43.1 18.5 11.2 <2 27.1 49.6 11.8 11.5 Leinefelde Bulk soil 29.9 42.1 14.3 13.7 (62) 200-2000 26.6 47.1 19.1 7.2 2-20 31.0 40.4 15.6 13.0 <2 27.1 51.5 11.0 10.8 Leinefelde Bulk soil 31.5 43.9 13.1 11.5 (111) 200-2000 27.9 43.3 19.2 9.6 2-20 31.9 40.2 15.2 12.7 <2 29.7 49.9 9.0 11.4 Leinefelde Bulk soil 27.2 47.2 13.9 11.7 (153+16) 200-2000 23.7 51.9 17.0 7.4 2-20 26.0 45.4 17.4 11.1 <2 25.2 52.3 11.3 12.5

4. O/N-ALKYL C AND ALKYL C ARE STABILISED 27
the <2 μm fractions. The relative proportion of O-aryl C is correlated with the
C/N ratios at the Chronosequence Leinefelde as well as at the European Sites
(Fig. 3 a,b). The relation between O-aryl C intensity and C/N ratio in particle size
fractions is non-linear. Similar to the relative intensity of O-aryl C the proportion of
H/C-aryl C decreased with progressing turnover at the Chronosequence Leinefelde as
well as at the European Sites. This leads to nearly linear relations between O-aryl C and
H/C-aryl C intensities (Fig. 4 a,b).
Figure 3: Relative intensity of O-aryl C in relation to C/N ratios in L horizons (L) and in bulk soil samples and particle size fractions of Ah horizons (Ah) (a) from the Chronosequence Leinefelde and (b) from the sites in Collelongo, Hesse, Sorø and Leinefelde (62 years old stand)
Figure 4: Relative intensity of H/C-aryl C in relation to relative intensity of O-aryl C in L horizons (L) and in bulk soil samples and particle size fractions of Ah horizons (Ah) (a) from the Chronosequence Leinefelde and (b) from the sites in Collelongo, Hesse, Sorø and Leinefelde (62 years old stand)
C/N ratio0 10 20 30 40
0
2
4
6
8 (b)
y= 8.2-(45.1/x)r2=0.64*** rS=0.82***
Ah: bulk soilL: bulk soil Ah: 2000-200 µm
Ah: 20-2 µmAh: <2 µm
C/N ratio0 10 20 30 40
O-a
ryl C
[%]
0
2
4
6
8 (a)
y= 8.2-(50.4/x)r2=0.81*** rS=0.77***
Ah: bulk soilL: bulk soil Ah: 2000-200 µm
Ah: 20-2 µmAh: <2 µm
O-aryl C [%]0 2 4 6 8
0
4
8
12
16 (b)
y= 1.1x+5.4r2=0.69*** rS=0.78***
Ah: bulk soilL: bulk soil Ah: 2000-200 µm
Ah: 20-2 µmAh: <2 µm
O-aryl C [%]0 2 4 6 8
H/C
-ary
l C [%
]
0
4
8
12
16 (a)
y= 1.0x+5.8r2=0.77*** rS=0.72***
Ah: bulk soilL: bulk soil Ah: 2000-200 µm
Ah: 20-2 µmAh: <2 µm

4. O/N-ALKYL C AND ALKYL C ARE STABILISED 28
The contents of CuO oxidation products normalised to OC are given in Table 5. The
sum of CuO oxidation products VSC in the bulk soils ranged between 10 and
22 g kg-1 OC. The highest concentrations of CuO oxidation products were present in the
Table 5: Concentrations, enrichment ratios (EVSC) and stocks of phenolic CuO-oxidation products (VSC) and acid-to-aldehyde ratios of syringyl units (Ac/Al)s in bulk soil and particle size fractions of Ah horizons
Site (stand age)
Fraction VSC EVSC VSC stock % of bulk soil VSC stock
(Ac/Al)S
μm g kg-1 OC 10-3 kg m-2 % 10-1
Collelongo Bulk soil 10 53 3.3 (109) 200-2000 27 2.8 7 13 2.6 20-200 12 1.2 6 11 4.2 2-20 14 1.6 27 51 3.6 <2 5 0.6 14 25 3.7
Hesse Bulk soil 17 32 2.3 (34) 200-2000 30 1.8 10 32 1.9 20-200 34 2.0 5 17 2.5 2-20 25 1.5 10 31 2.6 <2 6 0.4 6 20 5.2 Sorø Bulk soil 8 83 5.1 (60) 200-2000 15 1.8 20 25 3.3 20-200 20 2.4 23 28 5.3 2-20 6 0.7 26 32 6.5 <2 2 0.2 13 16 9.1 Leinefelde Bulk soil 13 73 2.9 (30/1) 200-2000 29 2.2 20 27 2.8 20-200 36 2.7 20 28 2.3 2-20 19 1.4 21 29 2.8 <2 5 0.4 12 16 3.3 Leinefelde Bulk soil 18 55 2.3 (30/2) 200-2000 39 2.2 24 44 1.4 20-200 37 2.0 7 16 2.6 2-20 21 1.2 11 25 2.4 <2 7 0.4 6 15 2.5
Leinefelde Bulk soil 19 59 2.7 (62) 200-2000 49 2.6 17 28 2.4 20-200 38 2.0 12 20 2.5 2-20 19 1.0 23 40 3.0 <2 6 0.3 7 12 3.2
Leinefelde Bulk soil 22 42 3.2 (111) 200-2000 42 1.9 11 25 2.8 20-200 40 1.8 11 26 3.5 2-20 28 1.3 16 38 3.7 <2 6 0.2 5 11 4.5
Leinefelde Bulk soil 15 32 2.9 (153+16) 200-2000 32 2.1 11 34 2.5 20-200 26 1.7 2 7 3.4 2-20 22 1.5 13 42 3.2 <2 6 0.4 6 17 4.1

4. O/N-ALKYL C AND ALKYL C ARE STABILISED 29
fractions from 2 to 2000 μm. The SOM of the 200-2000 μm fractions had VSC
concentrations between 15 and 49 g kg-1 OC, the 20-200 μm fractions between
12 and 40 g kg-1 OC and the 2-20 μm fractions between 6 and 28 g kg-1 OC. In contrast
only 2-7 g kg-1 OC was determined in the <2 μm particle size class. The highest lignin
stocks occurred either in the 2-20 μm fractions or the 200-2000 μm fractions, the lowest
either in the <2 μm fractions (due to low concentrations of VSC components) or in the
20-200 μm fractions (due to the low carbon stocks). However, at Hesse and Sorø, the
contents of CuO products in the 20-200 μm fractions were higher than in the
200-2000 μm fractions. With the exception of the 2-20 μm fraction in Sorø, enrichment
factors (EVSC) of the coarse fractions were >1, whereas the clay fractions showed
enrichment factors <1. With the exception of Collelongo and Leinefelde 30/2, the
acid-to-aldehyde ratios were lowest in the 200-2000 μm fraction and highest in the
<2 μm fractions. The VSC concentrations, as determined by alkaline CuO oxidation,
correlated with the signal intensities of O-aryl C (140-160 ppm) (Fig. 5 a,b).
Figure 5: Relative intensity of O-aryl C in relation to concentrations of alkaline CuO oxidation products (VSC) in the particle size fractions of Ah horizons (a) from the Chronosequence Leinefelde and (b) from the sites in Collelongo, Hesse, Sorø and Leinefelde (62 years old stand).
At Leinefelde the amounts of lignin in the particle size fractions increased with
increasing OC concentrations in the respective fractions (Fig. 6). Similar relations are
expected for the other sites, but the number of data pairs was not sufficient to compile
similar plots.
O-aryl C [%]0 2 4 6 8
0
10
20
30
40
50
60(b) y= 5.1x-8.5
r2=0.54** rS=0.78**
Ah: 2000-200 µm
Ah: 20-2 µm
Ah: <2 µm
O-aryl C [%]0 2 4 6 8
VS
C [g
kg-1
OC
]
0
10
20
30
40
50
60(a) y= 7.5x-14.7
r2=0.78*** rS=0.88***
Ah: 2000-200 µm
Ah: 20-2 µm
Ah: <2 µm

4. O/N-ALKYL C AND ALKYL C ARE STABILISED 30
Figure 6: Alkaline CuO oxidation products (VSC) in relation to OC concentration in the particle size fractions of Ah horizons from the Chronosequence Leinefelde.
The O/N-alkyl C contribution decreased from sand to silt fractions, but increased again
in the clay fractions. This trend of O/N-alkyl C proportions in the particle size fractions
(Table 4, Fig. 2) is consistent with results from Beudert et al. (1989), Preston et al.
(1994) and Skjemstad et al. (1996), but contrary to various other 13C CPMAS NMR
studies showing clay fractions to consist predominantly of alkyl C (Baldock et al., 1992;
Zech and Guggenberger, 1996; Quideau et al., 2000). Preston et al. (1994) discussed
that higher O/N-alkyl C proportions in clay fractions might be attributed to a lower
decomposition. However, this falls short of explaining the differences in O/N-alkyl C
proportions between the <2 μm fractions and 2-20 μm fractions of our soils; all <2 μm
fractions of this study were characterised by higher O/N-alkyl C proportions in
comparison to the 2-20 μm fractions, whereas, at the same time, low C/N ratios
indicated an increased decomposition stage. Most of the carbon assimilated by fungi
and bacteria during decomposition ends up with microbial structures containing a
significant proportion of O/N-alkyl C (Baldock et al., 1990; Golchin et al., 1996).
Therefore the increasing proportion of O/N-alkyl C in the <2 µm fraction may arise
from microbial sugars (Baldock et al., 1997; Schmidt and Kögel-Knabner, 2002).
Higher mass ratios of (galactose+mannose)-to-(arabinose+xylose) in clay fractions of
different origin support this assumption (Guggenberger et al., 1994; Guggenberger and
Zech, 1999; Kiem and Kögel-Knabner, 2003).
The aryl C signals, mainly ascribed to lignin and tannin, decreased with decreasing
particle size (Table 4, Fig. 2). This is indicative of either a complete decomposition or
transformation with a loss of the phenolic and aromatic structures. The clear decrease
OC [g kg-1]10 100 1000
VS
C [g
kg-1
]
0.1
1
10
Ah: 2000-200 µm Ah: 20-2 µm
Ah: <2 µmAh: 200-20 µm

4. O/N-ALKYL C AND ALKYL C ARE STABILISED 31
was more apparent as no or only little charred OC was incorporated into the soils that
would result in overlapping of 13C CPMAS NMR signal intensities in the aryl C region.
In contrast to many other studies (Skjemstad et al., 1996; Mahieu et al., 1999; Kiem et
al., 2000) low aryl C signal intensities around 130 ppm were found, particularly in the
<2 μm and 2-20 μm fractions. This agreed well with results of Skjemstad et al. (1997).
They detected high amounts of charred organic matter in Australian grassland soils
which were under aboriginal fire management presumably for thousands of years,
whereas adjacent forested soils which were not subjected to regularly burning, contain
little charred OC. Schmidt et al. (1999) reported a substantial variability of charred OC
content in German soils, ranging from 0–45% of the total OC in A horizons.
Lignin and tannin contain O-aryl C as well as H/C-aryl C as structural units. The
narrowing C/N ratios together with decreasing O-aryl C proportions (Table 3, Table 4,
Fig. 3 a,b) confirmed the decreasing proportion of O-aryl C with progressing degree of
decomposition. The O-aryl C intensities in the 200-2000 μm fractions and the
L horizons were similar (around 6%). This demonstrated that SOM in 200-2000 μm
fractions was strongly influenced by relatively fresh and only slightly decomposed plant
material. The C/N ratios and the O-aryl C intensities in the <2 μm fractions decreased
when compared to coarse fractions. In spite of different climate, stand ages, soil types
and textures at the sampling sites, similar O-aryl C intensities at specific stages of
decomposition were detected. This indicated that site specific conditions did not affect
the relation between O-aryl C intensity and C/N ratio. The decrease of O-aryl C
intensity was accompanied by a decrease of H/C-aryl C intensity. At all sites the
O-aryl C intensity was positively correlated with the H/C-aryl C intensity (Fig. 4 a,b)
indicating that the H/C-aryl C signal can in the main part be assigned to phenolic
compounds like lignin and tannin. In addition, alkenes are assumed to contribute to the
H/C-aryl C signal (Kögel-Knabner, 1997). They likely explain the higher H/C-aryl C
intensities in comparison to the respective O-aryl C intensities.
The VSC values pointed out a high range of lignin concentrations in each particle size
class (Table 5). The contents of VSC and the corresponding enrichment factors
underlined that lignin oxidation products were accumulated in coarse particle size
fractions, whereas the clay fractions were depleted in lignin oxidation products. Similar
trends for the VSC contents from coarse to fine fractions were previously described by

4. O/N-ALKYL C AND ALKYL C ARE STABILISED 32
Beudert et al. (1989), Kögel-Knabner & Ziegler (1993) and Guggenberger et al. (1994).
The increasing degree of lignin degradation from coarse to fine fractions is supported by
the acid-to-aldehyde ratios (Table 5). There is no correlation between age of the forest
stand and the acid-to-aldehyde ratios across the chronosequence suggesting that the
stand age did not affect the degradation status of lignin.
The results of the wet chemical lignin analysis confirmed the trend for O-aryl C found
by 13C CPMAS NMR spectroscopy (Fig. 5 a,b). Thus, we assume that the signal at
150 ppm can almost entirely be assigned to lignin and/or tannin. However, the
correlation was stronger if taking only values from the Chronosequence Leinefelde
indicating that other O-aryl C components like tannins contributed in different extent to
the O-aryl C intensities at the European Sites. The correlations between the results of
alkaline CuO oxidation and 13C CPMAS NMR spectroscopy underlined that the
removal of aromatic carbon due to HF treatment was negligible or at least did not affect
the bulk functional group characterisation by 13C CPMAS NMR spectroscopy. Distinct
relations between the VSC concentration and the OC concentration existed for the
particle size fractions of Leinefelde, the increase of lignin with increasing OC
concentrations being lowest in the clay fraction (Fig. 6). A similar trend was reported
for a number of bulk forest soils by Kögel-Knabner (2000). The relative contribution of
lignin to SOM in the particle size fractions appeared to be independent from the OC
concentration in the specific particle size fractions. The higher the magnitude of the OC
stocks in the individual particle size fractions, the higher was the magnitude of the VSC
stocks. This indicated that the magnitudes of the lignin stocks in bulk soil samples were
mainly controlled by the particle size distribution.
4.3. Chemical composition and turnover
The pmC values in the particle size fractions of the Ah horizons ranged from 91 to 113
(Table 6). Compared to the pmC values in the coarse fractions, lower pmC values were
found in the clay fraction. The SOM of most particle size fractions showed pmC values
higher than 100 and therefore the SOM in these fractions was younger than 50 years on
average. Only the SOM of clay fractions in Collelongo and Sorø was clearly older and
had pmC values of 91 and 99, which is equivalent to 734 and 70 years before present,
respectively.

4. O/N-ALKYL C AND ALKYL C ARE STABILISED 33
Table 6: Percent modern carbon in particle size fractions of Ah horizons
Positive, site specific relations were found between the O-aryl C intensities and the
pmC values at all sites (Fig. 7). Fractions containing the youngest carbon were enriched
in O-aryl C, whereas the fractions with the oldest carbon were depleted in O-aryl C. A
completely different pattern was obtained for the relation between the O/N-alkyl C
intensity and the percentage of modern carbon (Fig. 8), with a strong increase of
O/N-alkyl C content in the fine fractions with long turnover times.
Figure 7: Relative intensity of O-aryl C in relation to pmC values in <2 μm, 2-20 μm and 200-2000 μm fractions of Ah horizons
O-aryl C [%]
0 2 4 6 8 10
pmC
90
95
100
105
110
115
Leinefelde (62)
HesseCollelongo
Sorø
Site (Stand age)
Fraction pmC
μm %
Collelongo 200-2000 108.2 (109) 20-200 112.1 2-20 100.6 <2 91.3 Hesse 200-2000 112.5 (34) 20-200 110.3 2-20 110.0 <2 105.9 Sorø 200-2000 111.9 (60) 20-200 110.1 2-20 104.7 <2 99.2 Leinefelde 200-2000 113.2 (62) 20-200 110.0 2-20 111.2 <2 109.4
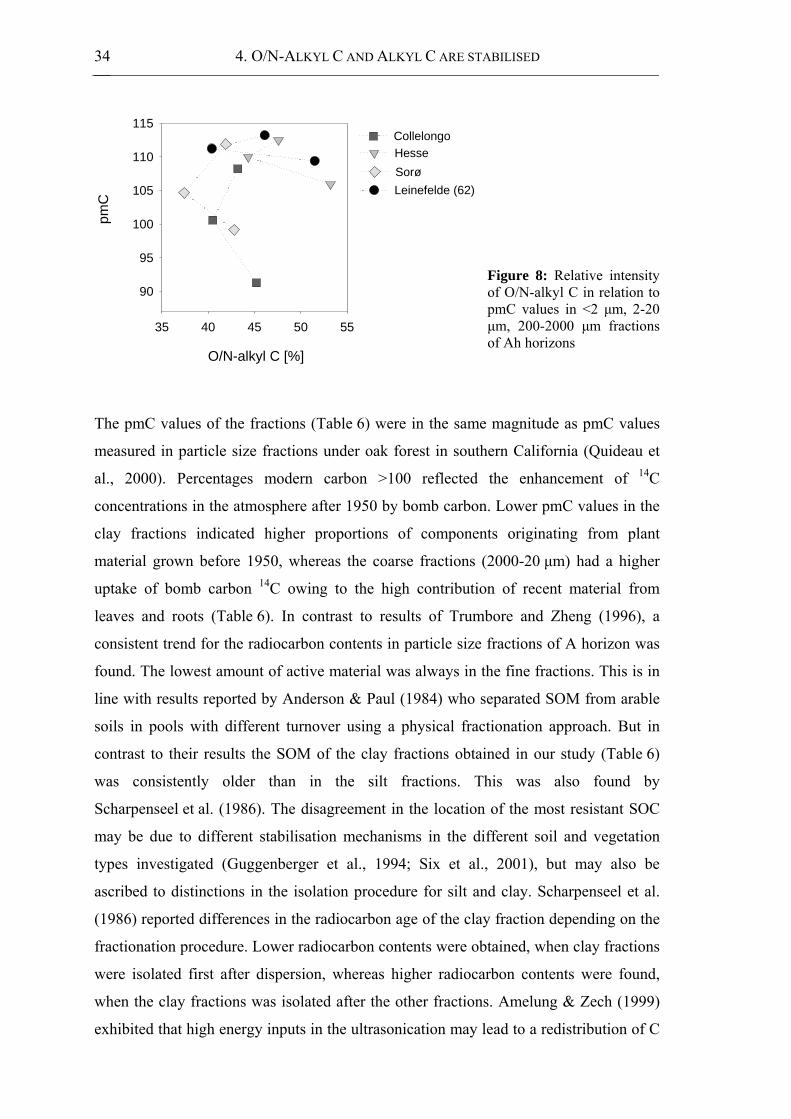
4. O/N-ALKYL C AND ALKYL C ARE STABILISED 34
Figure 8: Relative intensity of O/N-alkyl C in relation to pmC values in <2 μm, 2-20 μm, 200-2000 μm fractions of Ah horizons
The pmC values of the fractions (Table 6) were in the same magnitude as pmC values
measured in particle size fractions under oak forest in southern California (Quideau et
al., 2000). Percentages modern carbon >100 reflected the enhancement of 14C
concentrations in the atmosphere after 1950 by bomb carbon. Lower pmC values in the
clay fractions indicated higher proportions of components originating from plant
material grown before 1950, whereas the coarse fractions (2000-20 μm) had a higher
uptake of bomb carbon 14C owing to the high contribution of recent material from
leaves and roots (Table 6). In contrast to results of Trumbore and Zheng (1996), a
consistent trend for the radiocarbon contents in particle size fractions of A horizon was
found. The lowest amount of active material was always in the fine fractions. This is in
line with results reported by Anderson & Paul (1984) who separated SOM from arable
soils in pools with different turnover using a physical fractionation approach. But in
contrast to their results the SOM of the clay fractions obtained in our study (Table 6)
was consistently older than in the silt fractions. This was also found by
Scharpenseel et al. (1986). The disagreement in the location of the most resistant SOC
may be due to different stabilisation mechanisms in the different soil and vegetation
types investigated (Guggenberger et al., 1994; Six et al., 2001), but may also be
ascribed to distinctions in the isolation procedure for silt and clay. Scharpenseel et al.
(1986) reported differences in the radiocarbon age of the clay fraction depending on the
fractionation procedure. Lower radiocarbon contents were obtained, when clay fractions
were isolated first after dispersion, whereas higher radiocarbon contents were found,
when the clay fractions was isolated after the other fractions. Amelung & Zech (1999)
exhibited that high energy inputs in the ultrasonication may lead to a redistribution of C
O/N-alkyl C [%]
35 40 45 50 55
pmC
90
95
100
105
110
115
Leinefelde (62)
HesseCollelongo
Sorø

4. O/N-ALKYL C AND ALKYL C ARE STABILISED 35
from the coarse to the fine fractions, which was avoided in the two-step procedure
(Amelung and Zech, 1999) applied here. These results emphasise the importance of
optimising the currently used fractionation procedures and the need for information on
turnover of fractions obtained for a larger number of soils.
The relations between O-aryl C and pmC as well as O/N-alkyl C and pmC (Fig. 7;
Fig. 8) underline the different behaviour of lignin and polysaccharides during
humification (Kiem and Kögel-Knabner, 2003) and point to a specific stabilisation
mechanism of O/N-alkyl C in the clay fraction. Organic carbon pools with a higher
degree of turnover are characterised by an accumulation of O/N-alkyl C and are
depleted in aryl C, although aromatic compounds such as lignin are considered highly
recalcitrant. Lignin is recalcitrant in early stages of decomposition and is decomposed at
slower rates than plant polysaccharides (Haider 1999), but in the long term lignin is
completely decomposed in soils. In some soils it may accumulate in the silt-sized
fractions (Baldock et al., 1992), due to retarded decomposition. However, there seems
to be no stabilisation of lignin or other phenolic compounds as a result of interactions
with clay minerals confirming results of Kiem & Kögel-Knabner (2003). Plant-derived
polysaccharides are also degraded in soils, but polysaccharides of most likely microbial
origin accumulate in the fine fractions of some soils. Kiem and Kögel-Knabner (2003)
show positive relations between the polysaccharide C and the surface area and propose
interactions of sugars with mineral surfaces in fine separates as a possible mechanism
for the long term stabilisation of polysaccharide-type carbon. The stabilisation of
O/N-alkyl C compounds in the clay fraction is supported by results of Gleixner et al.
(2002) who detected old polysaccharide components in SOM from agricultural soils.
However, clay fractions from other soils have a chemical composition dominated by
alkyl C (Baldock et al., 1992). These differences remain to be investigated, to better
understand the C stabilization mechanisms in different soils.

5. COMPOSITION OF OC POOLS IN LUVISOLS AND CAMBISOLS 36
5. Chemical composition of young and old organic carbon pools
throughout Luvisol and Cambisol profiles
Soils samples to study the composition of OC pools throughout Luvisol and Cambisol
profiles were obtained from managed beech (Fagus sylvatica L.) forest sites in
Hesse/France and Leinefelde/Germany as well as from the managed spruce (Picea
abies L.) forest site in Tharandt/Germany (Table 7). In Leinefelde and Tharandt
samples were collected from forest chronosequences. Soil types, classified according to
ISSS-ISRIC-FAO (1998), comprise Haplic Luvisols and Stagnic Luvisols in Leinefelde
and Hesse as well as Dystric Cambisols in Tharandt (Table 7). In all samples pH values
were <5.2. According to SSSA (2001) the soil texture varied from silt loam in soil
horizons from Tharandt to clay in Bt horizons from Leinefelde.
5.1. Organic carbon in coarse particle size fractions decreases with depth
OC concentrations of bulk soils and particle size fractions throughout Luvisol and
Cambisol profiles at Hesse, Leinefelde and Tharandt are listed in Table 8. The OC
concentrations ranged from 1 to 120 g kg-1 in the bulk soil and from 1 to 245 g kg-1 in
the particle size fractions. The <2 μm fractions (3-195 g kg-1) and the
200-2000 μm fractions (9-245 g kg-1) exhibited the highest OC concentrations in almost
all horizons. Only the 2-20 μm and 20-200 μm fractions from Tharandt (97) had OC
concentrations marginally greater than the OC concentration of the 200-2000 μm
fraction. The OC concentrations in bulk soil samples and particle size fractions
generally decreased from the A horizons (9-245 g kg-1) to the base of the profiles
(1-166 g kg-1). Some particle size fractions of the clay-rich Bt horizons from Leinefelde
(111, 153+16) did not follow this trend. Taking into account bulk density, horizon
thickness and percent by weight of particle size fractions, the bulk soil OC stocks and
the distribution of OC on particle size fractions was calculated (Table 8). OC stocks
ranged between 0.6 kg m-2 in the Btw horizon of Leinefelde (111) and 5.6 kg m-2 in the
Bw horizon of Tharandt (97). In all soils more than 51% of the total OC was found in
transition and subsoil horizons. With the exception of A horizons from Leinefelde (62)
and Tharandt (97), the highest proportion of OC was in the <2 μm fractions, which
contained between 27-86% of the bulk soil OC. In all soils profiles, the proportion of
OC stored in the <2 μm fraction increased from the A horizon (27-53%) to the AE, B,
EB and E horizons (44-86%) (Fig. 9).

5. COMPOSITION OF OC POOLS IN LUVISOLS AND CAMBISOLS 37
Site
(S
tand
age
) So
il cl
assi
ficat
ion
(WR
B)a
Hor
izon
(F
AO
)b D
epth
pH
(C
aCl 2)
C
ECe
Bas
e sa
tura
tion
Fed
Text
ure
200-
2000
μm
20
-200
μm
2-
20 μ
m
<2μm
m
cmol
c kg-1
%
g kg
-1
____
____
____
____
____
____
__ %
____
____
____
____
____
____
__
Hes
se
Stag
nic
Luvi
sol
Ah
0.00
-0.0
8 4.
1 6.
8 63
.9
13.0
1
28
40
31
(34)
AEh
g 0.
08-0
.31
3.9
5.2
20.7
14
.2
1 27
39
33
Eg
0.31
-0.5
8 4.
0 5.
1 24
.2
14.7
1
26
39
34
Btg
0.
58-1
.20+
4.
0 10
.4
53.6
17
.2
1 20
37
42
Lein
efel
de
Stag
nic
Luvi
sol
Ah
0.00
-0.0
8 4.
7 15
.8
96.6
7.
4 <1
24
45
31
(62)
Eg
0.08
-0.1
9 4.
0 6.
5 36
.9
5.7
<1
29
39
32
Btg
0.
19-0
.35
5.1
25.6
98
.8
10.4
1
12
31
57
Lein
efel
de
Hap
lic L
uvis
ol
Ah
0.00
-0.0
7 4.
5 10
.8
86.8
9.
6 1
23
40
36
(111
)
EBw
0.
07-0
.26
3.9
7.6
22.0
9.
0 1
35
37
28
Bw
0.
26-0
.35
4.1
9.5
42.1
11
.4
1 31
31
38
B
tw
0.35
-0.4
0 5.
0 31
.2
99.0
20
.4
1 12
18
70
Lein
efel
de
Stag
nic
Luvi
sol
Ah
0.00
-0.0
8 5.
0 16
.1
97.7
7.
9 <1
15
43
42
(153
+16)
c
Eg
0.08
-0.2
0 4.
4 10
.2
73.2
9.
2 <1
22
42
36
B
tg
0.20
-0.5
5 5.
2 33
.8
99.3
16
.2
<1
13
29
57
Thar
andt
D
ystri
c C
ambi
sol
Ah
0.00
-0.0
6 3.
0 14
.4
6.1
6.8
11
20
41
28
(24)
Bw
0.
06-0
.44
3.9
5.7
8.5
10.1
10
20
44
26
Thar
andt
D
ystri
c C
ambi
sol
Ah
0.00
-0.0
1 2.
9 12
.6
21.4
9.
9 n.
d.d
n.d.
d n.
d.d
n.d.
d
(97)
Bw
0.
01-0
.63
3.9
5.6
5.7
11.0
6
22
45
27
a W
orld
Ref
eren
ce B
ase
for s
oil r
esou
rces
, ISS
S-IS
RIC
-FA
O (1
998)
; b
Gui
delin
es fo
r pro
file
desc
riptio
n, F
AO
(199
0);
c 1
53 y
ears
old
tree
s (20
%)
mix
ed w
ith 1
6 ye
ars o
ld tr
ees (
80%
);
d n
.d. =
not
det
erm
ined
(lac
k of
sam
ple
mat
eria
l for
det
erm
inat
ion
of p
artic
le si
ze d
istri
butio
n)
Table 7: Characteristics of Cambisols and Luvisols from 2 spruce and 4 beech forest sites

5. COMPOSITION OF OC POOLS IN LUVISOLS AND CAMBISOLS 38
In most samples OC was preferentially associated with the <2 μm fractions (Table 8).
This is in accordance with previous studies with forest soils (Rumpel et al., 2004),
grassland soils (Amelung et al., 1998) and agricultural soils (Christensen, 1992). In the
A horizons, however, a significant proportion of the bulk soil OC was in the 2-20 μm,
20-200 μm, and 200-2000 μm fractions (Table 8). The contribution of OC in the 20-
2000 μm fractions to the total OC in the A horizons was much higher than in Ap-
horizons of Danish arable soils with different carbon and clay contents where the
percentage of SOM in 20-2000 μm fractions was in the range between 2 and 10%
(Christensen, 1992).
Figure 9: Distribution of organic carbon between particle size fractions in Cambisols and Luvisols
According to Christensen (1992), a major part of SOM in sand fractions consists of
partly decomposed, particulate plant and animal remains which are not involved in
organo–mineral complexes. Thus, the high proportion of the OC in 20-2000 μm
200-2000 µmfraction [%]
0 20 40 60 80 100
2-200 µmfraction [%]
0
20
40
60
80
100
<2 µmfraction [%]
0
20
40
60
80
100
Luvisol A horizon Luvisol E/B/EB horizonLuvisol AE horizon
Cambisol A horizon Cambisol B horizon

5. COMPOSITION OF OC POOLS IN LUVISOLS AND CAMBISOLS 39
Table 8: OC concentrations in bulk soil and particle size fractions, OC stocks in bulk soils and distribution of OC between particle size fractions in Cambisols and Luvisols
Site
H
oriz
on
OC
con
cent
ratio
n O
C st
ock
(sta
nd a
ge)
(FA
O)a
Bul
k so
il Pa
rticl
e si
ze fr
actio
ns
Bul
k so
il D
istri
butio
n on
par
ticle
size
frac
tions
20
0-20
00 μ
m
20-2
00 μ
m
2-20
μm
<2
μm
20
0-20
00 μ
m
20-2
00 μ
m
2-20
μm
<2
μm
____
____
____
____
____
____
___
g kg
-1 so
il ___
____
____
____
____
____
____
kg
m-2
__
____
____
____
____
____
____
% __
____
____
____
____
____
____
Hes
se
Ah
31
109
9 14
51
1.
8 17
8
21
53
(34)
A
Ehg
14
79
2 8
29
2.3
13
4 24
59
Eg
7 26
1
3 14
1.
7 8
5 17
70
Btg
1 19
1
1 3
0.9
10
4 17
70
Lein
efel
de
Ah
49
203
20
42
75
3.1
11
10
40
39
(62)
Eg
12
23
1 2
7 33
1.
7 14
3
28
54
Bt
g 8
166
2 4
10
1.6
6 3
15
76
Lein
efel
de
Ah
32
214
15
24
60
1.9
13
14
30
43
(111
) EB
w
11
129
1 5
33
2.4
9 4
18
69
Bw
7
78
1 3
15
0.7
8 3
21
68
Bt
w
12
40
2 4
15
0.6
8 2
3 86
Lein
efel
de
Ah
34
245
9 23
45
2.
1 17
5
30
49
(153
+16)
Eg
12
10
4 3
8 24
1.
5 7
5 25
62
Btg
8 62
4
5 11
2.
9 3
7 18
72
Thar
andt
A
h 69
59
36
34
13
6 2.
5 17
15
25
43
(2
4)
Bw
20
54
9 10
54
5.
6 26
11
19
44
Thar
andt
A
h 12
0 10
7 11
2 10
8 19
5 0.
7 8
23
42
27
(97)
Bw
12
9
5 5
39
4.9
5 8
21
66
a G
uide
lines
for p
rofil
e de
scrip
tion,
FA
O (1
990)

5. COMPOSITION OF OC POOLS IN LUVISOLS AND CAMBISOLS 40
fractions of the A horizons suggest a higher proportion of particulate organic matter
(POM) in forest soils compared to agricultural soils. These results agree well with a
study on the dynamics in a forest-cultivation sequence, where POM was affected the
most by cultivation (Balesdent et al., 1998).
Generally, the contribution of 2-200 μm and 200-2000 μm fractions to the total OC
decreased with depth whereas the contribution of the <2 μm fractions increased (Fig. 9).
This is in line with a study of Kaiser et al. (2002) who showed that the contribution of
the sand fraction to the total OC in a Cambisol and Podzol covered by spruce and beech
forest decreased from 12-21% in the topsoils to 3-6% in the C horizons. We suppose
that the decrease of OC in coarse particle size fractions reflects a decreasing litter input
with increasing soil depth.
5.2. Young OC fraction is isolated by particle size fractionation
Table 9 presents the percentage modern carbon (pmC) and the radiocarbon ages of
particle size fractions from Hesse (34), Leinefelde (62) and Tharandt (97). We tried to
analyse all particle size fractions for radiocarbon content, but the OC contents in the
20-200 μm fractions from Hesse (34) were too small even for analysis by AMS. The OC
in the 200-2000 μm fractions from all sites and horizons had pmC values >100 and was
modern. In addition, also the OC in <2 μm, 2-20 μm and 20-200 μm fractions of the
A horizons from Hesse (34) and Leinefelde (62) and the <2 μm fraction of the transition
horizon from Hesse (34) was modern with pmC values >101.
All other fractions had pmC values between 55 and 98 corresponding to radiocarbon
ages between 189 and 4745 yrs before present (B.P.). In most particle size fractions
pmC values decreased with increasing soil depth. The decline was much more
pronounced in the < 2 μm, 2-20 μm and 20-200 μm fractions compared to the
200-2000 μm fraction (Table 9).
The highest pmC values, in the topsoil as well as in the subsoil horizons, were always
obtained in the 200-2000 μm fractions (Table 9). This confirmed a study which showed
that the youngest OC in Aquic Hapludolls is located in the 20-2000 μm fractions
(Scharpenseel et al., 1986). Radiocarbon ages in soils are strongly related to the input of

5. COMPOSITION OF OC POOLS IN LUVISOLS AND CAMBISOLS 41
Table 9: Percent modern carbon (pmC) and radiocarbon age in particle size fractions of Cambisols and Luvisols
Si
te
(Sta
nd a
ge)
Hor
izon
(F
AO
)a p
mC
in
par
ticle
size
frac
tions
Rad
ioca
rbon
age
in
par
ticle
size
frac
tions
200-
2000
μm
20
-200
μm
2-
20 μ
m
<2 μ
m
20
0-20
00 μ
m
20-2
00 μ
m
2-20
μm
<2
μm
%
Y
ears
B.P
.
Hes
se
Ah
112.
51
110.
31
110.
00
105.
93
m
oder
n m
oder
n m
oder
n m
oder
n (3
4)
AEh
g 10
7.60
n.
d.b
97.6
7 10
1.24
mod
ern
n.d.
b
189
mod
ern
Eg
10
3.04
n.
d. b
91.5
7 91
.48
m
oder
n n.
d. b
70
8 71
5
B
tg
103.
72
n.d.
b
n.d.
b
55.4
0
mod
ern
n.d.
b
n.d.
b
4745
Lein
efel
de
Ah
113.
21
109.
95
111.
23
109.
39
m
oder
n m
oder
n m
oder
n m
oder
n (6
2)
Eg
105.
31
81.0
3 93
.82
92.5
2
mod
ern
1698
51
2 62
5
Btg
10
2.85
85
.05
86.4
6 75
.80
m
oder
n 13
01
1169
22
26
Thar
andt
A
h 11
0.12
97
.06
93.0
7 95
.18
m
oder
n 23
9 57
7 39
7 (9
5)
Bw
10
0.14
91
.53
90.1
3 90
.00
m
oder
n 71
1 83
4 84
6 a
Gui
delin
es fo
r pro
file
desc
riptio
n, F
AO
(199
0)
b n
.d.=
not
det
erm
ined
(OC
con
tent
too
low
)
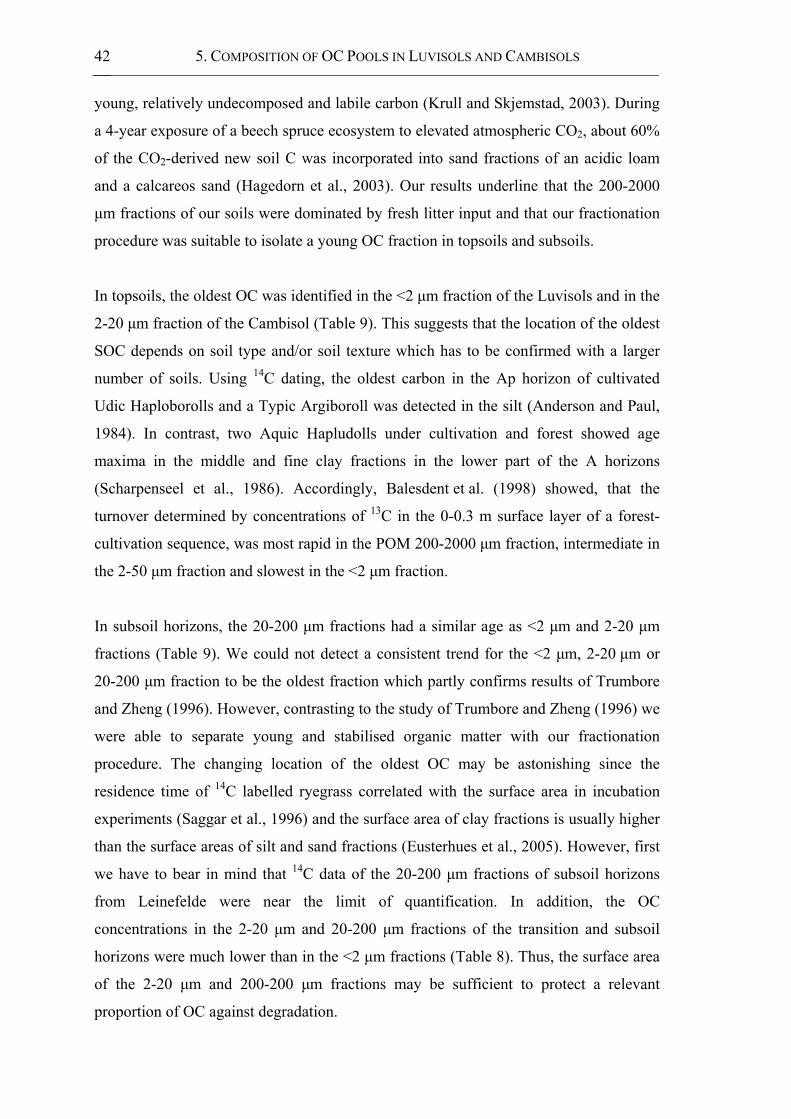
5. COMPOSITION OF OC POOLS IN LUVISOLS AND CAMBISOLS 42
young, relatively undecomposed and labile carbon (Krull and Skjemstad, 2003). During
a 4-year exposure of a beech spruce ecosystem to elevated atmospheric CO2, about 60%
of the CO2-derived new soil C was incorporated into sand fractions of an acidic loam
and a calcareos sand (Hagedorn et al., 2003). Our results underline that the 200-2000
μm fractions of our soils were dominated by fresh litter input and that our fractionation
procedure was suitable to isolate a young OC fraction in topsoils and subsoils.
In topsoils, the oldest OC was identified in the <2 μm fraction of the Luvisols and in the
2-20 μm fraction of the Cambisol (Table 9). This suggests that the location of the oldest
SOC depends on soil type and/or soil texture which has to be confirmed with a larger
number of soils. Using 14C dating, the oldest carbon in the Ap horizon of cultivated
Udic Haploborolls and a Typic Argiboroll was detected in the silt (Anderson and Paul,
1984). In contrast, two Aquic Hapludolls under cultivation and forest showed age
maxima in the middle and fine clay fractions in the lower part of the A horizons
(Scharpenseel et al., 1986). Accordingly, Balesdent et al. (1998) showed, that the
turnover determined by concentrations of 13C in the 0-0.3 m surface layer of a forest-
cultivation sequence, was most rapid in the POM 200-2000 μm fraction, intermediate in
the 2-50 μm fraction and slowest in the <2 μm fraction.
In subsoil horizons, the 20-200 μm fractions had a similar age as <2 μm and 2-20 μm
fractions (Table 9). We could not detect a consistent trend for the <2 μm, 2-20 μm or
20-200 μm fraction to be the oldest fraction which partly confirms results of Trumbore
and Zheng (1996). However, contrasting to the study of Trumbore and Zheng (1996) we
were able to separate young and stabilised organic matter with our fractionation
procedure. The changing location of the oldest OC may be astonishing since the
residence time of 14C labelled ryegrass correlated with the surface area in incubation
experiments (Saggar et al., 1996) and the surface area of clay fractions is usually higher
than the surface areas of silt and sand fractions (Eusterhues et al., 2005). However, first
we have to bear in mind that 14C data of the 20-200 μm fractions of subsoil horizons
from Leinefelde were near the limit of quantification. In addition, the OC
concentrations in the 2-20 μm and 20-200 μm fractions of the transition and subsoil
horizons were much lower than in the <2 μm fractions (Table 8). Thus, the surface area
of the 2-20 μm and 200-200 μm fractions may be sufficient to protect a relevant
proportion of OC against degradation.

5. COMPOSITION OF OC POOLS IN LUVISOLS AND CAMBISOLS 43
All A horizon particle size fractions of the Cambisol at the Tharandt (97) site had lower
pmC values than respective particle size fractions of the Luvisols from Hesse (34) and
Leinefelde (62) (Table 9). This is in accordance with results of Harrison et al. (2000),
who observed a higher mean residence time in mineral soil samples from the 0-0.05 m
layer under spruce (35-340 yrs) than under beech (65-140 yrs). The lower pmC values
in the A horizon from Tharandt (97) can probably be ascribed to the delay in the
incorporation of fresh plant litter in the mineral soil due to decreased biological activity
(Quideau et al., 2001b; Rumpel et al., 2002). The results of this study suggest that the
type of forest floor which was mull at the Luvisol sites and moder at the Cambisol site
affects the radiocarbon age in A horizons.
In this study the 14C activity in the individual particle size fractions decreased with
depth (Table 9). Similar results were obtained with bulk soil samples from Mollisols
(Scharpenseel et al., 1986), Kastanozems (Becker-Heidmann et al., 1988), Inceptisols
(Torn et al., 1997), and a Cambisol (Rumpel et al., 2002). The decrease of pmC values
with depth was much more pronounced in the <200 μm fractions compared to the coarse
fraction. These results indicate that OC in the 200-2000 μm fractions consists of labile
material throughout the profile, whereas stabilisation mechanisms act to an increasing
extent in all other fractions. The data showed that the difference in radiocarbon content
between the stabilised and the labile 200-2000 μm fractions increases with depth, which
can be explained by decreasing input of fresh organic material into the subsoil horizons.
5.3. Significant proportion of OC in clay fraction is HF soluble
Bulk soils, <2 μm and 2-20 μm fractions had to be treated with HF before 13C CPMAS NMR analysis. OC recoveries after HF treatment of bulk soils are given in
Table 10. The OC recoveries in bulk soils varied between 39 and 88% of the total OC.
In Fig. 10 a) the proportion of OC in <2 μm fractions is plotted versus the OC recovery
in bulk soils after HF treatment. The data showed a strong correlation between both
parameters (rs=0.90; p<0.01). A weaker correlation was obtained between OC recovery
after HF treatment and Fed concentration in bulk soils (rs=0.54; p<0.05). Table 11
presents the OC recoveries after HF treatment of the <2 μm and 2-20 μm fractions from
Hesse (34), Leinefelde (62) and Tharandt (97). On average, the OC recovery after HF
treatment was significantly higher (78% ± 4%) in 2-20 μm fractions compared to <2 μm
fractions (56% ± 5%).
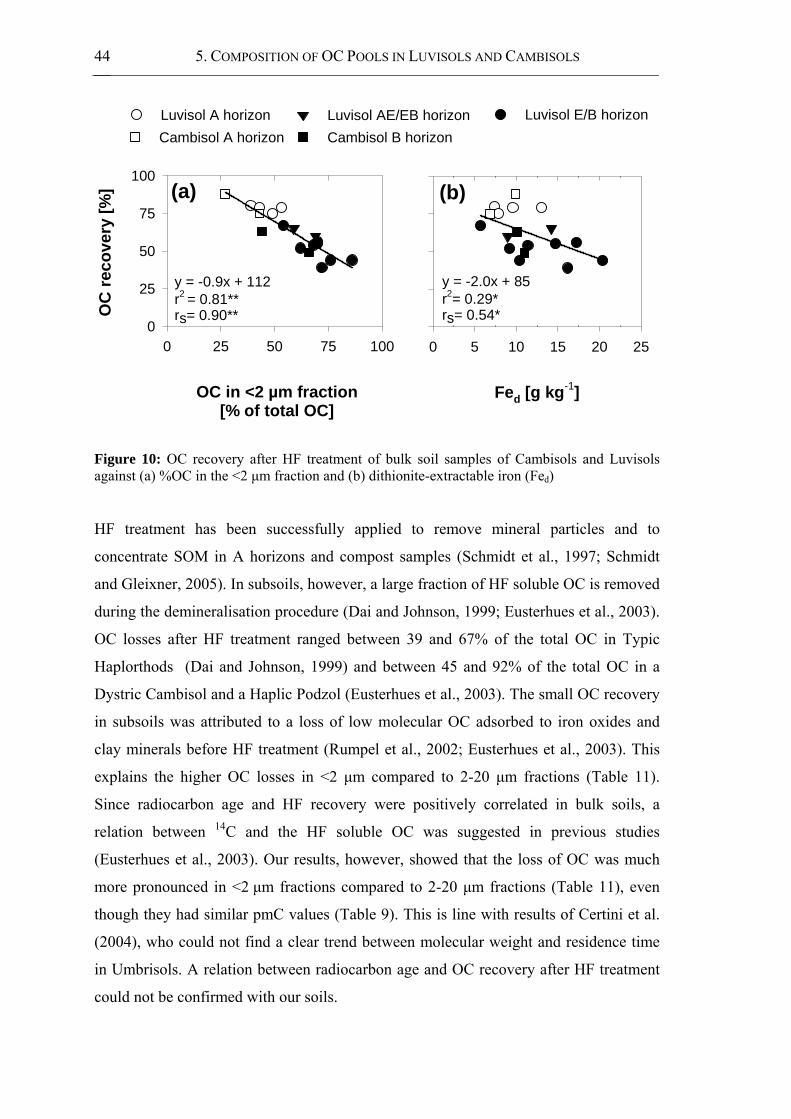
5. COMPOSITION OF OC POOLS IN LUVISOLS AND CAMBISOLS 44
OC in <2 µm fraction [% of total OC]
0 25 50 75 100
OC
reco
very
[%]
0
25
50
75
100
y = -0.9x + 112r2 = 0.81**rs= 0.90**
Fed [g kg-1]
0 5 10 15 20 25
y = -2.0x + 85r2= 0.29*rs= 0.54*
Luvisol E/B horizonLuvisol AE/EB horizonCambisol A horizon Cambisol B horizonLuvisol A horizon
(a) (b)
Figure 10: OC recovery after HF treatment of bulk soil samples of Cambisols and Luvisols against (a) %OC in the <2 μm fraction and (b) dithionite-extractable iron (Fed)
HF treatment has been successfully applied to remove mineral particles and to
concentrate SOM in A horizons and compost samples (Schmidt et al., 1997; Schmidt
and Gleixner, 2005). In subsoils, however, a large fraction of HF soluble OC is removed
during the demineralisation procedure (Dai and Johnson, 1999; Eusterhues et al., 2003).
OC losses after HF treatment ranged between 39 and 67% of the total OC in Typic
Haplorthods (Dai and Johnson, 1999) and between 45 and 92% of the total OC in a
Dystric Cambisol and a Haplic Podzol (Eusterhues et al., 2003). The small OC recovery
in subsoils was attributed to a loss of low molecular OC adsorbed to iron oxides and
clay minerals before HF treatment (Rumpel et al., 2002; Eusterhues et al., 2003). This
explains the higher OC losses in <2 μm compared to 2-20 μm fractions (Table 11).
Since radiocarbon age and HF recovery were positively correlated in bulk soils, a
relation between 14C and the HF soluble OC was suggested in previous studies
(Eusterhues et al., 2003). Our results, however, showed that the loss of OC was much
more pronounced in <2 μm fractions compared to 2-20 μm fractions (Table 11), even
though they had similar pmC values (Table 9). This is line with results of Certini et al.
(2004), who could not find a clear trend between molecular weight and residence time
in Umbrisols. A relation between radiocarbon age and OC recovery after HF treatment
could not be confirmed with our soils.

5. COMPOSITION OF OC POOLS IN LUVISOLS AND CAMBISOLS 45
5.4. Dominance of O/N-alkyl carbon and alkyl carbon throughout soil profiles
Fig. 11 shows 13C CPMAS NMR spectra of particle size fractions acquired from bulk
soils and particle size fractions from Hesse (34), Leinefelde (62) and Tharandt (97).
Figure 11: 13C CPMAS NMR spectra of particle size fractions acquired from bulk soils and particle size fractions of a Cambisol and two Luvisols. 13C CPMAS spectra of the bulk soil and the particle size fractions of the Btg horizon from Hesse could not be obtained, since the OC content was too low.
�����������
�������
������
�� �����
�����������
�������
������
����������������
�� ��� �� � ���
�����������
�������
������
��������������
�� ����� �� �����
�����������
�������
������
�� �����
�����������
�������
������
�� �����
�����������
�������
������
�� �����
�����������
�������
������
�� �����
�����������
�������
������
�� �����
���� �������
�
!��
�
"#!�
�
"��!�
�� ��� �� � ����� ��� �� � ���
������� ������������
������� ������������������� ������������

5. COMPOSITION OF OC POOLS IN LUVISOLS AND CAMBISOLS 46
Site (Stand age)
Horizon
(FAO)a
Recovery after HF treatment
Alkyl C
(0-45 ppm)
O/N-alkyl C
(45-110 ppm)
Aryl C
(110-160 ppm)
Carbonyl C
(160-220 ppm)
_____________________________ % ____________________________________
Hesse Ah 79 26 49 15 11 (34) AEhg 65 41 41 11 8 Eg 55 29 43 16 12 Btg 56 n.d.b n.d.b n.d.b n.d.b
Leinefelde Ah 80 30 42 14 14 (62) Eg 67 37 39 13 11 Btg 44 30 43 15 12
Leinefelde Ah 79 32 44 13 12 (111) EBw 60 42 42 8 7 Bw 54 40 40 12 9 Btw 44 32 47 10 11
Leinefelde Ah 75 27 47 14 12 (153+16) Eg 52 32 42 15 11 Btg 39 27 38 21 14
Tharandt Ah 75 34 36 15 15
(24) Bw 63 33 38 17 12
Tharandt Ah 88 32 39 15 14 (97) Bw 49 43 29 16 11 a Guidelines for profile description, FAO (1990) b n.d.= not determined (OC content too low)
13C CPMAS NMR spectra of the 20-200 μm fractions can not be presented, since they
contained too little carbon to provide well-resolved spectra. The main signals in all 13C CPMAS NMR spectra were observed at 30, 72, 105, 130, 150 and 173 ppm. The
resonance centred at 30 ppm indicated the presence of methylene C in long chain
aliphatic compounds, commonly derived from lipids, proteins, suberin and cutin
(Kögel-Knabner, 1997). Resonances centred at 72 ppm and 105 ppm may be attributed
to proteins and to C2, C3, C5 and C1 in cellulose and non crystalline polysaccharides
(Preston et al., 1998). The smaller signals around 130 and 150 ppm can be assigned to
H-/C-substituted and phenolic C typically present in lignin and tannin (Kögel-Knabner,
1997), but the signal at 130 ppm may also arise from charcoal or from olefinic C.
Carboxyl, amide, and ester groups contribute to the peak at 173 ppm.
Table 10: OC recovery after HF treatment and distributions of OC species in bulk soils of Cambisols and Luvisols as determined by 13C CPMAS NMR spectroscopy
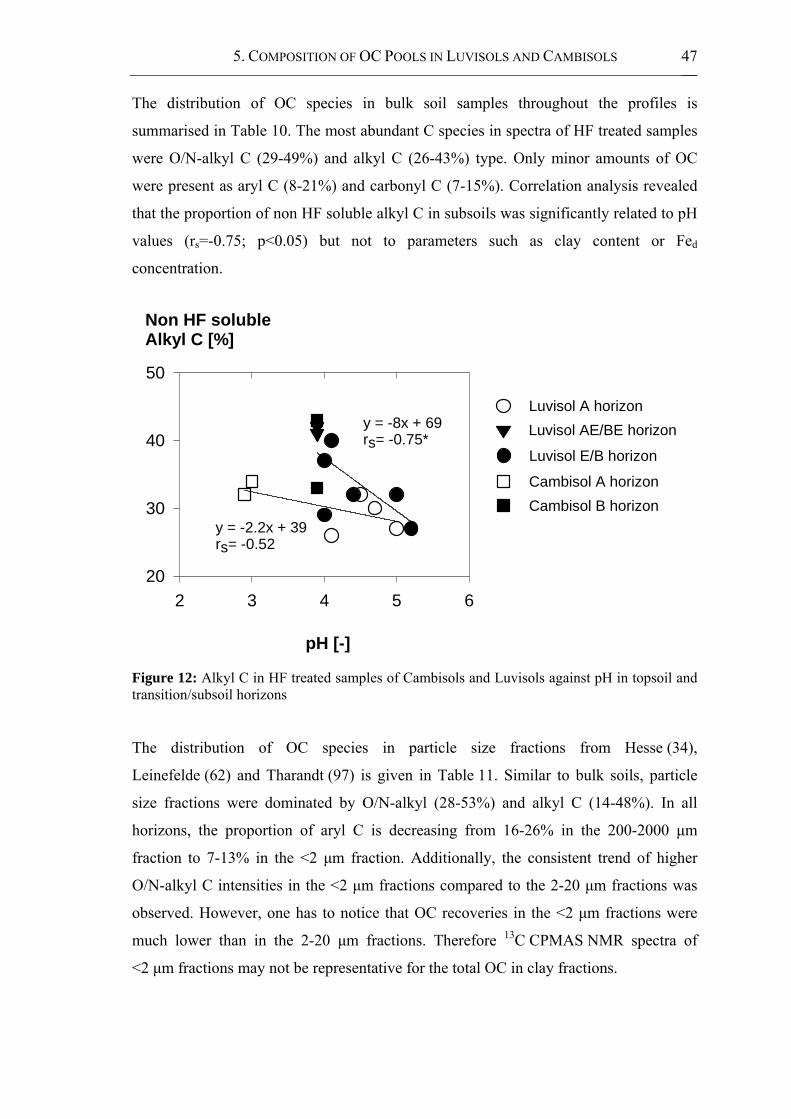
5. COMPOSITION OF OC POOLS IN LUVISOLS AND CAMBISOLS 47
pH [-]
2 3 4 5 6
Non HF soluble Alkyl C [%]
20
30
40
50
y = -8x + 69rs= -0.75*
Luvisol E/B horizon
Luvisol AE/BE horizon
Cambisol A horizonCambisol B horizon
Luvisol A horizon
y = -2.2x + 39rs= -0.52
The distribution of OC species in bulk soil samples throughout the profiles is
summarised in Table 10. The most abundant C species in spectra of HF treated samples
were O/N-alkyl C (29-49%) and alkyl C (26-43%) type. Only minor amounts of OC
were present as aryl C (8-21%) and carbonyl C (7-15%). Correlation analysis revealed
that the proportion of non HF soluble alkyl C in subsoils was significantly related to pH
values (rs=-0.75; p<0.05) but not to parameters such as clay content or Fed
concentration.
Figure 12: Alkyl C in HF treated samples of Cambisols and Luvisols against pH in topsoil and transition/subsoil horizons
The distribution of OC species in particle size fractions from Hesse (34),
Leinefelde (62) and Tharandt (97) is given in Table 11. Similar to bulk soils, particle
size fractions were dominated by O/N-alkyl (28-53%) and alkyl C (14-48%). In all
horizons, the proportion of aryl C is decreasing from 16-26% in the 200-2000 μm
fraction to 7-13% in the <2 μm fraction. Additionally, the consistent trend of higher
O/N-alkyl C intensities in the <2 μm fractions compared to the 2-20 μm fractions was
observed. However, one has to notice that OC recoveries in the <2 μm fractions were
much lower than in the 2-20 μm fractions. Therefore 13C CPMAS NMR spectra of
<2 μm fractions may not be representative for the total OC in clay fractions.

5. COMPOSITION OF OC POOLS IN LUVISOLS AND CAMBISOLS 48
Table 11: OC recovery after HF treatment and distribution of OC species in particle size fractions of a Cambisol and two Luvisols as determined by 13C CPMAS NMR spectroscopy
Site (Stand age)
Horizon (FAO)a
Fraction Recovery after HF treatment
Alkyl C
(0-45 ppm)
O/N-alkyl C
(45-110 ppm)
Aryl C
(110-160 ppm)
Carbonyl C
(160-220 ppm)
μm _______________________________________ % _______________________________________
Hesse Ah 200-2000 - 25 48 21 8 (34) 2-20 92 27 44 18 11 <2 70 29 53 9 9
AEhg 200-2000 - 28 48 17 7 2-20 86 42 34 15 9 <2 58 38 46 7 8
Eg 200-2000 - 26 42 23 9 2-20 95 35 43 11 10 <2 48 33 48 9 10
Btg 200-2000 - n.d.b n.d. b n.d. b n.d. b 2-20 71 n.d. b n.d. b n.d. b n.d. b <2 46 n.d. b n.d. b n.d. b n.d. b
Leinefelde Ah 200-2000 - 27 47 19 7 (62) 2-20 73 31 40 16 13 <2 69 27 51 11 11
Eg 200-2000 - 48 28 17 7 2-20 77 45 29 17 10 <2 52 36 44 9 11
Btg 200-2000 - 27 43 16 13 2-20 72 30 43 18 9 <2 40 26 46 13 15
Tharandt Ah 200-2000 - 24 49 18 9 (95) 2-20 77 36 39 13 11 <2 82 31 43 13 13
Bw 200-2000 - 14 52 26 8 2-20 62 45 30 18 8 <2 42 45 34 11 10 a Guidelines for profile description, FAO (1990) b n.d.= not determined (OC content too low)
Non HF treated 200-2000 μm fractions and OC recoveries >72% in HF treated 2-20 μm
fractions, allowed to examine for relations between the pmC values and the chemical
composition in the soil profile (Fig. 13). No significant correlations between pmC
values and O/N-alkyl C, alkyl C, aryl C or carbonyl C proportions in 2-20 μm and
200-2000 μm fractions, respectively, were observed.

5. COMPOSITION OF OC POOLS IN LUVISOLS AND CAMBISOLS 49
Figure 13: PmC values against alkyl C, O/N-alkyl C, aryl C and carbonyl C intensities in 2-20 μm and 200-2000 μm fractions of a Cambisol from Tharandt (97) and of Luvisols from Hesse (34) and Leinfelde (62)

5. COMPOSITION OF OC POOLS IN LUVISOLS AND CAMBISOLS 50
The structure of the SOM was dominated by alkyl C and O/N-alkyl C in bulk soils,
labile, and stabilised SOM fractions throughout the soil profiles, whereas aryl C and
carbonyl C were of minor importance (Table 10; Table 11). Beyer (1996) and Rumpel
et al. (2002) reported a similar dominance of alkyl and O/N-alkyl C in bulk soil samples
from Podzols and Cambisols. Alkyl C and O/N-alkyl material in the coarse fractions is
suggested to derive from leave, needle and root litter (Lorenz et al., 2004). Alkyl C and
O/N-alkyl C material in fine fractions most probably derived from bacteria and fungi
decomposing the plant litter (Baldock et al., 1990; Golchin et al., 1996). The
contribution of aromatic carbon to the stabilized organic matter in our soils samples was
rather small. In the literature, however, we found a couple of examples where high
contributions of aromatic compounds occurred (Zech and Guggenberger, 1996; Golchin
et al., 1997; Krull and Skjemstad, 2003). In those soil profiles most probably significant
amounts of black carbon were present and give signals primarily between 110 and 145
ppm (Haumaier and Zech, 1995; Nelson and Baldock, 2005). Several studies showed,
that plant derived aromatic compounds like lignin are not stabilised in the mineral soil
over a long period (Zech and Guggenberger, 1996; Schöning et al., 2005b). Only 28 and
20% of the total lignin but 47 and 75% of the total OC was stored in the Podzol and
Cambisol subsoils, where OC was characterised by a high degree of stabilisation
(Rumpel et al., 2002). Therefore high alkyl C and O/N-alkyl C proportions throughout
the soil profile appear to be characteristic for forest soils that were not subjected to
regular burning.
Using diffuse reflectance Fourier transform infrared spectroscopy, Capriel et al. (1995)
showed, that organic matter in sandy soils from southern Germany (n=92) contained
more aliphatic C (signal in the spectral region 2800-3000 cm-1) compared to soils rich in
clay. With the soils of this study, however, a significant correlation between sand
content and alkyl C could not be found. In fact, the proportion of alkyl C was correlated
to the pH (Fig. 12). A negative correlation (r=-0.72**) between pH and alkyl C was also
noted for 12 typical soils under agricultural use from north-western Germany (Beyer,
1993). Although analysis of alkyl C by sequential chemical degradation of forest soil
profiles together with CG MS analysis can not completely explain the alkyl C contents
determined by 13C CPMAS spectroscopy (Kögel-Knabner et al., 1992; Winkler et al.,
2005), there are indications for an accumulation of selected alkyl C species in soils with
a low pH level. According to Nierop et al. (2003) higher alkyl C contributions in acid
5. COMPOSITION OF OC POOLS IN LUVISOLS AND CAMBISOLS 51
soils may be explained by an accumulation of ester-bound aliphatic moieties like
suberin. Moreover, a higher proportion of OC in acid soils occurs in the form of lipids
or lipid-like constituents, which contribute between 1 and 20% to the total SOM
(Stevenson, 1994).
The contribution of O/N-alkyl C increased from the 20-2 μm fraction to the <2 μm
fraction (Table 11). This pattern was observed not only in topsoil but also in subsoil and
transition horizons. In subsoil clay fractions, however, one has to bear in mind the high
OC losses during demineralisation with HF which amounted >42% of the total OC mass
(Fig. 10). Therefore, the chemical composition of the soluble molecular material that is
removed together with the HF solution remains to be studied to assure the 13C CPMAS
NMR results for clay fractions. However, generally the OC losses during HF treatment
are explained by a preferred loss of easily soluble amino acids and amino sugars
(Gélinas et al., 2001; Mathers et al., 2002). Thus, the O/N-alkyl C proportion in
untreated clay fractions would be even higher. This would strengthen the described
trend of O/N-alkyl C intensities between particle size fractions. Higher mass ratios of
(galactose + mannose) -to- (arabinose + xylose) in clay fractions of A horizons under
forest indicate that O/N-alkyl C proportions in <2 μm fractions were in the most part
attributed to carbohydrates of microbial origin (Guggenberger et al., 1994). In clay
fractions of topsoils intimate associations between iron oxides and O/N-alkyl C are
evident and probably contribute to a stabilisation of O/N-alkyl C (Schöning et al.,
2005a). We expect that similar processes act in the subsoil horizons, although data for
microbial carbohydrates in particle size fractions of subsoils and their interaction with
the mineral phase are missing so far. Another pattern apparent between particle size
fractions is the decrease of relative intensities of aryl C along with decreasing particle
size (Table 11). This indicates a complete decomposition and/or transformation of plant
derived aromatic compounds like lignin and tannin in clay fractions. Again a similar
pattern for the distribution of carbon species in particle size fractions of topsoils and
subsoils was observed.
In previous studies, the selective stabilisation preservation of the rigid alkyl C
compounds was suggested (Baldock et al., 1992; Kögel-Knabner et al., 1992).
Accordingly, in the surface layer of a lysimeter under pine, there was a gradual increase
in turnover rate progressing from the floatable to the clay fraction, and differences in

5. COMPOSITION OF OC POOLS IN LUVISOLS AND CAMBISOLS 52
turnover rates among fractions corresponded to an increase in alkyl C/ O/N-alkyl C
ratio (Quideau et al., 2000). All these results were discussed in the context of different
particle size fractions from one horizon. In our study, however, we took a step forward
and compared the composition of SOM and turnover in the same particle size fractions
from different horizons. However, we could not find any relation between chemical
composition and radiocarbon content (Fig. 13). This confirms a study of Wattel-
Koekkoek and Buurman (2004) with NaOH and Na4P2O7 extracts from clay fractions
from Nitosols and Vertisols, where the variance in different OC types in liquid state 13C NMR spectra did not explain variance in 14C activity. Our results revealed that bulk
chemical composition may have an impact on the degradation of SOM at the short term,
as shown in particle size fractions of A horizons. In subsoils, however, mechanisms like
the adsorption and chemical binding to mineral surfaces or the physical encapsulation
appeared to be more important controls in respect to stabilisation of SOM.

6. INTIMATE ASSOCIATION BETWEEN IRON OXIDES AND O/N-ALKYL C 53
6. Intimate association between iron oxides and O/N-alkyl carbon in
clay fractions
Soil samples to study associations between iron oxides and SOC were collected from
A horizons of managed forest sites in Collelongo/Italy, Hesse/France, Sorø/Denmark,
Leinefelde/Germany and Tharandt/Germany (Table 12). Soils in Collelongo, Hesse,
Sorø and Leinefelde were covered with European beech (Fagus sylvatica L.), whereas
spruce (Picea abies) was the dominant tree species in Tharandt. Soil groups, classified
according to ISSS-ISRIC-FAO (1998), comprised Cambisols, Leptosols, Luvisols as
well as a Phaeozem. The A horizon thickness was between 0.01 to 0.25 m. According to
SSSA (2001), the soil texture varied from sandy clay loam to clay. The pH of the soils
ranged from very acid (Tharandt, pH 2.9-3.0) to almost neutral (Collelongo, pH 6.9).
The clay fractions of the A horizons were isolated by particle size fractionation. They
were characterised by OC concentrations between 50 and 233 g kg-1, whereas the
dithionite extractable iron concentrations ranged from 13 to 29 g kg-1.
6.1. Effect of demineralisation on organic carbon and nitrogen
In order to remove the mineral material including the paramagnetic Fe, the clay
fractions were treated with 10%HF. The HF treatment was accompanied by a loss of
mass, OC and N. Table 2 gives the recovery of mass, OC and N after demineralisation
(Eq. 1), the OC and N enrichment factors (Eq. 2) and the Q-values (Eq. 3). After
demineralisation, 13 to 42% of the initial mass of the samples was retained. The
recovery of OC ranged from 60 to 93%, whereas the N recovery ranged from 50 to
80%. Due to higher relative mass losses compared to OC and N losses, OC and N were
strongly concentrated in the HF treated samples. The enrichment factors of OC (2.2-5.5)
and N (1.9-4.3) reflected this feature.
In all samples the N recovery was lower than the OC recovery leading to Q-values >1.
However, some untreated samples showed a high variability of N concentrations. A
positive linear correlation between OC and N indicated that the recovery of N showed a
pattern comparable with that of the OC recovery (rs=0.87, p<0.01).

6. INTIMATE ASSOCIATION BETWEEN IRON OXIDES AND O/N-ALKYL C 54
Table 12: Characteristics of samples to study association between Fe oxides and SOM
Site
La
titud
e/
Long
itude
So
il cl
assi
ficat
ion
(WR
B)a
Bul
k so
il
Cla
y fr
actio
n
pH
(CaC
l 2)
Cla
y fr
actio
nb
OC
C
/N
Fed
Al d
Feo
Al o
Fed /
OC
g kg
-1
g
kg-1
——
—
g kg
-1
——
—
10-1
Col
lelo
ngo
41°5
2’N
/ 13°
38’E
R
endz
ic L
epto
sol
6.9
520
88
9.
7 25
.3
8.6
4.4
16.9
3.
0 H
esse
48
°40’
N/ 0
7°05
’E
Stag
nic
Luvi
sol
4.1
288
50
8.
4 21
.7
4.7
6.1
4.0
4.3
Sorø
55
°29’
N/ 1
1°38
’E
Stag
nic
Phae
ozem
4.
1 14
1
163
10.7
13
.0
7.2
4.5
8.4
0.8
Chr
onos
eque
nce
Lein
efel
de
Lein
efel
de 3
0-1
51°2
0’N
/ 10°
22’E
R
endz
ic L
epto
sol
5.5
441
62
9.
5 28
.1
5.0
4.6
7.9
4.6
Lein
efel
de 3
0-2
51°2
0’N
/ 10°
22’E
St
agni
c Lu
viso
l 5.
1 28
7
74
10.9
23
.6
4.9
3.7
5.2
3.2
Lein
efel
de 6
2 51
°20’
N/ 1
0°22
’E
Stag
nic
Luvi
sol
4.7
253
75
8.
6 19
.2
4.5
4.6
4.4
2.6
Lein
efel
de 1
11
51°2
0’N
/ 10°
22’E
H
aplic
Luv
isol
4.
5 23
6
60
8.9
25.9
5.
6 6.
4 6.
3 4.
3 Le
inef
elde
153
+16
51°2
0’N
/ 10°
22’E
St
agni
c Lu
viso
l 5.
0 36
6
45
8.7
16.7
3.
3 4.
7 4.
7 3.
7 C
hron
oseq
uenc
e Th
aran
dt
Thar
andt
5
50°5
6’N
/ 13°
29’E
D
ystri
-Sta
gnic
Cam
biso
l 3.
0 18
8
233
13.8
20
.8
6.0
5.5
4.9
0.9
Thar
andt
24
50°5
6’N
/ 13°
29’E
D
ystri
c C
ambi
sol
3.0
178
13
6 16
.8
28.7
9.
6 8.
7 7.
5 2.
1 Th
aran
dt 9
7 50
°56’
N/ 1
3°29
’E
Dys
tric
Cam
biso
l 2.
9 17
5
195
16.5
28
.4
6.4
13.0
5.
9 1.
5 a W
RB
: Wor
ld R
efer
ence
Bas
e fo
r soi
l res
ourc
es;
ISSS
-ISR
IC-F
AO
(199
8)
b c
lay
= <2
μm

6. INTIMATE ASSOCIATION BETWEEN IRON OXIDES AND O/N-ALKYL C 55
Table 13: Recovery of mass, organic carbon (OC) and nitrogen (N) after demineralisation of Ah horizon clay fractions with 10% hydrofluoric acid (HF)
Fig.14 shows the absolute dithionite extractable Fe content versus HF soluble OC. The
amount of HF soluble OC was higher in samples with a higher concentration of
dithionite extractable Fe oxides (rs=0.38, p<0.25). If the sample from Sorø was
considered as outlier the correlation between Fe content and HF soluble OC became
considerably stronger (rs=0.88, p<0.01).
OC was strongly concentrated during the demineralisation, indicated by high EOC values
(Table 13). However, it was not possible to avoid some OC losses during the
demineralisation. The average OC recovery of 71.6 ± 0.8% in the clay fractions was
quite low compared to recoveries of bulk soil samples from the surface layer. To give
an example, Skjemstad et al. (1994) reached OC recoveries of 83% to 90% in different
Site Mass recovery
OC recovery
EOCa N
recovery EN
b Qc
% % %
Collelongo 22 66 3.0 64 2.9 1.0
Hesse 13 70 5.5 50 3.9 1.4
Sorø 30 74 2.5 66 2.2 1.1
Chronosequence Leinefelde Leinefelde 30-1 14 60 4.4 59 4.3 1.0
Leinefelde 30-2 17 77 4.6 67 3.9 1.2
Leinefelde 62 20 69 3.5 55 2.8 1.3
Leinefelde 111 15 61 4.0 55 3.8 1.1
Leinefelde 153+16 20 65 3.3 57 2.9 1.2
Chronosequence Tharandt Tharandt 5 42 93 2.2 80 1.9 1.2
Tharandt 24 20 71 3.5 65 3.3 1.1
Tharandt 97 33 82 2.5 72 2.2 1.1 a EOC = g kg-1 of OC after demineralisation / g kg-1 of OC before demineralisation
b EN = g kg-1 of N after demineralisation / g kg-1 of N before demineralisation
c Q = OC/N ratio after demineralisation/ OC/N ratio before demineralisation

6. INTIMATE ASSOCIATION BETWEEN IRON OXIDES AND O/N-ALKYL C 56
Figure 14: Concentration of dithionite extractable Fe oxide in relation to the 10% hydrofluoric acid (HF) soluble OC in A horizon clay fractions. The sample from Sorø was considered as an outlier.
Australian soils (Hapludoll, Kandiustox, Pellustert, Natrustalf, Rodoxeralf) using 2%
HF. Schmidt et al. (1997) already described a lower OC recovery in HF treated clay
fractions from a Phaeozem with 77% in the clay fraction and 79 to 89% in the silt
fractions. Increasing values of OC losses during demineralisation in Collelongo, Hesse,
Leinefelde and Tharandt fitted together with increasing amounts of dithionite
extractable Fe (Fig. 14). This suggests that part of the HF soluble OC was stabilized by
Fe oxides. Oades et al. (1987) found a dominance of carbohydrates in dithionite extracts
and they suggested a substantial interaction of carbohydrates with Fe oxides. A
correlation between dithionite soluble Fe and HF soluble OC was previously observed
by Eusterhues et al. (2003) for subsoil samples. The correlation for our samples
indicated that additional factors, for example the chemical composition of the SOM or
the diversity and proportions of different Fe oxides, influence the dissolution of SOM
by HF. The high OC losses at Sorø may be explained by high proportions of acid
soluble, free particulate organic matter at this site.
After demineralisation, the recoveries and enrichment ratios of N were lower than the
corresponding recoveries and enrichment ratios of OC (Table 13). This was previously
Fed [g kg-1]
0 10 20 30 40
HF-
solu
ble
OC
[g k
g-1]
0
10
20
30
40
HF-sol.OC = 1.6 Fed-14.7
Leinefelde
TharandtCollelongo
Hesse
Sorø

6. INTIMATE ASSOCIATION BETWEEN IRON OXIDES AND O/N-ALKYL C 57
observed for some of the Ferrasols analysed by Goncalves et al. (2003). The higher N
losses during HF treatment may be explained by a preferred loss of easily soluble amino
acids and amino sugars (Gélinas et al., 2001; Mathers et al., 2002) that were protected
through sorption before HF treatment. Their signals are expected between 0 and 60 ppm
and around 176 ppm in the 13C CPMAS NMR spectra.
6.2. Selective signal loss
Fig. 15 presents the 13C CPMAS NMR spectra of clay fractions before and after
demineralisation. The main signals were at 30, 72, 103, 129 and 173 ppm,
corresponding to unresolved methyl, methylene and methane carbon (30), ring and
anomeric carbohydrate carbons (72 and 103), C- and H-substituted aromatic carbon and
olefines (129) and carboxyl, amide and ester carbons (173) (Preston et al., 1984). All
spectra were characterised by high signal to noise ratios, which enabled integration of
the chemical shift regions for quantification. However, the spectra of non HF treated
samples had broader resonance lines resulting in a stronger overlapping of signals at
103 ppm and 129 ppm.
The relative intensity distribution in the spectra of the samples before and after
demineralisation is given in Table 14. The dominating signal intensity occurred in the
region assignable to O/N-alkyl C and alkyl C type. Before demineralisation, the relative
intensity of O/N-alkyl C was in the range between 33 and 46% and that of alkyl C was
in the range between 28 and 40%. The relative intensities of the aryl C and carbonyl C
signals were < 16%. After demineralisation, the spectra of the samples from Collelongo,
Hesse, Sorø and Leinefelde (30/1, 30/2, 62, 111, 153+16) showed an increase of the
relative O/N-alkyl C intensity (+3 to +20%). At the same time a decrease in other
chemical shift regions, particularly in the alkyl C region (-2 to -11%), was apparent.
Unlike other samples, the Tharandt (5, 24, 97) samples showed no increase of O/N-
alkyl C intensity and no significant change of the relative alkyl C intensity after
demineralisation.

6. INTIMATE ASSOCIATION BETWEEN IRON OXIDES AND O/N-ALKYL C 58
Figure 15: Solid state 13C NMR spectra of A horizon clay fractions before and after demineralisation with 10% hydrofluoric acid (HF).
Collelongo
Hesse
Sorø
Leinefelde 30-1
Leinefelde 30-2
Leinefelde 62
Leinefelde111
Tharandt 5
Tharandt 24
Leinefelde 153+16
Tharandt 97
HF treatedUntreated
300 200400 100 0 -100ppm
300 200400 100 0 -100ppm

6. INTIMATE ASSOCIATION BETWEEN IRON OXIDES AND O/N-ALKYL C 59
Table 14: Relative signal intensity distribution in the 13C CPMAS NMR spectra of A horizon clay fractions before and after demineralisation with 10% hydrofluoric acid (HF).
Site
A
lkyl
C
O
/N-A
lkyl
C
A
ryl C
Car
bony
l C
U
n-tre
ated
(1
)
HF
treat
ed
(2)
Δ
(2)-
(1)
U
n-tre
ated
(1)
HF
treat
ed
(2)
Δ
(2)-
(1)
U
n-tre
ated
(1
)
HF
treat
ed
(2)
Δ
(2)-
(1)
U
n-tre
ated
(1)
HF
treat
ed
(2)
Δ
(2)-
(1)
—
——
——
——
——
——
——
——
——
——
— %
—
——
——
——
——
——
——
——
——
——
—
Col
lelo
ngo
33
29
-4
42
46
4
12
12
0
13
14
1
Hes
se
40
29
-11
33
53
20
14
9 -5
13
9 -4
Sorø
36
34
-2
39
42
3
11
11
0
14
13
-1
Chr
onos
eque
nce
Lein
efel
de
Lein
efel
de 3
0-1
28
22
-6
43
53
10
13
11
-2
16
14
-2
Lein
efel
de 3
0-2
33
27
-6
41
50
9
14
12
-2
13
12
-1
Lein
efel
de 6
2 30
27
-3
43
52
9
14
11
-3
14
11
-3
Lein
efel
de 1
11
40
30
-10
34
50
16
13
9 -4
13
11
-2
Lein
efel
de 1
53+1
6 31
25
-6
43
52
9
14
11
-3
14
13
-1
Chr
onos
eque
nce
Thar
andt
Thar
andt
5
37
37
0
41
39
-2
10
11
1
11
12
1
Thar
andt
24
39
38
-1
36
35
-1
13
13
0
12
14
2
Thar
andt
97
30
31
1
46
43
-3
13
13
0
11
13
2

6. INTIMATE ASSOCIATION BETWEEN IRON OXIDES AND O/N-ALKYL C 60
To enable a comparison of the relative change of proportions of the different C species
with the change of the relative alkyl C intensity the quotients of O/N-alkyl C, aryl C and
carbonyl C before and after demineralisation were calculated (Eq. 4; Table 15). After
demineralisation, the O/N-alkyl C/alkyl C ratios of the samples from Collelongo, Hesse
and Leinefelde (30/1, 30/2, 62, 111, 153+16) increased leading to O/N-alkyl C quotients
between 1.3 and 2.2. In contrast, the O/N-alkyl C/alkyl C ratios of samples from Sorø
and Tharandt (5, 24, 97) and the aryl C/alkyl C and carbonyl C/alkyl C ratios of all
samples remained nearly unchanged after demineralisation as shown by quotients
of 1±0.2.
Table 15: Quotient of relative signal intensity ratios of A horizon clay fractions before and after demineralisation with 10% hydrofluoric acid (HF).
The low relative O/N-alkyl C intensity in the samples from Hesse and Leinefelde before
demineralisation may be due to a shortening of T1ρH of protons in the vicinity of
O/N-alkyl C. Part of the O/N-alkyl C may be invisible unless very short contact times
are applied. Therefore a variable contact time experiment was conducted with the
sample from Hesse before and after demineralisation. Fig. 16 shows plots of the contact
time versus the measured and modelled values of alkyl C and O/N-alkyl C intensities.
Site O/N-Al/Al a (HF treated) Ar/Al b (HF treated) Ca/Al c (HF treated)
O/N-Al/Al (untreated) Ar/Al (untreated) Ca/Al (untreated)
Collelongo 1.3 1.1 1.2
Hesse 2.2 0.9 0.9
Sorø 1.1 1.1 1.0
Chronosequence Leinefelde Leinefelde 30-1 1.6 1.1 1.1
Leinefelde 30-2 1.5 1.0 1.1
Leinefelde 62 1.3 0.9 0.9
Leinefelde 111 2.0 0.9 1.1
Leinefelde 153+16 1.5 1.0 1.1
Chronosequence Tharandt Tharandt 5 1.0 1.1 1.0
Tharandt 24 1.0 1.0 1.1
Tharandt 97 0.9 1.0 1.1
a O/N-Al/Al = O/N-alkyl C/Alkyl C ratio b Ar/Al = Aryl C/Alkyl C ratio c Ca/Al = Carbonyl C/Alkyl C ratio
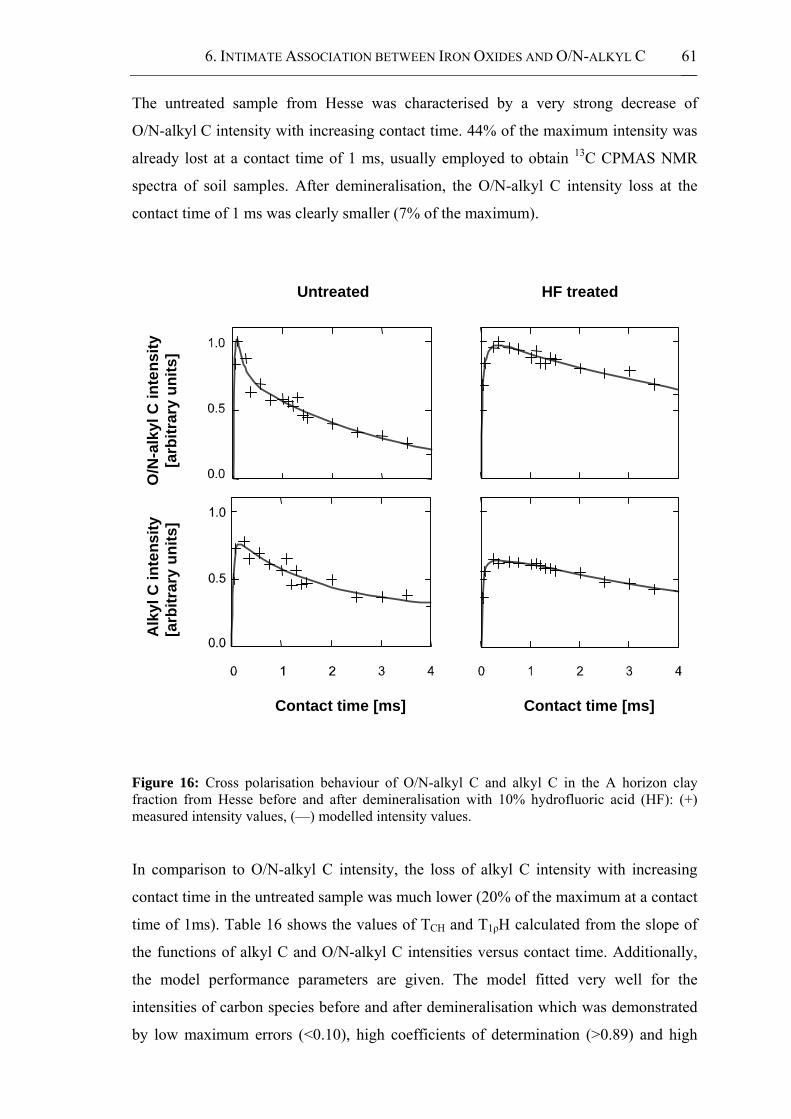
6. INTIMATE ASSOCIATION BETWEEN IRON OXIDES AND O/N-ALKYL C 61
The untreated sample from Hesse was characterised by a very strong decrease of
O/N-alkyl C intensity with increasing contact time. 44% of the maximum intensity was
already lost at a contact time of 1 ms, usually employed to obtain 13C CPMAS NMR
spectra of soil samples. After demineralisation, the O/N-alkyl C intensity loss at the
contact time of 1 ms was clearly smaller (7% of the maximum).
Figure 16: Cross polarisation behaviour of O/N-alkyl C and alkyl C in the A horizon clay fraction from Hesse before and after demineralisation with 10% hydrofluoric acid (HF): (+) measured intensity values, (—) modelled intensity values.
In comparison to O/N-alkyl C intensity, the loss of alkyl C intensity with increasing
contact time in the untreated sample was much lower (20% of the maximum at a contact
time of 1ms). Table 16 shows the values of TCH and T1ρH calculated from the slope of
the functions of alkyl C and O/N-alkyl C intensities versus contact time. Additionally,
the model performance parameters are given. The model fitted very well for the
intensities of carbon species before and after demineralisation which was demonstrated
by low maximum errors (<0.10), high coefficients of determination (>0.89) and high
O/N
-alk
yl C
inte
nsity
[a
rbitr
ary
units
]
Contact time [ms] Contact time [ms]
Alk
yl C
inte
nsity
[a
rbitr
ary
units
]
Untreated HF treated

6. INTIMATE ASSOCIATION BETWEEN IRON OXIDES AND O/N-ALKYL C 62
modelling efficiencies (>0.89) (Table 16). TCH was relatively short for all types of
nuclei before and after demineralisation (<0.44 ms) (Table 16). Before demineralisation,
the T1ρH values of the slowly and fast relaxing protons in the vicinity of O/N-alkyl C
were 3.21 ms and 0.13 ms, respectively. The considerable difference in relaxation
behaviour of protons indicated inefficient spin diffusion which occurs if the different
domains are physically separated. The difference between the T1ρH values of slowly and
fast relaxing protons in the vicinity of alkyl C was even more pronounced, although
T1ρH values were higher (18.38 ms and 1.35 ms) than those of protons in the vicinity of
O/N-alkyl C (Table 16). After demineralisation, comparable T1ρH values of around
8 ms were determined for O/N-alkyl C and alkyl C domains. This pointed to a more
efficient spin diffusion and to a higher physical homogeneity of the HF treated sample.
Table 16: Results of modelling of cross polarisation behaviour for O/N-alkyl carbon (72 ppm) and alkyl carbon (30 ppm) of the A horizon clay fraction from Hesse before and after demineralisation with 10% hydrofluoric acid (HF).
In the bulk of samples, demineralisation resulted in an increase of relative O/N-alkyl C
proportions, while the relative intensities of alkyl C decreased (Table 14). These results
are in accordance with findings of Knicker (2004), who showed a higher O/N-alkyl C
intensity (+11%) and a lower alkyl C (-6%) and carbonyl C (-4%) intensity after
demineralisation of a municipal solid waste sample. Integration of the different
chemical shift regions results in relative intensity values. Therefore, the change of
Signal Demineralisation Cross polarisation behaviour Model performance
Slow domain Fast domain
M0a TCH
b T1ρH c M0 TCH
T1ρH MEd CDe MEFf
ppm ms ms ms ms
72 Untreated 0.82 0.03 3.21 0.46 0.03 0.13 0.10 0.96 0.96
HF treated 0.58 0.01 10.04 0.45 0.08 8.97 0.06 0.94 0.94
30 Untreated 0.42 0.03 18.38 0.42 0.04 1.35 0.10 0.89 0.89
HF treated 0.63 0.04 7.28 0.09 0.44 7.28 0.02 0.99 0.98
a M0: Equilibrium 13C magnetisation (theoretically reachable maximum magnetisation) b TCH: time required for a transfer of magnetisation from 1H to 13C nuclei c T1ρH: Spin-lattice relaxation time in the rotating frame of protons d ME: Maximum error of model e CD: Coefficient of determination of model f MEF: Modelling efficiency

6. INTIMATE ASSOCIATION BETWEEN IRON OXIDES AND O/N-ALKYL C 63
signal intensities may have been caused by a preferential removal of alkyl C compounds
during demineralisation or by a selective suppression of O/N-alkyl C intensity in the
untreated samples. In previous demineralisation studies, samples with high OC
concentrations showed, however, no loss of alkyl C. In mature compost the relative
intensity of O/N-alkyl C declined (-7%) and the alkyl C intensity increased (+4%)
(Schmidt et al., 1997). Two samples from organic horizons of Spodosols displayed
decreases of 3 and 6% of O/N-alkyl C whereas the alkyl C remained constant (Dai and
Johnson, 1999). Samples originating from litter of a mixed deciduous and a beech forest
gave comparable spectra before and after demineralisation (Schmidt et al., 1997). In
addition, mass balances calculations showed that the preferential loss of acid soluble
amino acids can not explain the signal shift in 13C CPMAS NMR spectra of the samples
from Hesse and Leinefelde.
The calculated quotients of O/N-alkyl C, aryl C and carbonyl C (Table 15) supported
the assumption that the change in relative signal intensities was ascribed to a selective
O/N-alkyl C suppression in the untreated sample rather than to a preferential loss of
alkyl C. The quotients of relative intensities of aryl C and carbonyl C normalised to the
alkyl C intensity remained nearly constant (1±0.2) for the samples before and after HF
treatment (Table 15). Thus, the presence of paramagnetic Fe affected the intensities of
aryl C, carbonyl C and alkyl C signal to the same extent.
Interactions between SOM and Fe3+ were considered as most likely explanation for the
differences of relative intensities in 13C CPMAS NMR spectra before and after
demineralisation. The higher number of required scans and the lower signal to noise
ratios in the spectra of untreated samples can be attributed to both, the effects of Fe3+
and the low OC concentrations (Fig. 15). However, no displacement of the main signals
was found in the 13C CPMAS NMR spectra. This is contrary to Parfitt et al. (1999) who
observed displacements of NMR signals as result of interactions between allophane and
SOM in Podsols. The lower quality of the 13C CPMAS NMR spectra of the untreated
samples is most probably linked to a decrease of the detectability of carbon. Using
2% HF and forest soil samples, Keeler and Maciel (2003) increased the percent carbon
detected by 13C CPMAS NMR, from 48 to 82%, while the Fe concentration of the soil
was reduced from 10.5 to 2.5 g kg-1 soil. The effects of paramagnetics on 1H during
cross polarisation MAS experiments are usually known to be more intense than on 13C

6. INTIMATE ASSOCIATION BETWEEN IRON OXIDES AND O/N-ALKYL C 64
during direct polarisation MAS experiments because the high abundance of 1H spins
allows the redistribution of magnetisation by spin diffusion (Smernik and Oades, 1999).
However, the occurrence of slowly and fast relaxing domains of protons with clearly
different T1ρH values underline that the untreated sample from Hesse was characterised
by physically separated molecular domains (Table 16). The heterogeneity of the sample
clearly prevented efficient spin diffusion between protons in the vicinity of different C
species and allowed the selective suppression of NMR signals.
The results showed a selective effect of Fe on the O/N-alkyl C (Table 14, Fig.15). This
was indicated by a stronger shortening of T1ρH of O/N-alkyl C in comparison to that of
other carbon species (Table 16). The selective suppression of O/N-alkyl C confirmed
results of Pfeffer et al. (1984) who observed a preferential loss of proton polarisation
associated with carbohydrates when investigating model sludge mixtures amended with
FeCl3. A selective effect on the carbohydrate region of 13C CPMAS NMR spectra was
also shown for a Terric Humisol with a high concentration of paramagnetic Cu (Preston
et al., 1984). A series of spectra acquired at different contact times showed increases in
the relative contribution of the aromatic region and a large decrease in the carbohydrate
region with increasing contact times. Smernik and Oades (1999) added Fe3+ to HF
treated samples and found that differences of signal intensities are largest for both, the
O/N-alkyl C and the carbonyl C region. In contrast to their results, differences in the
intensities of carbonyl C were not found in the A horizon clay fractions used for this
study. The absence of a difference in the relative carbonyl C intensities before and after
demineralisation could partly be explained by the selective loss of amide and
carboxyl C from amino acids. But it may also be explained by a high contribution of
ester and amide groups to the carbonyl C of the studied soils. Upon esterification, a
dramatic reduction in Cu binding to carbonyl groups was evident in peat samples
(Schilling and Cooper, 2004b).
The selective association of Fe and O/N-alkyl C was in contrast to results
of Kaiser et al. (2003). From a mixture of organic compounds in DOM, goethite
preferentially adsorbed hydrophobic fractions, fulvic and humic acids rich in carboxyl
and aromatic C against hydrophilic fractions characterised by high abundances of
O/N-alkyl C. They suggest that the strong sorption of the hydrophobic fraction is a
result of the presence of lignin decomposition products. The different results can

6. INTIMATE ASSOCIATION BETWEEN IRON OXIDES AND O/N-ALKYL C 65
Fed/OC
0.0 0.1 0.2 0.3 0.4 0.5
O/N
-alk
yl C
quo
tient
0.5
1.0
1.5
2.0O/N-alkyl C quotient = 2.6 Fed/OC + 0.66
LeinefeldeTharandt Collelongo
HesseSorø
probably be explained by the low amounts of lignin products in the clay fractions of the
samples used for this study (Schöning et al., 2005b). The selective signal loss of O/N-
alkyl C did also not agree with Schmidt et al. (1997), Goncalves et al. (2003) and
Jancke et al. (2002) who did not find any selective signal loss in untreated soil samples.
However, Jancke et al. (2002) did not differentiate between alkyl and O/N-alkyl C and
they were therefore not able to detect possible O/N-alkyl C suppressions in their soils.
The results of Schmidt et al. (1997) and Goncalves et al. (2003) underline that the type
of Fe oxide may be an important determinant for the interaction between SOM and Fe
oxides and that the association between Fe oxides and O/N-alkyl C may be specific for
certain soils.
6.3. Control parameter of signal loss
In clay fractions of soils under temperate forest, Fe3+ is generally the main paramagnetic
compound. Thus, changes of relative intensities as result of demineralisation were
expected to be proportional to the Fe concentrations. However, no correlation between
Fed or Feo concentration in the untreated samples and the change of relative
O/N-alkyl C intensity which is affected the most by iron oxides was obtained (Fed:
rs=-0.12, p<0.6; Feo: rs=-0.18, p<0.8). With increasing OC concentrations an increasing
proportion of OC is probably not directly associated with Fe. Therefore it was
examined, whether a correlation between the Fed/OC ratio and the change of
O/N alkyl C quotient existed. The O/N-alkyl C quotient was increasing with increasing
values of Fed/OC ratio (rs=0.89; p<0.01) or Feo/OC ratio (rs=0.68; p<0.05) (Fig. 17).
Figure 17: Ratio of dithionite extractable Fe and OC concentration in relation to O/N-alkyl C quotient of A horizon clay fractions (Eq. 4)

6. INTIMATE ASSOCIATION BETWEEN IRON OXIDES AND O/N-ALKYL C 66
SSAoxides/OC [m2 kg g-2]
0.0 0.1 0.2 0.3 0.4 0.5
O/N
-alk
yl C
quo
tient
0.5
1.0
1.5
2.0
O/N-alkyl C quotient = 2.3 SSAoxides/OC + 1.0
LeinefeldeCollelongoHesse
Sorø
Fe oxides provide a high contribution to the SSA of mineral soil samples. In the
samples from the beech forest sites in Collelongo, Hesse, Sorø and Leinefelde SSAoxides
(Table 17) was positively correlated with the concentration of Fed (rs=0.93; p<0.01).
Also, a correlation between the SSAoxides normalised to the OC concentration and the
O/N-alkyl C quotient was evident (rs=0.92; p<0.01) (Fig. 18).
Figure 18: Ratio of specific surface area of oxides (SSAoxides) and OC concentration in relation to O/N-alkyl C quotient of A horizon clay fractions (Eq. 4)
The relationship between the Fed/OC ratio and the signal change indicated that the Fe
concentration is one important factor for the extent of signal loss (Fig. 17). For humic
acids amended with different amounts of Fe3+, Keeler and Maciel (2003) showed a
negative, roughly linear relationship between the percent carbon observed in direct
polarisation MAS experiments and the percent Fe. The importance of the concentration
of paramagnetic material was also shown in experiments, where Cu was amended. T1ρH
was negatively correlated with increasing Cu content for all four regions of the spectra,
but the effect was much larger and the correlation coefficient much higher for the
carbohydrate region (Preston et al., 1984). However, paramagnetic compounds can be
diluted by OC. This was indicated by the decrease of the extent of changes of the
relative intensities with decreasing Fed/OC ratios (Fig. 17). The effects of paramagnetic
Fe may, therefore, be masked in soils, especially with high OC contents,

6. INTIMATE ASSOCIATION BETWEEN IRON OXIDES AND O/N-ALKYL C 67
Table 17: The specific surface area (SSA) of A horizon clay fractions from beech forest sites after removal of SOM (SSAminerals) and after removal of SOM and dithionite extractable minerals (SSAsilicates)
and only observed in fine fractions with high concentrations of paramagnetics. Arshad
et al. (1988) recommended an OC:Fe ratio >1 to obtain spectra of soil samples with a
reasonable quality. However, in this study, 13C CPMAS NMR spectra of clay fractions
with OC:Fe ratios between 2.2 and 3.8 were considerable affected by Fe oxides
(Table 14, Fig. 15). These results were in agreement with those of Schilling and Cooper
(2004a), who could not obtain useful spectra of samples from untreated Ultisols with
OC:Fe ratios of 2.1 and 1.8. These results indicate that soil samples with OC:Fe
ratios >1 do not assure good quality 13C CPMAS NMR spectra, and that much higher
OC:Fe ratios may be necessary for some soil samples.
Fe oxides are characterised by a high surface area. Relationships between mineral
specific surface area and OC concentration were found in A horizons of soils (Mayer,
1994; Kahle et al., 2002). In two sandy Luvisols from Germany and Poland the amount
of refractory C was linearly related to the mineral surface area and the content of
oxalate and dithionite extractable iron (Kiem and Kögel-Knabner, 2002). Coating of
kaolinite, montmorillonite and illite with Fe oxides strongly increases the SSA (Zhuang
and Yu, 2002). Eusterhues et al. (2005) estimated for particle size fractions <6.3 μm of
Site SSA minerals
a SSA silicatesb SSA oxides
c
——————————— m2·g-1 ——————————
Collelongo 67.5 47.5 20.0
Hesse 35.8 18.1 17.7
Sorø 14.5 13.3 1.2
Chronosequence Leinefelde Leinefelde 30-1 n.d.d n.d. n.d.
Leinefelde 30-2 49.6 28.7 20.9
Leinefelde 62 28.8 19.8 9.0
Leinefelde 111 48.3 20.5 27.8
Leinefelde 153+16 31.4 19.4 12.0 a SSA minerals = Specific surface area of minerals (after H2O2 treatment) b SSA silicates = Specific surface area of silicates (after H2O2 and dithionithe extraction) c SSA oxides = Specific surface area of oxides (SSA oxides = SSA minerals - SSA silicates) d n.d. = not determined

6. INTIMATE ASSOCIATION BETWEEN IRON OXIDES AND O/N-ALKYL C 68
a Dystric Cambisol and a Haplic Podzol a SSA between 4 and 145 m2g-1 which
decreases by 70%, on average, after removing dithionite-extractable minerals. Our
results showed that the selective signal loss of O/N-alkyl C is dependent on the surface
area that is offered by Fe oxides. The surface area, in turn, was proportional to the
concentration of Fe oxides. The high SSA of Fe oxides seemed to promote the sorption
of O/N-alkyl C.

7. SMALL SCALE SPATIAL VARIABILITY OF OC STOCKS 69
7. Small scale spatial variability of organic carbon stocks in litter and
solum of a forested Luvisol at Leinefelde
Samples to study spatial variability were obtained from the 111 years old beech forest
stand in Leinefelde. At Leinefelde the underlying limestone was covered by loess
deposited 10,000 years ago during the last glacial period. Some of the soil
characteristics, studied at a representative soil pit, are presented in Table 18.
Table 18: General properties of a representative soil pit at the 111 yrs old beech stand in Leinefelde
Horizon (FAO)a Soil depth Bulk
density
pH (0.01 M CaCl2)
Particle size distribution CECe Base
saturation
Sand Silt Clay
m g cm-3 % cmolc kg-1 %
L +0.04-0.00 0.05 n.d.b n.d. n.d. n.d. n.d. n.d.
Ah 0.00-0.07 0.86 4.5 2 62 36 11 87
EBw 0.07-0.26 1.12 3.9 6 66 28 8 22
Bw 0.26-0.35 1.25 4.1 8 54 38 10 42
Btw 0.35-0.40 1.08 5.0 4 26 70 31 99 a Guidelines for profile description, FAO (1990) b n.d. = not determined
7.1. Magnitude of organic carbon stocks
At all 54 sampling points, soils were classified as Luvisols covered by mull-type forest
floor. The average thickness of the litter ranged between 0.01 and 0.04 m, whereas the
solum thickness was between 0.24 and 0.96 m. The thickness of the loess layer ranged
between 0.20 and 0.90 m, whereas the clayey B horizon which derived from the
weathering of the limestone had a thickness of <0.1 m. The summary statistics of OC
stocks are listed in Table 19. The statistical distributions of OC stocks were positively
skewed (Table 19). However, normality plots and medians showed that OC stocks in all
layers matched the normal distribution. On average, 0.4 kg m-2 OC was stored in the
litter. The mean OC stock in the solum declined from 3.0 kg m-2 in the 0-0.12 m layer to
0.7 kg m-2 in the 0.72-0.84 m layer. The decrease of mean OC stocks with depth was
accompanied by a decrease of standard deviation. The CV of OC stocks varied between

7. SMALL SCALE SPATIAL VARIABILITY OF OC STOCKS 70
Table 19: Summary statistics of soil OC stocks
Sa
mpl
e So
il de
pth
N
Mea
n M
edia
n M
in
Max
St
anda
rd
devi
atio
n Sk
ewne
ss
Kur
tosi
s C
Va
m
____
____
____
____
____
____
__ k
g m
-2 _
____
____
____
____
____
____
%
Litte
r (+
0.04
/0.0
1)-0
.00
51
0.4
0.4
0.1
0.8
0.2
0.9
0.6
38
Solu
m
0.00
-0.1
2 54
3.
0 2.
7 1.
8 5.
9 0.
9 0.
9 0.
8 30
0.
12-0
.24
54
2.0
2.0
0.8
4.7
0.7
1.2
4.0
34
0.
24-0
.36
50
1.4
1.3
0.4
2.8
0.6
0.6
-0.2
43
0.
36-0
.48
29
1.1
1.0
0.4
2.0
0.4
1.0
0.3
39
0.
48-0
.60
25
1.0
0.8
0.4
2.1
0.4
1.2
1.3
41
0.
60-0
.72
14
0.9
0.7
0.6
2.2
0.4
1.9
3.8
49
0.
72-0
.84
7 0.
7 0.
7 0.
5 1.
3 0.
2 1.
9 4.
4 34
0.
84-0
.96
1 0.
6 0.
6 -
- -
- -
-
Solu
m +
litte
r (+
0.04
/0.0
1) -
(0.2
4/0.
96)
51
7.9
7.7
4.2
14.5
2.
1 0.
6 0.
8 27
Solu
m >
0.12
m
0.12
-(0.2
4/0.
96)
54
4.5
4.1
1.5
9.8
1.8
0.8
0.5
40
a CV
= C
oeffi
cien
t of v
aria
tion

7. SMALL SCALE SPATIAL VARIABILITY OF OC STOCKS 71
27 and 49%, but we observed no relation between CV and soil depth. Frequency
distributions of OC stocks in litter, in solum 0-0.12 m and in the solum >0.12 m are
presented in Fig. 19. This figure illustrates that mean values as well as the range of OC
stocks were increasing in the order litter, solum 0-0.12 m and solum >0.12 m. On
average, the solum >0.12 m contained 4.5 kg OC m-2.
Figure 19: Frequency distribution of OC stocks in litter, solum 0-0.12 m and solum >0.12 m
The mean soil OC stock in the solum of the Luvisol at the site in Leinefelde was higher
(Table 19) than the mean C stock of Luvisols (n=604) sampled all over the world
(Batjes, 1996), which was 3.1 kg m-2 for the depth interval of 0-0.3 m and 4.3 kg m-2 for
the depth interval of 0-0.5 m. Similar to other forest soils, e.g. Hapludults and
Haplorthods under mixed deciduous and coniferous forest (Conant et al., 2003), the OC
stock per depth interval decreased in the solum with increasing depth (Table 19).
However, if one takes the thickness of horizons into account, a major proportion of the
total OC was found in the solum >0.12m, i.e. in the subsoil (Table 19; Fig. 19). This is
in line with Batjes (1996) who showed that only 48% of the total OC in the upper meter
of Luvisols is held in the first 0.3 m. Although vertical distribution is strongly affected
by the parent material (Batjes, 1996; Davis et al., 2004), soils at Leinefelde contained
significantly more OC in the subsoil than loess soils in Rhode Island (Davis et al.,
2004), where approximately 70% of soil OC was found in O and A horizons. This might
be caused by the different thickness of A horizons, which was 0.18 m at the Rhode
OC stock [kg m-2]
0-1
1-2
2-3
3-4
4-5
5-6
6-7
7-8
8-9
9-10
Freq
uenc
y
0
10
20
50
60Litter Solum 0-0.12 m Solum >0.12 m
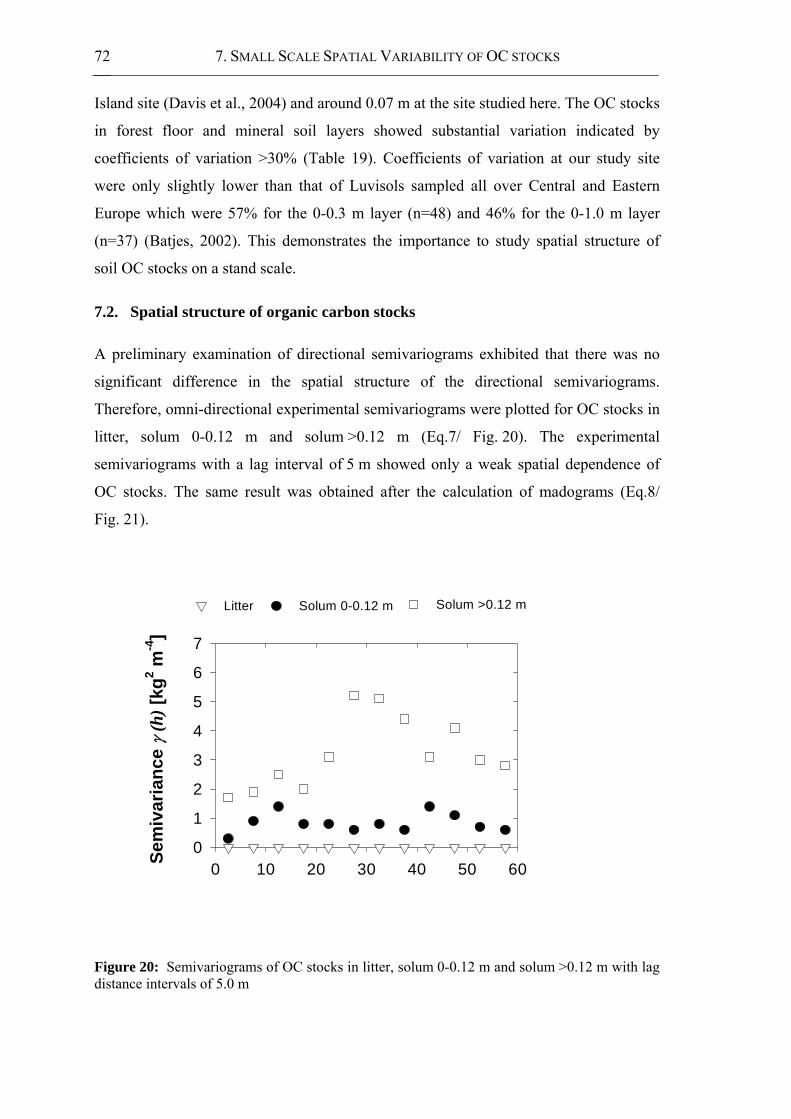
7. SMALL SCALE SPATIAL VARIABILITY OF OC STOCKS 72
Island site (Davis et al., 2004) and around 0.07 m at the site studied here. The OC stocks
in forest floor and mineral soil layers showed substantial variation indicated by
coefficients of variation >30% (Table 19). Coefficients of variation at our study site
were only slightly lower than that of Luvisols sampled all over Central and Eastern
Europe which were 57% for the 0-0.3 m layer (n=48) and 46% for the 0-1.0 m layer
(n=37) (Batjes, 2002). This demonstrates the importance to study spatial structure of
soil OC stocks on a stand scale.
7.2. Spatial structure of organic carbon stocks
A preliminary examination of directional semivariograms exhibited that there was no
significant difference in the spatial structure of the directional semivariograms.
Therefore, omni-directional experimental semivariograms were plotted for OC stocks in
litter, solum 0-0.12 m and solum >0.12 m (Eq.7/ Fig. 20). The experimental
semivariograms with a lag interval of 5 m showed only a weak spatial dependence of
OC stocks. The same result was obtained after the calculation of madograms (Eq.8/
Fig. 21).
Figure 20: Semivariograms of OC stocks in litter, solum 0-0.12 m and solum >0.12 m with lag distance intervals of 5.0 m
0 10 20 30 40 50 60Sem
ivar
ianc
e γ
(h) [
kg2 m
-4]
0
1
2
3
4
5
6
7
Solum >0.12 m Solum 0-0.12 mLitter

7. SMALL SCALE SPATIAL VARIABILITY OF OC STOCKS 73
Lag distance h [m]
0 10 20 30 40 50 60Sem
ivar
ianc
e γΜ
(h) [
kg m
-2]
0
1
2
Solum >0.12 m Solum 0-0.12 mLitter
Figure 21: Madograms of OC stocks in litter, solum 0-0.12 m and solum >0.12 m with lag distance intervals of 5.0 m.
Experimental semivariograms (Eq.7) for OC stocks based on the semivariance of the
fixed lag distances of 0.2, 0.6, 1.8, 5.4 and 16.2 m are presented in Fig. 22.
Semivariograms for the litter revealed a pure nugget effect. Semivariograms for the
Figure 22: Semivariograms of OC stocks in litter, solum 0-0.12 m and solum >0.12 m with explicit lag distances of 0.2, 0.6, 1.8, 5.4 and 16.2 m.
Lag distance h [m]
0 4 8 12 16Sem
ivar
ianc
e γ
(h) [
kg2 m
-4]
0
1
2
3
Solum >0.12 m Solum 0-0.12 mLitter

7. SMALL SCALE SPATIAL VARIABILITY OF OC STOCKS 74
solum 0-0.12 m and solum >0.12 m, in contrast, showed a considerable spatial
dependence when smaller lag distances were chosen. Both semivariograms were
characterised by a range of less than 5.4 m and a nugget variance that accounts for
around 30% of the sill in the solum 0-0.12 m and for over 50% of the sill in the
solum>0.12 m. Semivariograms were also calculated for the 0.12-0.24 m and the 0.24-
0.36 m layer of the solum, but both revealed a pure nugget effect.
General relative semivariograms (Eq. 10) were used to compare the spatial pattern of
bulk density, OC concentration and OC stock in the solum 0-0.12 m (Fig. 23a). OC
concentration and OC stock showed a very similar spatial pattern in the solum 0-0.12 m,
whereas bulk density exhibited a pure nugget effect. A crossvariogram (Eq. 9)
confirmed that in the solum 0-0.12 m OC concentration and OC stock were spatially
correlated (Fig. 23b).
a)
b)
Figure 23: (a) General relative variograms for OC concentration, OC stock and bulk density in the solum 0-0.12 m; (b) Crossvariogram between OC stock and OC concentration in the solum 0-0.12 m.
0 4 8 12 16
Sem
ivar
ianc
e γ G
R (h
) [-]
0.0
0.1
0.2
0.3
Bulk density OC concentrationOC stock
Lag distance h [m]
0 4 8 12 16
Cro
ssva
rianc
e Γ
(h) [
g m
-2]
0
2
4
6
8
10
12

7. SMALL SCALE SPATIAL VARIABILITY OF OC STOCKS 75
Lag distance h [m]
0 4 8 12 16
Cro
ssva
rianc
e Γ
(h) [
kg m
-1]
0.0
0.1
0.2
0.3
0.4
General relative variograms (Eq. 10) calculated for the solum >0.12 m are presented in
Fig. 24a. Here, OC concentration was calculated as an average OC concentration of the
different depth increments. The thickness of the solum >0.12 m was also included in the
plot. Contrary to the solum 0-0.12 m, OC stock and OC concentration appear to have a
different spatial structure in the solum >0.12 m, whereas the spatial structure of soil
thickness and OC stock was similar. A crossvariogram (Eq. 9) underlined a positive
spatial relation between OC stock in the solum >0.12 m and the solum thickness
(Fig. 24b).
a)
b)
Figure 24: (a) General relative variograms for OC concentration, OC stock, bulk density and solum thickness in the solum >0.12 m; (b) Crossvariogram between OC stock and thickness of the solum >0.12 m.
0 4 8 12 16
Sem
ivar
ianc
e γ G
R (h
) [-]
0.0
0.1
0.2
0.3
Bulk density OC concentrationOC stock Thickness solum >0.12 m
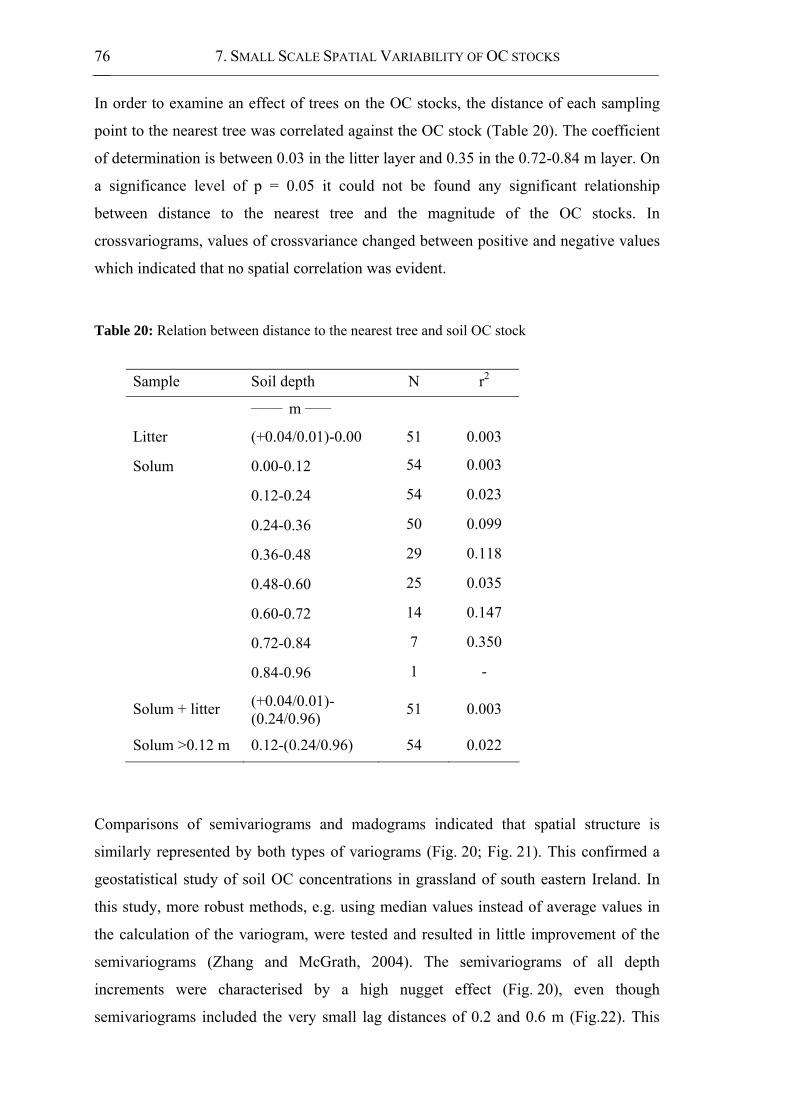
7. SMALL SCALE SPATIAL VARIABILITY OF OC STOCKS 76
In order to examine an effect of trees on the OC stocks, the distance of each sampling
point to the nearest tree was correlated against the OC stock (Table 20). The coefficient
of determination is between 0.03 in the litter layer and 0.35 in the 0.72-0.84 m layer. On
a significance level of p = 0.05 it could not be found any significant relationship
between distance to the nearest tree and the magnitude of the OC stocks. In
crossvariograms, values of crossvariance changed between positive and negative values
which indicated that no spatial correlation was evident.
Table 20: Relation between distance to the nearest tree and soil OC stock
Comparisons of semivariograms and madograms indicated that spatial structure is
similarly represented by both types of variograms (Fig. 20; Fig. 21). This confirmed a
geostatistical study of soil OC concentrations in grassland of south eastern Ireland. In
this study, more robust methods, e.g. using median values instead of average values in
the calculation of the variogram, were tested and resulted in little improvement of the
semivariograms (Zhang and McGrath, 2004). The semivariograms of all depth
increments were characterised by a high nugget effect (Fig. 20), even though
semivariograms included the very small lag distances of 0.2 and 0.6 m (Fig.22). This
Sample Soil depth N r2
______ m _____
Litter (+0.04/0.01)-0.00 51 0.003
Solum 0.00-0.12 54 0.003
0.12-0.24 54 0.023
0.24-0.36 50 0.099
0.36-0.48 29 0.118
0.48-0.60 25 0.035
0.60-0.72 14 0.147
0.72-0.84 7 0.350
0.84-0.96 1 -
Solum + litter (+0.04/0.01)- (0.24/0.96) 51 0.003
Solum >0.12 m 0.12-(0.24/0.96) 54 0.022

7. SMALL SCALE SPATIAL VARIABILITY OF OC STOCKS 77
either suggests undetected spatially dependent small scale variance or measurement
errors. The small scale variability of OC stocks could not be further resolved in our
study, since the determination of bulk density with 0.37·10-3 m3 cores required a
sampling area of 6.4 ·10-3 m. This may cause undetected small scale variability. High
nugget variances were also obtained in a study with grassland soils, where 50% of the
sill is nugget variance in consideration of lag distances of 0.3 m (Hewitt et al., 1998). A
high small scale spatial variability OC stock is specific for soils covered by natural
vegetation. Paz-Gonzales et al. (2000) compared variograms for OC concentrations in
Umbrisols under cultivation and under natural vegetation (shrubs, pine trees and grass)
and observed a higher micro-heterogeneity at the site with natural vegetation. Liski
(1995), in turn, could show that OC stocks of podzols generally varied more under pine
tree canopies than in an adjacent within stand opening area. Our results showed high
values of nugget variance in the depth increments 0.12-0.24 m as well as 0.24-0.36 m.
In these depth increments the spatial pattern of OC stocks is controlled by the
distribution of root litter and the sorption of dissolved organic carbon (DOC). It was
found that OC concentrations along preferential flow paths were 12-69% higher than in
the soil matrix (Bundt et al., 2001). Usually, DOC sorption in carbonate-free subsoils is
related to oxalate-extractable aluminium and dithionite-extractable iron (Kaiser et al.,
1996). Therefore high small scale variability of pore distribution and distribution of
aluminium and iron hydroxides are probably responsible for the high nugget variance in
the depth increments below 0.12 m. Together with other studies our results indicated a
short distance of spatial continuity of OC stocks in forest stands (Fig. 22). Liski (1995)
showed, that the OC stock of soil layers and the thickness of the soil horizons in a
spruce forest stand were spatially dependent within distances varying from about 1 m to
8 m. Correspondingly, with a minimum sampling distance of 5 m Järvinen et al. (1993)
and Riha et al. (1986) could not identify any spatial autocorrelation of organic matter
content for forest floor and mineral soil.
The semivariograms of OC stocks in the solum 0-0.12 m were similar to variograms of
OC concentrations (Fig. 23a,b). These results are in accordance with
Hewitt et al. (1998), who found a similar spatial structure for OC stocks and
concentrations to a depth of 0.075 m in Pallic Orthic Brown soils under grassland. The
semivariance of OC stocks is slightly lower than the nugget in semivariograms of OC
concentrations. This may be explained by the phenomenon that soil samples with higher
7. SMALL SCALE SPATIAL VARIABILITY OF OC STOCKS 78
OC concentrations are often characterised by lower bulk densities, which reduces
variability of OC stocks compared to variability of OC concentrations (Huntington et
al., 1989). Contrary to OC concentration, bulk density showed a complete lack of spatial
variation indicated by an almost pure nugget effect in semivariograms (Fig. 23a). This
can be attributed to small scale variations of bulk density resulting from the combined
effect of parent-material and biological activity. Furthermore, the magnitude of relative
variability of bulk density is significantly smaller than the magnitude of relative
variability of OC concentrations. Applying descriptive statistics, Davis et al. (2004)
could show lower coefficients of variation for bulk densities compared to those of the
OC concentrations. Our results highlighted that the OC concentration was the main
determinant for the variability of OC stocks in the solum 0-0.12 m.
Often terrain attributes such as slope and elevation were found to be main factors
controlling variability in local C stores (Arrouays et al., 1998; Chaplot et al., 2001).
However, although vegetation and micro-topography are quite homogeneous within our
sampling area, a high spatial variability of OC carbon stocks was detected (Table 19,
Fig. 22). General relative variograms and crossvariograms clearly indicate that OC
stocks in the solum >0.12 m and soil thickness were spatially correlated (Fig. 24a,b).
Homann et al. (2001) already emphasised the impact of O horizon thickness on the
coefficient of variation of OC stocks. They showed that masses of OC and N in the O
horizon of a Dystrochrept and Hapludults under Douglas fir and pine were twice as
variable as in the mineral soil, because the O horizon depth varied, whereas the mineral
soil values were for specified depths. The subsurface stratigraphy, in particular the
surface characteristics of the underlying limestone and the thickness of the loess layer
are probably the decisive factors for solum thickness and total OC stock at the study
area in Leinefelde. At an agricultural site, it was shown that present terrain attributes
often imperfectly explain variability of soil thickness: A multiple correlation indicated
that micro-topography parameters accounted for only 9% of the variability of B horizon
thickness, whereas a significant correlation to the depth of an intertill sand-gravel layer
was evident (Kachanoski et al., 1985). In a study on the total C stocks in soils of the
world, different relations between soil thickness and C stock were found for different
parent materials (Batjes, 1996). This may explain, why Liebens and van Molle (2003)
could not find any systematic relationship between OC stocks and pedon thickness
(correlation coefficient was -0.1) for the region of Flanders/ Belgium. We suppose that

7. SMALL SCALE SPATIAL VARIABILITY OF OC STOCKS 79
relations between soil thickness and OC stock are characteristic for variability studies
on the forest stand level, where soils developed from the same parent material.
An effect of trees on the magnitude of OC stocks in litter and solum was not detectable
in our study (Table 20). This result is in contrast to studies carried out at pine stands. In
podzols, the F/H layer was thicker and contained more OC within 1-3 m radius from
trees (Liski, 1995). In Typic Kandiudults, C and N levels were always elevated in a
region within 0.8 m of the tree stems, whereas variability of the estimates of C and N
consistently decreased with increased proximity to the stem. This was explained by the
soil OC derived from stemflow and bark sloughing (Ruark and Zarnoch, 1993). On the
other hand, Riha et al. (1986) could not find any significant differences in organic
matter concentration in the forest floor and surface layer of a Typic Fragiochrept and
Typic Dystrochrept as a function of distance from maple, spruce and pine trees. Possible
effects of trees at our site may be masked. In the study of Ruark and Zarnoch (1993) it
was emphasised that measurements were conducted at a first-rotation stand growing on
an abandoned farm site and that the surface plow layer could be considered to have been
relatively homogeneous prior to forestation. This enabled the detection of spatial
differences which were solely attributed to the influence of tree vegetation. Since soils
contain a significant proportion of old OC, the spatial distribution of OC stocks at our
site is probably not only influenced by the current but also by former vegetation
patterns. Beside trees, site variables like soil respiration and soil texture may also affect
spatial patterns of OC stocks. With a 1x1 m sampling grid, Gömöryová (2004) could
not find any relationship between the position of beech trees and soil respiration in a
forested Cambisol.
7.3. Minimum detectable difference (MDD) of organic carbon stocks
To estimate the MDD of OC stocks at our study area, we assumed that OC stocks at the
sampling points, which are separated by a distance of 16.2 m, would have been sampled
in two points in time (Table 21). According to the semivariograms in Fig. 4 this would
assure the statistical independence of sampling points. MDD (Eq.5) for the distance of
16.2 m ranged between 0.15 kg m-2 in the litter layer and 4.48 kg m-2 in the complete
soil profile (solum + litter). This corresponded to a MDDrel. between 41 and 95%
(Eq. 6). Layers with large OC stocks, such as the solum 0-0.12 m, tended to have larger
variances and therefore higher absolute MDD values. If one would disregard the

7. SMALL SCALE SPATIAL VARIABILITY OF OC STOCKS 80
statistical requirement of statistical independence and would resample points separated
by a distance of 0.2 m (paired approach), this would result in smaller MDD for the
solum layers. They would range between 0.15 kg m-2 in the litter and 1.85 kg m-2 in the
complete soil profile. The maximum MDDrel. would decrease from 95% at a sampling
distance of 16.2 m to 49% at a sampling distance of 0.2 m.
Table 21: Absolute and relative minimum detectable difference of soil OC stocks taking into account sampling points separated by 16.2 and 0.2 m.
The MDDrel. declines as a function of sample size. Figure 25a plots the MDDrel. in
relation to sample size taking into account the standard deviation of the sampling points
separated by a distance of 16.2 m. The diagram shows that one would need more than
160 samples from the litter and even more than 300 samples from the solum to detect an
OC stock difference of 10%. Fig. 25b, in contrast, shows the MDDrel. in relation to
sample size taking into account the standard deviation of points separated by a distance
0.2 m. Here, smaller sample sizes are sufficient to detect a certain OC stock change. An
OC stock difference of 10% could be detected with 40 samples in the solum 0-0.12 m
and with 140 samples from the solum >0.12 m and 160 samples from the litter.
Sample Soil depth MDD MDDrel.
16.2 m 0.2 m 16.2 m 0.2 m
_______ m _____ ____ kg m-2 _____ _______ % _______
Litter (+0.04/0.01)-0.00 0.2 0.2 41 39
Solum 0.00-0.12 1.9 0.6 67 18
0.12-0.24 1.7 0.8 95 39
0.24-0.36 0.8 0.7 75 49
Solum + litter (+0.04/0.01)- (0.24/0.96) 4.5 1.9 59 21
Solum >0.12 m 0.12-0.24/0.96 2.6 1.6 58 32

7. SMALL SCALE SPATIAL VARIABILITY OF OC STOCKS 81
Figure 25: Relative minimum detectable difference of organic carbon stocks in relation to sample size (a) under consideration of statistically independent sampling points (distance between sampling points 16.2 m), and (b) under consideration of statistically dependent sampling points (distance between sampling points 0.2 m)
0 50 100 150 200 250 300
MD
Dre
l. [%
]
0
10
20
30
40
50
60Solum 0-0.12 m Litter Solum >0.12 m a)
Number of samples
0 50 100 150 200 250 300
MD
Dre
l. [%
]
0
10
20
30
40
50
60Solum 0-0.12 m Litter Solum >0.12 m b)

7. SMALL SCALE SPATIAL VARIABILITY OF OC STOCKS 82
7.4. Implications for future sampling and monitoring
Information gained on the range of OC stocks can be used in the kriging interpolation,
when samples are taken closer than the range (Liski, 1995). To construct a meaningful
map of OC stocks in the solum at our study area, samples would have to be taken in a
sampling grid of less than 5.4 x 5.4 m (Fig. 22). This would result in more than 343
sampling points in our study area. Determination of bulk density requires a destructive
sampling and cores for a carbon stock change assessment have to be taken at two
different locations. From the point of view of soil statistical independence, samples
should be taken further from each other than the range of spatial dependence (Liski,
1995). Van Groenigen (2000) suggests to place sampling points at distances greater than
the twofold range, in order to assure the resulting sampling scheme is still random.
Relating these recommendations to our sampling area, future samples from the solum
have to be taken in a distance of more than 10.8 m apart from each other to fulfil the
criteria of statistical independence. For statistical independent sampling points, we
calculated a minimum detectable difference of 4.5 kg m-2 for OC stocks in the three
uppermost solum layers (0.36 m) (Table 21). This is much higher, than the MDD values
of OC stocks in the surface 0.4 m of Alfisols and Ultisols beneath switchgrass, which
were between 0.53-1.27 kg m-2 for a similar sample size (n = 8) (Garten and
Wullschleger, 1999). Some studies, however, indicate higher MDD for OC stocks in
soils beneath forest. Changes of OC stocks smaller than 0.49 and 3.14 kg m-2 at second-
growth and old-growth sites, respectively, could not be detected in the surface 0.3 m
even with collection and analysis of samples from 100 microplots (Conant et al., 2003).
Conant et al. (2003) suggested a sampling scheme that enables future resampling of the
same forest microplots (2 x 5 m) to decrease the MDD. Assuming soil OC changes at
0.05 kg C m-2 yr-1, changes at two forest sites could be detected as much as eight years
earlier if the same micro-plot was resampled (Conant et al., 2003). This was also
demonstrated for micro-sites with calcareous Chernozems, where only paired temporal
comparisons in 1 m distance showed an effective recovery of previously added coal C
(Ellert et al., 2002). Ellert et al. (2002) emphasised, however, that these results assume
that soil OC increases uniformly within a microplot and that soil OC increases are
directly related to initial soil OC content. At the site in Leinefelde, future sampling in
0.2 m distance to the previous sampled points would decrease the OC stock change in
the complete solum required for the detection of a statistical verified difference by more
than 50%.

8. CONCLUSIONS 83
8. Conclusions
The present study helped to better understand the composition and spatial variability of
SOM in mineral soils under temperate forest. Particle size fractionation allowed to
separate OC pools with distinct chemical composition and radiocarbon age. The OC in
the 200-2000 μm fractions consisted of labile material (pmC >100) throughout the
profiles, whereas <2 μm fractions revealed radiocarbon ages of up to 4745 years before
present. These results showed that the 200-2000 μm fractions were dominated by fresh
litter. In contrast, stabilisation mechanisms played a major role in the particle size
fractions <200 μm, particularly in the subsoils.
In the A horizons, SOM in coarse fractions showed a plant-like chemical composition
(high lignin contents, high C/N ratios), whereas the SOM in fine fractions (clay) is
probably dominated by compounds of microbial origin (depleted in lignin and aryl C,
low C/N ratios). 13C CPMAS NMR analyses of subsoil samples from Cambisols and
Luvisols suggest that the same applies to the subsoil, but this has yet to be confirmed by
wet chemical analyses.
The major components of labile and stable OC pools in topsoils and in subsoils of
Cambisols and Luvisols were always O/N-alkyl C and alkyl C compounds. In contrast,
the overall contribution of aryl C and carbonyl C to the stabilized OC was relatively
small. Compared to Luvisols, Cambisols contained more alkyl C in topsoil and subsoil
horizons which indicates an accumulation of alkyl C in acid forest soils.
The present study highlighted that chemically labile components such as carbohydrates
and proteinaceous (O/N-alkyl C) compounds can persist in the mineral soils for long
periods of time. The detailed chemical composition of O/N alkyl C and alkyl C in old
fractions, particularly the relevance of different O/N alkyl C and alkyl C stabilisation
mechanisms, remains to be studied to elucidate the long term turnover of OC.
As shown by CuO oxidation as well as 13C CPMAS NMR spectroscopy, even
recalcitrant structures, such as lignin, can be degraded in the short term. Although lignin
may have an important role in the control of biodegradation rates at early stages of litter
decay, it is not undergoing stabilisation by association with the clay minerals.
8. CONCLUSIONS 84
In the A horizons, relations were found between the radiocarbon age and functional
groups in particle size fractions. These relations were site specific, probably due to the
different mineral composition of the parent material and the resultant possibilities of
physical and chemical preservation. This suggests that in the short term turnover of
SOM is significantly controlled by the chemical composition of SOM. However, a
relation between chemical composition and radiocarbon age in particles size fractions
throughout soil profiles was not found. Thus, it was demonstrated that the chemical
structure of SOM in the particle size fractions cannot explain the increase of
radiocarbon age with increasing soil depth. This highlights the importance of
mechanisms of protection offered by the soil matrix and soil minerals for the long term
storage of SOM.
The ability of iron oxides to form intimate associations with O/N-alkyl C in clay
fractions from Leptosols and Luvisols was demonstrated using 13C CPMAS NMR
spectroscopy. Such association most probably provides a specific mechanism of
protection of O/N-alkyl C against biological attack. The association between
O/N-alkyl C and iron oxides impacts the applicability of 13C CPMAS NMR
spectroscopy to study the SOM composition in clay fractions without previous removal
of iron oxides. Due to the association with paramagnetic iron, part of the O/N-alkyl C in
untreated clay fractions might be invisible in standard 13C CPMAS NMR spectra
acquired with a contact time of 1 ms. In contrast to available literature, clay fractions
with OC:Fe ratios between 2 and 4 were affected by associations between Fe oxides and
O/N-alkyl C. They had to be treated with HF to circumvent a selective suppression of
the O/N-alkyl C signal.
The vertical distribution of OC stocks in Cambisols and Luvisols pointed towards the
importance of subsoils as carbon reservoirs in temperate forest ecosystems. Though the
concentration of OC in soils decreased with depth, the magnitude of OC stocks in
subsoils was significantly higher than in litter and topsoil. A high proportion of OC is
stored in subsoils for many years. OC stocks in the subsoils were mainly controlled by
the parent material, soil texture, and horizon thickness, but were little affected by the
present vegetation. To understand carbon storage not only at the very short time scale,

8. CONCLUSIONS 85
but also at the medium and long time scale, magnitude and variability of OC stocks in
subsoils need to be considered in carbon balances.
Semivariograms indicated that the OC stock in a Luvisol may be extremely variable at
distances shorter than 5 m even if it is homogeneously covered by beech forest. This
suggests that studies on the spatial variability of OC stocks at the forest stand level
should include sampling intervals of less than 5 m to avoid a pure nugget effect in
variograms. No direct relationship was observed between the OC stock of individual
samples and the proximity to individual beech trees. In contrast, soil thickness affected
the magnitude of OC stocks and increased its variability. Our results suggest that
information about the soil thickness is helpful when estimating spatial OC stocks in
soils developed from the same parent material.
Considering statistical independence of sampling points, the minimum detectable
difference ranged between 0.2 kg m-2 in the litter layer and 4.5 kg m-2 in the complete
soil profile. In order to detect a change of 10% in OC stocks of the solum, more than
300 samples would be required. If one would disregard the statistical independence, the
minimum detectable difference and number of samples necessary to detect a carbon
change in the solum could be halved by taking samples in a distance of 0.2 m to the
previously sampled points.
It can be concluded that considering small scale spatial variability and subsoil OC
stocks is essential for monitoring soil OC stocks. Long term stabilisation appeared to be
dominated by active stabilisation mechanisms rather than by chemical recalcitrance.
The study of the quantitative relevance of different active stabilisation mechanisms in
space and time is a key area of future research.

9. REFERENCES 86
9. References
Abelmann, K., Totsche, K.U., Knicker, H., Kögel-Knabner, I., 2004. CP dynamics of
heterogeneous organic material: Characterization of molecular domains in coals.
Solid State Nuclear Magnetic Resonance 25, 252-266.
Amador, J.A., Wang, Y., Savin, M.C., Gorres, J.H., 2000. Fine-scale spatial variability
of physical and biological soil properties in Kingston, Rhode Island. Geoderma
98, 83-94.
Amelung, W., Zech, W., 1999. Minimisation of organic matter disruption during
particle-size fractionation of grassland epipedons. Geoderma 92, 73-85.
Amelung, W., Zech, W., Zhang, X., Follett, R.F., Tiessen, H., Knox, E., Flach, K.W.,
1998. Carbon, nitrogen, and sulfur pools in particle-size fractions as influenced
by climate. Soil Science Society of America Journal 62, 172-181.
Anderson, D.W., Paul, E.A., 1984. Organo-mineral complexes and their study by
radiocarbon dating. Soil Science Society of America Journal 48, 298-301.
Anthoni, P.M., Knohl, A., Rebmann, C., Freibauer, A., Mund, M., Ziegler, W., Kolle,
O., Schulze, E.-D., 2004. Forest and agricultural land-use-dependent CO2
exchange in Thuringia, Germany. Global Change Biology 10, 2005-2019.
Arrouays, D., Daroussin, J., Kicin, J.L., Hassika, P., 1998. Improving topsoil carbon
storage prediction using a digital elevation model in temperate forest soils of
France. Soil Science 163, 103-108.
Arshad, M.A., Ripmeester, J.A., Schnitzer, M., 1988. Attempts to improve solid state
13C NMR spectra of whole mineral soils. Canadian Journal of Soil Science 68,
593-602.
9. REFERENCES 87
Baldock, J.A., Oades, J.M., Nelson, P.N., Skene, T.M., Golchin, A., Clarke, P., 1997.
Assessing the extent of decomposition of natural organic materials using solid-
state 13C NMR spectroscopy. Australian Journal of Soil Research 35, 1061-
1083.
Baldock, J.A., Oades, J.M., Vassallo, A.M., Wilson, M.A., 1990. Solid-state CP/MAS
13C N.M.R. analysis of bacterial and fungal cultures isolated from a soil
incubated with glucose. Australian Journal of Soil Research 28, 213-225.
Baldock, J.A., Oades, J.M., Waters, A.G., Peng, X., Vassallo, A.M., Wilson, M.A.,
1992. Aspects of the chemical structure of soil organic materials as revealed by
solid-state 13C NMR spectroscopy. Biogeochemistry 16, 1-42.
Baldock, J.A., Skjemstad, J.O., 2000. Role of the mineral matrix and minerals in
protecting natural organic materials against biological attack. Organic
Geochemistry 31, 697-710.
Balesdent, J., Besnard, E., Arrouays, D., Chenu, C., 1998. The dynamics of carbon in
particle-size fractions of soil in a forest-cultivation sequence. Plant and Soil 201,
49-57.
Bascietto, M., Cherubini, P., Scarascia-Mugnozza, G., 2004. Tree rings from a Euopean
beech forest chronosequence are useful for detecting growth trends and carbon
sequestration. Canadian Journal of Forest Research 34, 481-492.
Batjes, N.H., 1996. Total carbon and nitrogen in the soils of the world. European
Journal of Soil Science 47, 151-163.
Batjes, N.H., 2002. Carbon and nitrogen stocks in the soils of Central and Eastern
Europe. Soil Use and Management 18, 324-329.

9. REFERENCES 88
Becker-Heidmann, P., Liang-wu, L., Scharpenseel, H.-W., 1988. Radiocarbon dating of
organic matter fractions of a Chinese Mollisol. Zeitschrift für Pflanzenernährung
und Bodenkunde 151, 37-39.
Becker-Heidmann, P., Scharpenseel, H.W., Wiechmann, H., 1996. Hamburg
Radiocarbon Thin Layer Soils Database. Radiocarbon 38, 295-345.
Beudert, G., Kögel-Knabner, I., Zech, W., 1989. Micromorphological, wet-chemical
and 13C NMR spectroscopic characterization of density fractionated forest soils.
Science of the Total Environment 81/82, 401-408.
Beyer, L., 1993. Die Zusammensetzung der organischen Bodensubstanz (OBS) und ihr
Einfluß auf die mikrobielle Biomasse. Mitteilungen der Deutschen
Bodenkundlichen Gesellschaft 71, 313-316.
Beyer, L., 1996. Soil organic matter composition of spodic horizons in Podzols of the
Northwest German Lower Plain. The Science of the Total Environment 181,
167-180.
Borggaard, O.K., 1982. The influence of iron oxides on the surface area of soil. Journal
of Soil Science 33, 443-449.
Brunauer, S., Emmett, P., Teller, E., 1938. Adsorption of gases in multimolecular
layers. Journal of the American Chemical Society 60, 309-319.
Bundt, M., Widmer, F., Pesaro, M., Zeyer, J., Blaser, P., 2001. Preferential flow paths:
biological 'hot spots' in soils. Soil Biology & Biochemistry 33, 729-738.

9. REFERENCES 89
Capriel, P., Beck, T., Borchert, H., Gronholz, J., Zachmann, G., 1995. Hydrophobicity
of the organic matter in arable soils. Soil Biology & Biochemistry 27, 1453-
1458.
Certini, G., Agnelli, A., Corti, G., Capperucci, A., 2004. Composition and mean
residence time of molecular weight fractions of organic matter extracted from
two soils under different forest species. Biogeochemistry 71, 299-316.
Chaplot, V., Bernoux, M., Walter, C., Curmi, P., Herpin, U., 2001. Soil carbon storage
prediction in temperate hydromorphic soils using a morphologic index and
digital elevation model. Soil Science 166, 48-60.
Chen, J.-S., Chiu, C.-Y., 2003. Characterization of soil organic matter in different
particle-size fractions in humid subalpine soils by CP/MAS 13C NMR.
Geoderma 117, 129-141.
Christensen, B.T., 1992. Physical fractionation of soil and organic matter in primary
particle size and density separates. Advances in Soil Science 20. Springer-
Verlag, New York, pp. 1-90.
Christensen, B.T., 1996. Carbon in primary and secondary organomineral complexes.
In: M.R. Carter and B.A. Stewart (Editors), Structure and organic matter storage
in agricultural soils. Advances in Soil Science. CRC Press, Boca Raton, pp. 97-
165.
Christensen, B.T., 2001. Physical fractionation of soil and structural and functional
complexity in organic matter turnover. European Journal of Soil Science 52,
345-353.
9. REFERENCES 90
Conant, R.T., Paustian, K., 2002. Spatial variability of soil organic carbon in grasslands:
Implications for detecting change at different scales. Environmental Pollution
116, S127-S135.
Conant, R.T., Smith, G.R., Paustian, K., 2003. Spatial variability of soil carbon in
forested and cultivated sites: Implications for change detection. Journal of
Environmental Quality 32, 278-286.
Conen, F., Zerva, A., Arrouays, D., Jolivet, P.G., Jarvis, P.G., Grace, J., Mencuccini,
M., 2004. The carbon balance of forest soils: detectability of changes in soil
carbon stocks in temperate and boreal forests. In: H. Griffiths and P.J. Jarvis
(Editors), The Carbon Balance of Forest Biomes. Garland Science/ BIOS
Scientific Publishers, London, in press.
Dai, K.H., Johnson, C.E., 1999. Applicability of solid-state 13C CP/MAS NMR analysis
in spodosols: chemical removal of magnetic materials. Geoderma 93, 289-310.
Davis, A.A., Stolt, M.H., Compton, J.E., 2004. Spatial distribution of soil carbon in
southern New England hardwood forest landscapes. Soil Science Society of
America Journal 68, 895-903.
Deng, Y., Dixon, J.B., 2002. Soil organic matter and organic-mineral interactions. In:
J.B. Dixon and D.G. Schulze (Editors), Soil mineralogy with environmental
applications. Soil Science Society of America, Madison, pp. 69-104.
Ellert, B.H., Janzen, H.H., Entz, T., 2002. Assessment of a method to measure temporal
change in soil carbon storage. Soil Science Society of America Journal 66,
1687-1695.

9. REFERENCES 91
Ertel, J.R., Hedges, J.I., 1984. The lignin component of humic substances: Distribution
among soil and sedimentary humic, fulvic, and base-insoluble fractions.
Geochimica et Cosmochimica Acta 48, 2065-2074.
Eusterhues, K., Rumpel, C., Kleber, M., Kögel-Knabner, I., 2003. Stabilisation of soil
organic matter by interactions with minerals as revealed by mineral dissolution
and oxidative degradation. Organic Geochemistry 34, 1591-1600.
Eusterhues, K., Rumpel, C., Kögel-Knabner, I., 2005. Organo-mineral associations in
sandy acid forest soils: importance of specific surface area, iron oxides and
micropores. European Journal of Soil Science, doi:10.1111/j.1365-
2389.2005.00710.x.
FAO, 1990. Guidelines for profile description. 3rd Edition, FAO, Rome.
Garten, C.T., Jr., Wullschleger, S.D., 1999. Soil carbon inventories under a bioenergy
crop (switchgrass): measurement limitations. Journal of Environmental Quality
28, 1359-1365.
Gélinas, Y., Baldock, J.A., Hedges, J.I., 2001. Demineralization of marine and
freshwater sediments for CP/MAS 13C NMR analysis. Organic Geochemistry
32, 677-693.
Gleixner, G., Poirier, N., Bol, R., Baldesdent, J., 2002. Molecular dynamics of organic
matter in a cultivated soil. Organic Geochemistry 33, 357-366.
Golchin, A., Baldock, J.A., Clarke, P., Higashi, T., Oades, J.M., 1997. The effects of
vegetation and burning on the chemical composition of soil organic matter in a
volcanic ash soil as shown by 13C NMR spectroscopy. II. Density fractions.
Geoderma 76, 175-192.

9. REFERENCES 92
Golchin, A., Clarke, P., Oades, J.M., 1996. The heterogeneous nature of microbial
products as shown by solid-state 13C CP/MAS NMR spectroscopy.
Biogeochemistry 34, 71-97.
Golchin, A., Oades, J.M., Skjemstad, J.O., Clarke, P., 1994. Soil structure and carbon
cycling. Australian Journal of Soil Research 32, 1043-1068.
Golchin, A., Oades, J.M., Skjemstad, J.O., Clarke, P., 1995. Structural and dynamic
properties of soil organic matter as reflected by 13C natural abunddance,
pyrolysis mass spectrometry and solid-state 13C NMR spectrometry in density
fractions of an oxisol under forest and pasture. Australian Journal of Soil
Research 33, 59-76.
Gömöryová, E., 2004. Small-scale variation of microbial activities in a forest soil under
beech (Fagus Sylvatica L.) stand. Polish Journal of Ecology 52, 311-321.
Goncalves, C.N., Dalmolin, R.S.D., Dick, D.P., Knicker, H., Klamt, E., Kögel-Knabner,
I., 2003. The effect of 10% HF treatment on the resolution of CPMAS 13C NMR
spectra and on the quality of organic matter in Ferralsols. Geoderma 116, 373-
392.
Goovaerts, P., 1997. Geostatistics for Natural Resource Evolution. Oxford University
Press, New York.
Greenland, D.J., 1970. Interactions between humic and fulvic acids and clays. Soil
Science 111, 34-41.
Guggenberger, G., Christensen, B.T., Zech, W., 1994. Land-use effects on the
composition of organic matter in particle-size separates of soil: I. Lignin and
carbohydrate signature. European Journal of Soil Science 45, 449-458.

9. REFERENCES 93
Guggenberger, G., Zech, W., 1994. Composition and dynamics of dissolved
carbohydrates and lignin-degradation products in two coniferous forests, N.E.
Bavaria, Germany. Soil Biology & Biochemistry 26, 19-27.
Guggenberger, G., Zech, W., 1999. Soil organic matter composition under primary
forest, pasture, and secondary forest succession, Región Huetar Norte, Costa
Rica. Forest Ecology and Management 124, 93-104.
Guggenberger, G., Zech, W., Haumaier, L., Christensen, B.T., 1995. Land-use effects
on the composition of organic matter in particle-size separates of soils: II.
CPMAS and solution 13C NMR analysis. European Journal of Soil Science 46,
147-158.
Hagedorn, F., Spinnler, D., Bundt, M., Blaser, P., Siegwolf, R., 2003. The input and fate
of new C in two forest soils under elevated CO2. Global Change Biology 9, 862-
872.
Haider, K., 1999. Von der toten organischen Substanz zum Humus. Zeitschrift für
Pflanzenernährung und Bodenkunde 162, 363-371.
Harrison, A.F., Harkness, D.D., Rowland, A.P., Garnett, J.S., Bacon, P.J., 2000. Annual
carbon and nitrogen fluxes in soils along the European forest transect,
determined using 14C-bomb. In: E.-D. Schulze (Editor), Carbon and nitrogen
cycling in European forest ecosystems. Ecological Studies 142. Springer, Berlin
Heidelberg, pp. 237-256.
Hartge, K.H., Becher, H.H., 1971. Ein Entnahmegerät für Stechzylinderproben (Device
for taking soil core samples). Zeitschrift für Kulturtechnik und Flurbereinigung
12, 276-284.

9. REFERENCES 94
Hartge, K.H., Horn, R., 1989. Die physikalische Untersuchung von Böden. 2.Auflage.
Enke Verlag, Stuttgart.
Haumaier, L., Zech, W., 1995. Black carbon - possible source of highly aromatic
components of soil humic acids. Organic Geochemistry 23, 191-196.
Hedges, J.I., Ertel, J.R., 1982. Characterization of lignin by gas capillary
chromatography of cupric oxide oxidation products. Analytical Chemistry 54,
174-178.
Hedges, J.I., Oades, J.M., 1997. Comparative organic geochemistries of soils and
marine sediments. Organic Geochemistry 27, 319-361.
Hewitt, A.E., Burgham, S.J., Gibson, R.S., 1998. Spatial variability of organic carbon in
a tussock grassland, Manorburn, Central Otago, New Zealand. New Zealand
Journal of Agricultural Research 41, 613-622.
Homann, P.S., Bormann, B.T., Boyle, J.R., 2001. Detecting treatment differences in soil
carbon and nitrogen resulting from forest manipulations. Soil Science Society of
America Journal 65, 463-469.
Huntington, T.G., Johnson, C.E., Johnson, A.H., Siccama, T.G., Ryan, D.F., 1989.
Carbon, organic matter and bulk density relationships in a forested Spodosol.
Soil Science 148, 380-386.
ISSS-ISRIC-FAO, 1998. World reference base for soil resources. FAO world soil
resources report 84, FAO, Rome.

9. REFERENCES 95
Jancke, H., Beetz, S., Bechmann, W., 2002. Non-selective signal loss in the 13C
CPMAS NMR spectra of soil organic matter. Investigations of particle size
fractions. Journal of Environmental Monitoring 4, 313-317.
Järvinen, E., Hokkanen, T.J., Kuuluvainen, T., 1993. Spatial heterogeneity and
relationships of mineral soil properties in a boreal Pinus sylvestris stand.
Scandinavian Journal of Forest Research 8, 435-445.
Kachanoski, R.G., De Jong, E., Rolston, D.E., 1985. Spatial and spectral relationships
of soil properties and microtopography: II. Density and thickness of B horizon.
Soil Science Society of America Journal 49, 812-816.
Kahle, M., Kleber, M., Jahn, R., 2002. Carbon storage in loess derived surface soils
from Central Germany: Influence of mineral phase variables. Journal of Plant
Nutrition and Soil Science 165, 141-149.
Kaiser, K., 2003. Sorption of natural organic matter fractions to goethite (alpha-
FeOOH): effect of chemical composition as revealed by liquid-state 13C NMR
and wet-chemical analysis. Organic Geochemistry 34, 1569-1579.
Kaiser, K., Eusterhues, K., Rumpel, C., Guggenberger, G., Kögel-Knabner, I., 2002.
Stabilization of organic matter by soil minerals - investigations of density and
particle size fractions from two acid forest soils. Journal of Plant Nutrition and
Soil Science 165, 451-459.
Kaiser, K., Guggenberger, G., 2000. The role of DOM sorption to mineral surfaces in
the preservation of organic matter in soils. Organic Geochemistry 31, 711-725.
Kaiser, K., Guggenberger, G., Zech, W., 1996. Sorption of DOM and DOM fractions to
forest soils. Geoderma 74, 281-303.

9. REFERENCES 96
Keeler, C., Maciel, G.E., 2003. Quantitation in the solid-state 13C NMR analysis of soil
and organic soil fractions. Analytical Chemistry 75, 2421-2432.
Kiem, R., Knicker, H., Körschens, M., Kögel-Knabner, I., 2000. Refractory organic
carbon in C-depleted arable soils, as studied by 13C NMR spectroscopy and
carbohydrate analysis. Organic Geochemistry 31, 655-668.
Kiem, R., Kögel-Knabner, I., 2002. Refractory organic carbon in particle-size fractions
of arable soils II: organic carbon in relation to mineral surface area and iron
oxides in fractions < 6 µm. Organic Geochemistry 33, 1699-1713.
Kiem, R., Kögel-Knabner, I., 2003. Contribution of lignin and polysaccharides to the
refractory carbon pool in C-depleted arable soils. Soil Biology & Biochemistry
35, 101-118.
Kinchesh, P., Powloson, D.S., Randall, E.W., 1995. 13C NMR studies of organic matter
in whole soils: I. Quantitation possibilities. European Journal of Soil Science 46,
125-138.
Knicker, H., 2004. Solid-state NMR investigations of organic matter conversions during
solid-waste processing. In: P. Lens, B. Hamelers, H. Hoitink and W.
Bidlingmaier (Editors), Resource recovery and reuse in organic solid waste
management. IWA Publishing, London, pp. 171-192.
Kögel-Knabner, I., 1997. 13C und 15N NMR spectroscopy as a tool in soil organic matter
studies. Geoderma 80, 243-270.
Kögel-Knabner, I., 2000. Analytical approaches for characterizing soil organic matter.
Organic Geochemistry 31, 609-625.

9. REFERENCES 97
Kögel-Knabner, I., 2002. The macromolecular organic composition of plant and
microbial residues as inputs to soil organic matter. Soil Biology & Biochemistry
34, 139-162.
Kögel-Knabner, I., de Leeuw, J.W., Hatcher, P.G., 1992. Nature and distribution of
alkyl carbon in forest soil profiles: implications for the origin and humification
of aliphatic biomacromolecules. The Science of the Total Environment 117-118,
175-185.
Kögel-Knabner, I., Ziegler, F., 1993. Carbon distribution in different compartments of
forest soils. Geoderma 56, 515-525.
Kögel, I., Bochter, R., 1985. Characterization of lignin in forest humus layers by high-
performance liquid chromatography of cupric oxide oxidation products. Soil
Biology & Biochemistry 17, 637-640.
Kretschmer, W., Anton, G., Bergmann, M., Finckh, E., Kowalzik, B., Klein, M.,
Leigart, M., Merz, S., Morgenroth, G., Piringer, I., 1997. The Erlangen AMS
facility: status report and research program. Nuclear Instruments and Methods in
Physics Research B 123, 93-96.
Krull, E.S., Skjemstad, J.O., 2003. Delta C-13 and delta N-15 profiles in C-14-dated
Oxisol and Vertisols as a function of soil chemistry and mineralogy. Geoderma
112, 1-29.
Liebens, J., VanMolle, M., 2003. Influence of estimation procedure on soil organic
carbon stock assessment in Flanders, Belgium. Soil Use and Management 19,
364-371.

9. REFERENCES 98
Liski, J., 1995. Variation in soil organic carbon and thickness of soil horizons within a
boreal forest stand - effect of trees and implications for sampling. Silva Fennica
29, 255-266.
Lorenz, K., Preston, C.M., Krumei, S., Feger, K.-H., 2004. Decomposition of
needle/leaf litter from Scots pine, black cherry, common oak and European
beech at a conurbation forest site. European Journal of Forest Research 123,
177-188.
Lützow, M., Kögel-Knabner, I., Ekschmitt, K., Matzner, E., Guggenberger, G.,
Marschner, B., Flessa, H., 2005. Mechanisms for organic matter stabilisation in
temperate soils - a synthesis. European Journal of Soil Science - submitted.
Mahieu, N., Powlson, D.S., Randall, E.W., 1999. Statistical analysis of published
carbon-13C CPMAS NMR spectra of soil organic matter. Soil Science Society of
America Journal 63, 307-319.
Mathers, N.J., Xu, Z.H., Berners-Price, S.J., Perera, M.C.S., Saffigna, P.G., 2002.
Hydrofluoric acid pre-treatment for improving 13C CPMAS NMR spectral
quality of forest soils in south-east Queensland, Australia. Australian Journal of
Soil Research 40, 655-674.
Mayer, L.M., 1994. Relationship between mineral surfaces and organic carbon
concentrations in soils and sediments. Chemical Geology 114, 347-363.
Mehra, O.P., Jackson, M.L., 1960. Iron oxide removal from soils and clays by
dithionite-citrate system buffered with sodium bicarbonate. Clays and Clay
Minerals Proceedings of the 7th National Conference, 317-327.

9. REFERENCES 99
Mehring, M., 1983. Principles of high resolution NMR in solids. Springer, Berlin -
Heidelberg - New York.
Miltner, A., Zech, W., 1998. Carbohydrate decomposition in beech litter as influenced
by aluminium, iron and manganese oxides. Soil Biology & Biochemistry 30, 1-
7.
Mook, W.G., Streurman, H.J., 1983. Physical and chemical aspects of radiocarbon
dating. Journal of the European Study Group of Physical, Chemical, Biological
and Mathematical Techniques Applied to Archaeology (PACT) 8, 31-55.
Nelson, P.N., Baldock, J.A., 2005. Estimating the molecular composition of a diverse
range of natural organic materials from solid-state 13C NMR and elemental
analyses. Biogeochemistry 72, 1-34.
Nielsen, D.R., Wendroth, O., 2003. Spatial and temporal statistics - Sampling field soils
and their vegetation. Geoecology textbook. Catena Verlag, Reiskirchen.
Nierop, K.G.J., Naafs, D.F.W., Verstraten, J.M., 2003. Occurence and distribution of
ester-bound lipids in Dutch coastal dune soils along a pH gradient. Organic
Geochemistry 34, 719-729.
Oades, J.M., 1989. An introduction to organic matter in mineral soils. In: J.B. Dixon
and S.B. Weed (Editors), Minerals in Soil Environments. Soil Science Society of
America, Madison, pp. 89-159.
Oades, J.M., Vassallo, A.M., Waters, A.G., Wilson, M.A., 1987. Characterization of
organic matter in particle size and density fractions from a red-brown earth by
solid-state 13C N.M.R. Australian Journal of Soil Research 25, 71-82.

9. REFERENCES 100
Oliver, G.R., Beets, P.N., Garrett, L.G., Pearce, S.H., Kimberly, M.O., Ford-Robertson,
J.B., Robertson, K.A., 2004. Variation in soil carbon in pine plantations and
implications for monitoring soil carbon stocks in relation to land-use change and
forest site management in New Zealand. Forest Ecology and Management 203,
283-295.
Palmer, C.J., Smith, W.D., Conkling, B.L., 2002. Development of a protocol for
monitoring status and trends in forest soil carbon at a national level.
Environmental Pollution 116, S209-S219.
Parfitt, R.L., Yuan, G., Theng, B.K.G., 1999. A 13C-NMR study of the interactions of
soil organic matter with aluminium and allophane in podzols. European Journal
of Soil Science 50, 695-700.
Parton, W.J., Schimel, D.S., Cole, C.V., Ojima, D.S., 1987. Analysis of factors
controlling soil organic matter levels in Great Plains grasslands. Soil Science
Society of America Journal 51, 1173-1179.
Paz-Gonzalez, A., Vieira, S.R., Castro, M.T.T., 2000. The effect of cultivation on the
spatial variability of selected properties of an umbric horizon. Geoderma 97,
273-292.
Pfeffer, 1984. Effect of paramagnetic iron on quantitation in carbon-13 cross
polarization magic angle spinning nuclear magnetic resonance spectrometry of
heterogeneous environmental matrices. Analytical Chemistry 56, 734-741.
Post, W.M., Izaurralde, R.C., Mann, L.K., Bliss, N., 2001. Monitoring and verifying
changes of organic carbon in soil. Climatic Change 51, 73-99.

9. REFERENCES 101
Pregitzer, K.S., 2003. Carbon cycling in forest ecosystems with an emphasis on
belowground processes. In: J.M. Kimble, R. Lal, R. Birdsey and L.S. Heath
(Editors), The potential of U.S. forest soils to sequester carbon and mitigate the
greenhouse effect. CRC Press, Boca Raton, pp. 93-104.
Preston, C.M., Dudley, R.L., Fyfe, C.A., Mathur, S.P., 1984. Effects of variations in
contact times and copper contents in a 13C CPMAS NMR study of samples of
four organic soils. Geoderma 33, 245-253.
Preston, C.M., Newman, R.H., Rother, P., 1994. Using 13C CPMAS NMR to assess
effects of cultivation on the organic matter of particle size fractions in a
grassland soil. Soil Science 157, 26-35.
Preston, C.M., Trofymow, J.A., Niu, J., Fyfe, C.A., 1998. 13CPMAS-NMR
spectroscopy and chemical analysis of coarse woody debris in coastal forests of
Vancouver Island. Forest Ecology and Management 111, 51-68.
Quideau, S.A., Anderson, M.A., Graham, R.C., Chadwick, O.A., Trumbore, S.E., 2000.
Soil organic matter processes: characterization by 13C-NMR and 14C-
measurements. Forest Ecology and Management 138, 19-27.
Quideau, S.A., Chadwick, O.A., Benesi, A., Graham, R.C., Anderson, M.A., 2001a. A
direct link between forest vegetation type and soil organic matter composition.
Geoderma 104, 41-60.
Quideau, S.A., Chadwick, O.A., Trumbore, S.E., Johnson-Maynard, J.L., Graham, R.C.,
Anderson, M.A., 2001b. Vegetation control on soil organic matter dynamics.
Organic Geochemistry 32, 247-252.

9. REFERENCES 102
Riha, S.J., James, B.R., Senesac, G.P., Pallant, E., 1986. Spatial variability of soil pH
and organic matter in forest plantations. Soil Science Society of America Journal
50, 1347-1352.
Ruark, G.A., Zarnoch, S.J., 1993. Soil carbon, nitrogen, and fine root biomass sampling
in a pine stand. Soil Science Society of America Journal 56, 1945-1950.
Rumpel, C., Eusterhues, K., Kögel-Knabner, I., 2004. Location and chemical
composition of stabilized organic carbon in topsoil and subsoil horizons of two
acid forest soils. Soil Biology & Biochemistry 36, 177-190.
Rumpel, C., Kögel-Knabner, I., Bruhn, F., 2002. Vertical distribution, age, and
chemical composition of organic carbon in two forest soils of different
pedogenesis. Organic Geochemistry 33, 1131-1142.
Saggar, S., Parshotam, A., Sparling, G.P., Feltham, C.W., Hart, P.B.S., 1996. 14C-
labelled ryegrass turnover and residence times in soils varying in clay content
and mineralogy. Soil Biology & Biochemistry 28, 1677-1686.
Scharpenseel, H.W., Tsutsuki, K., Becker-Heidmann, P., Freytag, J., 1986.
Untersuchungen zur Kohlenstoffdynamik und Bioturbation von Mollisolen.
Zeitschrift für Pflanzenernährung und Bodenkunde 149, 582-597.
Schilling, M., Cooper, W.T., 2004a. Effects of chemical treatments on the quality and
quantitative reliability of solid-state 13C NMR spectroscopy of mineral soils.
Analytica Chimica Acta 508, 207-216.
Schilling, M., Cooper, W.T., 2004b. Identification of copper binding sites in soil
organic matter through chemical modifications and 13C CP-MAS NMR
spectroscopy. Environmental Science & Technology 38, 5059-5063.

9. REFERENCES 103
Schlichting, E., Blume, H.P., 1966. Bodenkundliches Praktikum. Verlag Paul Parey,
Hamburg & Berlin.
Schmidt, M.W.I., Gleixner, G., 2005. Carbon and nitrogen isotope composition of bulk
soils, particle-size fractions and organic material after treatment with
hydrofluoric acid. European Journal of Soil Science 56, 407-416.
Schmidt, M.W.I., Knicker, H., Hatcher, P.G., Kögel-Knabner, I., 1997. Improvement of
13C and 15N CPMAS NMR spectra of bulk soils, particle size fractions and
organic material by treatment with 10% hydrofluoric acid. European Journal of
Soil Science 48, 319-328.
Schmidt, M.W.I., Kögel-Knabner, I., 2002. Organic matter in particle-size fractions
from A and B horizons of a Haplic Alisol. European Journal of Soil Science 53,
383-391.
Schmidt, M.W.I., Skjemstad, J.O., Gehrt, E., Kögel-Knabner, I., 1999. Charred organic
carbon in German chernozemic soils. European Journal of Soil Science 50, 351-
365.
Schöning, I., Knicker, H., Kögel-Knabner, I., 2005a. Intimate association between O/N-
alkyl carbon and iron oxides in clay fractions of forest soils. Organic
Geochemistry 36, 1378-1390.
Schöning, I., Morgenroth, G., Kögel-Knabner, I., 2005b. O/N-alkyl C and alkyl C are
stabilised in fine particle size fractions of forest soils. Biogeochemistry 73, 475-
497.

9. REFERENCES 104
Schwertmann, U., 1964. Differenzierung der Eisenoxide des Bodens durch Extraktion
mit Ammoniumoxalat-Lösung. Zeitschrift für Pflanzenernährung und
Bodenkunde 105, 194-202.
Shang, C., Tiessen, H., 1998. Organic matter stabilization in two semiarid tropical soils:
size, density, and magnetic separations. Soil Science Society of America Journal
62, 1247-1257.
Six, J., Conant, R.T., Paul, E.A., Paustian, K., 2002. Stabilization mechanisms of soil
organic matter: Implications for C-saturation of soils. Plant and Soil 241, 155-
176.
Six, J., Guggenberger, G., Paustian, K., Haumaier, L., Elliott, E.T., Zech, W., 2001.
Sources and composition of soil organic matter fractions between and within soil
aggregates. European Journal of Soil Science 52, 607-618.
Skjemstad, J.O., Clarke, P., Golchin, A., Oades, J.M., 1997. Characterization of soil
organic matter by solid-state 13C NMR spectroscopy. In: G. Cadisch and K.E.
Giller (Editors), Driven by nature: plant litter quality and decomposition. CAB
International, Wallingford, pp. 253-271.
Skjemstad, J.O., Clarke, P., Taylor, J.A., Oades, J.M., McClure, S.G., 1996. The
chemistry and nature of protected carbon in soil. Australian Journal of Soil
Research 34, 251-271.
Skjemstad, J.O., Clarke, P., Taylor, J.A., Oades, J.M., Newman, R.H., 1994. The
removal of magnetic materials from surface soils. A solid state 13C CP/MAS
n.m.r. study. Australian Journal of Soil Research 32, 1215-1229.

9. REFERENCES 105
Smernik, R.J., Oades, J.M., 1999. Effects of added paramagnetic ions on the 13C CP
MAS NMR spectrum of a de-ashed soil. Geoderma 89, 219-248.
Smernik, R.J., Oades, J.M., 2000. The use of spin counting for determining quantitation
in solid state 13C NMR spectra of natural organic matter 1. Model systems and
the effects of paramagnetic impurities. Geoderma 96, 101-129.
Smith, P., 2004. Monitoring and verification of soil carbon changes under Article 3.4 of
the Kyoto Protocol. Soil Use and Management 20, 264-270.
Sollins, P., Homann, P., Caldwell, B.A., 1996. Stabilization and destabilization of soil
organic matter: mechanisms and controls. Geoderma 74, 65-105.
Solomon, D., Fritzsche, F., Tekalign, M., Lehmann, J., Zech, W., 2002. Soil organic
matter composition in the subhumid Ethiopian highlands as influenced by
deforestation and agricultural management. Soil Science Society of America
Journal 66, 68-82.
Spycher, G., Sollins, P., Rose, S., 1983. Carbon and nitrogen in the light fraction of a
forest soil: Vertical distribution and seasonal patterns. Soil Science 135, 79-86.
SSSA, 2001. Internet Glossary of Soil Science Terms (http://www.soils.org/sssagloss/).
Stevenson, F.J., 1994. Humus chemistry - genesis, composition, reactions. John Wiley
& Sons, Inc., New York.
Tan, Z.X., Lal, R., Smeck, N.E., Calhoun, F.G., 2004. Relationships between surface
soil organic carbon pool and site variables. Geoderma 121, 187-195.

9. REFERENCES 106
Torn, M.S., Trumbore, S.E., Chadwick, O.A., Vitousek, P.M., Hendricks, D.M., 1997.
Mineral control of soil organic carbon storage and turnover. Nature 389, 170-
173.
Trüby, P., Aldinger, E., 1989. Eine Methode zur Bestimmung austauschbarer Kationen
in Waldböden. Zeitschrift für Pflanzenernährung und Bodenkunde 152, 301-306.
Trumbore, S.E., Zheng, S., 1996. Comparision of fractionation methods for soil organic
matter 14C analysis. Radiocarbon 38, 219-229.
van Groenigen, J.W., 2000. The influence of variogram parameters on optimal sampling
schemes for mapping by kriging. Geoderma 97, 223-236.
Vassallo, A.M., Wilson, M.A., Collin, P.J., 1987. Structural analysis of geochemical
samples by solid-state nuclear magnetic resonance spectrometry. Role of
paramagnetic material. Analytical Chemistry 59, 558-562.
Wang, Y., Hsieh, Y.-P., 2002. Uncertainties and novel prospects in the study of the soil
carbon dynamics. Chemosphere 49, 791-804.
Watson, R.T., Noble, I.R., Bolin, B., Ravindranath, N.H., Verardo, D.J., Dokken, D.J.,
2000. Land use, land-use change and forestry. IPCC special report. Cambridge
University Press, Cambridge.
Wattel-Koekkoek, E.J.W., Buurman, P., 2004. Mean residence time of kaolinite and
smectite-bound organic matter in Mazambiquan soils. Soil Science of America
Journal 68, 154-161.
Webster, R., Oliver, M.A., 2001. Geostatistics. Statistics in practice. Wiley, Chichester.
9. REFERENCES 107
Winkler, A., Haumaier, L., Zech, W., 2005. Insoluble alkyl carbon components in soils
derive mainly from cutin and suberin. Organic Geochemistry 36, 519-529.
Zar, J.H., 1984. Biostatistical analysis. Prentice-Hall, Englewood Cliffs, N.J.
Zech, W., Guggenberger, G., 1996. Organic matter dynamics in forest soils of temperate
and tropical ecosystems. In: A. Piccolo (Editor), Humic substances in terrestial
ecosystems. Elsevier Science B.V., Amsterdam, pp. 101-170.
Zhang, C.S., McGrath, D., 2004. Geostatistical and GIS analyses on soil organic carbon
concentrations in grassland of southeastern Ireland from two different periods.
Geoderma 119, 261-275.
Zhuang, J., Yu, G.R., 2002. Effects of surface coatings on electrochemical properties
and contaminant sorption of clay minerals. Chemosphere 49, 619-628.

10. ACKNOWLEDGEMENT (DANKSAGUNG) 108
10. Acknowledgement (Danksagung)
Zahlreiche Personen haben zum Gelingen der vorliegenden Arbeit beigetragen, denen ich an dieser Stelle ganz herzlich danken möchte, auch den nachfolgend namentlich hier nicht erwähnten gilt mein Dank: Insbesondere möchte ich meine Betreuerin, Frau Prof. Dr. Ingrid Kögel-Knabner, erwähnen. Bei ihr möchte ich mich für die Überlassung des interessanten Themas bedanken. Ihr stetes Interesse und ihre Diskussionsbereitschaft, ebenso die vielfältigen Anregungen, aber auch der von ihr gewährte Freiraum für das Verfolgen eigener Ideen, haben diese Arbeit geprägt. Herrn Prof. Dr. Ernst-Detlev Schulze danke ich für die freundliche Übernahme des Zweitgutachtens und die erfrischenden Diskussionen bei den FORCAST Projekt-Treffen. Bei Herrn Prof. Dr. Reinhard Mosandl möchte ich mich für die Übernahme des Vorsitzes der Prüfungskommission bedanken. Frau Gabriele („Gabi“) Albert möchte ich besonders für ihr Engagement bei der Durchführung der zeitaufwendigen bodenchemischen Analysen danken, womit sie maßgeblich zum Gelingen der Arbeit beitrug. Die spontane Hilfe bei der flächenhaften Beprobung in Leinefelde bleibt mir unvergesslich. Den studentischen Hilfskräften Frau Sara Beier, Frau Brenda Dreher, Frau Xiaohong Duan, Frau Bärbel Grossmann, Herrn Houhua Li, Frau Nadine Roth, Frau Heike Sliwinski und Frau Sandra Weber danke ich für ihre große Einsatzbereitschaft bei den Labor- und Feldarbeiten. Außerdem danke ich Herrn Rothagen, der mich bei der flächenhaften Beprobung in Leinefelde tatkräftig unterstützte und eine schnelle Lösung fand, als das Probenahmegerät am Ausgangsgestein „zerbrach“. Meiner Bürokollegin, Frau Dr. Karin Eusterhues danke ich ganz besonders für die moralische Unterstützung, die zahlreichen fachlichen Ratschläge, die Unterstützung bei den BET Messungen und die freundliche Arbeitsatmosphäre. Bei allen derzeitigen und ehemaligen Mitarbeitern des Lehrstuhls für Bodenkunde möchte ich mich für zahlreiche (nicht nur bodenkundlich) wertvolle Diskussionen, aber vor allem für das gute Arbeitsklima bedanken. Kerstin Abelmann danke ich für die Tipps bei der Anwendung der NMR Spektroskopie. Herrn Prof. Rupert Bäumler danke ich für die Hilfe bei meiner ersten Probenahme in Leinefelde und Tharandt. Herrn Dr. Thomas Caspari danke für die Unterstützung in Computerfragen. Frau PD Dr. Heike Knicker gilt mein Dank für die theoretische Einführung in NMR Spektroskopie und die Unterstützung bei der Durchführung des Kontaktzeit-Experiments. Bei Herrn PD Dr. Kai Totsche möchte ich mich für hilfreiche Diskussionen über die räumliche Beprobung von Kohlenstoffvorräten bedanken. Herrn Dr. Peter Schad stand mir bei der Klassifikation der Böden beratend zur Seite. Herrn Dr. Reiner Zimmermann möchte ich für die gute Koordination des FORCAST Projektes und insbesondere für die Organisation der vielen Probenahmen und Projekttreffen danken.

10. ACKNOWLEDGEMENT (DANKSAGUNG) 109
Dr. Gerhard Morgenroth und Katrin Kitzler danke ich für die Durchführung der 14C Datierungen und die Hilfe bei der Auswertung der Messergebnisse. Für die finanzielle Unterstützung im Rahmen des EU Projektes FORCAST (EVK2-CT-1999-00035) möchte ich mich beim EU Research-Directorate-General sowie bei der Stipendienstelle der TU München bedanken, die mir ein zweijähriges Doktorandenstipendium gewährt hat. Der größte Dank gilt meinen Eltern, Jutta und Bernhard Schöning, die mir während des gesamten Studiums und der Promotion stets mit Rat und Tat zur Seite gestanden haben. Ihnen danke ich für ihre moralische Unterstützung auch in schwierigen Zeiten. Für das Korrekturlesen von Teilen dieser Arbeit möchte ich meinem Bruder Sascha danken.
Lebenslauf - Ingo Schöning
Persönliche Daten
Geburtsdatum: Geburtsort: Staatsangehörigkeit:
19. März 1974 Köln deutsch
Schulbildung
8/1984 - 6/1993 6/1993
Max-Ernst-Gymnasium der Stadt Brühl Abitur
Zivildienst
8/1993 – 10/1994
Untere Landschaftsbehörde der Stadt Bonn Betreuung des Informationszentrums „Haus der Natur“
Studium
10/1994 - 4/2000 4/2000 9/1997 - 2/1998 4/1999 - 4/2000 2/1997 - 3/1997
Geoökologie Studium an der Universität Potsdam Abschluss als Diplom-Geoökologe; Diplomarbeit zum Thema: „Verlagerung von Flurochloridon durch Winderosion“ Auslandssemester an der Universität Plymouth/England Stipendium der Heinrich-Böll-Stiftung, Berlin Praktikum am Pflanzenschutzzentrum Monheim der Bayer AG; Rückstandsanalytik von Insektiziden
Promotion
seit 5/2000 5/2000 - 4/2003 5/2003 – 4/2005
Lehrstuhl für Bodenkunde, Technische Universität München; Promotion zum Thema: „Organic matter stocks in temperate forest soils: Composition, radiocarbon age and spatial variability“ Wissenschaftlicher Mitarbeiter im EU-Projekt „Forest Carbon and Nitrogen Trajectories“ Promotionsstipendiat des Freistaats Bayern