organizational information dissemination within
TRANSCRIPT
Nova Southeastern UniversityNSUWorks
CEC Theses and Dissertations College of Engineering and Computing
2017
Organizational Information Dissemination WithinCollaborative Networks Using DigitalCommunication ToolsCristelia HinojosaNova Southeastern University, [email protected]
This document is a product of extensive research conducted at the Nova Southeastern University College ofEngineering and Computing. For more information on research and degree programs at the NSU College ofEngineering and Computing, please click here.
Follow this and additional works at: https://nsuworks.nova.edu/gscis_etd
Part of the Computer Sciences Commons
Share Feedback About This Item
This Dissertation is brought to you by the College of Engineering and Computing at NSUWorks. It has been accepted for inclusion in CEC Theses andDissertations by an authorized administrator of NSUWorks. For more information, please contact [email protected].
NSUWorks CitationCristelia Hinojosa. 2017. Organizational Information Dissemination Within Collaborative Networks Using Digital Communication Tools.Doctoral dissertation. Nova Southeastern University. Retrieved from NSUWorks, College of Engineering and Computing. (996)https://nsuworks.nova.edu/gscis_etd/996.
Organizational Information Dissemination Within Collaborative Networks Using Digital Communication Tools
by
Cristelia Zarate Hinojosa
A dissertation submitted in partial fulfillment of the requirements for the degree of Doctor of Philosophy
in Information Systems
College of Engineering and Computing Nova Southeastern University
2017
We hereby certify that this dissertation, submitted by Cristelia Hinojosa, conforms to acceptable
standards and is fully adequate in scope and quality to fulfill the dissertation requirements
for the degree of Doctor of Philosophy.
_____________________________________________ ________________
Timothy J. Ellis, Ph.D. Date
Chairperson of Dissertation Committee
_____________________________________________ ________________
Steven R.Terrell, Ph.D. Date
Dissertation Committee Member
_____________________________________________ ________________
Simon Cleveland, Ph.D. Date
Dissertation Committee Member
Approved:
_____________________________________________ ________________
Yong X. Tao, Ph.D., P.E., FASME Date
Dean, College of Engineering and Computing
College of Engineering and Computing
Nova Southeastern University
2017
An Abstract of a Dissertation Submitted to Nova Southeastern University in Partial Fulfillment of the Requirements for the Degree of Doctor of Philosophy
Organizational Information Dissemination Within Collaborative Networks
Using Digital Communication Tools
by Cristelia Zarate Hinojosa
March, 2017
While knowledge is one of an organization’s greatest assets, it remains a challenge to facilitate knowledge transfer between people within an organization. Social influence has been studied in its role of facilitating information diffusion, which is necessary for knowledge transfer to occur. Among this research, tie strength, a quantifiable characteristic of a social network that determines the link between two nodes, has been measured to determine the impact of social influence on knowledge transfer and information dissemination within a social network. Current research that explores the impact of social influence on information diffusion has been conducted within public social networks due to the availability of data that can be gathered from public social online network systems, such as Facebook. With the emergence of collaboration technologies that exist in online social network tools being utilized within organizations, there is an opportunity to digitally collect information regarding information dissemination within a collaborative network. This study captured data from an online social network, specifically a unified communication tool, being used within a collaborative social network at a mid-sized South Central corporation. A content analysis of Lync messages for 1,749 connections was performed to quantitatively measure the influence of tie strength on information dissemination within a collaborative social network. The results demonstrated that tie strength had a significant impact on information dissemination using a collaborative system. Multivariate analysis of variance showed that tie strength had the largest impact on information dissemination using the instant messaging modality of a collaboration system.
Acknowledgements
I would like to extend my gratitude to the many individuals that guided me through the doctoral process and made this journey possible. The dissertation endeavor has been a rewarding experience that has tested my ability to persevere. This accomplishment would not have been possible without an extensive support system. I was fortunate to have a strong dissertation committee with a diverse set of expertise. I am deeply appreciative to my advisor Dr. Timothy Ellis for his leadership. His expertise was crucial in helping me develop the research skills necessary to complete this report. He patiently helped me resolve issues by taking time to offer solutions to roadblocks. I would also like to express my gratitude to my dissertation committee Dr. Steven Terrell and Dr. Simon Cleveland. Dr. Terrell’s knowledge of statistics and his textbook were instrumental in guiding me through the research calculations. Dr. Cleveland provided valuable insight as a dissertation committee member and also guided me through the publishing processes by offering his time as a research partner for conference articles. I would like to express a special thank you and sincere gratitude to my mentor and friend Edward Martin of whom I have deep respect. He encouraged me to pursue my doctoral degree and offered unwavering support throughout the entire process. He graciously shared his wisdom to make this a learning experience that I will carry throughout my career. I thank him for sacrificing his time to brainstorm and critique countless drafts of this report. Finally, I would like to thank my family for their endless moral support and encouragement in my various endeavors. My parents David and Alda instilled in me the value of hard work and shaped my work ethic at an early age. I am eternally grateful to my husband Joe David for his encouragement and patience. He consistently supports my decisions and motivates me to pursue my professional and personal goals. His commitment to my success inspires me to push myself to new limits.
iii
Table of Contents
Approval Signature Page ii Abstract iii Acknowledgements iv List of Tables vii List of Figures viii
Chapters
1. Introduction 1
Problem Statement 3
Dissertation Goal 6
Relevance and Significance 7
Barriers and Issues 9
Assumptions, Limitations and Delimitations 10
Definitions of Terms 13
Summary 15
2. Review of the Literature 17
Overview of Topics 17
Justification 19
Knowledge Transfer 20
Knowledge Sharing Within Online Social Networks 23
Collaborative Networks 30
Knowledge Sharing Through Technological Modalities 34
Tie Strength 37
Summary 46
3. Methodology 49
Research Questions and Hypothesis 50
Environment 52
Sample 54
iv
Variables 57
Data Collection 65
Data Aggregation 69
Data Analysis 70
Data Screening and Cleansing 71
Model Selection 73
MANOVA 73
Summary 77
4. Results 78
Introduction 78
Descriptive Data Analysis 79
Data Screening and Cleansing 80
SEM-CFA 84
Model Fit Tests 87
CFA on Adjusted Model 89
Revised Model Fit Indices 92
Hypothesis Revision for MANOVA 93
Further Cleaning 93
Testing MANOVA Assumptions 95
Testing Hypothesis Using MANOVA 96
Summary 99
5. Chapter 5 101
Introduction 101
Conclusions 102
Limitations 105
Implications 107
Recommendations 111
Summary 114
6. Appendix A 119
7. References 120
v
List of Tables
Tables
1. Variables 58
2. Independent Variable Categories 60
3. Sample Size 79
4. Average Messages Per Intimacy Tie Strength 79
5. Average Messages Per Structural Tie Strength 80
6. Average Messages Per Social Tie Strength 80
7. Connections Per Tie Strength 80
8. Correlation Descriptive Statistics 82
9. Pearson Coefficient 83
10. SEM Regression Weights Default Model 85
11. SEM Standardized Regression Weights 86
12. SEM Covariance 86
13. Correlations 87
14. SEM Chi Squared Fit Test 88
15. Absolute Fit Tests 88
16. Incremental Fit Tests 89
17. Parsimony Fit Tests 89
18. SEM Regression Weights Default Model 91
19. SEM Standardized Regression Weights 91
20. Revised Model Fit Tests 92
vi
21. Cronbach Alpha Reliability Statistics 95
22. Cronbach Alpha Summary Item Statistics 95
23. Box’s Test of Equality of Covariance Matrices 95
24. MANOVA Between Subjects Factors 96
25. MANOVA Descriptive Statistics 96
26. MANOVA Multivariate Tests 97
27. MANOVA Tests Between Subjects Effects 98
vii
List of Figures
Figures
1. Relationship Model 56
2. Methodology Outline 71
3. Original SEM Model 84
4. Modified SEM Model 91
1
Chapter 1
Introduction
Information flow is necessary for maximizing profits and performance within an
organization (Durugbo, 2014). Sharing knowledge is essential to an organization’s ability
to gain a competitive advantage (Donate, 2011). An organization that has the ability to
make use of its collective knowledge has a higher probability of increased
innovativeness, efficiency, and effectiveness in the marketplace (Levin & Cross, 2004;
Sighn, 2012). Companies that leverage all information available to them rather than
subsets of data have a competitive edge, as it allows the company to gain more insight
and make better decisions (Sighn, 2012). Knowledge sharing is essential for effective
knowledge management and organizations are increasingly dependent upon effective
knowledge management for gaining a competitive advantage (Chandra, Iyer, & Raman,
2015; Zhang & Jiang, 2015).
Organizational survival is increasingly dependent upon socialization, which is defined
by communication between employees, that is being supported by emerging technology
to make communication more dynamic and transparent (Correia, Medina, Romo, &
Contreras-Espinosa, 2014). An advantage of social interaction is the access to knowledge
that it provides (Hansen, 1999; Rejeb-Khachlouf, Mezghani, & Quelin, 2011; Zhou, Sui,
& Wang, 2010). Research has been conducted to demonstrate that relationships between
individuals are critical to information transfer (Bakshy, Marlow, Rosenn, & Adamic,
2012; Friedkin, 1982; Granovetter, 1973; Levin & Cross, 2004; Wei & Bu, 2014).
2
However, all relationships should not be treated equally, because the strength of a
relationship varies as individuals maintain ties that affect how they interact with other
members of the same network (Luarn & Chiu, 2015).
Tie strength is a relationship factor theorized to moderate the strength of social
influence, and as a result, has been used to measure social influence within a network
(Aral & Walker, 2014; Bakshy et al., 2012). Tie strength, a multidimensional theoretical
construct, is the nature of ties between an individual and other members of the same
network and characterizes the closeness and interaction frequency of a relationship
between two people (Granovetter, 1973). Understanding relational ties can assist in more
efficient dissemination of information (Luarn & Chiu, 2015). Granovetter proposed that
tie strength can be measured by evaluating a combination of four dimensions: amount of
time, emotional intensity, intimacy, and reciprocal services. This quantifiable
characteristic of a social network can be measured to determine the link between nodes,
which are two points in a relationship (Luarn & Chiu, 2015). Original studies that
measured tie strength’s impact on information diffusion relied on observational methods
(Bakshy et al., 2012; Friedkin, 1982; Granovetter, 1973; Hansen, 1999). The availability
of online social networks allows information to be measured quantitatively by collecting
data through digital communication tools.
A collaborative network is formed by members who work together to achieve specific
goals (Miao et al., 2012). While collaborative networks are a type of social network, they
have significantly different characteristics from the public social networks that have been
commonly evaluated when examining the role of tie strength and information diffusion.
Collaborative networks require adequate information flow to overcome organizational
3
complexities (Durugbo, 2014). While recent studies have evolved to quantitatively
measure the influence of tie strength within public social networks, studies are lacking on
measuring tie strength’s impact on information diffusion within a collaborative social
network.
Unlike public social networks, collaborative networks do not typically use public
social media platforms for communication but rather use information and communication
tools (ICT), such as email, videoconferencing, teleconferencing and information
databases, for information flow (Durugbo, 2014). However, due to the similarities of
social media platforms and collaborative tools used within organizations, research
regarding social media platforms and information sharing can be studied to understand
information sharing within a collaborative network. Modern collaborative networks have
begun using the newly emerging unified communication tools (UCT) such as Microsoft
Skype for Business (also referred to as Lync). Lync is reported to be used by nearly 90%
of Fortune 500 companies (McGrath, 2014). Since studies regarding tie strength have
focused on public social networks that use social media platforms (Adali, Sisenda, &
Magdon-Ismail, 2012; Aral & Walker, 2014; Chiu, Chen, Joung, & Chen, 2014; Gilbert,
2012), there is a need to understand information diffusion in a collaborative social
network that uses an online social network collaborative technology.
Problem Statement
There is not a complete understanding of the impact of tie strength on information
dissemination within a collaborative social network. While studies have been conducted
to determine the impact of relationships on information diffusion and knowledge transfer
4
within a public social network by examining social media platforms, research has not
been conducted within a collaborative social network that uses online social networking
tools (Bakshy et al., 2012; Bharati, Zhang, & Chaudhury, 2015; Friedkin, 1982; Levin &
Cross, 2004; Luarn & Chui, 2015; Wei & Bu, 2014; Zhou et al., 2010). Private,
collaborative social networks are subject to organizational constraints, such as
conversations that involve problem solving, that make the knowledge sharing process
different from that of a public social network (Durugbo, 2014; Maio et al., 2012). As a
result, the studies conducted on knowledge sharing and tie strength within a public social
network might not be applicable to that of a collaborative environment. There is a need
to investigate the social influences of utilizing a unified communication tool to share
knowledge within a private collaborative network.
Bakshy et al. (2012) and Steeg and Galstyan (2012) explored social influence on
information diffusion with a public social network. Prior to this research, there were few
experimental studies performed on social influence in information diffusion, as previous
studies relied on observational methods. As Shalizi and Thomas (2011) identified,
monitoring social media by observational methods poses difficulty as individuals tend to
participate in similar activities as their peers. Studying purely observational data makes it
difficult to determine whether the correlation occurs due to similarities or peer behavioral
influence, because the strength of the relationship is being determined by observing the
conversation rather than collecting data to determine tie strength.
Technology can be used to spread information instantaneously as well as overcome
barriers of accessibility, context and relevancy (Correia et al., 2014). The studies of
Bakshy et al. (2012) and Steeg and Galstyan (2012) digitally captured data transmitted
5
within a public social network and measured information diffusion by tracking the
transfer of specific data rather than relying on surveys or interviews. However, these two
studies were performed by collecting data from public social networks, which limited
them to the analysis of messages and posts within a social environment. The current
study was performed within a collaborative network using modern online social network
collaboration technology that supports the knowledge transfer process by disseminating
information. Information dissemination was measured by tracking the dissemination of
specific information via a collaboration tool within an organization.
Aral and Walker (2014) leveraged the work of Bakshy et al. (2012) by using a
statistical method to investigate how social influence within a network impacts sharing
information relative to product adoption. The study also utilized Facebook as the avenue
for testing the effect that tie strength and structural embeddedness have on influence.
Aral and Walker’s and Bakshy et al. research used statistical methods to validate if social
influence is a factor of information diffusion within an online social network. The
current study leveraged statistical methods to examine the impact of social influence
within a unified communication tool that was being used within a collaborative network
in a business environment rather than a public social network. By utilizing a
collaborative network within an organization, this study attempted to describe
information dissemination in a corporate environment.
6
Dissertation Goal
The goal of the study was to empirically investigate through hypothesis testing how
the personal characteristics of tie strength influence information dissemination within a
collaborative network in an organization that uses online social network technology.
Data were gathered from an organization utilizing a unified communication tool within
its collaborative network. Statistical methods were utilized to quantitatively capture the
amount of tie strength between individuals. Using the proxies that have been utilized to
measure tie strength within a public social network as a point of departure, the
dimensions of tie strength were modified to accommodate measuring within a
collaborative network. The tie strength dimensions that were captured were used to
determine the amount of influence this social structure had on content sharing. The
research of Bakshy et al. (2012) and Steeg and Galstyan (2012) that investigated the
influence of tie strength on information transfer within a public social network was used
to model the approach.
The objective of this study was to answer the following research questions:
• How does tie strength influence the effects of information dissemination
within a collaborative social network?
• How is the relationship between tie strength and information dissemination
affected by the type of medium being used within the collaborative network?

7
Relevance and Significance
Knowledge within an organization presents value, and investing in methods that
encourage employees to share knowledge allows an organization to gain competitive
advantage by making information readily available to those that require it (Levin &
Cross, 2004). This study contributed to the body of literature concerning social networks,
knowledge sharing and organizational knowledge transfer by leveraging prior research on
social media collaboration to determine if the dimensions of tie strength had an effect on
information diffusion among corporate users of this technology. It also provided proxies
for measuring tie strength within a collaborative social network rather than a public social
network.
Prior to collecting conversations using large scale communication systems,
information about social interaction was collected through observation (Adali et al.,
2012; Hansen, 1999; Marsden & Campbell, 1984; Steffes & Burgee, 2009). However,
statistical analysis of data can prove to be more effective than observation. Large scale
online communication systems are influencing social interaction and capturing
communication within networks (Aral & Walker, 2014; Rejeb et al., 2011). Online social
networks are researched to understand information diffusion. Electronic social networks
allow for mass collaboration (Correia et al., 2014). The rapid increase in the use of digital
social interaction through online social networks has created an avenue for conversations
to be captured digitally, which allows for this data to be statistically measured (Aral &
Walker, 2014). This analysis of social interaction has enabled an increased understanding
about the role of social behavior in information sharing and can result in improved
8
business and social policy. The use of digital social interaction has enabled new methods
for capturing data about social interaction (Bakshy et al., 2012; Rejeb-Khachlouf et al.,
2011; Wei & Bu, 2014). These outlets allow for large scale data experiments and can
help determine the subtle effects of social interaction. Kirschman, and Greenstein (2002),
Roberts (2000), and Boudreau, Loch, Robey, and Straud, (1998) identified specific
collaboration technologies and applications that increase a company’s competitiveness.
Among these applications, groupware type of technology is considered the primary
enabler for dispersed teams to increase knowledge sharing by allowing rapid access to
information (Kirschman, & Greenstein, 2002). Groupware supports communication
using various combinations of audio, video, file transfer and application sharing
(Kirschman, & Greenstein, 2002). This collaborative technology integrates electronic
messaging with screen sharing, meeting support and other applications (Boudreau, Loch,
Robey, & Straud, 1998).
Given the limitations of measuring social influence through observational means, the
availability of statistical data that can be gathered using online social networking digital
communication tools presents an opportunity for empirical research. Collaborative
networks within organizations now have access to large scale online social networking
digital communication tools that can serve as an avenue for sharing information (Aral &
Walker, 2014). Data regarding information sharing can be collected and statistically
analyzed using these digital communication tools to provide a method for understanding
the factors that influence and promote knowledge contribution.
Bakshy et al. (2012), Rejeb-Khachlouf et al. (2011), Wei and Bu (2014), Zhou et al.
(2010), and have examined the effects of social ties on dissemination of information.
9
Friedkin (1982), Granovetter (1973), and Hansen (1999) measured the impact of tie
strength by purely observational means, which relied on the collection of data through
surveys and interviews. Performing a study based on purely observational methods is
less reliable than the current method of quantitative data collection. The new emergence
of online social networking communication systems have created an avenue for
collecting tie strength information digitally and performing a quantitative evaluation of
the effects of tie strength on information dissemination. Gilbert and Karaholios (2009),
Gupte and Eliassi-Rad (2012), Luarn and Chui (2015), Petroczi, Nepusz, and Bazso
(2007), and Wei and Bu (2014) have collected data from public social systems, because
this information is easily gathered through publically available sites such as Facebook.
While these social systems provide data that are beneficial for understanding the
relationship of social ties and information sharing, they are only capturing information
that is disseminated within a social setting. There is a lack of research that uses an online
social network communication system to digitally capture and quantitatively measure the
effect of tie strength on information diffusion within a collaborative social network. The
current study has practical applications, because the analysis can be used by managers to
determine how to structure teams so that knowledge sharing can be facilitated when using
digital communication tools.
Barriers and Issues
Tie strength has not been measured within a collaborative network, so this research
required proxies to be modified to accommodate an organizational environment. Prior to
10
measuring tie strength within a public social network, there were no proxies, categories
that could be used for measurement, that existed for that environment, because tie
strength was measured through observational means. Proxies to measure tie strength
within a public social network were developed by interpreting and modifying the original
measurements introduced by Granovetter (1973). The same approach was taken to
develop proxies to accommodate a social collaborative network. Data were collected
from a live business environment, so the researcher had the need to determine a method
for selecting the appropriate sample group and size. The measurement proxies for each
of the tie strength dimensions required a significant amount of data analysis, since
multiple measurements were used for each dimension.
Assumptions, Limitations and Delimitations
Assumptions
This research did not take into account the factors influencing the use of the
collaboration technology. For example, there are different levels of technological skills
that exist within the organization. The users had various levels of experience with
technology, which may have affected the usage of the system. The software contains
advanced features that further promote information sharing. However, the organization
may not have been making full use of the features available by the technology, so
utilization of the system may have been limited by a user’s inability to make use of the
advanced software features. It was assumed that participants that did not utilize the
system may have had technical difficulties that prevented them from making use of the
11
collaboration technology. Correia et al. (2014) explained that educational level can have
an impact on the usability of the network. The researcher assumed that all of the
meaningful users had the training and technological skills necessary to make use of the
tool. Lync is a web-based system that requires an internet connection, and the researcher
assumed that all of the users had an adequate internet connection and computer system
requirements to be able to adequately use the Lync system. The researcher assumed that
the system was set up correctly to record all data passing through the Lync system and
that there would not be system or network limitations that would limit the researcher’s
ability to capture or keep data. There was an assumption that all meaningful users had a
relationship connection, since they were all part of the same company and were all part of
the Lync user community.
The content of messages and transmission of information exchanged using the instant
messaging modality were able to be analyzed and measured with much more accuracy
than messages within chat rooms or video/conferencing. Within a chat room, it was
assumed that a message posted by one member of a chat room was received and read by
all other members of a chat room. The conversations that took place while using the
video/conferencing feature were not recorded, and it was assumed that each participant
that was attending a video/conference received a relevant message from each other
participant in attendance.
Limitations
The modalities of screen sharing and video conferencing are rich media that allow
high levels of synchronicity and are being used by the current pool of meaningful Lync
users. However, the conversations that took place during video conferencing and screen
12
sharing sessions could not be monitored, because these conversations were not being
recorded by the individual users, nor were their conversation history recorded in the
administrative logs. The use of these tools, including information about frequency and
duration of the conversation, was the only data recorded regarding the video conferencing
and screen sharing modalities, and each instance of utilizing the tool was counted as
information transferred. Future research can determine if information is disseminated
using the modalities of screen sharing and video conferencing by analyzing content.
Information being transferred outside of the system was not being monitored.
Proximity of work space may have caused individuals to resort to higher synchronicity
for their conversations, such as face-to-face conversations. Individuals that possess high
levels of tie strength may prefer phone or in-person conversations, but that information
was not available as a measurement of tie strength for the purposes of this study. It is
likely that two individuals may not use the Lync tool yet still possess strong tie strength
that was not captured during this study. Data were collected from the researcher’s place
of employment, which classified the researcher as an active participant in the study.
Measures were taken to prevent bias. The researcher was not involved in promoting the
software tool once data were being collected, and the researcher’s use of the system was
not included in the study.
Delimitations
All data were collected within one business environment in multiple regions of the
United States, which may have limited the generalizability of the findings. While data
were collected from a single work environment, it did not include a homogeneous
sample, and the sample could have contained extraneous variables, such as education and
13
income. This study did not measure the quality of the knowledge that was passed using
the collaborative system. This study evaluated knowledge sharing within an
organization. Sharing information with external customers and clients is also essential to
a business success, and the collaborative system can be leveraged to provide external
communication. However, this study was purposefully limited to capturing information
within the internal business environment and only considered internal knowledge sharing
within an organization. During the course of the study, the system was not configured to
allow external communication outside of the company network.
Definitions of Terms
• Collaborative network - A collaborative network is an entity whose collaborative
efforts to achieve common or compatible goals are supported by a computer network
(Durugbo, 2014). A collaborative network is a type of social network formed by
members working together to achieve specific goals (Miao et al., 2012). Inter-
organizational collaboration must enable effective communication and knowledge
sharing in order to be successful (Wu & Zhang, 2015).
• Information and Communication Technology (ICT) – ICT is “any technology used to
support information gathering, processing, distribution and use” (Mpofu & Watkins-
Mathys, 2011, p. 184). ICTs assist knowledge creation and diffusion by their ability
to rapidly collect, store and disseminate data (Mpofu & Watkins-Mathys, 2011).
Hendricks (1999) explained that the use of ICT reduces the barriers of knowledge
sharing, such as physical, social and temporal distances between individuals, and

14
improves access to information, therefore, utilizing collaboration technology can
enhance knowledge sharing.
• Information flow - Nonaka (1994) explained that “information is the flow of
messages, while knowledge is created and organized by the flow of information,
anchored on the commitment and beliefs of its holder” (p.15). Information is the flow
of messages and knowledge is created by the flow of information (Agnihotri &
Troutt, 2008).
• Knowledge sharing – Knowledge sharing is the process of delivering information to
provide assistance to and collaborate with others in order to solve problems, develop
ideas, or implement new policies and procedures (Wang & Noe, 2010). Amayah
(2013) explained that knowledge can be shared through face-to-face interactions,
through channels such as technology, formally, or even unconsciously through the act
of conversations and social interactions. In the current study, knowledge sharing was
monitored as it was shared within an online collaborative environment.
• Knowledge transfer - The Shannon and Weaver (1972) model argued that knowledge
transfer and sharing are the transmission of a message from a source to a recipient
within a particular setting. Albino, Garavelli, and Gorgoglione (2004) extended the
Shannon and Weaver model to propose that technology can be used to transmit
information. Organizational knowledge transfer is the process in which people within
organizations exchange and are influenced by the experience of others (Fang, Yang,
& Hsu, 2013).
• Online social network - An online social network is a virtual social community in
which users can contribute messages that can be sent to other users within their online
15
community or displayed in chronological order for others to view. Barker (2015)
explained that an online social network is a “set of personal relationships in
cyberspace where computer-mediated space integrates/facilitates knowledge creation
and sharing and is characterized by groups of people with more or less specific,
complex and common goals, value systems, norms, rules, and a sense of identity
which they want to enhance through electronic communication” (p. 335). The use of
online social technology can increase the availability of useful knowledge in
organizations by promoting knowledge sharing (Gressgard, 2014).
• Tie strength - Granovetter (1973) introduced tie strength as a relationship factor used
to characterize the closeness and interaction frequency of a relationship. This
theoretical construct moderates the strength of social influence within a network (Aral
& Walker, 2014). Tie strength was used in this study to measure the social influence
within the collaborative network that was being monitored.
Summary
Knowledge is an important resource for an organization’s sustainable competitive
advantage (Teece, 1998). When knowledge is used in support of decision making or issue
resolution, a company can compete more effectively and make better decisions (Donate,
2011; Gera, 2012; Mudambi, 2002). The ability to transfer knowledge represents a
source of competitive advantage for organizations (Reagans & McEvily, 2003). In an
attempt to improve performance, organizations are increasingly investing in knowledge
management efforts, which typically involves incorporating technology to allow people
to produce and share user generated content (Bharati, Zhang, & Chaudhury, 2015).
16
Social interactions are essential for promoting knowledge exchange (Bakshy, Marlow,
Rosenn, & Adamic, 2012; Friedkin, 1982; Granovetter, 1973; Levin & Cross, 2004; Wei
& Bu, 2014). Social networking systems promote employee collaborations, and usage of
online social networking communication systems within an organization, such as social
media and collaborative technology, has grown exponentially and is being used for
knowledge management efforts by increasing access to information and experts (Bharati
et al., 2015). As tools for communicating continue to evolve, online social network
communication tools are becoming the new method for sharing knowledge within
organizations (Levy, 2013). Research can take advantage of data that are collected while
communicating within online systems. Tie strength is a social relationship factor that has
been studied to understand information sharing. While most studies have relied on public
social media networking systems, such as Facebook, to collect data about information
sharing in relation to tie strength, there are studies lacking about information shared
within a collaborative environment. This study was conducted within a single
organization, which produced limitations of generalizability but allowed for an
understanding of tie strength within a single collaborative network.
The rest of the paper is structured as follows: a review of the literature is performed to
review previous studies regarding information diffusion within networks and the impact
of tie strength on networks; a discussion is included on the analysis performed on 1749
connections among corporate users of a collaborative social network to monitor the
effects of tie strength on information dissemination; and the paper is concluded with a
discussion of the results and conclusions that resulted from the analysis of data collected
during the study.
17
Chapter 2
Review of the Literature
Overview of Topics
Knowledge sharing within an organization was researched to determine the
importance of sharing knowledge, its benefits, and factors that motivate knowledge
sharing. The body of literature regarding knowledge transfer was reviewed to understand
the effects of knowledge sharing between employees and to identify the measurements
used to quantify knowledge sharing. It was important to research studies regarding
organizational environmental factors that promote knowledge sharing and the motivating
factors for people to participate in knowledge sharing activities. Since knowledge
sharing is a social process, it was important to review the literature concerning social
motivational factors that affect knowledge sharing. Previous studies that explored the
impact of relationships on knowledge sharing were examined.
Collaborative networks are a type of social network and are used to spread
information. The characteristics of social networks were studied to compare the
similarities with collaborative networks. Previous research regarding online social
networks and information dissemination were studied to understand knowledge sharing
within a social network and apply it to a collaborative network.
18
Studies pertaining to public online social networks and collaborative networks were
explored to compare the differences in structure and the information diffusion
complexities within them. Previous research that explained online social networks and
the manner in which information travels through networks was explored to understand
how this knowledge could be applied to a collaborative network. It was important to
review research that explained how to leverage collaborative networks within an
organization to spread information.
Tie strength is used to measure social influence in a network. The literature
concerning tie strength was researched to identify how previous studies explored the
influence of tie strength on knowledge sharing within a network. Studies that measured
the influence of tie strength were reviewed to identify multiple methods of measuring tie
strength proxies.
Since technology is an important part of knowledge sharing, there was a need to
understand the technology available and what research has concluded about the impact of
this technology. The literature was reviewed regarding technology tools used to
disseminate information. It was important to understand how social technology systems
are being used to leverage knowledge management within organizations. Particularly
studies that researched online social networking sites as a knowledge management tool
were studied, since there are numerous studies on the effects of social media. Social
media technology has many of the same characteristics as collaborative technology
except that collaborative technology is limited to a collaborative environment. The use of
collaborative networks was studied to understand how information flows in a
collaborative environment.
19
Justification
This study highlighted the potential and limitations of using collaboration systems for
transferring knowledge within an organization. It explained how an organization could
manage the diffusion of knowledge and use of a collaborative system. The practical
applications of this study can help an organization understand how to leverage tie
strength to gain better utilization of collaborative systems for sharing information.
People are increasingly relying on online social networking systems as sources of
information. Technology is an important part of knowledge management, so technology
systems that support information sharing were studied, including social media platforms.
Social media is rapidly becoming an information source within the United States as
approximately 70 percent of U.S. online users utilize social networking sites (Kim, Lee,
& Elias, 2015). Half of online users in the United States get their news from social
media, so social media is evolving from a networking tool to a major information source
(Kim, Lee, & Elias, 2015). Social media platforms share many characteristics of
collaborative technology systems. Both are virtual environments that allow users to
voluntarily share information via online technology, because they contain features that
allow them to disseminate information.
Organizations are investing in collaborative systems as they understand the
importance of knowledge transfer (Hharati, Zhang, & Chuaudhury, 2015). There are
relationships that exist within an organization that facilitate knowledge sharing. Tie
strength has been used to understand knowledge sharing in a public environment and can
be utilized to understand social relationships within a private collaborative network. It
20
was important to study information sharing in various environments. Since there are
many studies regarding social media in public environments, this was particularly studied
to leverage the research performed on social media platforms and understand how it
relates to information sharing within a collaborative environment.
Inter-organizational knowledge transfer is very useful to an organization to increase
the value of an organization and to create sustainable competitive advantage, but it is
difficult to manage and it has a high failure rate (Fang, Yang, & Hsu, 2013). This study
helps organizations understand how they can leverage systems that are already in place to
transfer knowledge. It offers insight into how organizations can manage relationships
within a company to leverage the use of the systems in which they are investing.
Knowledge Transfer
The people within an organization possess critical knowledge, and there is a need to
motivate these individuals to share their knowledge and make it readily available to those
who require access to it. Including employees’ knowledge in operations adds relevance
to the organization as knowledge sharing improves organizational change and has both
economic and social value (Mura, 2013). However, transferring knowledge between
organizations is complex due to dispersal coordination and high costs (Rejeb-Khachlouf
et al., 2011). Managers continue to experience difficulty leveraging employees’
knowledge (Mura, 2013).
Promoting knowledge transfer has long been a challenge for organizations who rely
on knowledge for decision making (Peng, 2013). An organization’s knowledge creation,
21
innovation, and competitiveness are hindered when employees are not motivated to share
knowledge (Casmir, Lee & Loon 2012). Research of Wang, Clay and Forsgren (2015)
addressed the challenges of transferring knowledge within an organization to allow it to
receive the full benefits of its knowledge resources. While organizations have
implemented knowledge management systems designed to facilitate knowledge transfer
within an organization, these organizations continue to face difficulty motivating
employees to contribute knowledge (Wang et al., 2015).
Roberts (2000) defines knowledge as the productive use of information, and Shannon
and Weaver (1972) explained that human cognition is what translates information into
knowledge. Albino, Garavelli, and Gorgoglione (2004) also explained that human
cognition is required to turn information into knowledge. Using the aforementioned
interpretations, information is turned into knowledge when it is put into practice. Since
data for this study were collected from a live collaborative system, and there was no
confirmation that the information is being put into application, this study measured the
dissemination of information rather than knowledge. The dissemination of information
was monitored to determine if it followed the knowledge processes described by Alavi
and Leidner (2001), which included creation, storage/retrieval, transfer, and application.
Knowledge creation involves the creation of new content or the replacement of exiting
content. Knowledge storage/retrieval refers to the information that is stored within the
organization and available for retrieval by others. Knowledge transfer is the process of
distributing knowledge, whether it be between individuals, groups or across
organizations. Knowledge application is the process of putting knowledge into practice.
22
For the current study, the collaboration system was used as a technology mechanism to
facilitate the transfer of information.
Casmir et al. (2012) performed an empirical quantitative correlation study to
investigate the relationship between the perceived cost of sharing knowledge by
examining if there was a positive relationship between knowledge sharing and
commitment to an organization or trust in colleagues. A survey was conducted on 496
employees across 15 organizations to determine if the perceived costs of knowledge
sharing are lessened when there is organizational commitment and trust. A knowledge
management sharing scale developed by Van den Hoof and de Ridder (2004) was
modified for determining the cost of sharing knowledge, and statistical results were
generated using a five point Likert scale. The researchers determined that affective
commitment is positively related to knowledge sharing where high affective trust is
present (r= 0.11, p < 0.05). The study concluded that if employees are committed to an
organization and trust their colleagues, the perceived costs of sharing knowledge are
reduced. Employees are more willing to share when there are high levels of trust with
co-workers or a commitment to an organization. Organizations that create a collaborative
culture are conducive to knowledge sharing.
Mura (2013) conducted a quantitative correlation study to develop a model to
understand the relationship of employees participating in knowledge sharing activities
and the value added to organizational operations. A questionnaire, developed from
previous scales, and a series of face-to-face interviews were conducted among 198
employees from four Italian Hospice and Palliative Care organizations using age, gender,
and professional experience as control variables. Significant results included that sharing
23
best practices has a positive relationship with promotion and implementation of new
ideas as shown by a statistical significance of (B=0.346, p<0.001) and (B=0.193,
p<0.001), a positive relationship exists between sharing mistakes and idea
implementation (B=0.340, p<0.001), and there is a negative relationship between
relational social capital and sharing of best practices (B=-0.205, p< 0.05). The study
concluded that individuals who have increased relational social capital might perceive the
sharing of best practices or mistakes as negative due to the perception that decision
making is manipulated as individuals are persuaded to incorporate new ideas. Knowledge
sharing positively affects the sharer’s innovativeness by promoting the implementation of
new ideas. Sharing best practices and mistakes promotes innovativeness. Individual
perceptions of social capital have a role in knowledge sharing benefits. People that lack
self-interest are motivated to share knowledge by acting in the best interest of an
organization. The act of being innovative disrupts the status quo and could affect social
bonds. As a result, strong ties may lead to conformity as people adapt to others’
expectations to gain support for their actions.
Knowledge Sharing Within Online Social Networks
Knowledge sharing is a social process that is affected by social motivational factors
(Lin & Lo, 2015). Interpersonal relations and the resources that are generated through
social networks are vital to inter-firm knowledge transfer (Hansen, 1999). Social
cohesion motivates individuals to invest in knowledge sharing efforts (Rejeb-Khachlouf,
et al., 2011). Personal networks are composed of people with whom a person maintains
24
contact, including partners, customers, suppliers, and family members (Rejeb-Khachlouf
et al., 2011). Public social networks focus on social interactions and social information
exchange (Maio et al., 2012). The structural properties of a social network are exhibited
in an online network (Chui, Chen, Joung, & Chen, 2014). Recent studies regarding
information distribution within social networks have focused on public social networks,
which commonly use social media platforms such as Facebook (Bakshy et al., 2012;
Luarn & Chui, 2015; Rejeb-Khachlouf et al., 2011). Social media is increasingly being
used within organizations for knowledge management (Bughin et al., 2012). Social
media technology creates an avenue for user-generated content to be created and shared
to a wide audience (O’Reily, 2007). Kane and Fichman (2009) indicated that social
media is an effective tool for providing reusable knowledge through user-generated
content.
An individual’s learned knowledge is subject to external relationships. Casmir et al.
(2012) argued that knowledge sharing is facilitated by organizations that promote trust.
Social influence is a determining factor of what people adopt and when they adopt it (Lin
& Lo, 2015). Lin and Lo identified that there remains a need to investigate how to
motivate employees to share knowledge, as employees within an organization possess
critical knowledge that is not always easily available to those that need access. While the
motivational factors of knowledge sharing have been widely researched, gaps exist in
taking into consideration the relationship between a person’s position in a social network
and the degree in which a person controls information (Lin & Lo, 2015). A person’s
position in a network can be a factor that affects knowledge sharing, because someone
with a higher position can have greater influence on subordinates to share information.

25
Saito, Kimura, and Motoda (2013) performed grounded theory research to revise an
information diffusion model to determine how social networks are affecting information
diffusion within a social network that accounts for interactions between people. This
research was relevant to the literature review, because the current topic studied
information diffusion with a network in which subjects were interacting. The researchers
collected data observationally in a retrospective setting and searched for change patters
that increased the likelihood of information diffusion sequences. Two social network
information diffusion models were considered: the Asynchronous Independent Cascade
(AsIC) model and the Value Weighted Voter Model (VwV). An iterative search
algorithm was developed to identify the patterns of change in information diffusion, and
when tested, showed an increased accuracy and enhanced computation time compared to
previous models. The proposed model was able to detect and estimate hot span and
diffusion probability and worked for both the AsIC and VwV diffusion models. It was
concluded that the proposed algorithm was robust enough to identify correct change
patterns.
Barker (2015) performed a study in which the use of a discussion forum was tracked
to determine its role in knowledge creation and sharing. A quantitative content analysis
was performed by tracking and critically examining the content, text and messages within
a website’s online discussion forum to identify themes and interpret codes. Online
discussion forums are a type of online social network. The study expanded a previous
theoretical framework that was developed to evaluate knowledge management in a virtual
community based on content, communication, and the consumer. Prior to this study,
there was a lack of research on the potential impact that discussion forums used in social
26
networking have on knowledge creation. The research proposed a theoretical framework
based on the components of content, communication, and consumer for measuring
knowledge management within an online discussion forum. A single website with an
online discussion forum was analyzed for the study, because it provided an observable
and measurable unit. The online threads posted within the forum were categorized as
individual views, statements to stimulate debate or feedback, questions to ask opinions,
and questions to obtain information. A coding system was developed to categorize the
data. Non-probability convenience sampling was used, since the website with the
discussion forum was open to all and was conveniently accessible. A theoretical
framework was developed, and the discussion forum was monitored over two
timeframes. There were 28,803 registered users that were monitored during the first
timeframe and 40,803 users monitored during the second timeframe. The content was
evaluated by counting the number of links, monitoring the content and messages,
counting the number of replies, and monitoring feedback. The content, communication,
and consumer criteria were allocated an equal weight and scored based on the content of
the discussion forum. It was discovered that within an online discussion forum,
knowledge creation and sharing is best supported when it is being managed by an expert
within the organization and the discussion forum has expert intervention.
Sayogo and Gil-Garcia (2014) addressed the difficulty of instituting inter-
organizational collaboration and information sharing by conducting a quantitative study
to explore and test previously identified success factors. Prior research used case-based
methodology to identify enablers and success factors for inter-organizational information
sharing. Existing studies were used to determine the factors that have been previously
27
identified as influencing the success of inter-organizational information sharing: political
and policy determinants, organizational and managerial determinants, political and
organizational determinants, and technological determinants. These previous factors
were used to develop the hypotheses for the study. A national survey was conducted to
collect data and address questions pertaining to factors that contribute to the success of
inter-organizational information sharing. A random-sampled dataset included 173
responses, but after data cleansing, the dataset was reduced to 158 responses. Cronbach
Alpha was used to measure the reliability of the framework, and a seven point scale was
used to collect data. The hypotheses were tested using multivariate regression analysis.
Five statistical models were tested to identify the four factors that were key determinants.
The study concluded that the four key factors of inter-organizational knowledge factors
pertained to project managers, financial resources, interoperable standards, and
compatible technical infrastructure.
Rejeb-Khachlouf et al. (2011) performed a study to prove the importance of networks
on knowledge transfer. Networks are instrumental for knowledge, information, social
influence and personal support. Rejeb-Khachlouf et al. identified that the effects of
social networks on knowledge transfer was an area that needed to be examined. This
prompted a study to determine what mechanisms within a personal network influence
knowledge transfer within a network. Rejeb-Khachlouf et al. study concluded that
absorptive capacity was the primary mechanism in which personal networks influence
inter-firm knowledge transfer. Network size is the number of people in which an
individual maintains a direct relation. An increased number of contacts in a personal
network increases the possibility of receiving diversified knowledge. Network density is
28
the number of current contacts between network members divided by the number of
possible mutual contacts. Dense networks contribute to faster diffusion of information
between members of the network (Rejeb-Khachlouf et al., 2011).
Wang et al. (2015) recently conducted a study to investigate the effects of intrinsic and
external motivation on knowledge contribution. While acknowledging theories that
suggest social factors can only encourage knowledge contribution through motivation
rather than directly cause knowledge contribution, they discovered a need to examine the
effects of motivation on specific types of knowledge contribution tasks. A theoretical
model was developed, and the study concluded that intrinsic motivation is positively
associated with knowledge contribution that is more difficult in nature, such as
unstructured content.
Bharati et al. (2015) studied the impact of social media on organizational knowledge
quality based on social capital and resource exchange. Prior to this study, research was
lacking on social media’s contribution to enhancing organizational knowledge.
Technology systems are being used within organizations to facilitate knowledge transfer,
and this study hypothesized that a higher level of organizational social media assimilation
is associated with a higher level of organizational emphasis on knowledge management.
The research tested a theoretically derived model against real world data by conducting a
web based survey on employees that were familiar with utilizing social media
technologies for supporting knowledge management within a single company that used
social media technologies such as web services, blogs, LinkedIn and Facebook. The
sample was generated by screening 725 individuals according to those that proved most
representative of the organization, which narrowed the participants to 283 information
29
systems professionals and managers. The survey instrument was a seven point Likert
scale developed from previous literature. The research used formative constructs and a
previous approach of measuring structural capital with the Guttman scale based on
quality and time spent communicating. The study refocused and extended the Tsai and
Ghoshal framework to include knowledge management, knowledge quality and social
media. The model was evaluated using partial least squares, which was appropriate for
exploratory research since this was a phenomenological study. Reliability was measured
using Conrbach’s alpha and determined that the instrument would provide an acceptable
measurement for the study. The model allowed for 38% of the variance in organizational
emphasis on knowledge management. The authors argued that social media positively
affects social capital and organizational knowledge management, which extends the
quality of organizational knowledge. The hypothesis was supported, and there was a
significant and positive impact on the organizational emphasis of knowledge
management on knowledge quality (B=0.74, p< 0.001) and a positive and significant
relationship between organizational social media assimilation and organizational
emphasis on knowledge management (B=0.12, p<0.01). The study concluded that social
media does promote organizational efforts in knowledge management and leads to higher
levels of organizational knowledge quality, and there is a significant relationship between
an organization’s emphasis on knowledge and knowledge quality. The study proved that
social media usage can facilitate organizational knowledge management efforts by
showing a positive link from organizational social media assimilation to organizational
emphasis on knowledge management. It showed that social media usage facilitates social
interactions, which promotes increased communication between the organization and
30
produces higher levels of social capital. The study was limited by quantitative data
collected based on individual perceptions gathered during a survey.
Relationships are an influencing factor of knowledge sharing. The similarities between
a public social and a collaborative network can allow for research concerning knowledge
sharing to be applied to both networks. Research regarding relationships within a social
network can be utilized to understand the similarities of knowledge sharing within an
organizational network. Since tie strength is a relationship factor, it can be used to
understand the knowledge sharing process within a network. The proxies used to
determine tie strength within a social network can be measured within an organizational
network.
Collaborative Networks
Collaborative networks can be on the web or within the private sector, but because
they are included in organizational networks, they are subject to organizational
constraints. There are drastic differences in how knowledge flows in a collaborative
network as opposed to a public social network due to the random factors involved in
human decision making (Maio et al., 2012). Public social networks focus on social
interactions and social information exchange, and information is first derived at a
particular source and then spread by members of the network forwarding activities (Maio
et al., 2012). Maio et al. concluded that in a public social network, the information begins
to lose its value at the same time as the forwarding activities begin to diminish. In
contrast, information flow in a collaborative network is driven by specific tasks and the
31
expertise of the members assigned to the network as tasks in collaborative networks
travel along long sequences of steps before being completed (Maio et al., 2012).
While the use of collaboration tools within an organization could provide many
benefits, Dulipovici and Vieru, (2015) identified that misconceptions about benefits of
these tools are keeping organizations from implementing them. Statistically measuring
the motivators can facilitate an understanding of the benefits of utilizing collaboration
tools within an organization.
Durugbo (2014) performed a comparative case study on six industrial firms to
investigate the flow of information within a collaborative networked organization. The
study was conducted through semi structured interviews based on interpretivism
epistemology to capture information about knowledge flow and people’s willingness to
share knowledge. The interviews were conducted during a six-month period, and the
notes were analyzed, categorized, and coded based on grounded theory procedures. It was
concluded that the flow of information could be enhanced within an industrial firm when
procedures and policies are prioritized. Collaborative networks are enhanced with the
information flowing through industrial firms. Information is built from relationships
which allow firms to collaborate.
Miao et al. (2012) performed grounded theory research to develop a network model
and a routing model based on real world collaborative networks from Information
Technology communities within the public and private industries. These models
simulated collaborative networks with specific structural constraints and analyzed how
information flows through a collaborative network. While many models existed for
social networks, there was a need to develop models specifically for task related
32
information flow within a collaborative network. Since collaborative networks are subject
to organizational constraints, Maio et al.’s study involved the development of a routing
model that emulates task driven information flow in order to determine how information
can be routed efficiently for different types of collaborative networks. The researchers
tested the power-law hypothesis on the degree of distributions of the collaborative
network. A clustering coefficient was used to measure how closely the nodes were
connected, and statistical calculations were performed on the node distributions to
calculate various probabilities. Ten collaborative networks were generated with 10 to 100
domains, each routed the same set of 100,000 tasks. The node degree in the collaborative
networks followed a truncated power-law distribution. It was concluded that members of
collaborative networks make decisions based on factors such as availability of neighbors
and priority of tasks.
Levy (2013) researched the utilization of social media within an organization to
enable knowledge management. The research was conducted as an empirical study in
which data were gathered from 34 organizations and analyzed both quantitatively and
qualitatively. The study considered the various levels of social media implementation
that are occurring within businesses by examining organizations of various sizes with
various levels of knowledge management processes, including companies with formal
process to those with no existing knowledge management processes. Implementing
social media is a process that requires collaboration. The act of moving from traditional
knowledge management concepts to social media is a large step, and therefore the
researcher suggested a four stage implementation. The hypotheses which suggested that
social media implementation conforms to formal knowledge management activities was
33
supported. Organizations that did not have a formal knowledge management process
were not able to fully implement social media into the organization. It was found that
social media complemented traditional knowledge management tools rather than
replacing them. The research discovered that organizations implemented different levels
or no social media, for visibility purposes only, for functional services, or a full
implementation. This finding proved that social media can be implemented gradually
within an organization, and the level of implementation can vary according to the purpose
the organization is attempting to achieve. Organizations can utilize partial social media
implementation, and therefore, do not need to wait for a full implementation to receive
knowledge management benefits. The results suggested a four stage architecture for
gradually implementing social media within an organization as part of the knowledge
management framework in order to receive knowledge management benefits. Rather than
previous studies that considered a yes or no approach to inserting social media within an
organization, this study suggested that social media can be implemented at various levels
and allow an organization to achieve various levels of benefits to their knowledge
management process.
Sung, Na, Lee and Chang (2015) conducted structured research on performance
analysis based upon ICT collaboration. A survey was used to collect data within the
automobile industry that included one parent company and their partner companies.
Survey instruments and models developed in previous research were used to conduct the
study. Three survey items were used to measure the concept of corporate performance,
which involved testing if competitiveness, satisfaction of trading and sales increased after
collaboration. The analysis concluded that sharing range of collaborative information
34
was low before the introduction of an IT collaboration system. Overall performance
improved 10.2% through the incorporation of the collaborative system.
Since it has been concluded that relationships play an important role in knowledge
sharing, a social network can provide an avenue for monitoring the knowledge transfer
process. An online social network platform, such as Facebook, provides an environment
for digitally collecting information regarding social networks. Since there are vast
differences between social networks and collaborative networks, the studies that examine
knowledge sharing should be replicated within each type of network. The process of how
research is conducted within a social public network can be applied to collaborative
social networks that also utilize technology platforms for transferring information.
Knowledge Sharing Through Technological Modalities
Literature was reviewed regarding the various modalities of a collaborative system to
determine how previous research has collected and analyzed data, both quantitatively and
qualitatively, within a collaborative system. The current study used preferred modality as
a moderating variable, and this literature review enabled an understanding of previous
conclusions regarding the usage of the various modalities of a collaborative system.
Studies were reviewed in which researchers evaluated the use of different modalities
within organizational collaborative settings. Particularly, the collection of data within
video conferencing can prove difficult to analyze, so understanding previous researchers’
methods for collecting this modality was evaluated.
35
Biehl, Avrahami, and Dunnigan (2015) performed a lab study to compare the use of
different video conferencing technology in a collaborative setting to address the lack of
research on the impact of video technology on actual collaborative engagement. Usage of
video tools can change collaborative behavior by allowing more interactions among
distant workers. Previous studies concluded that embodied devices, such as video, lessens
the known barriers that exist in distributed collaboration. The study consisted of groups
of three people monitored while evaluating and interacting in a sales presentation. Two
of the participants attended the presentation in person, and the third participant attended
remotely using a video call. There were three different scenarios in which different types
of video conferencing devices and positioning were used to determine which video
conference technology was the most effective. The participants were recruited by various
advertisements that offered an incentive for participation. A total of 27 participants were
included in the study. Pre and post study questionnaires were given to the participants in
which they answered questions regarding their familiarity with video tools and
commented on the challenges of working as a group using mediated communication. The
video was analyzed by recording the session and coding gestures and manipulations of
devices and artifacts. The video and audio recordings were hand-coded. The researchers
compared the behavior and attitude from the remote and face-to-face participants. The
study concluded that remote participants’ participation was significantly less than those
attending face-to-face (t(25)=2.184; p=0.039). This was consistent with the information
collected from the questionnaires in which remote participants rated their contribution
lower than those that attended in person. Despite the different video technology that was
used that offered advantages such as adjustment of camera point of view, the remote
36
participants contributed less and rated their experience less than those participants who
attended face-to-face.
Scholl and McCarthy (2006) performed a case study to compare the modalities of
chatting, video and audio. Data were collected regarding the usage patterns of each of
the modalities to determine if chat was an effective communication tool even when
media-rich modalities such as audio and video were readily available. Two separate case
studies, one in a research setting and one in an educational setting, were administered
within communication groups in a University setting in which users had the modalities of
video, audio, and chat readily available to them through conferencing technology.
Qualitative data were gathered through interviews and observations over a period of six
months. In order to monitor private video conversations that are not visible to a third
party not involved in the video conference, the researcher performed “spot checks” that
involved spontaneously entering the conference, and the interactions were taped and
recorded. Quantitative data were gathered from the database that contained the system
usage information. A total of 66 users, who were unaware that the study regarding usage
was being conducted, were observed in the study. Personal information about the users
were gathered from an e-mail survey. It was concluded that chat supplemented with
video provided advantages among internal communication. The subjects reported that
audio was preferred for formal meetings, but not when participants were in close physical
proximity and could be more easily contacted in person. Users reported the advantage of
using the chat feature was because it provided tractability of the discussion. Users also
felt that chat was less intrusive than the modalities of audio and video, therefore less
disturbing. The main usage reported for chat was for informal communication. Video
37
and audio were typically initiated by a request within the chat function. Quantitative data
of the usage logs complimented the qualitative data collected during the interviews. Data
revealed that the preference for chat usage was significant (Z=-3.95, P<0001). Of the 67
chat messages sent in one day, the top 10 users accounted for 60 of the messages, and a
single active user accounted for 21 messages. Previous studies have indicated that
workplace chat usage is typically below one message per active user per day. The second
case study was conducted in which students were enrolled in a course and the
collaboration tool was an option for receiving remote assistance on assignments rather
than physically interacting with instructors to ask questions. The usage of the online
system was not mandatory but was encouraged. Instructors reported the benefit of using
the remote tool was that it allowed them to be more productive by continuing to work on
other tasks and only interact with students when requested. The students were asked to
complete a questionnaire that used a 7 point Likert scale to rate their experience with the
various modalities of the communication tool. The study concluded that there was not a
significant bias for chat when asked to choose between audio and chat (χ2(1)=3.2,
p=0.7). The users however did rate chat more useful than audio in both public and
private communications (F(1,79)=48, p<0.001).
Tie Strength
Granovetter (1973) was the originator of the tie strength theory, which included four
dimensions to define the strength of two people’s relationship. Tie strength is defined by
Granovetter as “a combination of the amount of time, emotional intensity, intimacy, and
38
reciprocal services devoted to a relationship” (p. 1361). Tie strength is a relationship
factor that has been used to measure social influence within a network (Aral & Walker,
2014; Bakshy et al., 2012). Tie strength characterizes the closeness and interaction
frequency of a relationship between two people (Granovetter, 1973). It has often been
assumed that relationships within a network are equal, but that fails to consider that
people maintain relationships with varying tie strength (Chui et al., 2014). The role of ties
within a network varies depending on the network’s strength, and different tie strengths
affect the social structure differently (Chui et al., 2014). Individuals with strong ties have
greater similarities and share more intimate information, so treating all relationships as
equal degrades predictive modeling (Luarn & Chui, 2015). Verifying the frequency and
duration of interactions allows a better method of determining tie strength (Luarn & Chiu,
2015).
Strong ties are present among relatives, friends, and individuals that are familiar with
and understand each other well (Granovetter, 1973). People with strong ties have similar
knowledge structures, values, and experiences (Granovetter, 1973). Weak ties are
constructed of individuals that have little in common and maintain geographical or
sociocultural distance, which causes lessened shared understanding (Granovetter, 1973).
Hansen (1999) explained that strong ties ensure the transfer of complex knowledge, and
weak ties can support simple knowledge transfer.
Zhou et al. (2010) performed causal modeling research using structural equation
modeling to investigate the role of social ties in the interpersonal knowledge transfer
process by distinguishing between instrumental and expressive ties and their effects on
knowledge transfer. Zhou et al. discovered the importance of utilizing appropriate ties
39
when planning knowledge sharing communities, because a trusted environment promotes
knowledge sharing. The researchers used Cumming’s (2004) scale to measure general
and explicit knowledge transfer, and tacit knowledge was measured using a scale adopted
from Lin (2007). A total of 450 responses from a survey questionnaire were collected.
The researchers created a research model with seven constructs that could each be
measured with multiple items that were adapted from literature, and structural equation
modeling (SEM) was used to examine the research model. The results demonstrated that
participation has a significant effect on subjective norm as seen by γ=0.81, p<0.001, and
subjective norm was shown to have an effect on behavioral intention. However, when
both social identity and group norm exist in the model, the effects on behavior intention
to share knowledge are not significant.
Luarn and Chiu (2015) performed a correlation study to develop a predictive model to
quantitatively measure tie strength within social network sites by examining user profile
similarities and user interactions of passing data on Facebook as well as user responses to
an online questionnaire. The study was conducted in a controlled lab environment on 145
undergraduates that were recruited specifically for the study. The participants were asked
to answer questions regarding their friends through questionnaires developed according
to theories from Granovetter (1973) and Marsden and Campbell (1984). There was a
program developed to collect the interactions from Facebook, but certain data had to be
eliminated due to privacy concerns. Subjective tie strength was measured from the online
questionnaire while objective tie strength was perceived from the dataset that included
the participant’s interaction records to determine the strength of the friendships within
Facebook. Previous studies focused specifically on relationships and did not consider
40
interactions when measuring tie strength. A dataset of 6,477 ties was evaluated. The
model was able to distinguish between strong and weak ties with over 50% accuracy.
The findings concluded that friends that had higher levels of intimacy, as measured by
the number of private messages sent to each other, were considered to have stronger ties.
When the level of intimacy is high, users tend to choose a communication method other
than private messages. There was a negative correlation in the amount of time, which is
the frequency and duration of contact, and job regression, which indicated that amount of
time is not a main variable to predict tie strength on a social media site. Emotional
intensity had the strongest effect of any of the interaction variables. Emotional intensity
best reflects tie strength. Emotional intensity variables had stronger effects than other
interaction variables. The measurements of tie strength that were developed based on
offline relationships cannot fully explain online relationships.
Kim, Lee, and Elias (2015) conducted a study to identify the personal and
environmental factors, including tie strength, that affect information sharing within social
networking sites. The goal of the study was to improve understanding of information
sharing behaviors and the characteristics of information shared within social networking
sites. The researchers hypothesized that perceived technology and information self-
efficacy and social outcome expectation are positively associated with information
sharing behaviors on social networking sites. An online survey was conducted on
university students within a single class at a public university to produce a homogeneous
sample that would reduce the likelihood of extraneous variables, such as age, education,
and income. The study included 308 participants with an average age of 19.5 years and
various ethnicities. The students participated in the study in exchange for extra credit.
41
Data concerning information sharing and social ties were collected by asking participants
questions about frequency of behavior and measured using a seven-point Likert scale
adopted from Kankanhalli et al. (2005). The reliability of the scale was tested using
Cronbach’s Alpha. Hierarchical regression was utilized to test the hypothesis while
controlling the factors regarding the use of the social networking systems. The survey
was used to question the participants about the frequency of their information sharing
behaviors and measured several independent variables, such as perceptions of technology
and information self-efficacy, positive social outcome expectations, and sharing
enjoyment. It was determined that technology self-efficacy did not significantly influence
information sharing behaviors on social networking sites (B=-0.075, p>0.05), but there
was a positive influence of information self-efficacy on information sharing behaviors
(B=0.166, p<0.05). Personal factors were found to be significant predictors of sharing
activities, but the size of a social network is not significantly related to information
sharing behaviors (B=-0.08, p>0.05). The study concluded that there are environmental
factors of the social networking sites, such as the size of the network and strength of ties
that affect information sharing. Social network users that are more confident in giving
their opinions are more likely to share information on social networking sites, which
explains that users need to feel knowledgeable and competent about a specific piece of
information are more willing to share this data. Information sharing can be increased by
stimulating discussions and writing about a topic using a social networking site. People
with strong ties are most likely to share the same information, so weak ties in networks
provide the opportunity to share novel information. The conclusions support
42
Granovetter’s argument that weak ties are better suited for disseminating new
information or ideas compared to stronger ties.
Tie Strength and Information Diffusion
Bakshy et al. (2012) utilized an experimental method to explore social media’s role in
information diffusion by investigating the use of a social digital collaboration tool and the
influence of strong and weak ties. Using Facebook as a platform, the researchers
randomized whether participants were shown information about their friends’ sharing
behavior and measured how this tie strength influenced their likelihood of sharing a
Uniform Resource Locator (URL) with others. They discovered that subjects who
receive signals about friends’ sharing behaviors have a higher probability of sharing
information than those that are not exposed to this information.
Similar to Bakshy et al. (2012), Aral and Walker (2014) conducted an experiment by
randomizing data within a networked environment and performing statistical analysis.
Over a period of 44 days, 7,730 Facebook users were selected as subjects. Throughout
the duration of this study, a total of 41,686 randomized automated messages regarding
film industry preferences were delivered to 1.3 million peers of 7,730 Facebook users.
Making use of automated notifications, the researchers randomly delivered information to
random peers concerning the senders’ personal attributes and use of the application. In
order to make tie strength more measurable than previous studies, this research controlled
the channel of influence by using randomized recipient selection and by including the
same content within each message. The tie strength measures collected were age, gender,
relationship status, home town, current town, college attendance, affiliations, Facebook
pages, Facebook group membership, and tagged appearance in photos.
43
The researchers utilized the Cox proportional hazard model to determine the impact of
social embeddedness and multiple measures of tie strength on product adoption. The Cox
proportional hazard modeling estimates the hazards of peer adoption. Multiple
coefficients were included to capture and measure the impact of influence of variables,
including tendency of peers to adopt a product. The results were 967 peer adoptions and
a 13% increase in product adoption. The study concluded that people are more
influenced by peers with whom they are embedded. The individual effects of each
measure of tie strength upon influence was identified. Some statistically significant
findings included were that attending the same college results in a 1355% increase in
influence, and living in the same current town results in 622% more influence.
Tie Strength Measurements
Research concerning tie strength continues to use the original dimensions proposed by
Granovetter (1973), which consist of four dimensions to define the strength of two
people’s relationship: amount of time, intimacy, emotional intensity, and reciprocal
services. While Granovetter proposed the seminal theory defining tie strength that has
been used for decades, he indicated in his study that the empirical measurement methods
for measuring tie strength were to be determined by future studies. Researchers have
interpreted these dimensions throughout the years and have developed various models to
measure tie strength. Adali et al. (2012), Chiu, Chen, Joung, and Chen (2014), Gilbert
and Karaholios (2009), Gupte and Eliassi-Rad (2012), He, Zhang, and Ji (2012), Luarn
and Chui (2013), Marsden and Campbell (1984), Petroczi et al. (2007), and Steffes and
Burgee (2009) have conducted studies that adopt the criteria of Granovetter (1973) to
construct models for measuring the various dimension of tie strength. Granovetter’s
44
work has been adapted, and current literature now includes a total of seven dimensions
for examining tie strength: duration and frequency of contact, intimacy, intensity,
emotional support, reciprocal services, structural variables, and social distance (Gilbert,
2012).
Each dimension can be evaluated and used to calculate the total strength of a tie.
Duration and frequency of contact measures the amount of time spent within a tie
(Granovetter, 1973). Intimacy refers to the affection felt between two entities which
creates reliance and security and is believed to promote willingness to talk openly and
provide recognition and support (Mardsen & Campbell, 1984). Emotional support is
defined as willingness to convey messages of emotional concern such as understanding,
caring and empathy (Gilbert, 2012). Reciprocal services refer to the different interactions
or specific services on communication such as sharing information, providing resources
or giving access to information circulating within a network (Krackhardt, 1992).
Structural variables include shared affiliation, overlap of social circles and social
homogeneity (Luarn & Chui, 2015). Social distance is the difference in socioeconomic
status, such as education level, political affiliation, race and gender (Mardsen &
Campbell, 1984). Social similarity in terms of background characteristics such as race,
sex and level of education is an indicator of common knowledge (Reagans & McEvily,
2003). Common knowledge has a positive effect on knowledge transfer, because it is
easier for a person to gain knowledge in areas in which they are familiar.
While the original measurement models assumed physical interaction as the
definition stated, the new models for measuring public social networks consider social
media sites and assume that interaction takes place online (Aral & Walker, 2014; Bakshy
45
et al., 2012; Gupte & Eliassi-Rad, 2012; He et al., 2012). As such, these models have
focused on measuring tie strength through characteristics that can be captured through
social media platforms. Although studies do not exist that provide a model for measuring
tie strength in a collaborative network, measurements of tie strength within a public
network will be analyzed to determine how the models can be applied to a collaborative
network.
Chui et al. (2014) performed a correlation study to develop a model for quantitatively
measuring the role of tie strength within an online social network by using a crawling
agent to digitally collect data within an online blog. Data were collected from an online
blog for seven months to monitor 80,617 blogs. An online blog network was chosen
because it is interactive and allows participants to leave comments or make
recommendations. Relationships were established between participants by investigating
interactions and common interests within the social network. Information about
interactions within the blog were collected online for analysis. Tie strength was
quantified as the frequency of interactions between two actors, which was the number of
comments a user posted for another user. The “friends” list within the blog was also
considered, and if one actor considered another a “friend” it was categorized as a
friendship relationship. The study determined that the structural properties of a social
network are exhibited in an online network, and tie strength may be the cause of certain
network behavior. Within an online social network, there is a strong association between
tie strength and reciprocity and tie strength and transitivity.
Since tie strength identifies the level of intensity of a social relationship, it has been
widely used to examine the effects of social influences on knowledge transfer. Rejeb-
46
Khachlouf et al. (2011) argued that more investigation was needed about how social
interactions affected knowledge transfer between people. Houghton and Joinson (2010)
determined that tie strength affects the nature and frequency of online interactions. Zhou
et al. (2010) explored the role of social tie content in the knowledge transfer process and
determined that knowledge transfer among co-workers can be enhanced by strengthening
social ties. Levin and Cross (2004) studied whether strong or weak ties provide more
useful knowledge and validated the importance of relational ties for knowledge transfer.
Summary
Knowledge provides economic value to an organization. Companies are investing in
methods for transferring information between members of their organizational network in
order to retain knowledge and increase their competitive advantage. Previous literature
provided an increased understanding about the factors that contribute to knowledge
sharing within an organization. Casmir et al. (2012) concluded that a collaborative culture
within an organization promotes knowledge sharing. Mura (2013) determined that trust
within an organization produces an environment in which knowledge sharing is
conducive. These findings support the idea that knowledge sharing is a social process
that requires social interactions between knowledge contributors and receivers. The
literature validates the relevance of further observation of social factors that contribute to
knowledge sharing in an organizational environment.
Reviewing literature regarding relationship factors within an organization provided an
understanding of how to produce a more collaborative environment in which knowledge
sharing can be increased. Lin and Lo (2015) validated that knowledge sharing is a social
47
process that is affected by social motivational factors. Tie strength is a relationship factor
that has been studied within public social networks to understand the role of information
diffusion within a network. Luarn and Chiu (2015) developed a predictive model for
measuring tie strength within social networking sites. Bakshy et al. (2012) determined
that stronger ties within a social networking environment increase the probability of
information sharing. Studying how an organization can promote relationships increased
an understanding of the knowledge sharing process.
A collaborative network is a type of social network, which prompted the review of
studies performed on social media systems within organization to understand a system’s
impact on knowledge transfer within organizations. Public social networks and
collaborative social networks differ in structure and the manner in which information
flows within each network. Saito, Kimura, and Motoda (2013) produced a model that
can be used to determine how social networks are affecting information diffusion. Rejeb-
Khachlouf et al. (2011) concluded that dense networks contribute to faster diffusion of
information. Durugbo (2014) concluded that within collaborative networks, information
is built from relationships that allow firms to collaborate. Chui et al. (2014) validated that
structural properties of a social network are exhibited in an online network and that tie
strength is an influencing factor of certain network behavior. Barker (2015) performed a
study concerning management of knowledge creation and sharing within a virtual
community and concluded that knowledge intervention by an expert within the
organization is necessary to ensure new knowledge is created and continuously shared
within an online social network’s discussion forum.
48
The studies conducted on tie strength and information diffusion within a public social
network can be applied to a collaborative social network, since both networks utilize
digital communication systems. Social networking technologies facilitate knowledge
management, so studies were evaluated to understand what contributes to the use of
social networking sites. Kim, Lee, and Elias (2015) concluded that personal and
environmental factors significantly predict information sharing behaviors on social
networking sites. Levy (2013) researched the utilization of social media within
organizations to enable knowledge management and determined that social media can be
gradually implemented within an organization and still achieve gradual levels of benefits
to the knowledge management process. Bharati et al. (2015) concluded that social media
usage facilitates social interactions and promotes organizational efforts in knowledge
management, leading to higher levels of organizational quality. The literature provided an
understanding that a collaborative environment increases knowledge sharing, and this
motivated the need to recognize methods to facilitate collaboration within an organization
to increase knowledge sharing.
49
Chapter 3
Methodology
Effective knowledge management increases an organization’s competitive advantage,
but it remains a challenge to facilitate knowledge transfer within an organization. This
study leveraged existing research that investigated the impact of relationships on
information dissemination within an organization in order to determine if the dimensions
of tie strength had an effect on information dissemination among corporate users of social
media technology. Quantitative data were collected, and hypothesis testing was
performed to determine if tie strength was a factor that enhanced information
dissemination among employees.
The hypotheses were first tested using SEM to determine if it could be utilized to
measure the influence of each tie strength indicator on information dissemination. A
model was generated following seminal work of Muthen (1984). Confirmatory Factor
Analysis (CFA) was conducted to establish the reliability of the model and specify which
variables loaded onto which factors (Bowen & Guo, 2011). A variety of fit indices were
evaluated to determine the fit of SEM (Hooper, Coughlan, & Mullen, 2008; Yuan, 2005).
Absolute Fit indices were used to calculate how well the a priori model fit the sample
data (Joreskog, 1993). Chi-Square was used to measure the discrepancy between the
sample and fitted covariance matrices (Hu & Bentler, 1999). Based on Exploratory Factor
Analysis, the observed factors with low factor loadings were removed, and a series of
iterations were performed on the model by deleting factors and retesting the model to
50
increase the overall fit. The indicator variables loaded significantly on the latent factor,
but several of the fit indices did not indicate that the model fit was established. CFA tests
revealed that the model fit was not appropriate, and SEM was not a viable solution for
testing the hypothesis. The CFA results of the adjusted model can be found in Chapter 4.
MANOVA was then utilized to test the hypotheses.
Research Questions and Hypothesis
Hypothesis One
Employees within the same professional occupational group can be considered
members of a community of practice, which are informal groups with shared expertise.
Members of communities of practice often have shared memory and knowledge, which
allows information to be openly diffused within their community (Del Guidice, Peruta &
Maggioni, 2015). As such, it was hypothesized that members with the same job
classification would have significantly stronger tie strength, which would increase the
likelihood of information dissemination within their group. Employees that have social
commonalities may also be more inclined to communicate. Tie strength is a latent
variable comprised of intimacy, structural variables and social distance. H1 was
generated to determine tie strength’s impact on information dissemination and address
the research question, “How does tie strength influence the effects of information
dissemination within a collaborative social network?” The stronger the tie strength, the
more information will be disseminated using the multiple modalities of the ICT tool.
This hypothesis determines the impact that tie strength has on information dissemination
within a collaborative network. It was hypothesized that the stronger the tie strength, the
51
greater the amount of information that would be diffused. Therefore, H1 was defined as
follows:
H1: Relationships that exhibit higher levels of tie strength will disseminate
significantly higher levels of information via instant messaging, chat room and
video/conferencing modalities of a collaboration system.
Hypothesis Two
This study also sought to determine if the type of communication modality chosen
moderated the relationship between tie strength and information dissemination. The
modalities of instant messaging, chat rooms, and video/screen sharing conferencing were
evaluated to determine their usage in the dissemination of information concerning
information relevant to training. Ou, Davison, and Wong (2016) conducted a study that
focused on knowledge sharing that was mediated by an interactive system such as instant
messaging and found that these systems facilitate direct and dynamic conversations
among participants.
H2 was developed to answer the research question, “How is the relationship between
tie strength and information dissemination affected by the type of medium being used
within the collaborative network?” The instant message feature is a one-to-one
relationship where each message posted is received by a single recipient. The chat rooms
are a persistent and asynchronous communication in which the items/entries in the chat
room are a contribution from one person to multiple people at the same time. In a chat
room, a message posted by one person has multiple recipients, which classified this as a
one-to-many relationship. The video/conferencing feature also has the one-to-many
52
relationship effect, as information that is shared by one person on a video/conference can
be heard and viewed by multiple people using the modality.
The stronger the tie strength, the more likely an intimate or person-to-person
communication would occur between connections. Instant messaging is the only
communication modality that supports one-on-one communication between connections
and constitutes a one-to-one relationship. Consequently, instant messaging offers the
most intimate level of communication of the three ICT modalities measured in this study.
Therefore, it was hypothesized:
H2: Relationships that exhibit higher levels of tie strength will disseminate
significantly higher levels of information via the instant messaging modality of a
collaboration system.
Environment
Previous studies have utilized observational methods to collect data regarding
intention to use or best recollection of use, but as Bakshy et al. (2012) identified, using
purely observational methods imposes difficulty in determining correlation between
subjects, because subjects have already been influenced by one another. With an
increase in the use of digital social interaction, there are now tools available to capture
analytic data to statistically identify how social ties influence information dissemination.
Since the research of Daft and Lengel (1986), which identified that rich media could be
used to facilitate knowledge transfer, researchers have shown that technology can
facilitate the knowledge sharing process by disseminating information within an
organization (Albino et al., 2004; Gressgard, 2011; Gressgard, 2014; Hedgebeth, 2007;
53
Panahi, Watson, & Partridge, 2013; Roberts, 2000). The current study was performed by
digitally collecting data from subjects in their natural environment without interaction
from the researcher. Data regarding information dissemination within a collaborative
network were collected digitally from a single company by tracking the use of a
collaborative system. Similar to Aral and Walker (2014), this study utilized a large scale
communication system to digitally collect data and employ statistical methods to
investigate the effect of tie strength. Previous studies have explored information sharing
using digital communication tools, but they did not utilize a collaborative network within
a business setting.
To extend the work of Bakshy et al. (2012) who researched the effects of social
characteristics on information diffusion, this study monitored a collaborative network
within an organizational environment rather than a social communication network. Lync
is an online collaboration technology that contains multiple modalities with various levels
of richness, including instant messaging, groupware, video conferencing, screen sharing,
audio conferencing, chat rooms, and file transfer. Lync was utilized as the platform for
collecting data regarding content sharing. Data were collected from a single, live
business environment within the United States that has been using Lync as an online
collaborative network within their organization for at least 12 months. The use of the
collaboration tool was monitored by gathering data from system usage and
communication logs to determine the effects of tie strength on the information that was
diffused through the system.
Within this research environment, Lync was made available to employees that were
distributed across the organization and had various roles, responsibilities, and
54
relationships throughout the company’s multiple business divisions. The use of Lync for
company communication was voluntary. To ensure that greater potential of the software
being utilized, the company that was monitored was making use of the instant messaging,
chat room, video conferencing and screen sharing modalities of Lync, as well as Lync
integration capabilities, such as integration with SharePoint, OneNote and Outlook.
Within the company that was monitored, Lync was being used to supplement training.
Subject matter experts within the company were sharing their knowledge through training
sessions. Participants attended the training in-person or through the Lync video/
conferencing feature. The training was supplemented through the use of Lync chat rooms
that were created by meaningful users to continue discussions related to the training
subject matter. The chat rooms allowed the participants to stay connected and continue
exchanging information relevant to the subject matter discussed during the training.
The Lync chat rooms had the capability of being integrated with Microsoft SharePoint
to allow for added collaboration opportunities, such as document storage, discussion
boards, and surveys. Each chat room had the capability of being integrated to a private
SharePoint site that could only be viewed by Lync users and accessed through the chat
room in which they were associated. The information that was shared within the chat
rooms was monitored for information sharing.
Sample
For the purpose of this study, a relationship was defined as the connection between two
Lync users. Each person in a chat room had a potential relationship with every other
person within their chat room, and each of these relationships was considered a
55
connection that was used as the unit of analysis for the study. Participants were selected
from a population of employees that utilized Lync within an organization.
Chat rooms that were created to supplement training topics and were in existence for
at least one month were monitored for the purposes of this study. The chat rooms that
were selected shared information about various training topics and had at least 10
members dispersed geographically throughout the company. The chat rooms monitored
during the study were making use of multiple modalities of the Lync system. Subject
matter experts of the training subjects were included in each chat room in accordance
with the research of Barker (2015) that determined knowledge sharing is best supported
within an online environment when there is intervention by an expert.
For the instant messaging modality, Lync communication logs were monitored to
determine how the collaboration tool was used to disseminate information related to
specific training topics. Any information related to the training subject areas that was
passed between Lync users through the collaboration tool was tracked by contextual
analysis of messages sent within the system. The data were quantified to determine how
information was disseminated using the collaboration tool. The goal of the study was to
determine if tie strength influenced information dissemination, as measured by
monitoring the information sent via the collaboration tool that supports knowledge
transfer within an organization.
Determining Participants and Connections
Once the chat rooms were selected for the study, the researcher examined the chat
room administrative settings to aggregate a list of members of the chat room. All of the
users that were members of the selected chat rooms were considered to have a connection
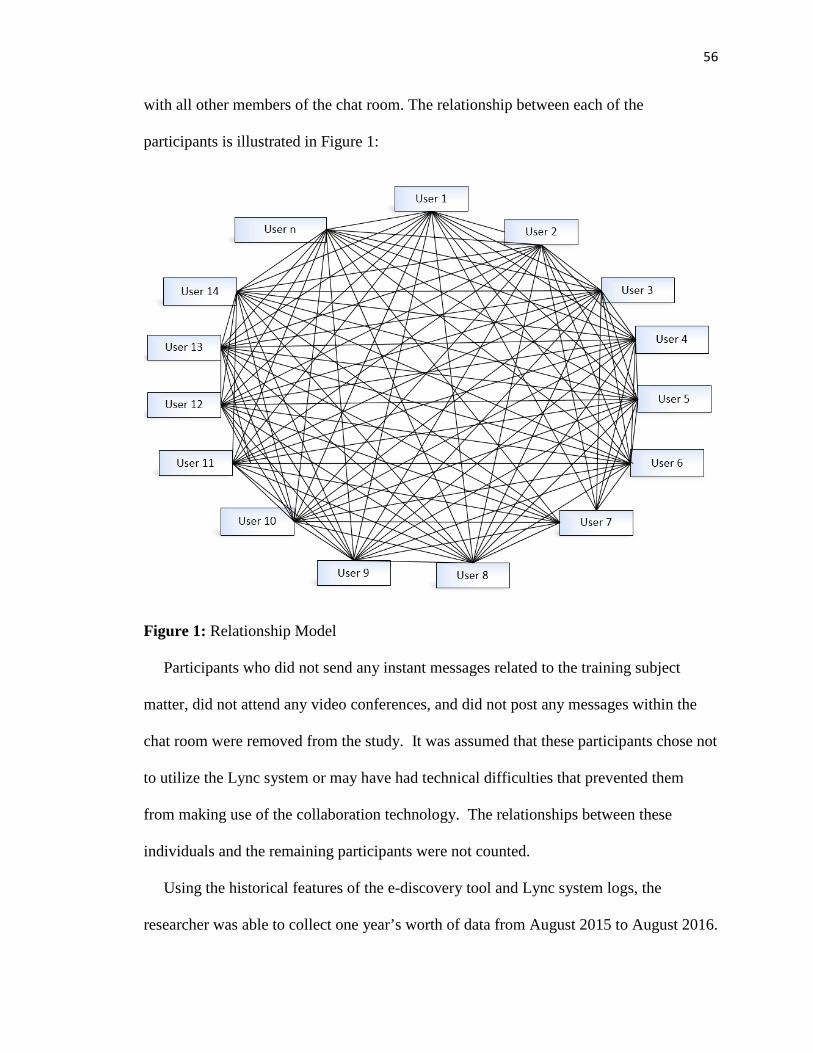
56
with all other members of the chat room. The relationship between each of the
participants is illustrated in Figure 1:
Figure 1: Relationship Model
Participants who did not send any instant messages related to the training subject
matter, did not attend any video conferences, and did not post any messages within the
chat room were removed from the study. It was assumed that these participants chose not
to utilize the Lync system or may have had technical difficulties that prevented them
from making use of the collaboration technology. The relationships between these
individuals and the remaining participants were not counted.
Using the historical features of the e-discovery tool and Lync system logs, the
researcher was able to collect one year’s worth of data from August 2015 to August 2016.
57
Data for all connections were gathered, which accounted for 1,749 connections.
Connections that were repeated in multiple chat rooms were only counted once. A total of
763 connections were removed for non-participation, which reduced data to a final
sample size of 986 connections.
The Lync logs identified users by their email address, so the researcher anonymized
the users by replacing their email address username with an alpha numeric code. Each
connection was given an alpha numeric label such as “AA1 -> AB1,” and so forth. The
first alpha of the username indicated the chat room, so that user data could be sorted by
chat room if needed. The connections that existed within each chat room were evaluated
separately, but the comprehensive data were collectively included into the study.
Variables
The independent variable was tie strength, which was measured by evaluating three tie
strength proxies that have been identified within the literature (Gilbert, 2012; Luarn &
Chui, 2013). Since tie strength is a quantifiable characteristic of a social network, the
current study utilized this multidimensional construct to determine the influence of social
relationships on information dissemination (Luarn & Chiu, 2015). The dependent
variable was information dissemination, which was measured by tracking the amount of
information transmitted via a collaboration tool within an organization. Information
dissemination was divided into: information dissemination via instant messaging,
information dissemination via chat room, and information dissemination via
video/conferencing. Information dissemination was also an aggregated variable
developed by adding instant messaging, chat room and video/conferencing. The
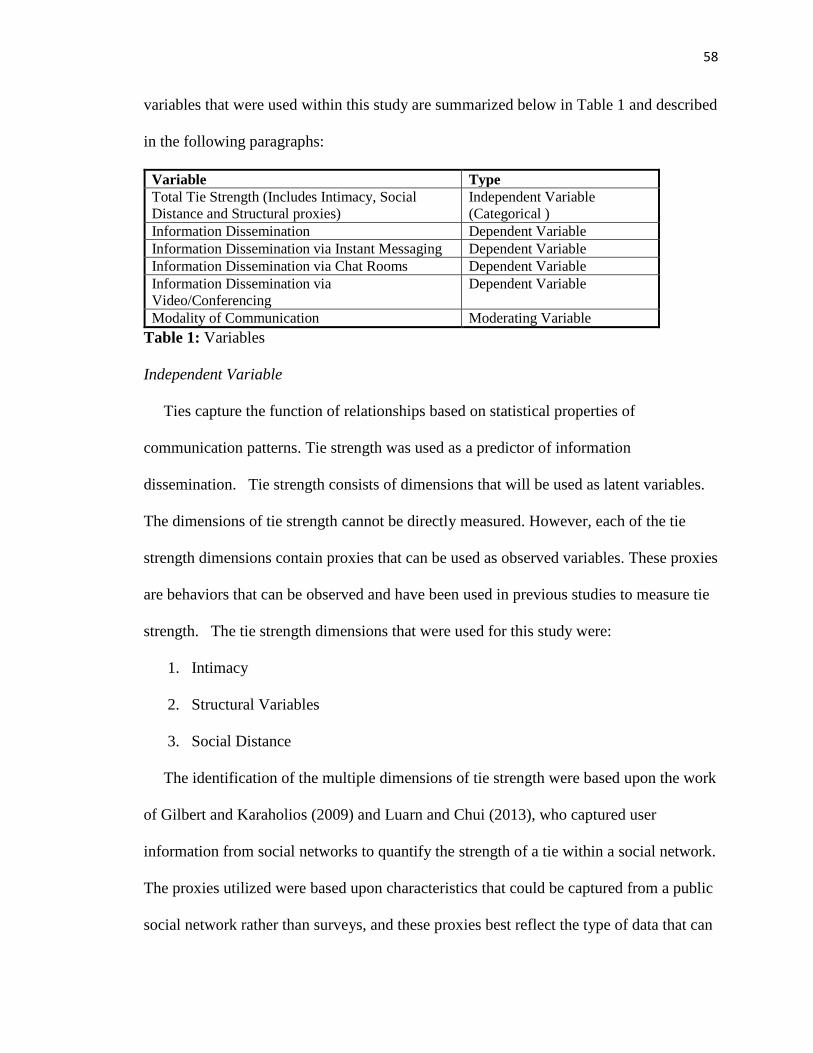
58
variables that were used within this study are summarized below in Table 1 and described
in the following paragraphs:
Variable Type Total Tie Strength (Includes Intimacy, Social Distance and Structural proxies)
Independent Variable (Categorical )
Information Dissemination Dependent Variable Information Dissemination via Instant Messaging Dependent Variable Information Dissemination via Chat Rooms Dependent Variable Information Dissemination via Video/Conferencing
Dependent Variable
Modality of Communication Moderating Variable Table 1: Variables
Independent Variable
Ties capture the function of relationships based on statistical properties of
communication patterns. Tie strength was used as a predictor of information
dissemination. Tie strength consists of dimensions that will be used as latent variables.
The dimensions of tie strength cannot be directly measured. However, each of the tie
strength dimensions contain proxies that can be used as observed variables. These proxies
are behaviors that can be observed and have been used in previous studies to measure tie
strength. The tie strength dimensions that were used for this study were:
1. Intimacy
2. Structural Variables
3. Social Distance
The identification of the multiple dimensions of tie strength were based upon the work
of Gilbert and Karaholios (2009) and Luarn and Chui (2013), who captured user
information from social networks to quantify the strength of a tie within a social network.
The proxies utilized were based upon characteristics that could be captured from a public
social network rather than surveys, and these proxies best reflect the type of data that can
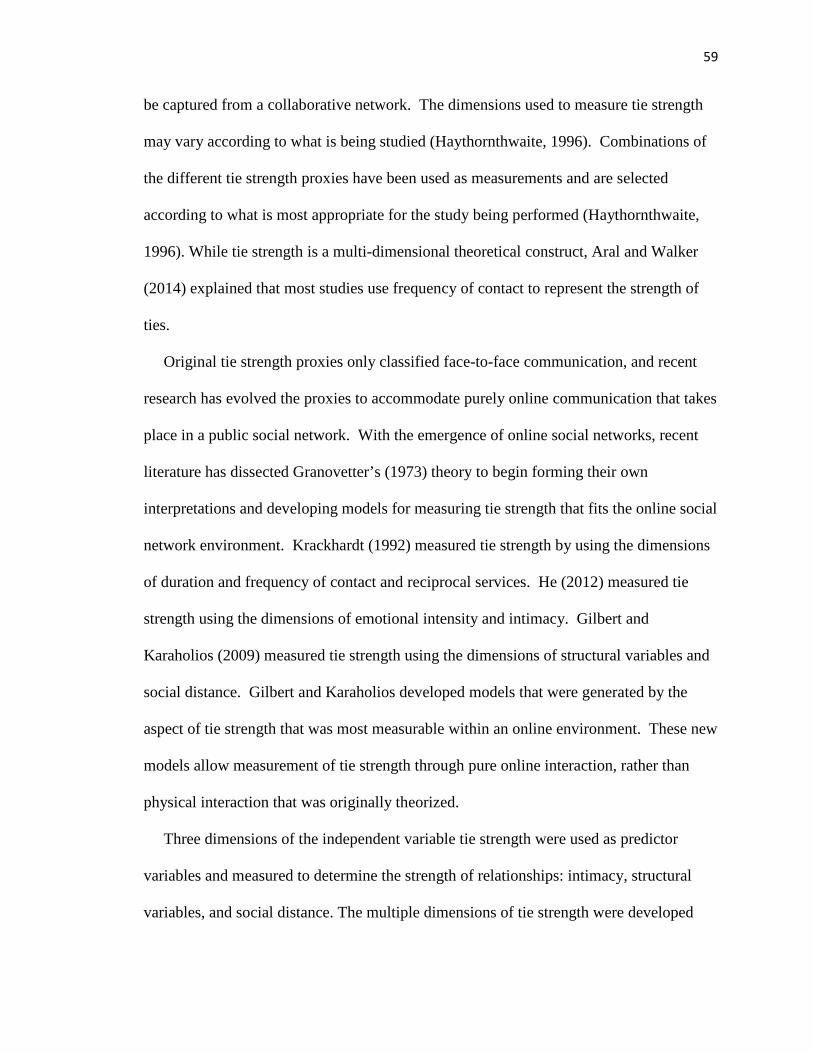
59
be captured from a collaborative network. The dimensions used to measure tie strength
may vary according to what is being studied (Haythornthwaite, 1996). Combinations of
the different tie strength proxies have been used as measurements and are selected
according to what is most appropriate for the study being performed (Haythornthwaite,
1996). While tie strength is a multi-dimensional theoretical construct, Aral and Walker
(2014) explained that most studies use frequency of contact to represent the strength of
ties.
Original tie strength proxies only classified face-to-face communication, and recent
research has evolved the proxies to accommodate purely online communication that takes
place in a public social network. With the emergence of online social networks, recent
literature has dissected Granovetter’s (1973) theory to begin forming their own
interpretations and developing models for measuring tie strength that fits the online social
network environment. Krackhardt (1992) measured tie strength by using the dimensions
of duration and frequency of contact and reciprocal services. He (2012) measured tie
strength using the dimensions of emotional intensity and intimacy. Gilbert and
Karaholios (2009) measured tie strength using the dimensions of structural variables and
social distance. Gilbert and Karaholios developed models that were generated by the
aspect of tie strength that was most measurable within an online environment. These new
models allow measurement of tie strength through pure online interaction, rather than
physical interaction that was originally theorized.
Three dimensions of the independent variable tie strength were used as predictor
variables and measured to determine the strength of relationships: intimacy, structural
variables, and social distance. The multiple dimensions of tie strength were developed
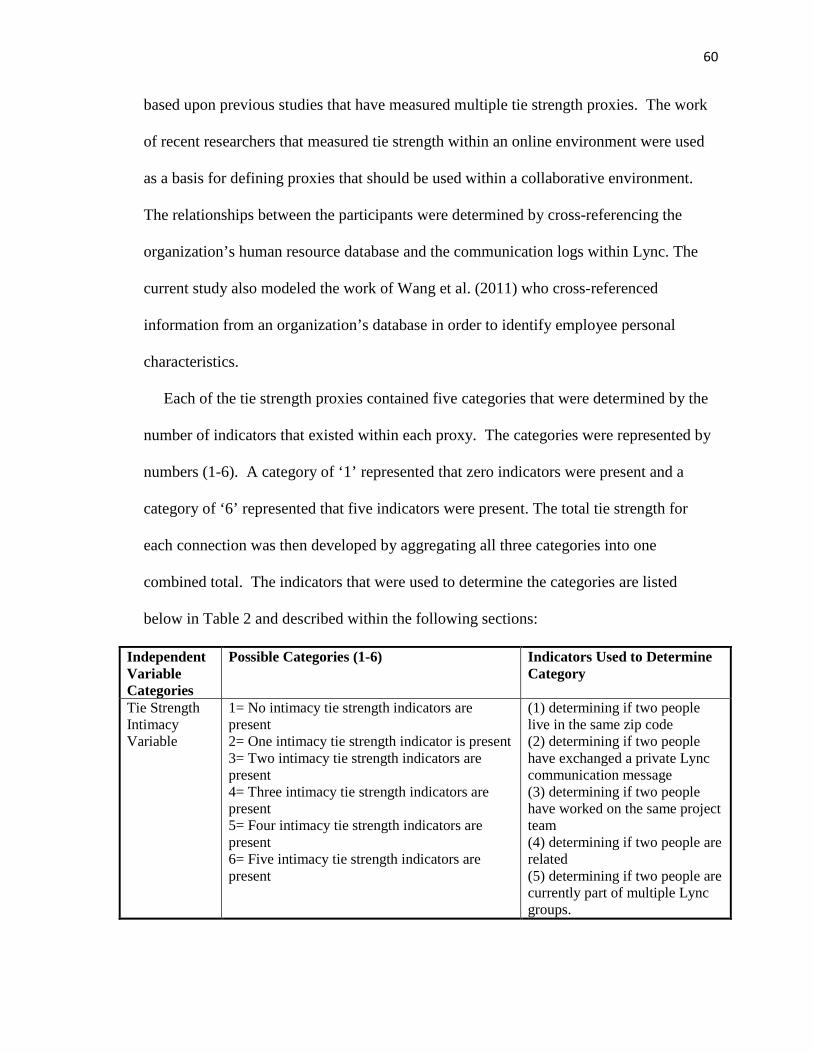
60
based upon previous studies that have measured multiple tie strength proxies. The work
of recent researchers that measured tie strength within an online environment were used
as a basis for defining proxies that should be used within a collaborative environment.
The relationships between the participants were determined by cross-referencing the
organization’s human resource database and the communication logs within Lync. The
current study also modeled the work of Wang et al. (2011) who cross-referenced
information from an organization’s database in order to identify employee personal
characteristics.
Each of the tie strength proxies contained five categories that were determined by the
number of indicators that existed within each proxy. The categories were represented by
numbers (1-6). A category of ‘1’ represented that zero indicators were present and a
category of ‘6’ represented that five indicators were present. The total tie strength for
each connection was then developed by aggregating all three categories into one
combined total. The indicators that were used to determine the categories are listed
below in Table 2 and described within the following sections:
Independent Variable Categories
Possible Categories (1-6) Indicators Used to Determine Category
Tie Strength Intimacy Variable
1= No intimacy tie strength indicators are present 2= One intimacy tie strength indicator is present 3= Two intimacy tie strength indicators are present 4= Three intimacy tie strength indicators are present 5= Four intimacy tie strength indicators are present 6= Five intimacy tie strength indicators are present
(1) determining if two people live in the same zip code (2) determining if two people have exchanged a private Lync communication message (3) determining if two people have worked on the same project team (4) determining if two people are related (5) determining if two people are currently part of multiple Lync groups.
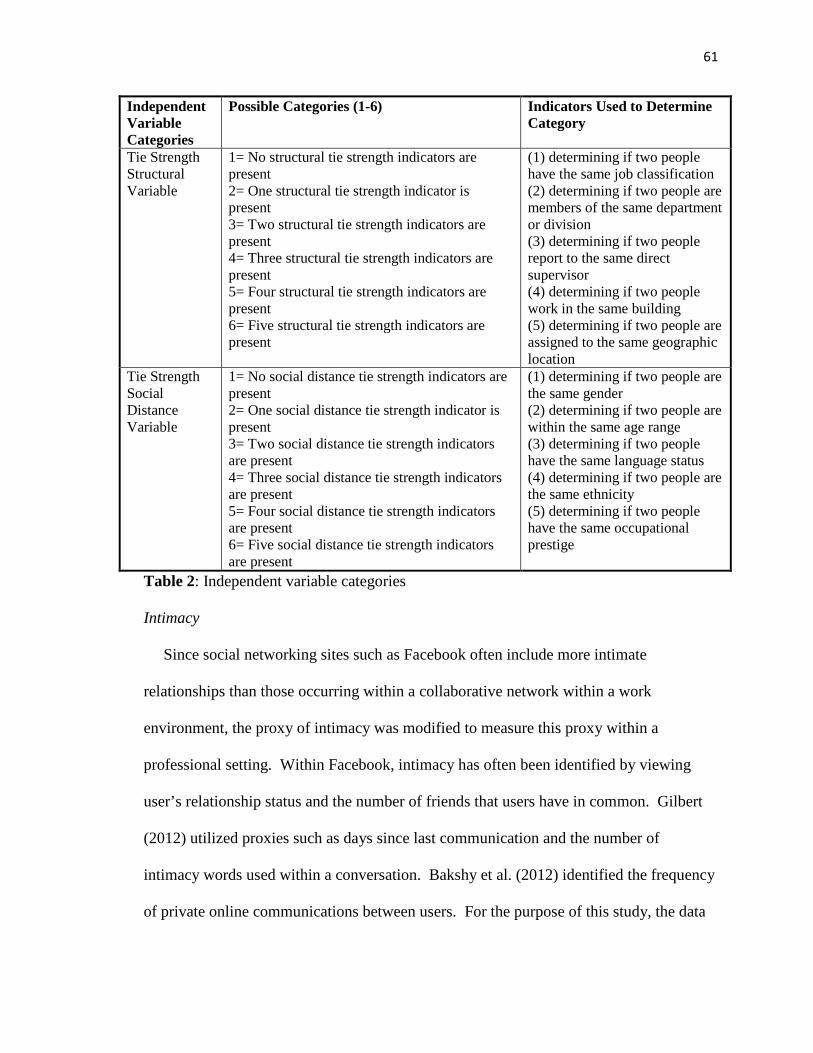
61
Independent Variable Categories
Possible Categories (1-6) Indicators Used to Determine Category
Tie Strength Structural Variable
1= No structural tie strength indicators are present 2= One structural tie strength indicator is present 3= Two structural tie strength indicators are present 4= Three structural tie strength indicators are present 5= Four structural tie strength indicators are present 6= Five structural tie strength indicators are present
(1) determining if two people have the same job classification (2) determining if two people are members of the same department or division (3) determining if two people report to the same direct supervisor (4) determining if two people work in the same building (5) determining if two people are assigned to the same geographic location
Tie Strength Social Distance Variable
1= No social distance tie strength indicators are present 2= One social distance tie strength indicator is present 3= Two social distance tie strength indicators are present 4= Three social distance tie strength indicators are present 5= Four social distance tie strength indicators are present 6= Five social distance tie strength indicators are present
(1) determining if two people are the same gender (2) determining if two people are within the same age range (3) determining if two people have the same language status (4) determining if two people are the same ethnicity (5) determining if two people have the same occupational prestige
Table 2: Independent variable categories
Intimacy
Since social networking sites such as Facebook often include more intimate
relationships than those occurring within a collaborative network within a work
environment, the proxy of intimacy was modified to measure this proxy within a
professional setting. Within Facebook, intimacy has often been identified by viewing
user’s relationship status and the number of friends that users have in common. Gilbert
(2012) utilized proxies such as days since last communication and the number of
intimacy words used within a conversation. Bakshy et al. (2012) identified the frequency
of private online communications between users. For the purpose of this study, the data
62
from other company systems including the Human Resource system were cross-
referenced to identify five factors that were used to form a value to categorize intimacy.
Intimacy was measured by shared relationships between two people. To evaluate the
tie strength of intimacy, five factors were identified based on literature review of the
definition of the intimacy proxy. The five elements for intimacy included: (1)
determining if two people lived in the same zip code; (2) determining if two people
exchanged a private Lync communication message (3) determining if two people worked
on the same project team; (4) determining if two people were related; and (5) determining
if two people were part of multiple Lync groups. Using the Human Resources system
and Lync administrative logs, a database was created that listed the individual factors for
each participant. The data were compared against each of the users within a relationship
to determine the value that existed. Each relationship within the study was examined
separately, and the researcher determined the number of intimacy factors that were
present for each relationship to establish the category. For example, if no factors were
present for a relationship, that relationship was assigned a category of 1, and if five of the
factors were present for a relationship, that relationship was assigned an intimacy
category of 6.
Structural Variables
Structural variables were identified in previous research by determining the number of
mutual friends and relations between two individuals such as a classmate, friend or two
people attending the same college (Gilbert, 2012). These data are more easily determined
within a social network platform in which users identify this characteristic within their
63
profiles. For the current study, five factors were identified and used to categorize the
structural variable category.
Structural variables were measured by identifying shared affiliation or networks
between two people. To evaluate the structural variable, five factors were identified to
categorize the tie strength relationship: (1) determining if two people had the same job
classification; (2) determining if two people were members of the same department or
division; (3) determining if two people reported to the same direct supervisor; (4)
determining if two people worked in the same building; and (5) determining if two people
were assigned to the same geographic location. The process of identifying the value that
existed for the structural variable proxy was the same as the intimacy value.
Social Distance
Social distance had previously been measured by identifying commonalities in gender,
age, hometown, degree of education, race, and language status. For the purpose of this
study, information that was captured within employee’s records and linked to the system
profile was utilized for this measurement. Social distance has been measured by
identifying commonalities in employee characteristics. Five factors of social distance
were identified to categorize the relationship: (1) determining if two people were the
same gender; (2) determining if two people were within the same age range (3)
determining if two people had the same language status; (4) determining if two people
were the same ethnicity; and (5) determining if two people had the same occupational
prestige. The value of social distance tie strength was calculated the same as intimacy and
structural.
64
Dependent Variables
Information dissemination was derived by counting the number of relevant
communications recorded for each connection across all communication modes. The
output variable of interest was information dissemination within an organization as
measured by tracking content that was sent within the Lync system and determining how
information related to the training topics was sent through the Lync system. Information
dissemination, the dependent variable, was measured by quantifying the number of
references made to information related to the training subjects via the Lync tool. The
information was tracked by analyzing the Lync system logs and identifying relevant
information passed. Three separate dependent variables were created by counting the
amount of information that was diffused by each of the Lync modalities of instant
messaging, chat rooms and video conferencing/presenting. The number of information
dissemination communications counted through each of the modalities was measured.
Bakshy et al. (2012) and Steeg and Galstyan (2012) both measured tie strength’s
impact on information dissemination by tracking the transfer of data within a public
social network, which was pioneer work, because information transfer was measured
through digital data collection to quantify if information sharing was taking place rather
than performing surveys and questionnaires. Wang et al., (2011) tracked the forwarding
of an email to determine information diffusion. Wang’s research cross-referenced a
company’s dataset that contained personal characteristics, such as job role, performance,
and hierarchal data. It tracked the email to determine how information diffuses through a
social network and utilized large-scale data collection to allow a better understanding of
how information is spread.

65
Data Collection
IRB approval was submitted and reviewed under 45 CFR 46.101(b) Exempt Category
2. A signed consent form was provided by the company being observed that allowed the
researcher to collect and utilize data for the study with the understanding that all data and
analysis would be anonymized to protect the company, proprietary information, and the
employees whose data were collected. IRB approval was obtained and is located in
Appendix A.
Calculating Independent Variable
The tie strength relationship between each connection included in the study was
evaluated. A category of 1-6 was assigned for each of the tie strength variables by
determining the number of factors present for each relationship. Tie strength was first
evaluated separately for each of the three proxies, then, a collective tie strength was
computed by adding the values of the three proxies for each relationship.
Chat Room Data Collection
The researcher counted the number of times each participant posted a Lync message
within the chat room that referred to subject matter discussed within the training and
determined who received the message by monitoring the people involved in the chat
room. It was assumed that all members of a chat room received and read each message
posted, so people that were members of the chat room during the time the message was
sent were considered a person that received the message. The chat room data could not
be collected within the system logs, since it was considered a perpetual message, much
like an online forum. To collect the data, the chat room was monitored by the researcher.
66
The chat rooms were configured to store all messages from conception of the chat room.
The researcher copied and pasted the conversations into a document and created a log
that reflected the Lync system logs.
Instant Messaging Data Collection
Instant messaging was captured within Lync system and conversation logs. The
researcher used the system logs, e-discovery, and search tools to discover the number of
times each participant sent an instant message that was relevant to the training topics.
Manual contextual analysis was performed to determine if a conversation contained
relevant information. If the conversation contained relevant information, then each
relevant individual message within the conversation thread was counted along with
responses, questions and confirmation responses. The logs and e-discovery tool indicated
the participant that sent and received the message. Each instance of an applicable
message was counted for each connection.
Video Conferencing Data Collection
Blau, Weiser, and Eshet-Alkalai (2016) conducted a study using an advanced
videoconferencing platform that allowed participants to maintain spontaneous
educational interactions and examine if knowledge acquisition is affected by the
communication channel. The research of Taylor et al. (2016) that tested the effectiveness
of video conferencing detailed a procedure that could be used to ensure if video
conferencing was effective. To capture video conferencing information within the
current study, attendance was captured within the system logs. The researcher counted
the number of times that each connection attended a video conference together by
reviewing the video logs that record the attendees of each video conference.
67
Calculating Dependent Variables
Communication occurring within any of the Lync modalities was used to measure the
dependent variable, information dissemination. For each relationship within the chat
room, the data gathered regarding use of the entire Lync system were used to count the
number of times that each relationship made reference to information relevant to a
training topic. Relevant messages sent within conversations were considered information
dissemination. The data regarding usage were separated by modality to allow for an
analysis of the preferred communication for each user.
The administrative logs of the Lync system were downloaded by the researcher. The
administrative log recorded the response counts and timestamp information for each
conversation that took place between users. The number of messages exchanged between
two users was recorded. The type of modality used for communication was listed. The
data were recorded into a spreadsheet for analysis. The researcher utilized formulas
within the spreadsheet to create a database of only the communications that occurred
among each of the connections that were included in the study.
In order to determine if information was disseminated during the instant message
conversations, the messages between each of the relationships were evaluated to
determine if the content exchanged was related to the training topics. For the instant
messaging modality, the actual conversation logs existed within each participant’s
conversation history folder within Microsoft Outlook, since Outlook and Lync are
integrated. To capture the actual text of each message exchanged between a relationship,
an E-discovery tool was used to search the communications based on username, and the
data were extracted into a file. The conversation logs were then transferred into a word
68
processor, so that the conversations could be manually analyzed. Each conversation
extracted contained a thread of messages exchanged between two users. A list of key
words was developed for each of the training subject matter. Manual contextual analysis
was performed on each conversation to determine the relevant messages within each
instant message conversation. Each message within a relationship that contained one of
the relevant key words was counted as a relevant message in which information exchange
occurred. Messages that included information, questions, or discussions about the key
word were counted as a relevant message, along with confirmation responses by those
participating in the conversation. Relevant messages were recorded into a document for
storage. Since the messages recorded contained work related information, the messages
were anonymized by coding any information that could reveal the identity of the
participants or release proprietary information of the company. Words that were
anonymized included work names, client names, company names, departments, and
numbers. The number of messages that contained key words relevant to the training,
separated by modality, was recorded for each relationship. The messages that did not
relate to the training topic were eliminated and not included in the study.
The total number of messages, separated by modality, per relationship were captured
within a database using the methods described above. For each relationship, the number
of messages that were exchanged using each modality were counted. These numbers
were used to determine the preferred mode of communication by analyzing the pattern of
communication exhibited by each relationship.
69
Data Aggregation
After the proxies of tie strength were utilized to determine the tie strength for each
connection, and use of the collaboration technology was used to measure information
dissemination, the data were aggregated into one database. The raw data that were
collected from the usage logs and filtered from textual analysis was aggregated into
Microsoft Excel in which the rows represented relationships and the columns indicated
the observable variable outcomes. The database indicated the tie strength category for
each of the observed variables, the tie strength category for each of the three tie strength
proxies, the total value of tie strength, and the number of messages that took place
separated by modality for each relationship. The total number of messages exchanged for
each user was determined by the sum of messages exchanged through each modality for
each relationship. A column was created for each observable construct:
• Individual columns created for each of the factors of tie strength that contained
values of 0 or 1
• Intimacy column contained a category of 1-6 for each relationship
• Structural column contained a category of 1-6 for each relationship
• Social column contained a category of 1-6 for each relationship
• Total Tie Strength column contained the sum total of all of the individual tie
strength factors (contained a category of 1-16)
• Video column contained the number of video conversations for each relationship
• Instant Message column contained the number of relevant instant messages for
each relationship
70
• Chat column contained the number of chat messages for each relationship
Data Analysis
The research was performed by following the processes of Aral and Walker (2014),
Bakshy et al. (2012), and Steeg and Galstyan (2012) to identify how the variables of tie
strength influence information dissemination within a social network. Aral and Walker
(2014) utilized causal modeling, because it has the ability to determine the combined
impact of the dimensions of tie strength on information dissemination. This study
introduced a new dimension to Aral and Walker’s (2014) and Bakshy et al. (2012) studies
by employing hypothesis testing to determine the influence of social ties on information
diffusion within an organization.
As Terrell (2012) explained, there are many statistical tests available, and the
information known about the dependent and independent variable can assist the
researcher in deciding which test is the most appropriate. Both SEM and MANOVA
models were tested to determine their appropriateness for this study. It was determined
that MANOVA testing was most appropriate for conducting the analysis. The process
shown in Figure 2, which is described in the following sections, was used to test the
model and hypotheses. The analysis was performed using SPSS (Statistical Package for
the Social Sciences) and AMOS.
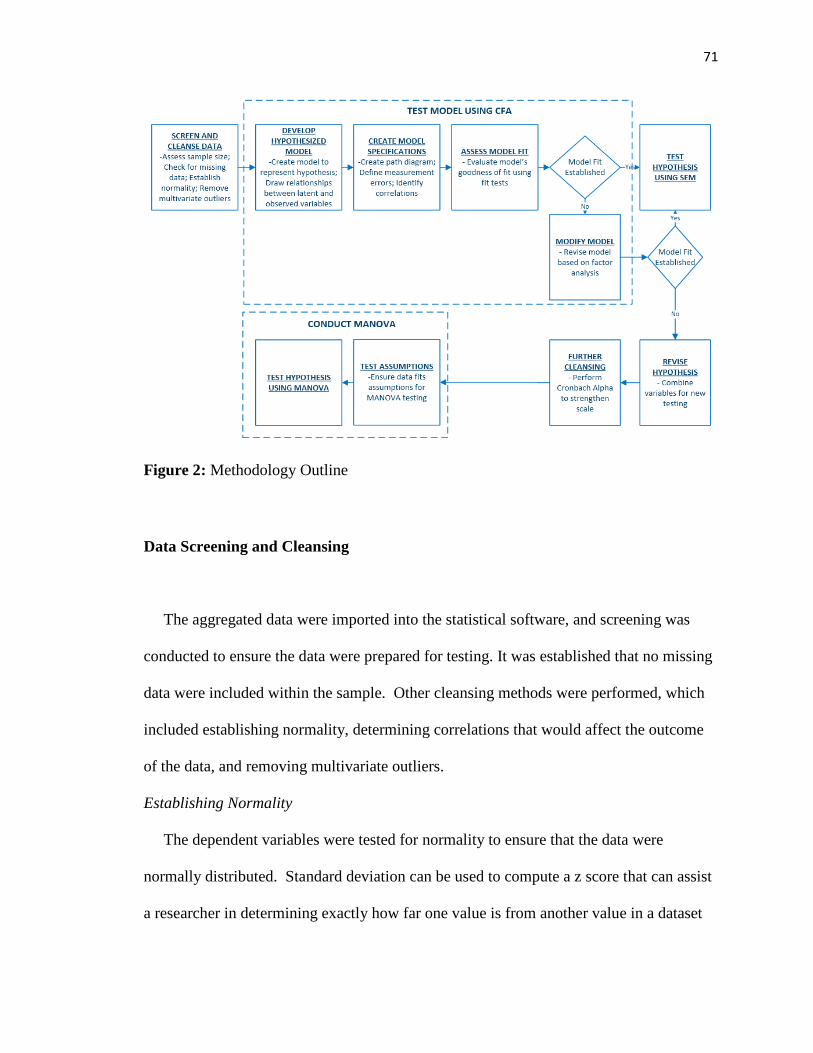
71
Figure 2: Methodology Outline
Data Screening and Cleansing
The aggregated data were imported into the statistical software, and screening was
conducted to ensure the data were prepared for testing. It was established that no missing
data were included within the sample. Other cleansing methods were performed, which
included establishing normality, determining correlations that would affect the outcome
of the data, and removing multivariate outliers.
Establishing Normality
The dependent variables were tested for normality to ensure that the data were
normally distributed. Standard deviation can be used to compute a z score that can assist
a researcher in determining exactly how far one value is from another value in a dataset
72
(Terrell, 2012). The Descriptives feature was used to calculate the z score for each of the
dependent variables. The z score for each of the dependent variables was calculated, and
the data were sorted by z score to determine what data, if any, were outliers and needed
to be removed to improve skewness and kurtosis of the entire data set.
Outliers were defined as values associated with z scores of z<-3.29 and z>+3.29.
From performing this analysis, it was determined that 36 connections contained outliers
and needed to be removed from the study. The data were reduced to a sample size of 952
connections after the outliers were removed.
Correlation Analysis
Correlation analysis was employed to explore the linear dependence between the
variables in the hypothesis. The linearity of the variables was tested to determine if they
were normally distributed and maintained a linear relationship. This measurement was
performed by calculating Pearson’s R using Correlation/Bivariate to determine if the
factors were significantly correlated at r>0.9. Correlations are positive if their values
increase together and negative when their values decrease together. The results
calculated a number between 0 and 1, in which 1 is a total positive linear correlation.
The outcome indicated how well one could be predicted from another. Variables
correlated greater than .9 were considered to have a strong correlation, which assumes
they were essentially performing the same measurement. To compensate for this, those
items with strong correlation were evaluated to determine if they would be removed from
the study. Variables that functioned as constants by virtue of having the same value for
all participants were removed from the study.
73
Model Selection
Cronbach’s Alpha was used to identify the set of proxies that best described the
unified tie strength variable. The variables evaluated using Cronbach’s Alpha allowed a
more robust tie strength scale to be created. MANOVA was then performed to allow for
testing H1, which hypothesized that tie strength would affect the amount of information
dissemination via a collaboration system. The R² calculation produced during the
MANOVA was used to test H2 to determine if the amount of tie strength affected the
amount of information disseminated via the instant messaging modality of the
collaboration system.
MANOVA
Multivariate analysis of variance (MANOVA) tests the hypothesis to determine
differences between one or more independent variables on two or more continuous
dependent variables while accounting for inter-correlations among dependent variables.
Unlike ANOVA that measures only one dependent variable, MANOVA has the ability to
measure multiple dependent variables (Terrell, 2012). The current study used one
aggregated tie strength value as the independent variable and three outcomes of
information dissemination as the three dependent variables to determine if there were
differences in the amount of tie strength and information dissemination using instant
messaging, chat room, or video/conferencing.
74
Further Data Cleansing
Cronbach’s Alpha was calculated to test the validity and reliability of the indicators
used in the measurement scale. Cronbach Alpha provides an explanation of the internal
consistency associated with the scores derived from a scale and explains the proportion of
the indicator variance described by the corresponding latent variable. It was important to
establish reliability of the scale, since scores from the individual observed variables were
aggregated to create a single tie strength independent variable. Using this information, it
was decided which variables should be removed from the measurement scale in order to
produce a Cronbach Alpha value of at least 0.700, which is the minimum threshold for
establishing reliability (Hair et al., 2005; Kim et al., 2015; Levin and Cross, 2004;
Nunnally, 1978; Ranucci and Souder, 2015).
The scale was first calculated with the 14 observed variables remaining from the
initial data cleansing process. After reviewing the initial results, it was decided which
variables should be removed from the study in order to increase the reliability of the
scale. A total of eight observed variables were removed from the study based on the
results of Cronbach’s Alpha, and the scale was recalculated to have an alpha of 0.700,
which was considered acceptable reliability.
Test MANOVA Assumptions
Assumptions regarding the data must be met for the MANOVA to produce a valid
result. These assumptions include normal distribution of data, homogeneity of the
covariance matrices, and independence of observations (Grimm & Yarnold, 1995). These
assumptions were evaluated prior to conducting the MANOVA.
75
Normal distribution assumes that the dependent variables are normally distributed for
each group identified by the independent variables (Grimm & Yarnold, 1995). Normal
distribution of data was established after the data collection stage when outliers were
removed to reduce skewness and kurtosis. The original data were paired using the
standard of excluding any values with a corresponding score of z<-3 and z>+3. Only the
normalized data were included in the final MANOVA analysis, so the assumption of
multivariate normality was satisfied.
Homogeneity of covariance matrices assumes that there are equal variances for each
of the dependent variables. Similar to Levene’s test for testing homogeneity assumption
in ANOVA, Box’s M is used to test homogeneity in MANOVA and determine if the
covariance of the dependent variables is significantly different across levels of the
independent variables (Grimm & Yarnold, 1995). Box’s M test was performed, and the
data produced a significant Box’s M result (p<0.001), signifying that the data failed to
meet the MANOVA’s assumption of homogeneity of covariance. However, literature
searches revealed that although the assumption was violated, it was still justifiable to
continue interpreting results, because the dataset contained equal sample sizes for each of
the dependent variables. Tabachnick and Fidell (2007) validated the decision by stating,
“If sample sizes are equal, evaluation of homogeneity of variance-covariance matrices is
not necessary” (p. 315). Tabachnick and Fidell (2007) further explained that when sample
sizes are equal, robustness of significance tests are expected, and the outcome of Box’s M
test can be disregarded. Cohen and Cohen (1983), Harris (1975), and Kozlowski and
Doherty (1989) also indicated that MANOVA is robust to a violation of homogeneous
variance assumptions. Research also explained that when multivariate significance is
76
realized, it is more appropriate to use Pillai’s Trace rather than Wilk’s Lambda results to
interpret the MANOVA results (Tabachnick & Fidell, 2007). Using the justifications
found in existing research, it was decided to continue interpreting the results of
MANOVA, and the final analysis of MANOVA was based on the results of Pillai’s
Trace.
Independence of observations assumes that there is no relationship between the
observations in or between the groups, which can be tested by ensuring that participant’s
scores on the dependent variable were not influenced or related to scores of the other
subjects (Terrell, 2012). Each of the scores on the dependent variable used in the current
study were independent of the other subjects. This study did include different
participants in each group, so the assumption of independence of observations was
satisfied.
Perform Hypothesis Test
After it was verified that the assumptions of MANOVA were satisfied, the hypothesis
were tested using the General Linear Model/Multivariate feature. Three dependent
variables were input into the model, which included total messages disseminated using
instant messaging, total message disseminated using chat rooms, and total message
disseminated using video/conferencing. The model was set up to include observed
power, descriptive analysis, and homogeneity tests, so that these calculations could be
performed during the analysis of the MANOVA. The results were interpreted and are
included within Chapter 4. Since multivariance significance existed, MAVOVA was
interpreted using the results of Pillai’s Trace rather than Wilk’s Lambda, following the
77
advice of Tabachnick and Fidell (2007). The tests reported significant results in support
of both hypotheses.
Summary
Hypothesis testing was performed to determine if tie strength influences information
dissemination within a collaborative network. Data regarding information dissemination
were collected from subjects in their natural environment that were using a collaborative
system. Tie strength was used as the independent variable, and the dependent variable
was information dissemination. Data was screened and cleansed by removing outliers
and performing correlation analysis to ensure that variables were normally distributed.
Further cleansing was performed using Cronbach’s Alpha to test the viability and the
reliability of the indicators within the measurement scale. It was determined that
MANOVA was most appropriate for testing the hypothesis, and the results can be viewed
in Chapter 4.
78
Chapter 4
Results
Introduction
Data were collected from a live environment to perform analysis on the effect of tie
strength on information dissemination in a collaborative network. The data were
prepared for testing by assessing the sample, ensuring that no data were missing from the
dataset, and removing multivariate outliers. CFA was then performed to test the validity
of using SEM to test the hypothesis. Various Absolute Fit, Incremental Fit and
Parsimony Fit Indices were performed, which indicated that model fit was not
established. The model was modified, and CFA and fit tests were performed again.
However, the initial tests held true in which model fit was not established for several fit
indices, as seen below. The contingency approach of using MANOVA to test the
hypothesis was then implored. The hypothesis was modified to treat tie strength as a
single independent variable. Tie strength’s impact on information dissemination was
then tested against three dependent variables.
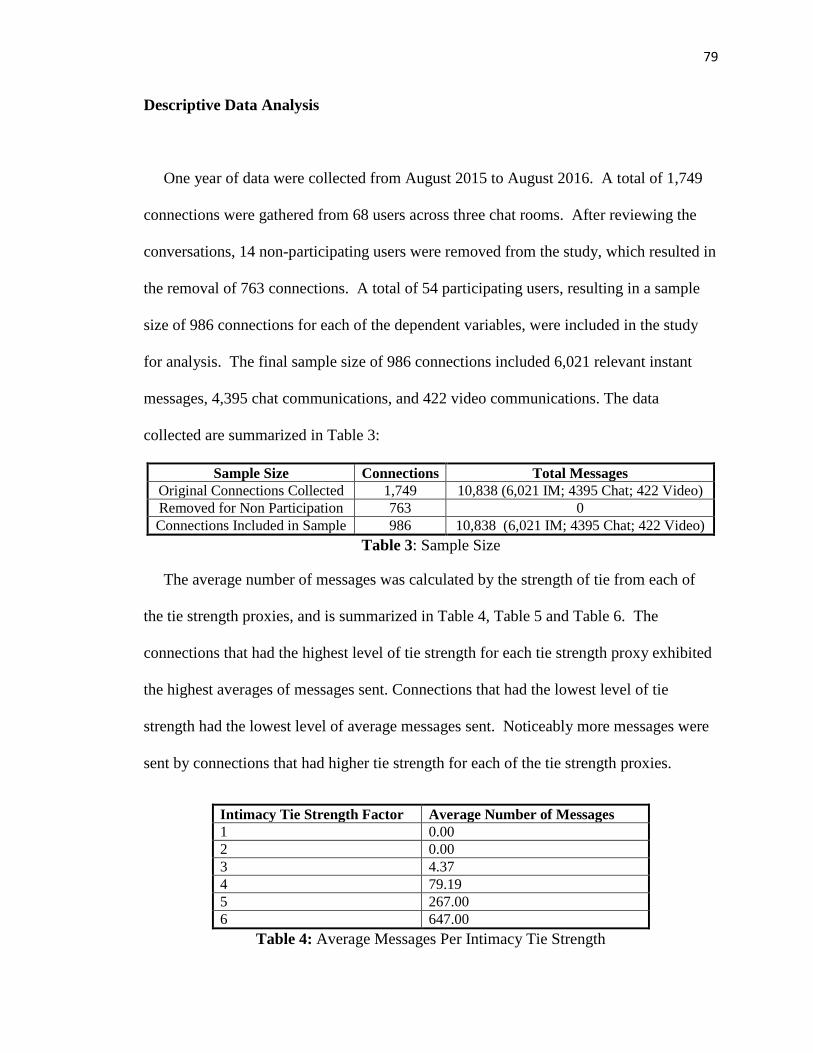
79
Descriptive Data Analysis
One year of data were collected from August 2015 to August 2016. A total of 1,749
connections were gathered from 68 users across three chat rooms. After reviewing the
conversations, 14 non-participating users were removed from the study, which resulted in
the removal of 763 connections. A total of 54 participating users, resulting in a sample
size of 986 connections for each of the dependent variables, were included in the study
for analysis. The final sample size of 986 connections included 6,021 relevant instant
messages, 4,395 chat communications, and 422 video communications. The data
collected are summarized in Table 3:
Sample Size Connections Total Messages Original Connections Collected 1,749 10,838 (6,021 IM; 4395 Chat; 422 Video) Removed for Non Participation 763 0 Connections Included in Sample 986 10,838 (6,021 IM; 4395 Chat; 422 Video)
Table 3: Sample Size
The average number of messages was calculated by the strength of tie from each of
the tie strength proxies, and is summarized in Table 4, Table 5 and Table 6. The
connections that had the highest level of tie strength for each tie strength proxy exhibited
the highest averages of messages sent. Connections that had the lowest level of tie
strength had the lowest level of average messages sent. Noticeably more messages were
sent by connections that had higher tie strength for each of the tie strength proxies.
Intimacy Tie Strength Factor Average Number of Messages 1 0.00 2 0.00 3 4.37 4 79.19 5 267.00 6 647.00
Table 4: Average Messages Per Intimacy Tie Strength
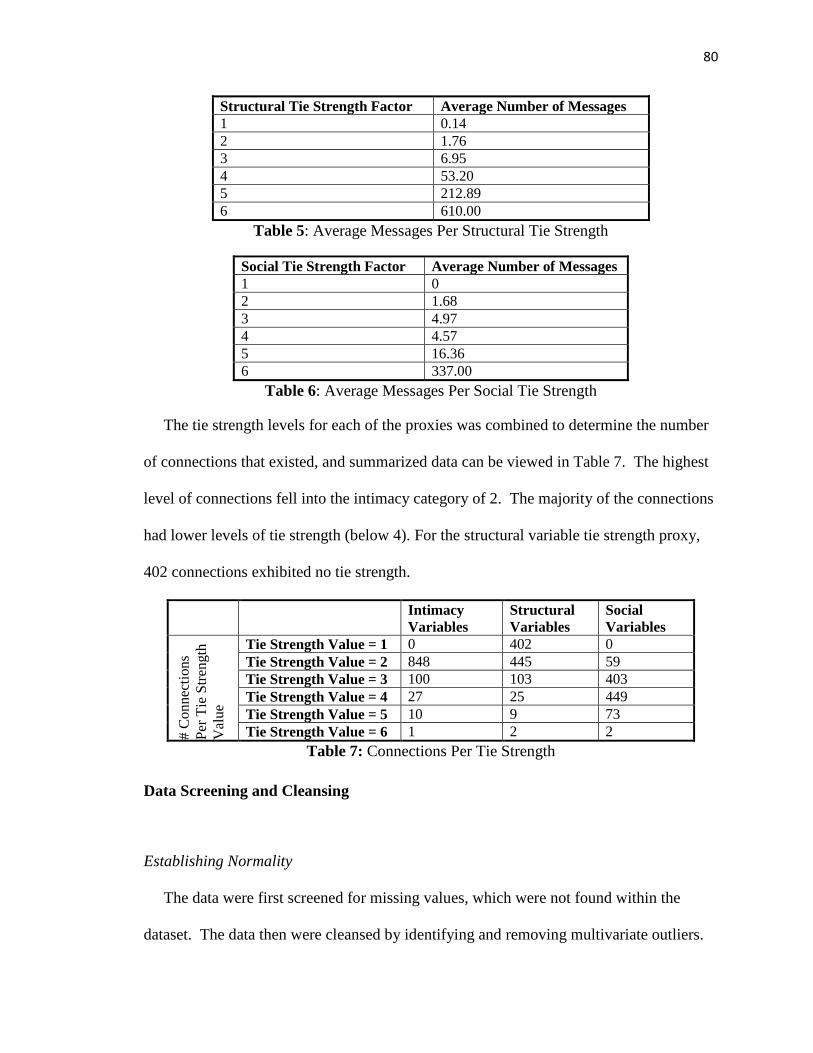
80
Structural Tie Strength Factor Average Number of Messages 1 0.14 2 1.76 3 6.95 4 53.20 5 212.89 6 610.00
Table 5: Average Messages Per Structural Tie Strength
Social Tie Strength Factor Average Number of Messages 1 0 2 1.68 3 4.97 4 4.57 5 16.36 6 337.00
Table 6: Average Messages Per Social Tie Strength
The tie strength levels for each of the proxies was combined to determine the number
of connections that existed, and summarized data can be viewed in Table 7. The highest
level of connections fell into the intimacy category of 2. The majority of the connections
had lower levels of tie strength (below 4). For the structural variable tie strength proxy,
402 connections exhibited no tie strength.
Intimacy Variables
Structural Variables
Social Variables
# C
onne
ctio
ns
Per T
ie S
treng
th
Val
ue
Tie Strength Value = 1 0 402 0 Tie Strength Value = 2 848 445 59 Tie Strength Value = 3 100 103 403 Tie Strength Value = 4 27 25 449 Tie Strength Value = 5 10 9 73 Tie Strength Value = 6 1 2 2
Table 7: Connections Per Tie Strength
Data Screening and Cleansing
Establishing Normality
The data were first screened for missing values, which were not found within the
dataset. The data then were cleansed by identifying and removing multivariate outliers.
81
The process of removing outliers consisted of normality testing to identify and remove
outliers that contained a z score of z<-3.29 and z>+3.29. The z score for the dependent
variable of information dissemination using instant messaging ranged from z=-0.15211 to
z=16.63661. The z score for the dependent variable of information dissemination using
chat rooms ranged from z=-0.49227 to z=6.57576. The z score for the dependent
variable of information dissemination using video/conferencing ranged from z=-0.13445
to z=15.25839. The data that fell outside of the z<-3.29, z>+3.29 criteria were
considered outliers, and the connections and all of their collected data were removed
from the study and not included in the final analysis. It was determined that 36
connections contained data that were considered outliers, and they were removed from
the study. After the outliers were removed, there were 952 connections remaining in the
sample size for each dependent variable to be included for final analysis. The new z
score for the dependent variable of information dissemination using instant messaging
then ranged from z=-0.15211 to z=2.91171. The new z score for the dependent variable
of information dissemination using chat rooms then ranged from z=-0.49227 to
z=2.93131. The new z score for the dependent variable of information dissemination
using video/conferencing then ranged from z=-0.13445 to z=2.69281. As a result of data
cleansing, tie strength skewness statistic measured at .963 and kurtosis statistic measured
at 1.994. These measurements were within the normality ranges, which recommend that
skewness values remain less than 2 and kurtosis values remain less than 7 for normally
distributed data (Tabachnick & Fidell, 2007).
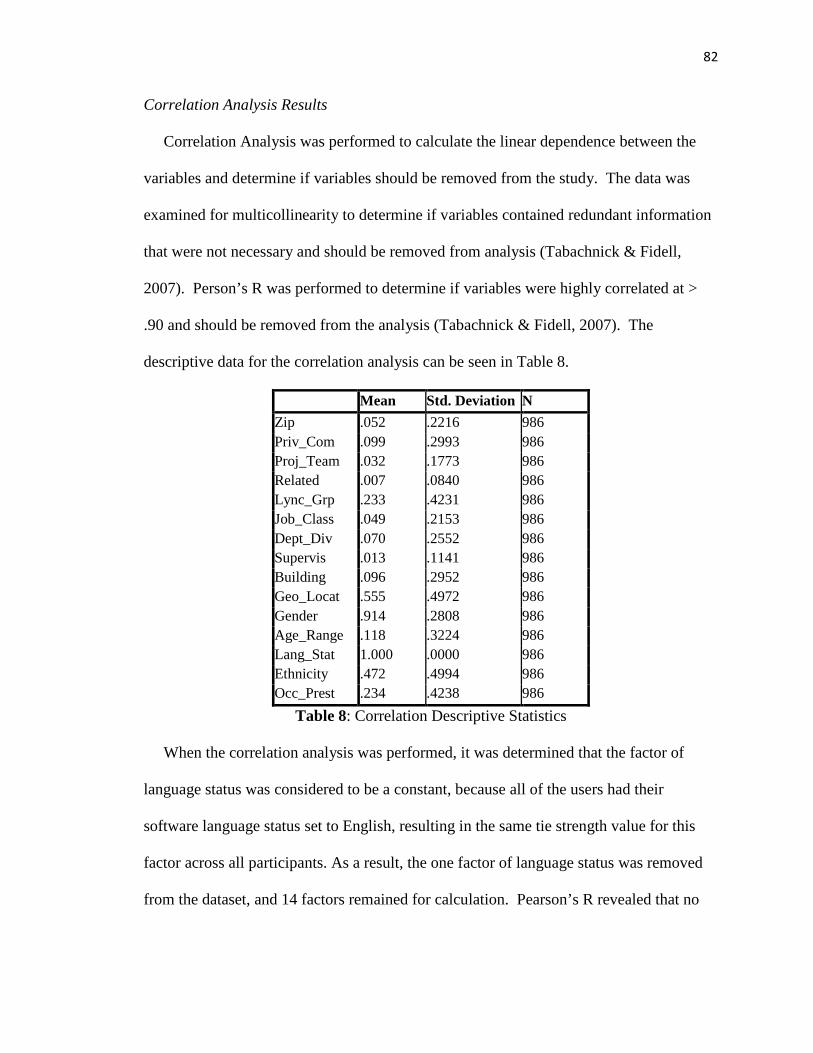
82
Correlation Analysis Results
Correlation Analysis was performed to calculate the linear dependence between the
variables and determine if variables should be removed from the study. The data was
examined for multicollinearity to determine if variables contained redundant information
that were not necessary and should be removed from analysis (Tabachnick & Fidell,
2007). Person’s R was performed to determine if variables were highly correlated at >
.90 and should be removed from the analysis (Tabachnick & Fidell, 2007). The
descriptive data for the correlation analysis can be seen in Table 8.
Mean Std. Deviation N Zip .052 .2216 986 Priv_Com .099 .2993 986 Proj_Team .032 .1773 986 Related .007 .0840 986 Lync_Grp .233 .4231 986 Job_Class .049 .2153 986 Dept_Div .070 .2552 986 Supervis .013 .1141 986 Building .096 .2952 986 Geo_Locat .555 .4972 986 Gender .914 .2808 986 Age_Range .118 .3224 986 Lang_Stat 1.000 .0000 986 Ethnicity .472 .4994 986 Occ_Prest .234 .4238 986
Table 8: Correlation Descriptive Statistics
When the correlation analysis was performed, it was determined that the factor of
language status was considered to be a constant, because all of the users had their
software language status set to English, resulting in the same tie strength value for this
factor across all participants. As a result, the one factor of language status was removed
from the dataset, and 14 factors remained for calculation. Pearson’s R revealed that no
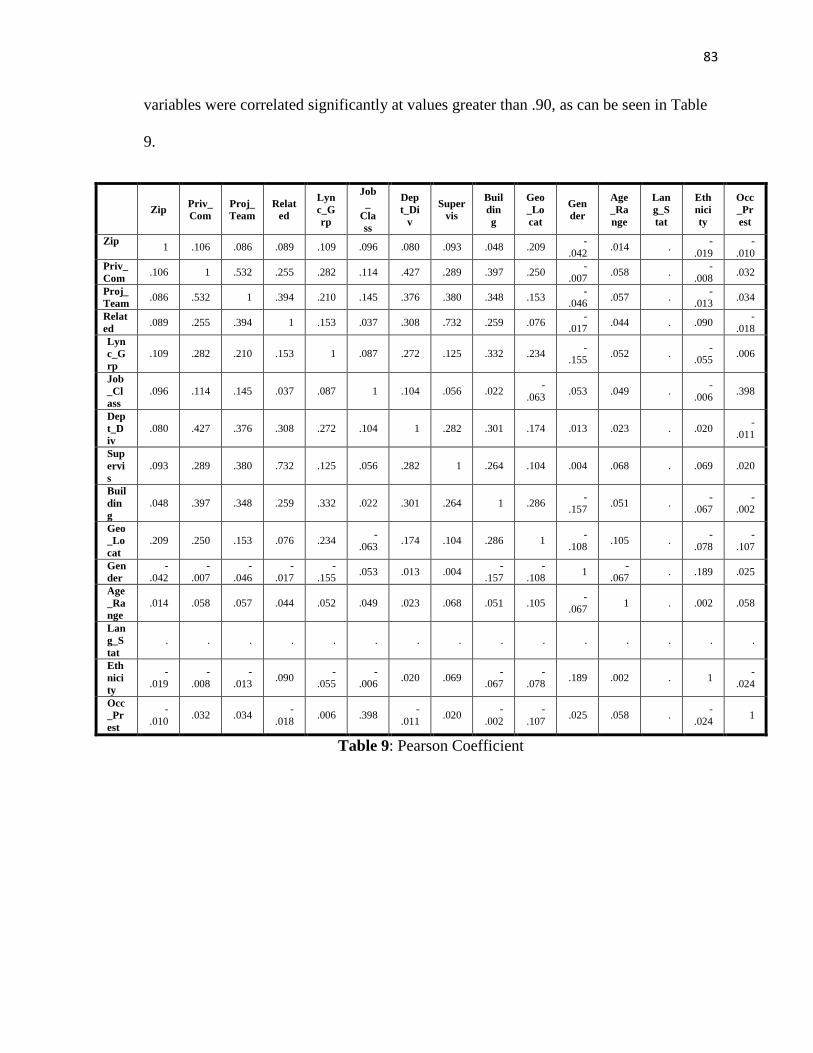
83
variables were correlated significantly at values greater than .90, as can be seen in Table
9.
Zip Priv_Com
Proj_Team
Related
Lync_Grp
Job_
Class
Dept_Di
v
Supervis
Building
Geo_Locat
Gender
Age_Range
Lang_Stat
Ethnicity
Occ_Prest
Zip 1 .106 .086 .089 .109 .096 .080 .093 .048 .209 -.042 .014 . -
.019 -
.010 Priv_Com .106 1 .532 .255 .282 .114 .427 .289 .397 .250 -
.007 .058 . -.008 .032
Proj_Team .086 .532 1 .394 .210 .145 .376 .380 .348 .153 -
.046 .057 . -.013 .034
Related .089 .255 .394 1 .153 .037 .308 .732 .259 .076 -
.017 .044 . .090 -.018
Lync_Grp
.109 .282 .210 .153 1 .087 .272 .125 .332 .234 -.155 .052 . -
.055 .006
Job_Class
.096 .114 .145 .037 .087 1 .104 .056 .022 -.063 .053 .049 . -
.006 .398
Dept_Div
.080 .427 .376 .308 .272 .104 1 .282 .301 .174 .013 .023 . .020 -.011
Supervis
.093 .289 .380 .732 .125 .056 .282 1 .264 .104 .004 .068 . .069 .020
Building
.048 .397 .348 .259 .332 .022 .301 .264 1 .286 -.157 .051 . -
.067 -
.002
Geo_Locat
.209 .250 .153 .076 .234 -.063 .174 .104 .286 1 -
.108 .105 . -.078
-.107
Gender
-.042
-.007
-.046
-.017
-.155 .053 .013 .004 -
.157 -
.108 1 -.067 . .189 .025
Age_Range
.014 .058 .057 .044 .052 .049 .023 .068 .051 .105 -.067 1 . .002 .058
Lang_Stat
. . . . . . . . . . . . . . .
Ethnicity
-.019
-.008
-.013 .090 -
.055 -
.006 .020 .069 -.067
-.078 .189 .002 . 1 -
.024
Occ_Prest
-.010 .032 .034 -
.018 .006 .398 -.011 .020 -
.002 -
.107 .025 .058 . -.024 1
Table 9: Pearson Coefficient
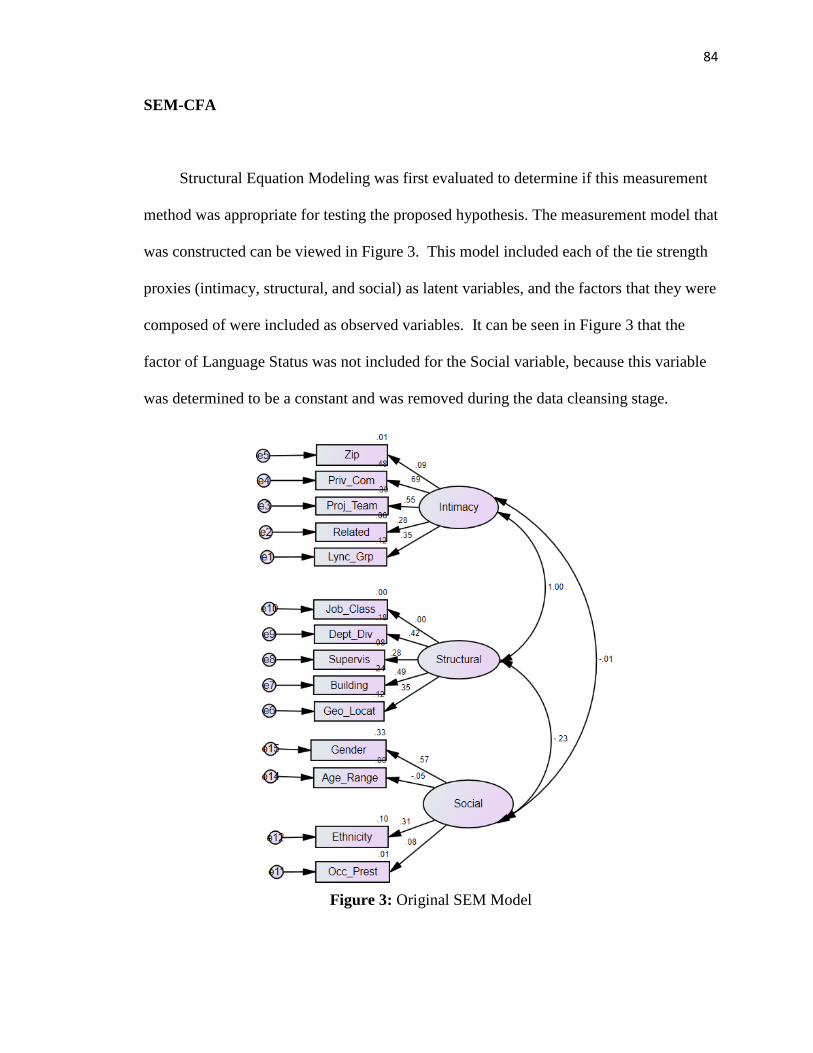
84
SEM-CFA
Structural Equation Modeling was first evaluated to determine if this measurement
method was appropriate for testing the proposed hypothesis. The measurement model that
was constructed can be viewed in Figure 3. This model included each of the tie strength
proxies (intimacy, structural, and social) as latent variables, and the factors that they were
composed of were included as observed variables. It can be seen in Figure 3 that the
factor of Language Status was not included for the Social variable, because this variable
was determined to be a constant and was removed during the data cleansing stage.
Figure 3: Original SEM Model
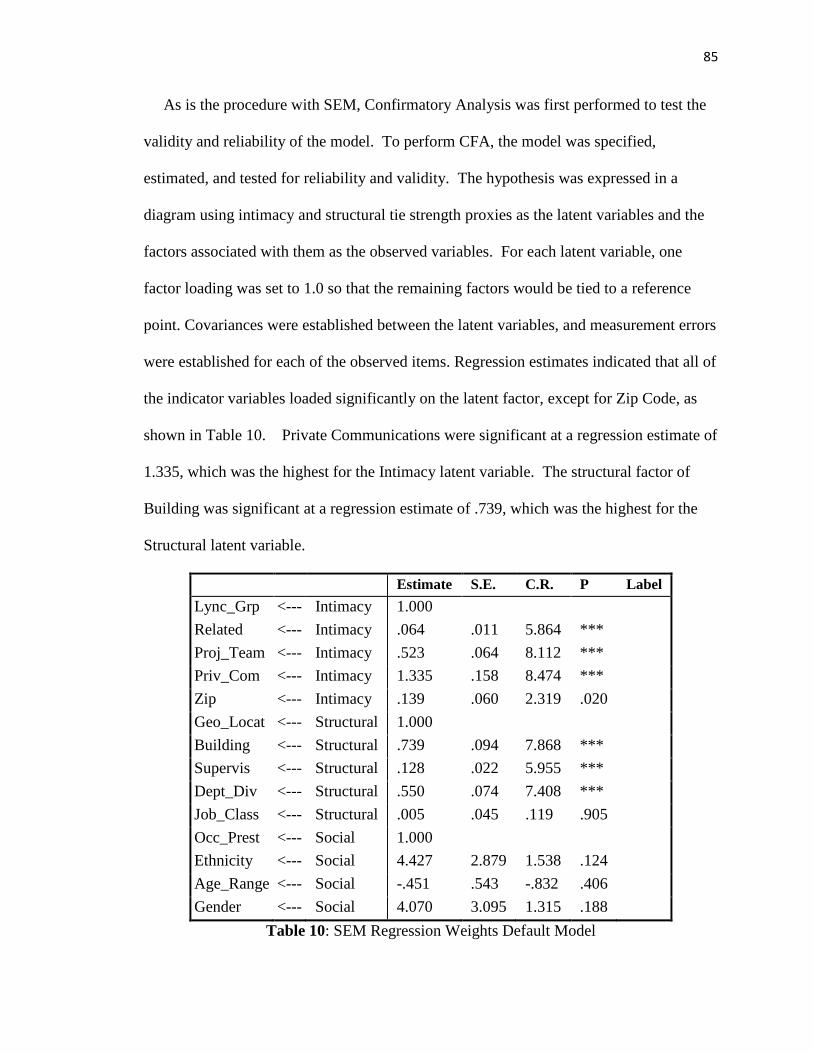
85
As is the procedure with SEM, Confirmatory Analysis was first performed to test the
validity and reliability of the model. To perform CFA, the model was specified,
estimated, and tested for reliability and validity. The hypothesis was expressed in a
diagram using intimacy and structural tie strength proxies as the latent variables and the
factors associated with them as the observed variables. For each latent variable, one
factor loading was set to 1.0 so that the remaining factors would be tied to a reference
point. Covariances were established between the latent variables, and measurement errors
were established for each of the observed items. Regression estimates indicated that all of
the indicator variables loaded significantly on the latent factor, except for Zip Code, as
shown in Table 10. Private Communications were significant at a regression estimate of
1.335, which was the highest for the Intimacy latent variable. The structural factor of
Building was significant at a regression estimate of .739, which was the highest for the
Structural latent variable.
Estimate S.E. C.R. P Label Lync_Grp <--- Intimacy 1.000 Related <--- Intimacy .064 .011 5.864 *** Proj_Team <--- Intimacy .523 .064 8.112 *** Priv_Com <--- Intimacy 1.335 .158 8.474 *** Zip <--- Intimacy .139 .060 2.319 .020 Geo_Locat <--- Structural 1.000 Building <--- Structural .739 .094 7.868 *** Supervis <--- Structural .128 .022 5.955 *** Dept_Div <--- Structural .550 .074 7.408 *** Job_Class <--- Structural .005 .045 .119 .905 Occ_Prest <--- Social 1.000 Ethnicity <--- Social 4.427 2.879 1.538 .124 Age_Range <--- Social -.451 .543 -.832 .406 Gender <--- Social 4.070 3.095 1.315 .188
Table 10: SEM Regression Weights Default Model
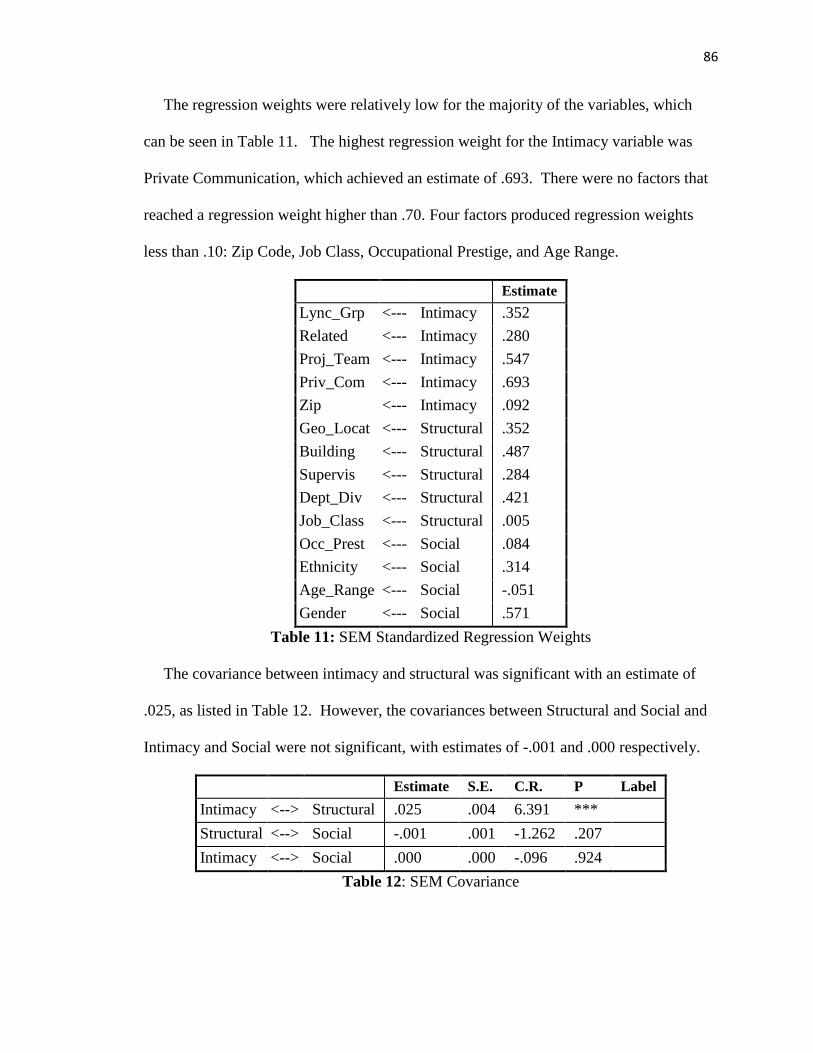
86
The regression weights were relatively low for the majority of the variables, which
can be seen in Table 11. The highest regression weight for the Intimacy variable was
Private Communication, which achieved an estimate of .693. There were no factors that
reached a regression weight higher than .70. Four factors produced regression weights
less than .10: Zip Code, Job Class, Occupational Prestige, and Age Range.
Estimate Lync_Grp <--- Intimacy .352 Related <--- Intimacy .280 Proj_Team <--- Intimacy .547 Priv_Com <--- Intimacy .693 Zip <--- Intimacy .092 Geo_Locat <--- Structural .352 Building <--- Structural .487 Supervis <--- Structural .284 Dept_Div <--- Structural .421 Job_Class <--- Structural .005 Occ_Prest <--- Social .084 Ethnicity <--- Social .314 Age_Range <--- Social -.051 Gender <--- Social .571
Table 11: SEM Standardized Regression Weights
The covariance between intimacy and structural was significant with an estimate of
.025, as listed in Table 12. However, the covariances between Structural and Social and
Intimacy and Social were not significant, with estimates of -.001 and .000 respectively.
Estimate S.E. C.R. P Label Intimacy <--> Structural .025 .004 6.391 ***
Structural <--> Social -.001 .001 -1.262 .207
Intimacy <--> Social .000 .000 -.096 .924
Table 12: SEM Covariance
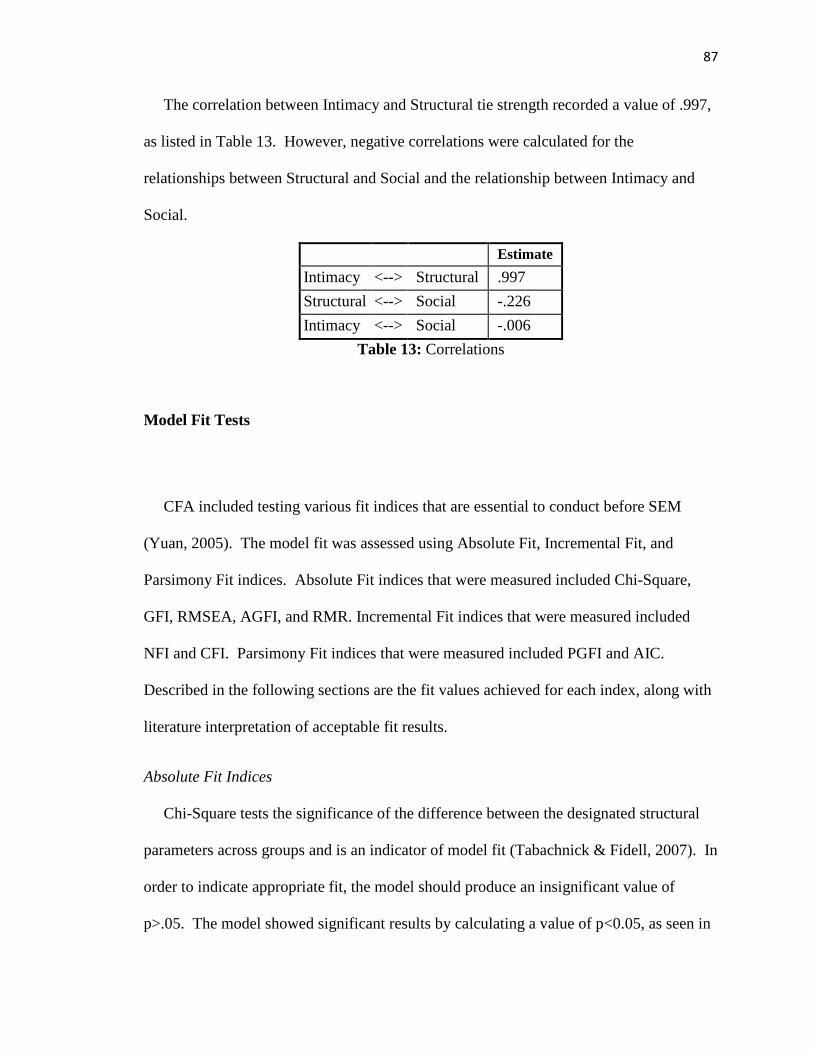
87
The correlation between Intimacy and Structural tie strength recorded a value of .997,
as listed in Table 13. However, negative correlations were calculated for the
relationships between Structural and Social and the relationship between Intimacy and
Social.
Estimate Intimacy <--> Structural .997 Structural <--> Social -.226 Intimacy <--> Social -.006
Table 13: Correlations
Model Fit Tests
CFA included testing various fit indices that are essential to conduct before SEM
(Yuan, 2005). The model fit was assessed using Absolute Fit, Incremental Fit, and
Parsimony Fit indices. Absolute Fit indices that were measured included Chi-Square,
GFI, RMSEA, AGFI, and RMR. Incremental Fit indices that were measured included
NFI and CFI. Parsimony Fit indices that were measured included PGFI and AIC.
Described in the following sections are the fit values achieved for each index, along with
literature interpretation of acceptable fit results.
Absolute Fit Indices
Chi-Square tests the significance of the difference between the designated structural
parameters across groups and is an indicator of model fit (Tabachnick & Fidell, 2007). In
order to indicate appropriate fit, the model should produce an insignificant value of
p>.05. The model showed significant results by calculating a value of p<0.05, as seen in
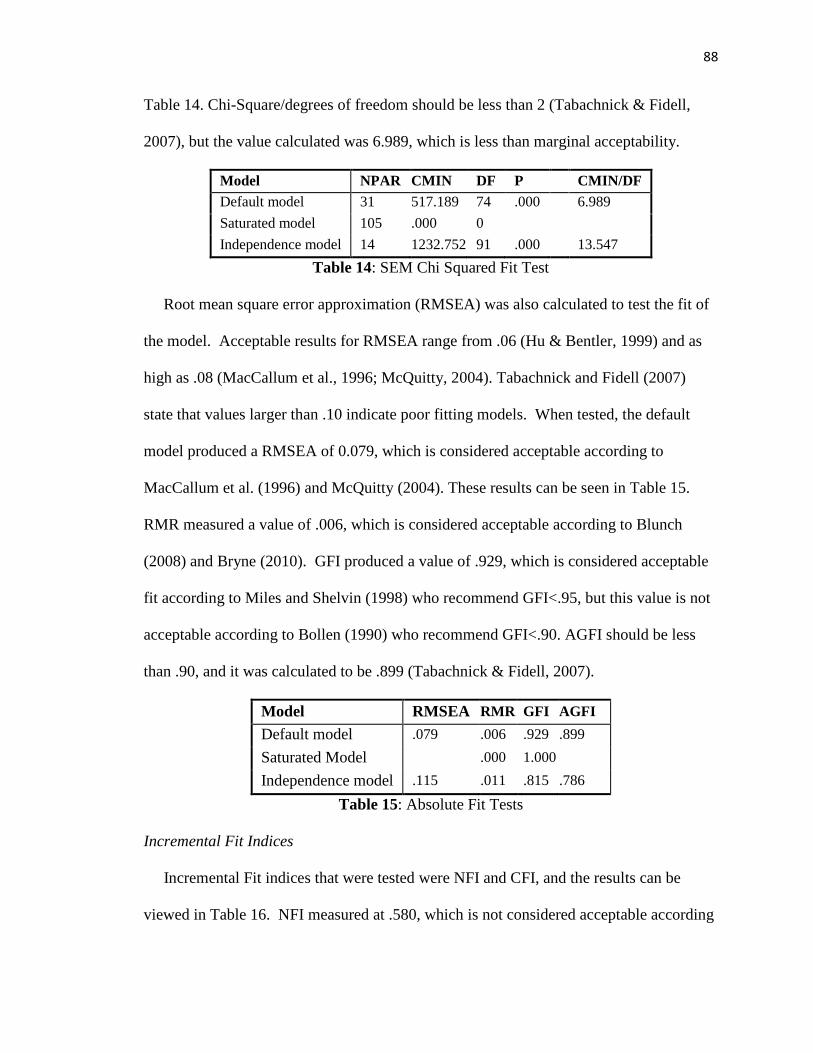
88
Table 14. Chi-Square/degrees of freedom should be less than 2 (Tabachnick & Fidell,
2007), but the value calculated was 6.989, which is less than marginal acceptability.
Model NPAR CMIN DF P CMIN/DF Default model 31 517.189 74 .000 6.989 Saturated model 105 .000 0
Independence model 14 1232.752 91 .000 13.547 Table 14: SEM Chi Squared Fit Test
Root mean square error approximation (RMSEA) was also calculated to test the fit of
the model. Acceptable results for RMSEA range from .06 (Hu & Bentler, 1999) and as
high as .08 (MacCallum et al., 1996; McQuitty, 2004). Tabachnick and Fidell (2007)
state that values larger than .10 indicate poor fitting models. When tested, the default
model produced a RMSEA of 0.079, which is considered acceptable according to
MacCallum et al. (1996) and McQuitty (2004). These results can be seen in Table 15.
RMR measured a value of .006, which is considered acceptable according to Blunch
(2008) and Bryne (2010). GFI produced a value of .929, which is considered acceptable
fit according to Miles and Shelvin (1998) who recommend GFI<.95, but this value is not
acceptable according to Bollen (1990) who recommend GFI<.90. AGFI should be less
than .90, and it was calculated to be .899 (Tabachnick & Fidell, 2007).
Model RMSEA RMR GFI AGFI Default model .079 .006 .929 .899 Saturated Model .000 1.000 Independence model .115 .011 .815 .786
Table 15: Absolute Fit Tests
Incremental Fit Indices
Incremental Fit indices that were tested were NFI and CFI, and the results can be
viewed in Table 16. NFI measured at .580, which is not considered acceptable according
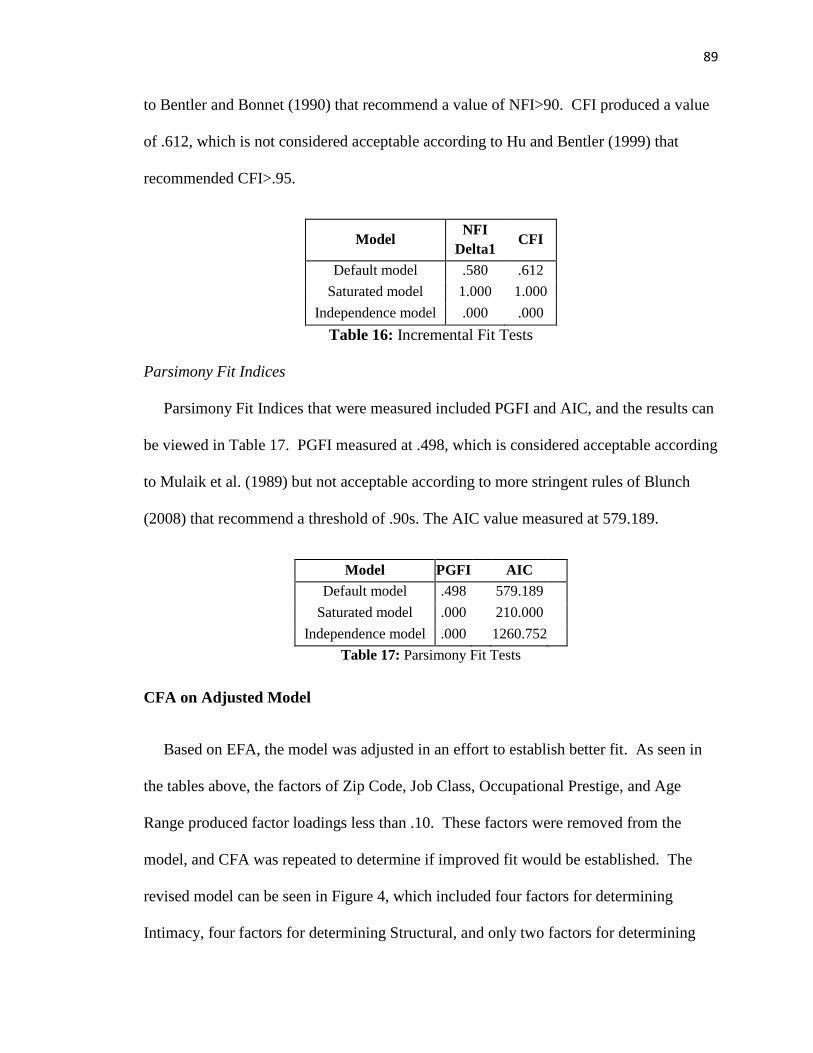
89
to Bentler and Bonnet (1990) that recommend a value of NFI>90. CFI produced a value
of .612, which is not considered acceptable according to Hu and Bentler (1999) that
recommended CFI>.95.
Model NFI Delta1
CFI
Default model .580 .612 Saturated model 1.000 1.000
Independence model .000 .000 Table 16: Incremental Fit Tests
Parsimony Fit Indices
Parsimony Fit Indices that were measured included PGFI and AIC, and the results can
be viewed in Table 17. PGFI measured at .498, which is considered acceptable according
to Mulaik et al. (1989) but not acceptable according to more stringent rules of Blunch
(2008) that recommend a threshold of .90s. The AIC value measured at 579.189.
Model PGFI AIC Default model .498 579.189
Saturated model .000 210.000 Independence model .000 1260.752
Table 17: Parsimony Fit Tests CFA on Adjusted Model
Based on EFA, the model was adjusted in an effort to establish better fit. As seen in
the tables above, the factors of Zip Code, Job Class, Occupational Prestige, and Age
Range produced factor loadings less than .10. These factors were removed from the
model, and CFA was repeated to determine if improved fit would be established. The
revised model can be seen in Figure 4, which included four factors for determining
Intimacy, four factors for determining Structural, and only two factors for determining
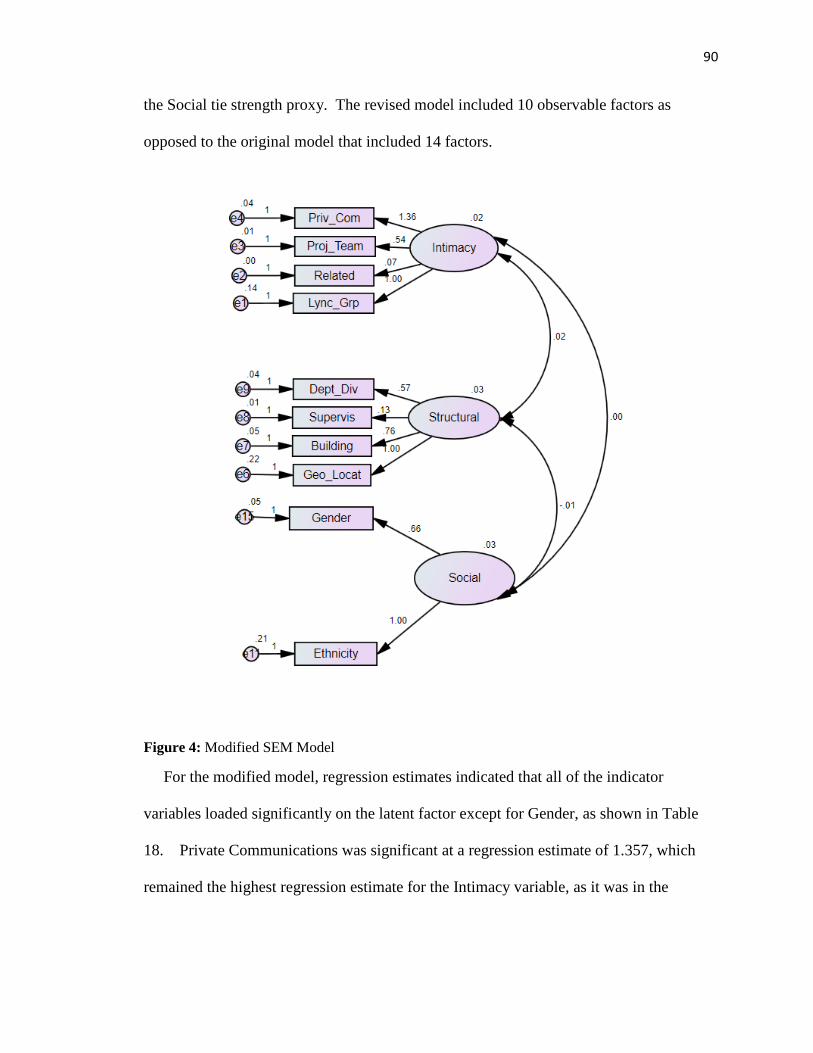
90
the Social tie strength proxy. The revised model included 10 observable factors as
opposed to the original model that included 14 factors.
Figure 4: Modified SEM Model
For the modified model, regression estimates indicated that all of the indicator
variables loaded significantly on the latent factor except for Gender, as shown in Table
18. Private Communications was significant at a regression estimate of 1.357, which
remained the highest regression estimate for the Intimacy variable, as it was in the
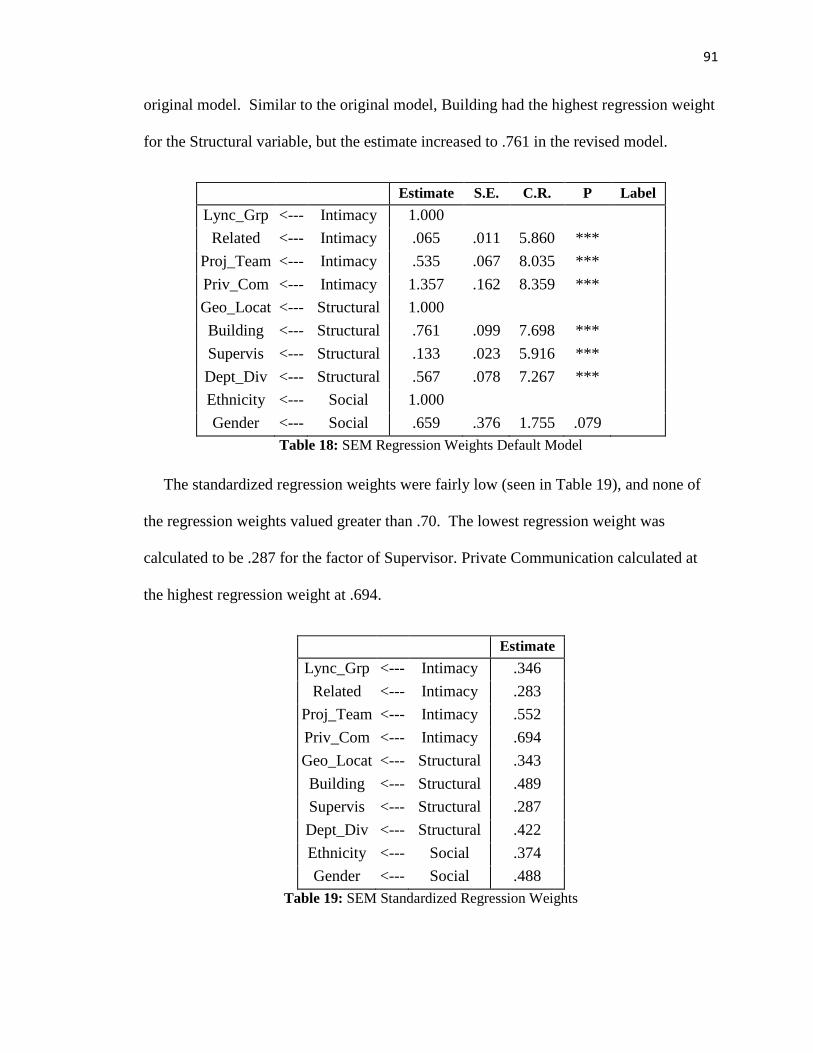
91
original model. Similar to the original model, Building had the highest regression weight
for the Structural variable, but the estimate increased to .761 in the revised model.
Estimate S.E. C.R. P Label Lync_Grp <--- Intimacy 1.000
Related <--- Intimacy .065 .011 5.860 *** Proj_Team <--- Intimacy .535 .067 8.035 *** Priv_Com <--- Intimacy 1.357 .162 8.359 *** Geo_Locat <--- Structural 1.000 Building <--- Structural .761 .099 7.698 *** Supervis <--- Structural .133 .023 5.916 *** Dept_Div <--- Structural .567 .078 7.267 *** Ethnicity <--- Social 1.000 Gender <--- Social .659 .376 1.755 .079
Table 18: SEM Regression Weights Default Model
The standardized regression weights were fairly low (seen in Table 19), and none of
the regression weights valued greater than .70. The lowest regression weight was
calculated to be .287 for the factor of Supervisor. Private Communication calculated at
the highest regression weight at .694.
Estimate Lync_Grp <--- Intimacy .346
Related <--- Intimacy .283 Proj_Team <--- Intimacy .552 Priv_Com <--- Intimacy .694 Geo_Locat <--- Structural .343 Building <--- Structural .489 Supervis <--- Structural .287 Dept_Div <--- Structural .422 Ethnicity <--- Social .374 Gender <--- Social .488
Table 19: SEM Standardized Regression Weights
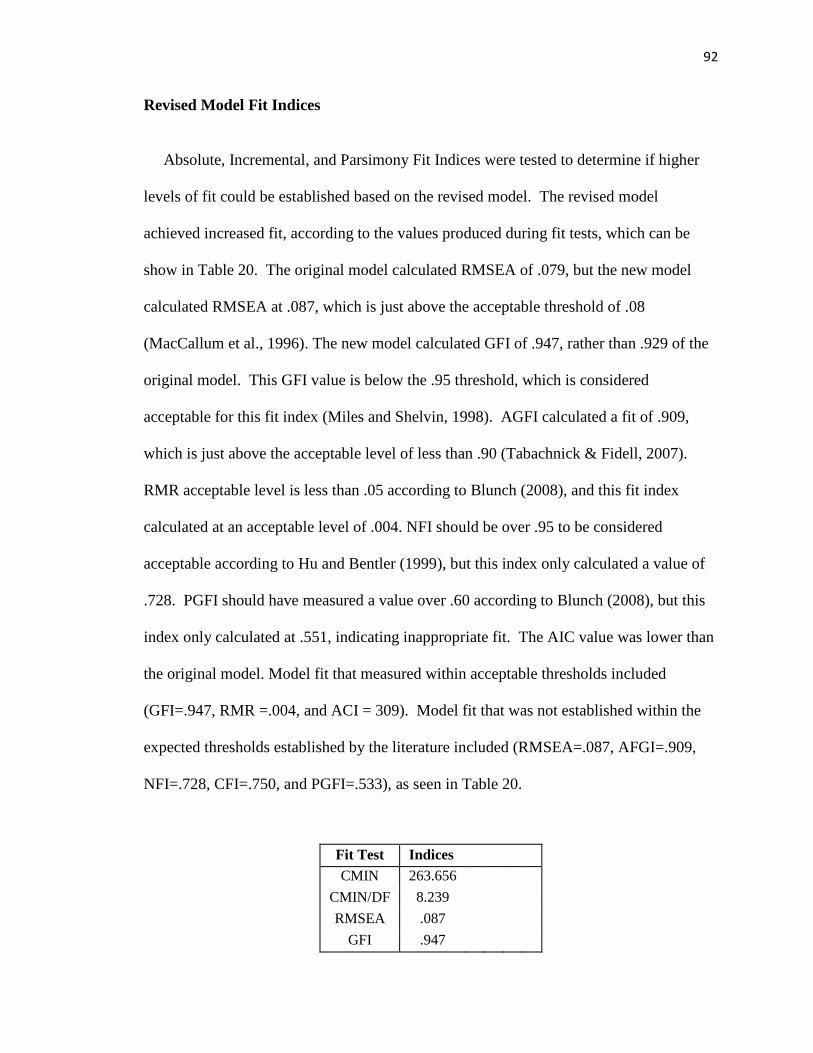
92
Revised Model Fit Indices
Absolute, Incremental, and Parsimony Fit Indices were tested to determine if higher
levels of fit could be established based on the revised model. The revised model
achieved increased fit, according to the values produced during fit tests, which can be
show in Table 20. The original model calculated RMSEA of .079, but the new model
calculated RMSEA at .087, which is just above the acceptable threshold of .08
(MacCallum et al., 1996). The new model calculated GFI of .947, rather than .929 of the
original model. This GFI value is below the .95 threshold, which is considered
acceptable for this fit index (Miles and Shelvin, 1998). AGFI calculated a fit of .909,
which is just above the acceptable level of less than .90 (Tabachnick & Fidell, 2007).
RMR acceptable level is less than .05 according to Blunch (2008), and this fit index
calculated at an acceptable level of .004. NFI should be over .95 to be considered
acceptable according to Hu and Bentler (1999), but this index only calculated a value of
.728. PGFI should have measured a value over .60 according to Blunch (2008), but this
index only calculated at .551, indicating inappropriate fit. The AIC value was lower than
the original model. Model fit that measured within acceptable thresholds included
(GFI=.947, RMR =.004, and ACI = 309). Model fit that was not established within the
expected thresholds established by the literature included (RMSEA=.087, AFGI=.909,
NFI=.728, CFI=.750, and PGFI=.533), as seen in Table 20.
Fit Test Indices CMIN 263.656
CMIN/DF 8.239 RMSEA .087
GFI .947
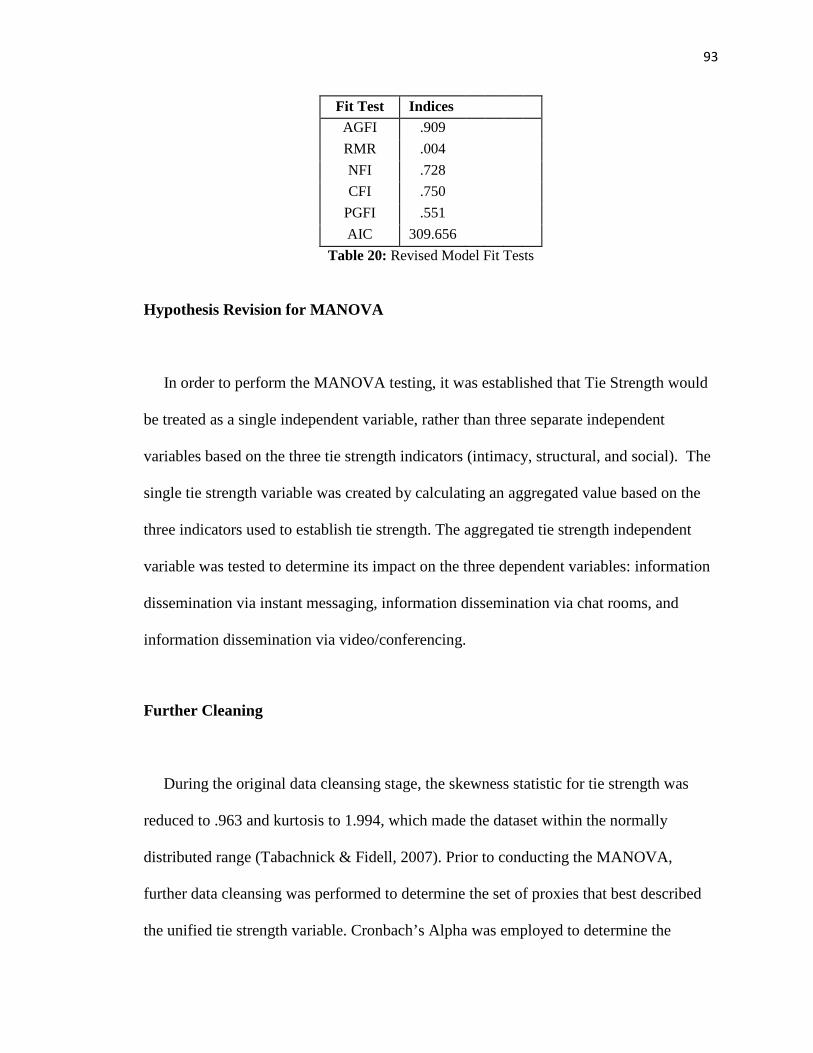
93
Fit Test Indices AGFI .909 RMR .004 NFI .728 CFI .750
PGFI .551 AIC 309.656
Table 20: Revised Model Fit Tests
Hypothesis Revision for MANOVA
In order to perform the MANOVA testing, it was established that Tie Strength would
be treated as a single independent variable, rather than three separate independent
variables based on the three tie strength indicators (intimacy, structural, and social). The
single tie strength variable was created by calculating an aggregated value based on the
three indicators used to establish tie strength. The aggregated tie strength independent
variable was tested to determine its impact on the three dependent variables: information
dissemination via instant messaging, information dissemination via chat rooms, and
information dissemination via video/conferencing.
Further Cleaning
During the original data cleansing stage, the skewness statistic for tie strength was
reduced to .963 and kurtosis to 1.994, which made the dataset within the normally
distributed range (Tabachnick & Fidell, 2007). Prior to conducting the MANOVA,
further data cleansing was performed to determine the set of proxies that best described
the unified tie strength variable. Cronbach’s Alpha was employed to determine the
94
reliability of the measurement scale and decide which variables could be removed from
the study to increase its reliability to an acceptable level of 0.700 (Hair et al., 2005; Kim
et al., 2015). The scale’s reliability was first calculated using the remaining 14 observed
variables. In this initial test, Cronbach Alpha yielded a value of 0.501, which was
relatively weak and did not meet the established criteria of convergent validity. A
possible explanation of the initial low reliability coefficients could be explained in the
work of Petrozci et al. (2007), who received a low reliability value when measuring tie
strength in an online social network using existing tie strength factors determined within
the literature. Petrozci et al. (2007) explained that many of the factors available for
observing tie strength pertained to friendship relationships, but through their analysis
determined that the factors did not carry the same weight within a group setting that was
being measured. Similarly, in the current study, several of the variables used to measure
tie strength were indicators of a close relationship within a friendship network, but they
may not be as effective in measuring a collaborative group.
In order to improve the quality of the reliability of the scale to an acceptable level, the
items of zip code, job class, geographic location, gender, age, language status, ethnicity
and occupational prestige were removed from the scale and excluded from the final
analysis. A new Cronbach Alpha was calculated with the remaining observed variables,
which subsequently produced a cumulative reliability of 0.700, as shown in Table 10. It
was decided that seven indicators (private communication, project team, related, Lync
group, department, supervisor and building) that produced a reliable Cronbach Alpha
would be included in the final analysis, which can be seen in Table 21. Table 22 includes
a Summary of the Item Statistics when performing the final Cronbach Alpha calculation.
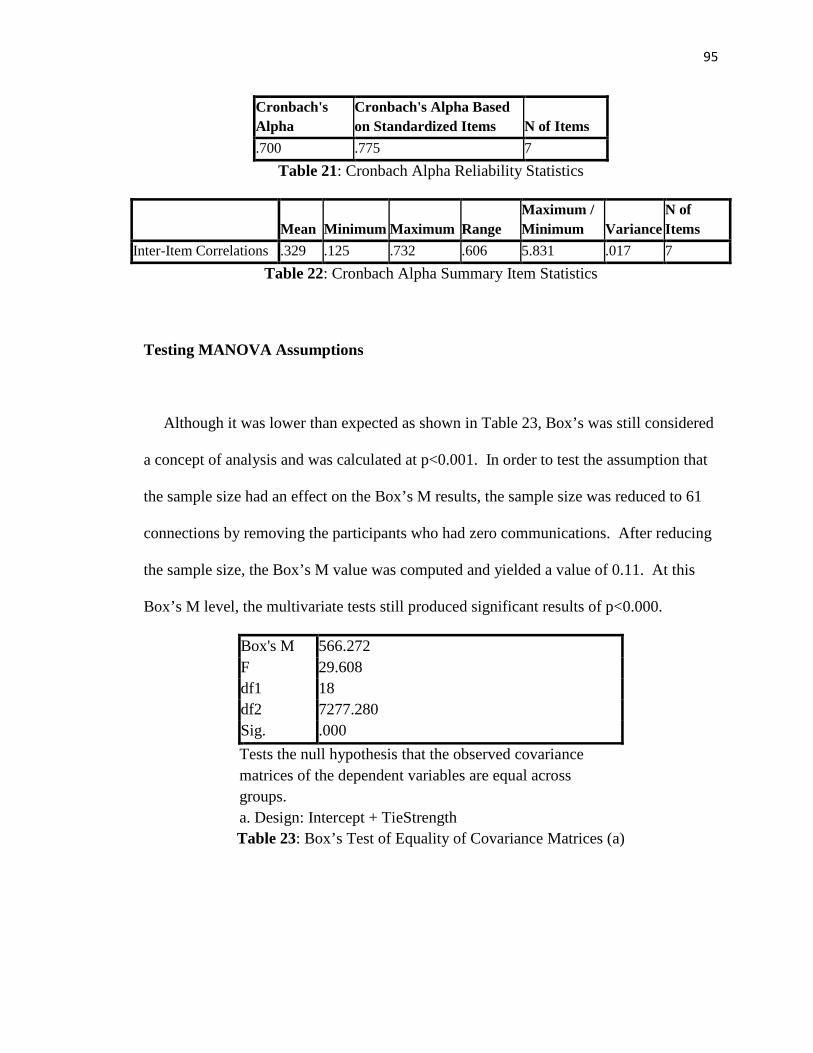
95
Cronbach's Alpha
Cronbach's Alpha Based on Standardized Items N of Items
.700 .775 7 Table 21: Cronbach Alpha Reliability Statistics
Mean Minimum Maximum Range Maximum / Minimum Variance
N of Items
Inter-Item Correlations .329 .125 .732 .606 5.831 .017 7 Table 22: Cronbach Alpha Summary Item Statistics
Testing MANOVA Assumptions
Although it was lower than expected as shown in Table 23, Box’s was still considered
a concept of analysis and was calculated at p<0.001. In order to test the assumption that
the sample size had an effect on the Box’s M results, the sample size was reduced to 61
connections by removing the participants who had zero communications. After reducing
the sample size, the Box’s M value was computed and yielded a value of 0.11. At this
Box’s M level, the multivariate tests still produced significant results of p<0.000.
Box's M 566.272 F 29.608 df1 18 df2 7277.280 Sig. .000 Tests the null hypothesis that the observed covariance matrices of the dependent variables are equal across groups. a. Design: Intercept + TieStrength Table 23: Box’s Test of Equality of Covariance Matrices (a)
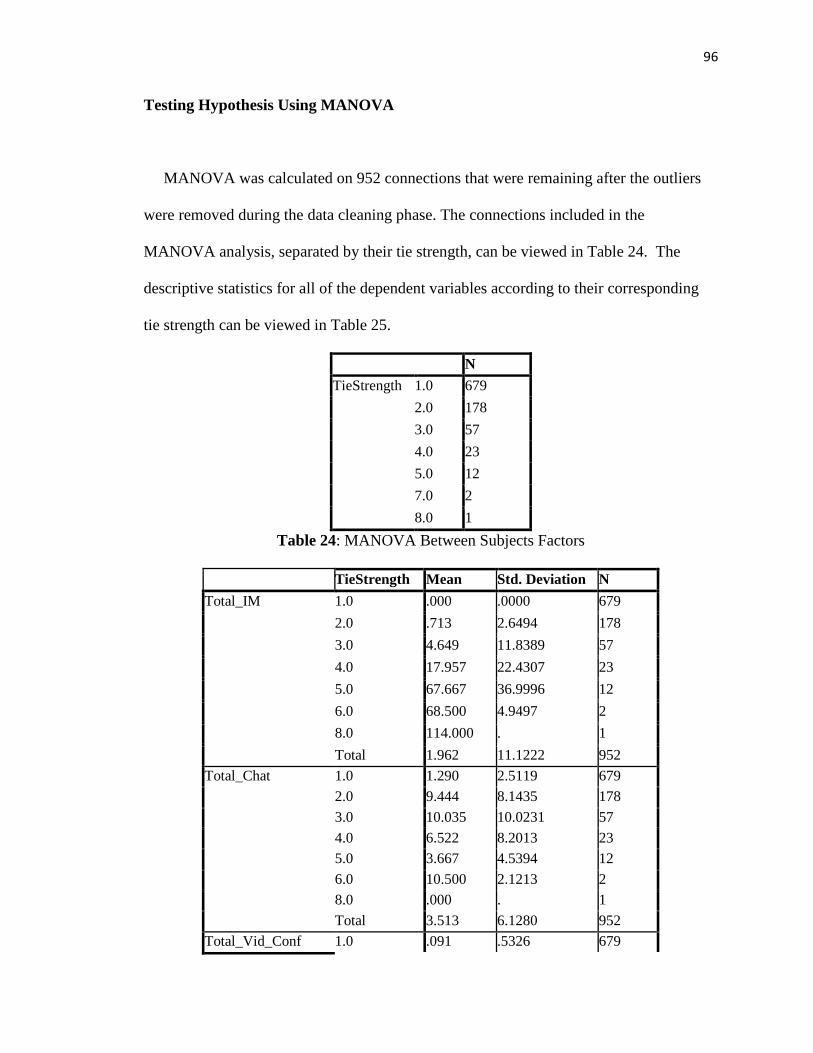
96
Testing Hypothesis Using MANOVA
MANOVA was calculated on 952 connections that were remaining after the outliers
were removed during the data cleaning phase. The connections included in the
MANOVA analysis, separated by their tie strength, can be viewed in Table 24. The
descriptive statistics for all of the dependent variables according to their corresponding
tie strength can be viewed in Table 25.
N TieStrength 1.0 679
2.0 178 3.0 57 4.0 23 5.0 12 7.0 2 8.0 1
Table 24: MANOVA Between Subjects Factors
TieStrength Mean Std. Deviation N Total_IM 1.0 .000 .0000 679
2.0 .713 2.6494 178 3.0 4.649 11.8389 57 4.0 17.957 22.4307 23 5.0 67.667 36.9996 12 6.0 68.500 4.9497 2 8.0 114.000 . 1 Total 1.962 11.1222 952
Total_Chat 1.0 1.290 2.5119 679 2.0 9.444 8.1435 178 3.0 10.035 10.0231 57 4.0 6.522 8.2013 23 5.0 3.667 4.5394 12 6.0 10.500 2.1213 2 8.0 .000 . 1 Total 3.513 6.1280 952
Total_Vid_Conf 1.0 .091 .5326 679
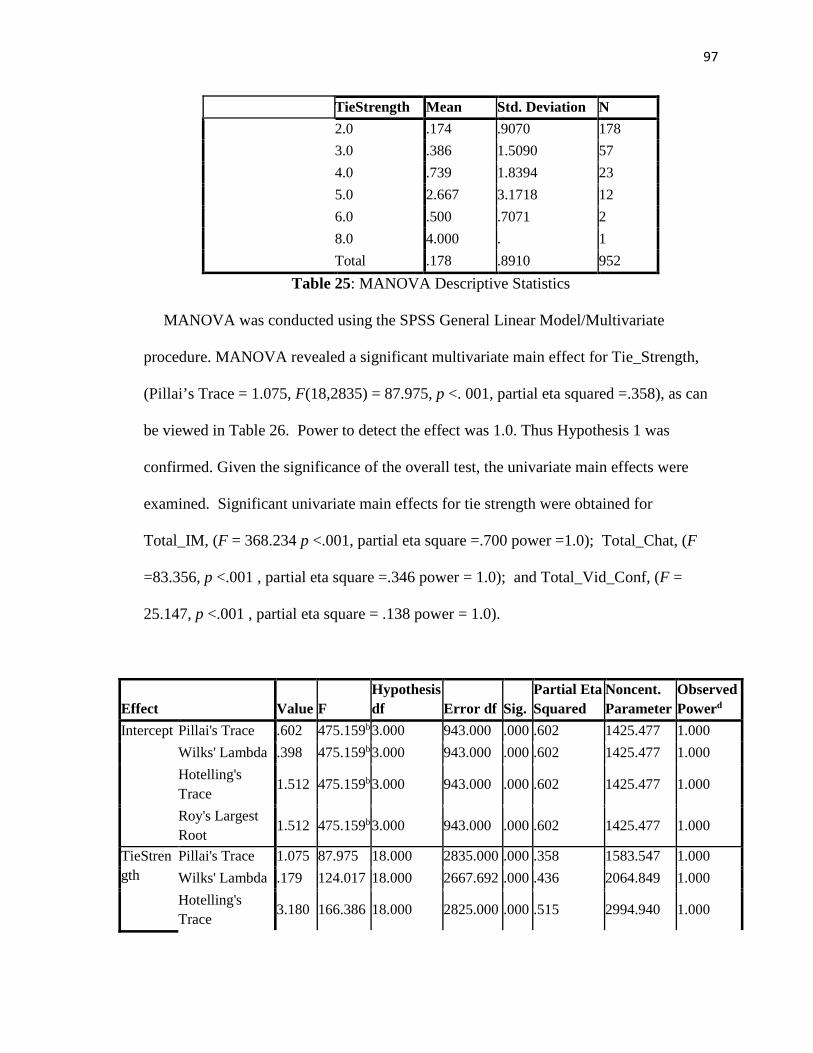
97
TieStrength Mean Std. Deviation N 2.0 .174 .9070 178 3.0 .386 1.5090 57 4.0 .739 1.8394 23 5.0 2.667 3.1718 12 6.0 .500 .7071 2 8.0 4.000 . 1 Total .178 .8910 952
Table 25: MANOVA Descriptive Statistics
MANOVA was conducted using the SPSS General Linear Model/Multivariate
procedure. MANOVA revealed a significant multivariate main effect for Tie_Strength,
(Pillai’s Trace = 1.075, F(18,2835) = 87.975, p <. 001, partial eta squared =.358), as can
be viewed in Table 26. Power to detect the effect was 1.0. Thus Hypothesis 1 was
confirmed. Given the significance of the overall test, the univariate main effects were
examined. Significant univariate main effects for tie strength were obtained for
Total_IM, (F = 368.234 p <.001, partial eta square =.700 power =1.0); Total_Chat, (F
=83.356, p <.001 , partial eta square =.346 power = 1.0); and Total_Vid_Conf, (F =
25.147, p <.001 , partial eta square = .138 power = 1.0).
Effect Value F Hypothesis df Error df Sig.
Partial Eta Squared
Noncent. Parameter
Observed Powerd
Intercept Pillai's Trace .602 475.159b 3.000 943.000 .000 .602 1425.477 1.000 Wilks' Lambda .398 475.159b 3.000 943.000 .000 .602 1425.477 1.000 Hotelling's Trace 1.512 475.159b 3.000 943.000 .000 .602 1425.477 1.000
Roy's Largest Root 1.512 475.159b 3.000 943.000 .000 .602 1425.477 1.000
TieStrength
Pillai's Trace 1.075 87.975 18.000 2835.000 .000 .358 1583.547 1.000 Wilks' Lambda .179 124.017 18.000 2667.692 .000 .436 2064.849 1.000 Hotelling's Trace
3.180 166.386 18.000 2825.000 .000 .515 2994.940 1.000
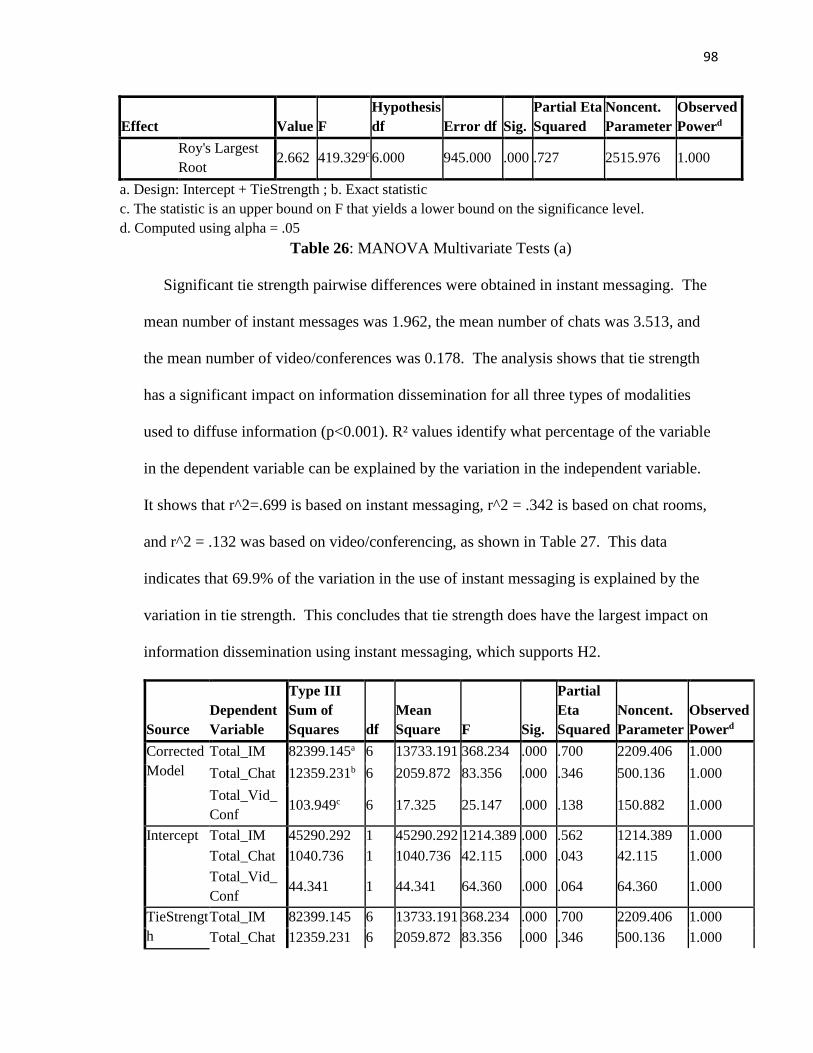
98
Effect Value F Hypothesis df Error df Sig.
Partial Eta Squared
Noncent. Parameter
Observed Powerd
Roy's Largest Root
2.662 419.329c 6.000 945.000 .000 .727 2515.976 1.000
a. Design: Intercept + TieStrength ; b. Exact statistic c. The statistic is an upper bound on F that yields a lower bound on the significance level. d. Computed using alpha = .05
Table 26: MANOVA Multivariate Tests (a)
Significant tie strength pairwise differences were obtained in instant messaging. The
mean number of instant messages was 1.962, the mean number of chats was 3.513, and
the mean number of video/conferences was 0.178. The analysis shows that tie strength
has a significant impact on information dissemination for all three types of modalities
used to diffuse information (p<0.001). R² values identify what percentage of the variable
in the dependent variable can be explained by the variation in the independent variable.
It shows that r^2=.699 is based on instant messaging, r^2 = .342 is based on chat rooms,
and r^2 = .132 was based on video/conferencing, as shown in Table 27. This data
indicates that 69.9% of the variation in the use of instant messaging is explained by the
variation in tie strength. This concludes that tie strength does have the largest impact on
information dissemination using instant messaging, which supports H2.
Source Dependent Variable
Type III Sum of Squares df
Mean Square F Sig.
Partial Eta Squared
Noncent. Parameter
Observed Powerd
Corrected Model
Total_IM 82399.145a 6 13733.191 368.234 .000 .700 2209.406 1.000 Total_Chat 12359.231b 6 2059.872 83.356 .000 .346 500.136 1.000 Total_Vid_Conf 103.949c 6 17.325 25.147 .000 .138 150.882 1.000
Intercept Total_IM 45290.292 1 45290.292 1214.389 .000 .562 1214.389 1.000 Total_Chat 1040.736 1 1040.736 42.115 .000 .043 42.115 1.000 Total_Vid_Conf 44.341 1 44.341 64.360 .000 .064 64.360 1.000
TieStrength
Total_IM 82399.145 6 13733.191 368.234 .000 .700 2209.406 1.000 Total_Chat 12359.231 6 2059.872 83.356 .000 .346 500.136 1.000
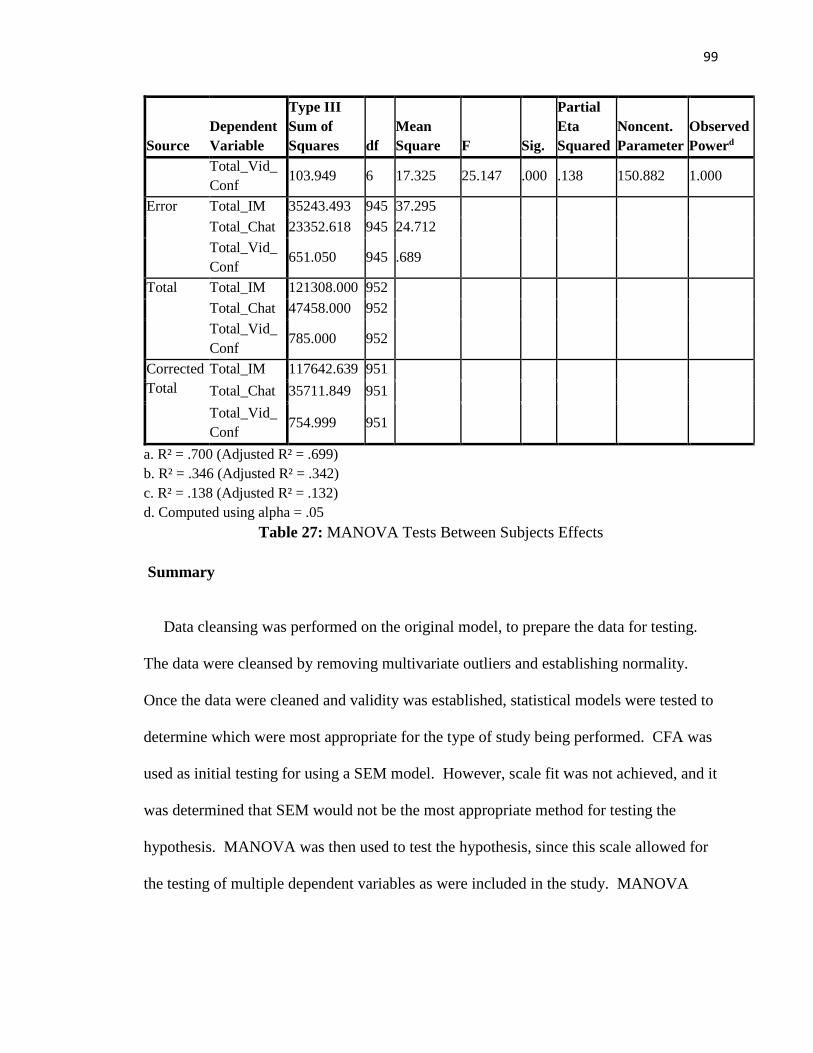
99
Source Dependent Variable
Type III Sum of Squares df
Mean Square F Sig.
Partial Eta Squared
Noncent. Parameter
Observed Powerd
Total_Vid_Conf
103.949 6 17.325 25.147 .000 .138 150.882 1.000
Error Total_IM 35243.493 945 37.295 Total_Chat 23352.618 945 24.712 Total_Vid_Conf
651.050 945 .689
Total Total_IM 121308.000 952 Total_Chat 47458.000 952 Total_Vid_Conf
785.000 952
Corrected Total
Total_IM 117642.639 951 Total_Chat 35711.849 951 Total_Vid_Conf 754.999 951
a. R² = .700 (Adjusted R² = .699) b. R² = .346 (Adjusted R² = .342) c. R² = .138 (Adjusted R² = .132) d. Computed using alpha = .05
Table 27: MANOVA Tests Between Subjects Effects
Summary
Data cleansing was performed on the original model, to prepare the data for testing.
The data were cleansed by removing multivariate outliers and establishing normality.
Once the data were cleaned and validity was established, statistical models were tested to
determine which were most appropriate for the type of study being performed. CFA was
used as initial testing for using a SEM model. However, scale fit was not achieved, and it
was determined that SEM would not be the most appropriate method for testing the
hypothesis. MANOVA was then used to test the hypothesis, since this scale allowed for
the testing of multiple dependent variables as were included in the study. MANOVA

100
revealed significant support to validate both hypotheses. The data gathered and analyzed
are explained in this chapter.
101
Chapter 5
Conclusions, Implications, Recommendations, and Summary
Introduction
Knowledge is an essential asset to an organization, and determining methods for
facilitating knowledge transfer can increase an organization’s ability to maintain a
competitive advantage. Organizations continue to face difficulty instituting internal
collaboration and information sharing (Sayogo and Gil-Garcia, 2014). Previous studies
have evaluated tie strength’s influence on information dissemination within a public
social network (Aral & Walker, 2014; Bakshy et al., 2012). However, studies were
lacking on tie strength’s influence on information dissemination within a collaborative
social network that is subject to organizational constraints. The goal of this study was to
determine the impact of tie strength on information diffusion within a collaborative social
network.
This chapter includes a discussion of the conclusions that were reached as a result of
analysis of the collected data. An overview of limitations is reviewed to offer rationale
for the results obtained. Recommendations for enhancements of the study are proposed
as concepts for future research. Implications for practical use of the results are then
provided to offer insight about how the results can be applied to practice and future
research.
102
Conclusions
H1 Conclusions
In order to address the research questions, data were captured from a live collaborative
network to observe tie strength’s effect on information that was passed between
relationships. Hypothesis 1 was generated to answer the research question of, “How does
tie strength influence the effects of information dissemination within a collaborative
social network?” H1 hypothesized that relationships that exhibit higher levels of tie
strength will disseminate significantly higher levels of information via instant messaging,
chat room and video/conferencing modalities of a collaboration system. To address this
hypothesis, information about each relationship was digitally captured and used to
calculate tie strength, and the amount of information distributed between the connections
was compared to their calculated tie strength.
The testing of H1 resulted in the need to change the measurement model. SEM and
MANOVA were evaluated to determine the best measurement model for testing the
proposed mode. CFA analysis examined which factor model best fit the data (Grimm &
Yarnold, 1995). While factor analysis proved that loadings for the proposed model were
significant for the revised model with cleansed data and variables, CFA model fit
indicated that SEM was not appropriate for the study as it was designed. It was
determined that MANOVA was more effective for testing this model. MANOVA testing
is appropriate when the model involves one or multiple categorical independent variables
(Grimm & Yarnold, 1995).
Since initial conducting of SEM indicated that MANOVA was more appropriate for
testing the H1, H1 was altered to test if a single independent variable influences
103
information dissemination via three communication modalities, each of which would be
treated as dependent variables. MANOVA testing was performed to examine tie strength
as the independent variable and information dissemination via three different modalities
of a collaborative system as the dependent variables. The MANOVA findings showed
that tie strength had a significant impact on information dissemination for instant
messaging, chat, and video/conferencing, which confirms the first hypothesis (H1).
The results support the findings of Petroczi et al. (2007), which established that people
seek support via their strong ties. The data collection reported that people with high tie
strength shared the most amount of information. Connections with the highest tie
strength shared an average of 647 messages. The number of messages shared between
connections was positively related to the relationships’ tie strength.
H2 Conclusions
Hypothesis 2 was generated to answer the research question, “How is the relationship
between tie strength and information dissemination affected by the type of medium being
used within the collaborative network?” H2 hypothesized that relationships that exhibit
higher levels of tie strength will disseminate significantly higher levels of information via
the instant messaging modality. To answer the second research question, the amount of
information distributed within relationships using the three different modalities (instant
messaging, chat rooms and video/conferencing) was captured and compared against the
tie strength for each relationship. The MANOVA results showed significant pairwise
differences in instant messaging. R² showed the percentage of variation in the response
that was explained by the model. R² values identified that almost 70% of the variation in
the use of instant messaging was explained by the variation in tie strength. That analysis
104
confirmed the second hypothesis (H2) by proving that tie strength had the largest impact
on information dissemination using instant messaging.
Tie Strength
The study confirmed factors that can be used to measure tie strength in a collaborative
environment. The tie strength factors used as observed variables were selected from prior
studies that measured tie strength within online relationships (Gilbert, 2012; Luarn &
Chui, 2013). These factors had been adapted from seminal research that collected tie
strength data through surveys and interviews. However, the initial CFA reported that the
factors of zip code, job classification, occupational prestige and age range were not
effective in measuring tie strength in this study. While the factors had been conformed to
evaluate an online environment, the prior studies in which they were used observed
public social networks rather than collaborative environments. Collaborative social
networks pass on information that is more complex in nature, and are subject to different
organizational constraints (Durugbo, 2014). As it was seen in the results from this study,
several of those factors were eliminated from analysis, because they did not prove to be
relevant in the collaborative environment. It is possible that the factors that were
removed were better suited to measure social relationships and were not equipped for
measuring relationships that were more collaborative in nature.
The intimacy and structural proxies proved to be the most effective in measuring tie
strength for this study. The intimacy proxy of tie strength experienced moderate levels of
factor loadings and regression weights, as did the structural proxy. The social proxy
reported the lowest regression weights, and three out of the five factors were eliminated
based on factor analysis. The interaction between the intimacy and structural proxies was
105
significant at an estimate of 0.997, while the interactions between the structural to social
proxies and the intimacy to social proxies were not significant. This study confirmed the
results of Mathews (1998) which concluded that intimacy was the most important factor
explaining variability in tie-strength. The social proxy and the factors used to measure it
should be evaluated further before they are included in future studies regarding tie
strength within organizations.
Limitations
This research contained limitations that may have impacted the validity of the results.
The study was limited in the manner that technological skills were required for
participation. A total 763 relationship connections were removed from the study due to
nonparticipation, and it is not known if technological preferences and skills hindered the
amount of information disseminated, therefore affecting the results of the study. The
cause of non participation is unknown but could be explained by several issues. It is
possible that there were participants not comfortable using technology for
communicating. It is also possible that the non-participants experienced technical
difficulties when using the software. While it was assumed that these relationships did
not disseminate information and were removed from the study, it is not known whether
these relationships disseminated information using other methods, such as phone calls,
email or physical conversation. In future studies, it may be useful to capture technical
issues reported about the system.
106
A large amount of skewness existed in the original data, which may have been due to
the real-time data collection of a random sample. Data cleansing was performed to
remove extreme outliers and establish normality, which resulted in the removal of 36
relationships that accounted for 4153 instant messages, 1051 chat room messages, and
253 video/conferencing messages. While the removal of these relationships increased the
reliability of the scale, they also accounted for removal of a large amount of
communications that were not able to be included in the study for analysis. For example,
one connection that was excluded from the study exhibited a level 6 intimacy tie strength
and exchanged 674 messages. It is not known whether the connections that were removed
could have provided valuable data for the study. In future research, methods to structure
the study to ensure less skewness of data should be considered.
This study was limited in the manner that it was not able to distinguish between
information sharing and knowledge sharing. Albino, Garavelli, and Gorgoglione (2004)
explained that human cognition needs to take place for information to be turned into
knowledge. Prior studies measured knowledge sharing by conducting interviews with
participants to determine how the data were used. In this study, knowledge sharing could
have been measured by determining if the information disseminated was then used to
support decision-making. However, this study did not have a method to determine how
the information was utilized after it was disseminated or whether it was useful for the
decision making process. Therefore, the study was not able to determine if the actual
knowledge was spread, and it was assumed that only information sharing took place.
There was a limitation in the ability to capture data disseminated using the
video/conferencing feature. The content of the video/conferencing transferred between

107
relationships could not be monitored as thoroughly as instant messaging and chat
features. The content of every message sent within individual communications was
captured using the instant messaging feature. However, only the timestamp of the
initiation of the conversation was captured using the video/conferencing feature. As a
result, the video/conferencing modality may not have received an accurate count of
information transferred as did information transferred using the instant messaging and
chat modalities.
Implications
Contributions to Literature
This research furthered the studies that have begun conducting tie strength analysis
within live, online environments. The results indicated that connections that exhibited
the highest levels of tie strength sent the most messages, and connections that had the
lowest levels of tie strength sent the least messages. These results supported the findings
of Luarn and Chui (2015) who stated that individuals with strong ties share more
information. It also reinforced the conclusions of Kim, Lee, and Elias (2015) that
determined that the strength of ties affects information sharing. The research furthered
the conclusions of Casmir et al. (2012) that showed that employees are more willing to
share if there are higher levels of trust.
The chat rooms in this study were similar to an online forum in which people are
contributing information that can be viewed by all. Barker (2015) tracked the use of a
discussion forum to monitor information transfer and determined that knowledge sharing
108
on an online forum is most effective when it is supported by an expert. The current study
followed Barker’s (2015) methodology and inserted an expert into the chat rooms. As a
result, this study supported the results of Barker (2015) by showing that chat room usage
was strong when an expert is inserted.
Scholl and McCarthy (2006) compared the different modalities of a communication
system and concluded that there was a significant preference to using the chat modality.
The data gathered from this study showed that most communication took place utilizing
the instant message modality. As such, the results of this study did not support the work
of School and McCarthy (2006). However, based on the amount of messages that were
exchanged through the system, it supports the research of Bharati et al. (2015) which
stated that social media does facilitate knowledge management efforts in a sense that
information was shared using the system.
The study determined that not all of the factors that can be used to measure tie
strength within a social environment are valuable in measuring tie strength in a
collaborative environment. Since previous tie strength studies had not been conducted in
a collaborative system, this study helped to determine factors that impact tie strength
within a collaborative network rather than a public social network. It was determined
that the factors of zip code, job classification, occupation prestige and age range were not
as effective in measuring tie strength in a collaborative environment and should be
evaluated further if considered in future studies. The study also confirmed several of the
intimacy, social and structural proxies that can be used to measure tie strength in a public
social network as well as a collaborative social network. This information can be used to
109
select tie strength factors for future studies that are evaluating tie strength within
organizational environments.
Due to the limitations of the data collection, the content of video/conferencing
communications was not recorded. Therefore, the study was not able to verify the work
of Biehl, Avrahami, and Dunnigan (2015) who tested the effects of video conferencing in
information sharing. The knowledge transfer process requires that information be
created, stored/retrieved, transferred and applied Alavi and Leidner (2001). This study
was missing the ability to determine how the information was applied. Since the study
was not able to distinguish between knowledge sharing and information sharing, the
results were not able to support the findings of Hansen (1999) that explained that strong
ties transfer more complex knowledge.
Seminal studies relied on gathering tie strength data from surveys and interviews
(Friedkin, 1982; Granovetter, 1973; Hansen, 1999). Recent studies have relied on data
collection from public social media system, which is more closely related to chat room
communication than the one-to-one communication provided within instant messaging
(Bakshy et al., 2012; Rejeb-Khachlouf et al., 2011; Wei & Bu, 2014; Zhou et al., 2010).
The current study captured real-time data from a live collaboration environment without
relying on subjective participant interpretation to determine the amount of information
that was transmitted through the system and to determine the strength of relationship ties.
The study validated a new method for observing organization transfer of information and
measuring content of data shared within messages.
110
Practical Application
Studies have shown that transferring knowledge within an organization presents a
competitive advantage (Reagans & McEvily, 2003). Since the results confirm that
stronger tie strength contributes to a greater amount of information transfer, the results
help an organization understand that focusing efforts on increasing the closeness of
relationships can be effective in the efforts to help increase information dissemination.
This suggests that encouraging stronger relationships within a collaborative setting can
help an organization expand their dissemination of information.
Companies are investing in technology to share information (Bharati, Zhang &
Chaudhury, 2015). In particular, social media technology is increasingly being inserted
into organizations (Bughin et al., 2012). These systems promote social interaction, which
is essential for promoting knowledge exchange (Bakshy, et al., 2012; Wei & Bu, 2014).
The implementation of these technology platforms can result in a significant investment
to a company, so it is helpful to determine their usefulness before implementation. It is
important to understand the preparation that should take place to ensure effective use of
the system. The results showed that the strength of relationships should be evaluated as
part of the planning process for implementing these systems. Since collaborative systems
have proven to be effective in distributing knowledge, it is useful to determine how
organizations can make the most use of them to get the most effect. The study confirms
that tie strength is an indicator of system use, and therefore can establish a measurement
of when to invest in collaboration systems.
111
Recommendations
Recommendations for Practice
The research determined that tie strength can influence information dissemination.
Evaluating the tie strength proxies that exist within an organization can be effective in
measuring the success of a collaboration system. The results showed that the intimacy
proxy provides a measure of system use. The usage of the system could possibly be
increased if efforts are made to enhance closeness within relationships. In particular, the
research showed that instant messaging was effective when the intimacy proxy of tie
strength was high within relationships. Chui et al. (2014) explained that tie strength
might be the cause of certain network behavior. Organizations seeking to increase
information sharing through the use of a collaborative system should take measures to
strengthen internal closeness of relationships.
Since the communication was only monitored through an online system, this study
relied on people that were comfortable using the technology system to communicate.
When evaluating the number of participants who were removed from the study due to
lack of participation, it confirmed that efforts to enhance training on use of the system
might be beneficial to enhance information dissemination. It is not possible to know
whether lack of use of the system hindered the information dissemination that could have
taken place. To accommodate for the possible lack of use due to technological
constraints, the study confirmed that more training efforts should be put in place to
ensure effective use of the system and decrease technical barriers.
112
The research demonstrated that tie strength has a positive effect on information
dissemination via a collaboration system. This supports the findings Bharati et al. (2015)
who explain that social media also promote higher levels of organizational knowledge
quality. Organizations should engage resources to begin incorporating these systems to
increase knowledge management efforts. However, the study also uncovered barriers to
usage of the collaboration system, which therefore hindered their effectiveness. Efforts
should be made to ensure that users are technologically skilled in using an online
collaborative system, so that the full benefits can be realized.
Future Research
This study did not have the ability to distinguish between knowledge and information
transfer. A future study can be conducted within a controlled environment to test
subjects on the content of the information that was disseminated and determine how the
information was processed by the recipient and if it was used for decision-making. A
survey instrument or test can be incorporated to determine the type of information that
was received through the system and establish if actual knowledge was passed. A
process could also be incorporated to test the quality and usefulness of the information
that was passed through the system.
Lin and Lo (2015) determined that a person’s position in a network can play a factor
in knowledge sharing, and someone with a higher position might have greater influence.
This study did not measure how a participant’s position in the hierarchy of the
organization played a role in information sharing. Future studies can add this as a
moderating variable to determine the influence it will have on information sharing.
113
In future studies, rather than only including random relationships, the study can be
modified with a purposive sample that includes specific relationships with equal and
varying amounts of tie strength. The skewness of the data called for many connections to
be removed from the study, including connections that contained a high number of
communications. A purposive sample could allow for the communication between
relationships to be more evenly distributed, and could result in more relevant data
collection for a richer sample. Several users were removed due to lack of participation,
and it is not known if technological factors played a role in their inability to use the
system. A purposive sample could include people with equal levels of technological
skills to reduce the number of non-participating members. The study can also be
analyzed by certain groups, such as age.
This study showed how information from training was disseminated throughout a
company. It would be beneficial to revise the study to determine at what point the
information stopped being spread or slowed down. This could help an organization
schedule training sessions or identify how often a topic needs to be revisited through
training. The study can also be revised to determine how tie strength increases over time.
Data from the collaborative system can be collected to determine if the system plays a
role in increasing tie strength within relationships over a period of time. The effect of
organizational culture can also be analyzed.
Collaboration systems include additional modalities than those included in this study
(instant messaging, chat rooms, and video conferencing/presenting), and the functionality
of these technological systems continue to grow. Future research should incorporate more
modalities from a collaborative system, to compare their effectiveness in information
114
dissemination. Conducting research that has the ability to add the cutting edge modalities
can help organizations determine which new technology is worth implementing for
knowledge management success.
This study was conducted internally on one single company. New collaboration
systems offer the capability of being configured to communicate with external parities.
Future studies can incorporate external subjects to determine how tie strength can affect
information dissemination through collaborative systems between organizations and the
company and their clients. This can help determine if tie strength can have an effect on
information dissemination with people outside the organization that are sharing
information within a collaborative and non-social setting.
The video conferencing modality did not record the conversations taking place,
therefore there was a limitation in determining the effectiveness of this modality’s ability
to transfer information. Biehl, Avrahami and Dunnignan (2015) performed a study in
which they were able to monitor participants’ contributions during video conferencing.
Perhaps that methodology can be applied to a future study to monitor more accurately the
video portion and determine its effectiveness in transferring information and its
relationship to tie strength.
Summary
Knowledge sharing within an organization adds economic and social value (Mura,
2013). However, knowledge transfer within an organization remains challenging (Peng,
2013; Wang et al., 2015). Organizations are investing in technology systems to aid in the
knowledge transfer process. As organizations invest more in collaborative system
115
(Hharati, Zhang, & Chuaudhury, 2015), it is important to understand the factors that
influence information transfer within a collaborative network.
This study aimed to answer the research questions, “How does tie strength influence
the effects of information dissemination within a collaborative social network?” and
“How is the relationship between tie strength and information dissemination affected by
the type of medium being used within the collaborative network?” The goal of the
research was to test tie strength’s effect on information dissemination and to determine
which modality of a collaborative system was affected by tie strength.
A literature review was performed to examine comparative studies and determine the
most appropriate method for measuring tie strength within a collaborative network.
The work of Lin and Lo (2015) explained that knowledge sharing is a social process
affected by social motivational factors. The seminal work of Granovetter (1973)
provided a basis of measuring tie strength as a relationship factor that can be measured to
determine its role in information sharing. Bakshy et al. (2012) explained that stronger
ties increase the probability of information sharing. Bharati et al. (2015) determined that
using social media promotes organizational efforts in knowledge management. Studies
have shown that tie strength affects information dissemination in a public social network
(Bakshy et al., 2012; Hansen, 1999). Social media platforms have many of the same
characteristics as collaborative technology system.
The current study argued that tie strength can be a determining factor of information
dissemination within a collaborative social network. It was hypothesized:
116
• H1: Relationships that exhibit higher levels of tie strength will disseminate
significantly higher levels of information via instant messaging, chat room and
video/conferencing modalities of a collaboration system.
• H2: Relationships that exhibit higher levels of tie strength will disseminate
significantly higher levels of information via the instant messaging modality of a
collaboration system
The hypotheses were tested by collecting data within a live organization to determine
the effect of tie strength on information dissemination within a collaborative network.
Current studies, including Aral and Walker (2014) and Bakshy et al. (2012) that tested tie
strength in a collaborative setting were evaluated to determine methodologies for
evaluating tie strength. The proxies of intimacy, social distance and structural variables
were used to measure tie strength. Data were collected over a period of one year to
analyze the communications of 1,749 connections gathered from 68 users. After data
cleansing to remove outliers and establish normality, a total of 986 connections were
included in the study, which resulted in 6,021 relevant instant messages, 4,395 chat
communications, and 422 video communications. Data were also aggregated to
determine the tie strength of each relationship.
Tie strength was compared with the communication data collected to analyze if tie
strength affected information sharing. AMOS was first used to test the model using
SEM, but analysis determined that SEM was not the appropriate method for testing the
proposed model. They hypotheses were modified and MANOVA testing was
successfully used to evaluate the proposed model.
117
The results confirmed both hypothesis through MANOVA testing, which concluded
that tie strength does have a positive impact on information dissemination, and the
modality of instant messaging is most affected by the level of tie strength within a
relationship. The study confirmed the results of previous research that indicated that tie
strength does contribute to information sharing (Casmir et al., 2012; Kim, Lee, & Elias,
2015; Luarn & Chui, 2015).
The study contributed to literature by confirming factors that can be used to measure
tie strength within a collaborative environment, therefore improving the measurement
instrument for tie strength. The study supported previous literature and applied it to a
collaborative environment by confirming that people seek support via their strong ties,
even within organizations. The study established a method for collecting tie strength data
from a collaborative system without relying on the use of surveys or interviews.
The study also provided practical contributions for organizations. It confirmed that
increasing tie strength efforts within an organization can be an effective in increasing
information dissemination via a collaborative system. It also proposed that before
investing in the implementation of a collaborative system, efforts should be made to
increase closeness within relationships and provide appropriate training to increase the
amount of information transferred.
The main limitation of the study was the inability to distinguish between knowledge
and information sharing. Roberts (2000) explains that knowledge is the productive use of
information. However, this study did not have a method of determining how or if the
information was put into practice or applied.
118
Future studies can incorporate a purposive sample to include relationships with equal
amounts of tie strength and technological skills to reduce the skewness of data collected.
Methods can be incorporated to capture communication through all modalities, including
video conferencing, to be able to fully determine the information being transferred
through the system. A future study could incorporate follow-up with those involved in
the study to determine if knowledge was transferred instead of just information. A test
can be administered to determine the usefulness of the information that was transferred
between relationships. This study can also be performed on other companies to determine
if the results can be replicated. Future studies can incorporate external relationships to
determine the effectiveness on clients and customers. The study can also be revised to
determine how the collaborative systems can effect tie strength over a period of time.
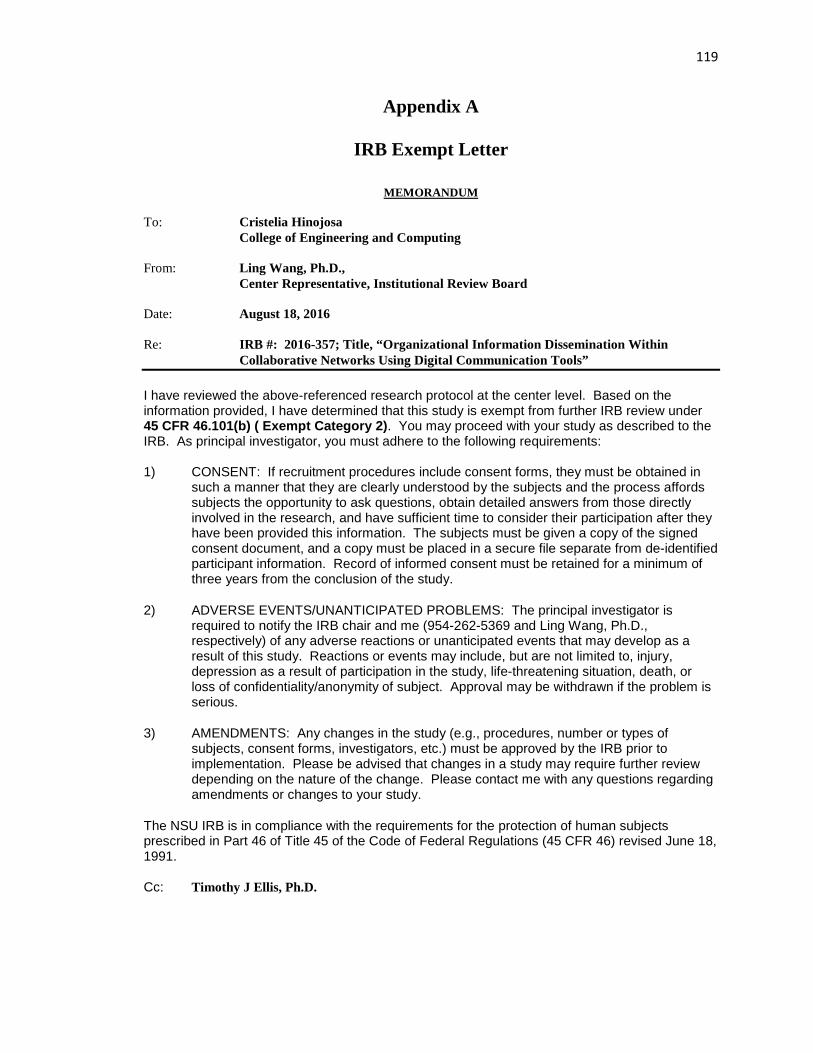
119
Appendix A
IRB Exempt Letter
MEMORANDUM To: Cristelia Hinojosa College of Engineering and Computing From: Ling Wang, Ph.D., Center Representative, Institutional Review Board Date: August 18, 2016 Re: IRB #: 2016-357; Title, “Organizational Information Dissemination Within
Collaborative Networks Using Digital Communication Tools” I have reviewed the above-referenced research protocol at the center level. Based on the information provided, I have determined that this study is exempt from further IRB review under 45 CFR 46.101(b) ( Exempt Category 2). You may proceed with your study as described to the IRB. As principal investigator, you must adhere to the following requirements: 1) CONSENT: If recruitment procedures include consent forms, they must be obtained in
such a manner that they are clearly understood by the subjects and the process affords subjects the opportunity to ask questions, obtain detailed answers from those directly involved in the research, and have sufficient time to consider their participation after they have been provided this information. The subjects must be given a copy of the signed consent document, and a copy must be placed in a secure file separate from de-identified participant information. Record of informed consent must be retained for a minimum of three years from the conclusion of the study.
2) ADVERSE EVENTS/UNANTICIPATED PROBLEMS: The principal investigator is required to notify the IRB chair and me (954-262-5369 and Ling Wang, Ph.D., respectively) of any adverse reactions or unanticipated events that may develop as a result of this study. Reactions or events may include, but are not limited to, injury, depression as a result of participation in the study, life-threatening situation, death, or loss of confidentiality/anonymity of subject. Approval may be withdrawn if the problem is serious.
3) AMENDMENTS: Any changes in the study (e.g., procedures, number or types of subjects, consent forms, investigators, etc.) must be approved by the IRB prior to implementation. Please be advised that changes in a study may require further review depending on the nature of the change. Please contact me with any questions regarding amendments or changes to your study.
The NSU IRB is in compliance with the requirements for the protection of human subjects prescribed in Part 46 of Title 45 of the Code of Federal Regulations (45 CFR 46) revised June 18, 1991. Cc: Timothy J Ellis, Ph.D.
120
References
Adali, S., Sisenda, F., Magdon-Ismail, M. (2012). Actions speak louder than words: Predicting relationships from social behavior data. Proceedings of the 21st International Conference on World Wide Web (pp.689-698). Lyon, France: ACM.
Agnihotri, R., & Troutt, M.D. (2008). The effective use of technology in personal knowledge management: A framework of skills, tools, and user context. Online Information Review, 33(2), 2009, 329-342.
Akaike, H. (1974). A new look at the statistical model identification. IEEE Transactions on Automatic Control, 19(6), 716-723.
Alavi, M., & Leidner, D. E. (2001). Review: Knowledge management and knowledge management systems: Conceptual foundations and research issues. MIS Quarterly, 25(1), 107-136.
Albino, V., Garavelli, A.C., and Gorgoglione,M. (2004). Organization and technology in knowledge transfer. Benchmarking: An International Journal, 11(6), 584 – 600.
Amayah, A., (2013). Determinants of knowledge sharing in a public sector organization. Journal of Knowledge Management, 17(3), 454-471.
Aral, S. & Walker, D. (2014). Tie Strength, Embeddedness, and Social Influence: A Large-Scale Networked Experiment, Management Science, 60(6), 1352–1370.
Bakshy, E., Eckles, D., Yan, R., & Rosenn, I. (2012). Social influence in social advertising: Evidence from field experiments. Proceedings of the 13th ACM Conference on Electronic Commerce (pp. 146-161). New York, NY: ACM.
Bakshy, E., Karrer, B., & Adamic, L.A. (2011). Social influence and the diffusion of user-created content. Proceedings of the Tenth ACM Conference on Electronic Commerce (pp.325-334). Hong Kong: ACM.
Bakshy, E., Marlow, C., Rosenn, I., & Adamic, L. (2012). The role of social networks in information diffusion. Proceedings of the 2012 Session on Information Diffusion in Social Networks (pp. 519-528). Lyon, France: ACM.
Barker, R. (2015). Management of knowledge creation and sharing to create virtual knowledge-sharing communities: A tracking study. Journal of Knowledge Management, 19(2), 334-350.
Barrett, P. (2007). Structural equation modelling: Adjudging model fit. Personality and Individual Differences, 42(5), 815-824.
Bentler, P. M., & Bonett, D. G. (1980). Significance tests and goodness of fit in the analysis of covariance structures. Psychological Bulletin, 88(3), 588.
Biehl, J. T., Avrahami, D., & Dunnigan, A. (2015, February). Not really there: Understanding embodied communication affordances in team perception and participation. In Proceedings of the 18th ACM Conference on Computer Supported Cooperative Work & Social Computing (pp. 1567-1575). ACM.
121
Bharati, P., Zhang, W., & Chaudhury, A. (2015). Better knowledge with social media? Exploring the roles of social capital and organizational knowledge management. Journal of Knowledge Management, 19(3), 456-475.
Blau, I., Weiser, O., & Eshet-Alkalai, Y. (2016, June). Face-to-face versus one-way and two-way videoconferencing: How medium naturalness and personality traits influence achievement and perceived learning?. In Information Systems and Technologies (CISTI), 2016 11th Iberian Conference on (pp. 1-3). IEEE.
Blunch, N. (2012). Introduction to structural equation modeling using IBM SPSS statistics and AMOS. Sage.
Bollen, K. A. (1990). Overall fit in covariance structure models: two types of sample size effects. Psychological Bulletin, 107(2), 256.
Boudreau, M., Loch, K. D., Robey, D., & Straud, D. (1998). Going Global: Using information technology to advance the competitiveness of the virtual transnational organization. Academy Of Management Executive, 12(4), 120-128.
Bughin, J., Chui, M., & Manyika, J. (2012). Capturing business value with social technologies. McKinsey Quarterly, 4(1), 72-80.
Byrne, B. M. (2013). Structural equation modeling with LISREL, PRELIS, and SIMPLIS: Basic concepts, applications, and programming. Psychology Press.
Casmir, G., Lee, K., & Loon, M. (2012). Knowledge sharing: Influences of trust, commitment and cost. Journal of Knowledge Management, 16(5), 740-753.
Chandra, R., Iyer, R. S., & Raman, R. (2015). Enabling organizations to implement smarter, customized social computing platforms by leveraging knowledge flow patterns. Journal of Knowledge Management, 19(1), 95-107.
Chiu, T., Chen, C., Joung, Y., Chen, S. (2014). A study of blog networks to determine online social network properties from the tie strength perspective. Online Information Review, 38(3), 381 – 398.
Cohen, J., Cohen, P., West, S. G., & Aiken, L. S. (1983). Applied multiple regression/correlation for the behavioral sciences. Routledge.
Correia, P., Medina, I., Romo, Z., & Contreras-Espinosa, R. (2014). The importance of Facebook as an online social networking tool for companies. International Journal of Accounting and Information Management, 22(4), 295-320.
Cummings, J.N. (2004). Work groups, structural diversity, and knowledge sharing. Management Science, 50(3), 352-364.
Del Giudice, M., Peruta, M., & Maggioni, V. (2015). A model for the diffusion of knowledge sharing technologies inside private transport companies. Journal of Knowledge Management, 19(30), 611-625.
Daft, R.L., & Lengel, R.H. (1986). Organizational information requirements, media richness and structural design. Management Science, 32(5), 554.
122
Donate, M. (2011). Organizational factors to support knowledge management and innovation. Journal of Knowledge Management, 15(6), 890-914.
Dulipovici, A. & Vieru, D. (2015). Exploring collaboration technology use: How users’ perceptions twist and amend reality. Journal of Knowledge Management, 19(4), 1-37.
Durugbo, C. (2014). Managing information for collaborative networks. Industrial Management & Data Systems, 114(8), 1207-1228.
Fang, S.C., Yang, C.W., & Hsu, W.Y. (2013). Inter-organizational knowledge transfer: The perspective of knowledge governance. Journal of Knowledge Management, 17(6), 943-957.
Friedkin, N.E. (1982). Information flow through strong and weak ties in intraorganizational social networks. Social Networks, 3(4), 273-285.
Gera, R. (2012). Bridging the gap in knowledge transfer between academia and practitioners. International Journal of Educational Management, 26(3), 252-273.
Gilbert, E. & Karaholios, K. (2009). Predicting tie strength with social media. CHI 2009. Boston Massachusetts: ACM.
Gilbert, E. (2012). Predicting tie strength in new medium. CSCW’12 (pp. 1-10). Seattle, Washington: ACM.
Gold, A. H., Malhotra, A., & Segars, A. H. (2001). Knowledge management: An organizational capabilities perspective. Journal of Management Information Systems, 18(1), 185-214.
Granovetter, M. (1973). The strength of weak ties. American Journal of Sociology, 78(6), 1360-1380.
Gressgård, L. J. (2011). Virtual team collaboration and innovation in organizations. Team Performance Management, 17(1), 102-119.
Gressgård, L. (2014). Knowledge exchange systems usage: The importance of content contribution and application in distributed environments. Journal of Knowledge Management, 18(2), 5 – 15.
Grimm, L. G., & Yarnold, P. R. (1995). Reading and understanding multivariate statistics. American Psychological Association.
Gupte, M., & Eliassi-Rad. T. (2012). Measuring tie strength in implicit social networks. Proceedings of the 4th Annual ACM Web Science Conference. New York, NY: ACM.
Hair, J., Black, B., Babin, B., Anderson, R. and Tatham, R. (2005), Multivariate Data Analysis, 6th ed. New York: Prentice Hall.
Hansen, M. (1999). The search-transfer problem: The role of weak ties in sharing knowledge across organizational subunits. Administrative Science Quarterly, 44(1), 82-105.
Harris, R. J. (2001). A primer of multivariate statistics. Psychology Press.
Haythornthwaite, C. (1996). Social network analysis: An approach and technique for the study of information exchange. Library & Information Science Research, 18(4), 323-342.
123
He, Y., Zhang, C., & Ji, Y. (2012). Principle Features for Tie Strength Estimation in Micro-blog Social Network. Proceedings of the 2012 IEEE 12th International Conference on Computer and Information Technology (359-367). Washington, DC: IEEE.
Hedgebeth, D. (2007). Making use of knowledge sharing technologies. VINE, 37(1), 49-55.
Hendriks, P. (1999). Why share knowledge? The influence of ICT on the motivation for knowledge sharing. Knowledge and Process Management, 6(2), 91-100.
Hooper, D., Coughlan, J., & Mullen, M. (2008). Structural equation modelling: Guidelines for determining model fit. Articles, 2.
Houghton, D.J. & Joinson, A.N. (2010). Privacy, Social Network Sites, and Social Relations. Journal of Technology in Human Services, 28(1-2), 74-94.
Hu, L. T., & Bentler, P. M. (1999). Cutoff criteria for fit indexes in covariance structure analysis: Conventional criteria versus new alternatives. Structural equation modeling: a multidisciplinary journal, 6(1), 1-55.
Jöreskog, K. G. (1993). Testing structural equation models. Sage Focus Editions, 154, 294-294.
Kane, G. C., & Fichman, R. G. (2009). The shoemaker's children: using wikis for information systems teaching, research, and publication. MIS Quarterly, 1-17.
Kankanhalli, A., Tan, B., & Wei, K. (2005). Contributing knowledge to electronic knowledge repositories: An empirical investigation. MIS Quarterly, 29(1), 113-143.
Kim, J., Lee, C., & Elias, T. (2015). Factors affecting information sharing in social networking sites amongst university students: Application of the knowledge-sharing model to social networking sites. Online Information Review, 39(3), 290-309.
Kirschman, J. S., and Greenstein, J. S. 2002. The use of groupware for collaboration in distributed student engineering design team. Journal of Engineering Education, 91(4), 403-407.
Krackhardt, D. (1992). The strength of strong ties: The importance of philos in organizations. Networks and organizations: Structure, form, and action, 216, 239.
Kozlowski, S. W., & Doherty, M. L. (1989). Integration of climate and leadership: Examination of a neglected issue. Journal of Applied Psychology, 74(4), 546.
Levin, D.Z., & Cross, R. (2004). The strength of weak ties you can trust: The mediating role of trust in effective knowledge transfer. Management Science, 50(11), 1477-1490.
Levy, M. (2013). Stairways to heaven: Implementing social media in organizations. Journal of Knowledge Management, 17(5), 741-754.
Lin, C. (2007). To share or not to share: Modeling tacit knowledge sharing, its mediators and antecedents. Journal of Business Ethics, 70(4), 411-428.
Lin, S., & Lo, L. (2015). Mechanisms to motivate knowledge sharing: Integrating the reward systems and social network perspectives. Journal of Knowledge Management, 19(2), 212-235.
124
Luarn, P. & Chiu, Y. (2015). Key variables to predict tie strength on social network sites. Internet Research, 25(2), 218 – 238.
MacCallum, R. C., Browne, M. W., & Sugawara, H. M. (1996). Power analysis and determination of sample size for covariance structure modeling. Psychological Methods, 1(2), 130.
Mathews, K. M., White, M. C., Long, R. G., Soper, B., & Von Bergen, C. W. (1998). Association of indicators and predictors of tie strength. Psychological Reports, 83(3 suppl), 1459-1469.
Marsden, P., & Campbell, K. (1984). Measuring tie strength. Social Forces, 63(2), 482-501.
McDonald, R. P., & Ho, M. H. R. (2002). Principles and practice in reporting structural equation analyses. Psychological Methods, 7(1), 64.
McGrath, S. (2014, June). Microsoft Lync opens up unified communications market. Retrieved from http://www.computerweekly.com/feature/Microsoft-Lync-opens-up-unified-communications-market.
McQuitty, S. (2004). Statistical power and structural equation models in business research. Journal of Business Research, 57(2), 175-183.
Miao, G., Tao, S. Cheng, W., Moulic, R., Moser, L., Lo, D., & Yan, X. (2012). Understanding task-driven information flow in collaborative networks. Proceedings of the 21st International Conference on World Wide Web (pp. 849-858). New York, NY: ACM.
Miles, J., & Shevlin, M. (2007). A time and a place for incremental fit indices. Personality and Individual Differences, 42(5), 869-874.
Mpofu, M.C., & Watkins-Mathys, L. (2011). Understanding ICT adoption in the small firm sector in Southern Africa. Journal of Systems and Information Technology, 13(2), 179-199.
Mudambi, R. (2002). Knowledge management in multinational firms. Journal of International Management, 8(1), 1-9.
Mulaik, S. A., James, L. R., Van Alstine, J., Bennett, N., Lind, S., & Stilwell, C. D. (1989). Evaluation of goodness-of-fit indices for structural equation models. Psychological Bulletin, 105(3), 430.
Mura, M., Lettieri, E., Radaelli, G., & Spiller, N. (2013). Promoting professionals' innovative behaviour through knowledge sharing: The moderating role of social capital. Journal of Knowledge Management, 17(4), 527-544.
Muthen, B. (1984). A general structural equation model with dichotomous, ordered categorical, and continuous latent variable indicators. Psychometrika, 49(1), 115-132.
Nicholson, S. (2002). Socialization in the “virtual hallway”: Instant messaging in the asynchronous Web-based distance education classroom. Internet and Higher Education, 5(2002), 363-372.
Nonaka, I. (1994). A Dynamic Theory of Organizational Knowledge Creation. Organization Science, 5(1), 14-37.
Nunnally, J. C. (1978). Psychometric theory. Mc Graw-Hill Publ Co. New York.
125
O'reilly, T. (2007). What is Web 2.0: Design patterns and business models for the next generation of software. Communications & Strategies, (1), 17.
Ou, C. X., Davison, R. M., & Wong, L. H. (2016). Using interactive systems for knowledge sharing: The impact of individual contextual preferences in China. Information & Management, 53(2), 145-156.
Panahi, S., Watson, J., & Partridge, H. (2012). Towards tacit knowledge sharing over social web tools. Journal of Knowledge Management, 17(3), 379.397.
Petroczi, A., Nepusz, T., & Bazso, F. (2007). Measuring tie-strength in virtual social networks. Connections, 27(2), 39-52.
Peng, H. (2013). Why and when do people hide knowledge? Journal of Knowledge Management, 17(3), 398-415.
Ranucci, R.A, & Souder, D. (2015). Facilitating tacit knowledge transfer: routine compatibility, trustworthiness, and integration of M&As. Journal of Knowledge Management, 19(2), 257-276.
Reagans, R., & McEvily, B. (2003). Network Structure and Knowledge Transfer: The Effects of Cohesion and Range. Administrative Science Quarterly, 48(2), 240-267.
Rejeb-Khachlouf, N., Mezghani, L., & Quelin, B. (2011). Personal networks and knowledge transfer in inter-organizational networks. Journal of Small Business and Enterprise Development, 18(2), 278-297.
Rice, R. E. (1992). Task analyzability, use of new media, and effectiveness: A multi-site exploration of media richness. Organization Science, 3(4), 475-500.
Roberts, J. (2000). From know-how to show-how? Questioning the role of information and communication technologies in knowledge transfer. Technology Analysis & Strategic Management, 12(4), 429-443.
Saito, K., Kimura, M., & Motoda, H. (2013). Detecting changes in information diffusion patters over social networks. ACM Transactions on Intelligent Systems and Technology, 4(3), 55:1-55:23.
Sayogo, D. S., & Gil-Garcia, J. R. (2014). Understanding the determinants of success in inter-organizational information sharing initiatives: results from a national survey. In Proceedings Of The 15th Annual International Conference On Digital Government Research (pp. 100-109). ACM.
Shalizi, C.R. & Tomas, A.C. (2011). Homophily and contagion are generically confounded in observational social network studies. Sociological Methods and Research, 40(2), 211-239.
Shannon, C.E. and Weaver, W (1972). The mathematical theory of communication, University of Illinois press, Urbana, IL.
Scholl, J., McCarthy, J., & Harr, R. (2006, November). A comparison of chat and audio in media rich environments. In Proceedings of the 2006 20th anniversary conference on Computer supported cooperative work (pp. 323-332). ACM.
Singh, S. (2012). Big Data Analytics. 2012 International Conference on Communication, Information, and Computing Technology (pp. 1-4). Mumbai, India: IEEE.
126
Skrondal, A., & Rabe‐Hesketh, S. (2005). Structural equation modeling: categorical variables. John Wiley & Sons, Ltd.
Steeg, G., & Galstyan, A. (2012). Information transfer in social media. Proceedings of the 21st international conference on World Wide Web (pp 509-518). ACM.
Steffes, E., & Burgee, L.E. (2009). Social ties and online word of mouth. Internet Research, 19(1), 42-59.
Steiger, J. H. (2007). Understanding the limitations of global fit assessment in structural equation modeling. Personality and Individual Differences, 42(5), 893-898.
Sung, S., Na, O., Lee, H., & Chang, H. (2015, August). A Case Study on ICT Collaboration Performance in Automobile Business. In Proceedings of the 17th International Conference on Electronic Commerce 2015 (p. 26). ACM.
Tabachnick, B. G., & Fidell, L. S. (2007). Using multivariate statistics, 5th. Needham Height, MA: Allyn & Bacon.
Taylor, A., Morris, G., Tieman, J., Currow, D., Kidd, M., & Carati, C. (2016). Can video conferencing be as easy as telephoning?—A home healthcare case study. E-Health Telecommunication Systems and Networks, 5(01), 8.
Teece, D. J. (1998). Capturing value from knowledge assets: The new economy, markets for know-how, and intangible assets. California Management Review, 40(3), 55-79.
Terrell, S. R. (2012). Statistics translated: A step-by-step guide to analyzing and interpreting data. Guilford Press.
Wang, D., Wen, Z., Tong, H., Lin, C., Song, C., & Barabási, A. (2011). Information spreading in context. In Proceedings of the 20th international conference on World wide web (WWW '11) (pp. 735-744). New York, USA: ACM.
Wang, S., & Noe, R.A. (2010). Knowledge sharing: A review and directions for future research. Human Resource Management Review, 20(2), 115-131.
Wang, X., Clay, P., & Forsgren, N. (2015). Encouraging knowledge contribution in IT support: Social context and the differential effects of motivation type. Journal of Knowledge Management, 19(2), 315-333.
Wei, J. & Bu, B. (2014). The process of crisis information dissemination: Impacts of the strength of ties in social networks. Kybernetes, 43(2), 178-191.
Wheaton, B., Muthen, B., Alwin, D. F., & Summers, G. F. (1977). Assessing reliability and stability in panel models. Sociological Methodology, 8(1), 84-136.
Wu, B., & Zhang, C. (2015). Trust evaluation for inter-organizational knowledge sharing via the e-learning community. Electronic Library, 33(3), 400-416.
Van den Hooff, B. & Ridder, J.A. (2004). Knowledge sharing in the context: The influence of organizational commitment, communication climate and CMC use on knowledge sharing. Journal of Knowledge Management, 8, 117-130.
Yuan, K. H. (2005). Fit indices versus test statistics. Multivariate Behavioral Research, 40(1), 115-148.
127
Zhang, X., & Jiang, J. Y. (2015). With whom shall I share my knowledge? A recipient perspective of knowledge sharing. Journal of Knowledge Management, 19(2), 277-295.
Zhou, S., Siu, F., & Wang, M. (2010). Effects of social tie content on knowledge transfer. Journal of Knowledge Management, 14(3), 449 – 463.
Zhou, T. (2011). Understanding online community user participation: A social influence perspective. Internet Research, 21(1), 67 – 81.
128
The Graduate School of Computer and Information Sciences
Certification of Authorship of Doctoral Course Directed Research Assignment
Dissertation Report
Submitted to (Professor’s Name): Dr. Timothy Ellis
Student’s Name: Cristelia Z. Hinojosa
Date of Submission: 3/24/2017
Purpose and Title of Submission: Dissertation Report
Certification of Authorship: I hereby certify that I am the author of this document and that any assistance I received in its preparation is fully acknowledged and disclosed in the document. I have also cited all sources from which I obtained data, ideas, or words that are copied directly or paraphrased in the document. Sources are properly credited according to accepted standards for professional publications. I also certify that this paper was prepared by me for this purpose.
Student's Signature: Cristelia Z. Hinojosa__________________________________