organizational redesign, information technologies …ftp.iza.org/dp3612.pdforganizational redesign,...
TRANSCRIPT
IZA DP No. 3612
Organizational Redesign, Information Technologiesand Workplace Productivity
Benoit DostieRajshri Jayaraman
DI
SC
US
SI
ON
PA
PE
R S
ER
IE
S
Forschungsinstitutzur Zukunft der ArbeitInstitute for the Studyof Labor
July 2008
Organizational Redesign, Information
Technologies and Workplace Productivity
Benoit Dostie HEC Montréal, CIRANO, CIRPÉE
and IZA
Rajshri Jayaraman ESMT Berlin
Discussion Paper No. 3612 July 2008
IZA
P.O. Box 7240 53072 Bonn
Germany
Phone: +49-228-3894-0 Fax: +49-228-3894-180
E-mail: [email protected]
Any opinions expressed here are those of the author(s) and not those of IZA. Research published in this series may include views on policy, but the institute itself takes no institutional policy positions. The Institute for the Study of Labor (IZA) in Bonn is a local and virtual international research center and a place of communication between science, politics and business. IZA is an independent nonprofit organization supported by Deutsche Post World Net. The center is associated with the University of Bonn and offers a stimulating research environment through its international network, workshops and conferences, data service, project support, research visits and doctoral program. IZA engages in (i) original and internationally competitive research in all fields of labor economics, (ii) development of policy concepts, and (iii) dissemination of research results and concepts to the interested public. IZA Discussion Papers often represent preliminary work and are circulated to encourage discussion. Citation of such a paper should account for its provisional character. A revised version may be available directly from the author.
IZA Discussion Paper No. 3612 July 2008
ABSTRACT
Organizational Redesign, Information Technologies and Workplace Productivity*
Using a large longitudinal, nationally representative workplace-level dataset, we explore the productivity gains associated with computer use and organizational redesign. The empirical strategy involves the estimation of a production function, augmented to account for technology use and organizational design, correcting for unobserved heterogeneity. We find large returns associated with computer use. We also find that computer use and organizational redesign may be complements or substitutes in production, and that the productivity gains associated with organizational redesign are industry-specific. JEL Classification: D20, L20, M54, O33 Keywords: productivity, workplace practices, linked employer-employee data,
information technologies Corresponding author: Benoit Dostie Institute of Applied Economics HEC Montréal 3000, chemin de la Côte-Sainte-Catherine Montréal, H3T 2A7 Canada E-mail: [email protected]
* We gratefully acknowledge comments from seminar participants in Berlin, Munich, Verona, Vienna, Bayreuth, and Valencia, as well as financial support from the Social Sciences and Humanities Research Council of Canada through the Initiatives on the New Economy program and HEC Montréal.
1 Introduction
After a 2 decade lull, productivity in the U.S. and Canada picked up con-
siderably between 1995-2000. In the U.S., for example, business sector labor
productivity grew at an average annual rate of 2.6 % from 1996-2000 compared
to 1.5 % from 1987-1995 . Analogous figures for Canada over the same peri-
ods were 2.2% and 1.0%, respectively.1 Using a growth accounting exercise,
Jorgensen and Stiroh (2000) and Oliner and Sichel (2000) argued prominently
that this could be attributed to increased investment in information technolo-
gies (IT), which led to a direct increase in the productivity of the IT sector
and a larger indirect increase in productivity in those industries which invested
(most heavily) in IT.
The productivity explosion in the first 5 years of the millenium has largely
vindicated this view (Jorgensen, Ho, and Stiroh (2006)). However, there are at
least two reasons to believe that IT cannot be the full story. First, the sustained
productivity growth in the first 5 years of this century has been accompanied by
a collapse in IT investment. Second, there is evidence to suggest that the returns
to IT are larger than one would expect using a standard growth accounting
framework, which typically only takes into account tangible assets (Brynjolfsson
and Yang (2001).)
Brynjolfsson and Hitt (2003) maintain that a missing piece in this productiv-
ity puzzle is complementary investments in organizational design accompanying
computerization. This is an idea which is gaining currency in policy circles.2
The basic argument of Brynjolfsson and co-authors is that firms are not
going to automatically enjoy efficiency gains by plugging a computer in the1Faruqui et al. (2003).2The Economic Report of the President, for example notes that “The 1995-2001 accelera-
tion [in US productivity] may be plausibly accounted for by a pickup in capital services perhour worked and by increases in organizational capital, the investments businesses make toreorganize and restructure themselves, in this instance, in response to newly installed infor-mation technology.” (February 2006, p. 26)
2
socket. Rather, it is the organizational redesign which enables them to take
advantage of the computing power offered by these machines that results in
increased productivity.
This paper explores this basic idea by exploring the productivity gains asso-
ciated with computer use and organizational redesign. It does so from a micro-
perspective, using a rich nationally representative, longitudinal, linked worker-
workplace dataset. Our methodology involves estimating a Cobb-Douglas func-
tion, augmented to account for technology use and organizational design. We
use our panel data structure to correct for unobserved workplace heterogeneity
using workplace fixed effects.
We find that the returns associated with computer use are large: a computer
user is, on average, 37% more productive than a non-user. This rises to 47%
if one accounts for potential complementarities between organizational redesign
and computer use.
If complementary organizational redesign does indeed hold the key to un-
derstanding sustained productivity growth, our data suggest that the devil is
in the detail. We observe no productivity effects of organizational redesign,
either in isolation or in conjunction with computer use, in our aggregate data.
The action is at the industry-level where organizational redesign can be either
a complement or a substitute in production, and displays large inter-industry
variation in terms of productivity impact.
The paper proceeds as follows. We review the literature in section 2. Section
3 provides a conceptual framework and section 4 presents our data. In section
5, we lay out our empirical strategy. Results are presented in section 6, and
section 7 concludes.
3
2 Related Literature
Despite a sizeable case study literature documenting complementarities between
IT and organizational design, only recently has the issue been examined using
survey data.3 In a seminal paper, Bresnahan, Brynjolfsson, and Hitt (2002)
explore the implications of complementarities between IT, workplace reorgani-
zation, and new products and services for the relative demand for skilled labor
and, more peripherally, productivity. This paper is motivated largely by Bres-
nahan, Brynjolfsson, and Hitt (2002) and contains many complementary results.
It is, however, distinct on a number of counts. First, our focus is on productivity
rather than labor demand. Second, our data permit us to examine a much larger
variety organizational designs for a substantially larger number of observations;
our sample is representative of the economy as a whole.4 Third, because we have
access to data regarding organizational redesign and not just extant workplace
practices, we are better equipped to examine the extent to which firms which
adjust their organizational design in the wake of computerization realize higher
productivity.
This paper also speaks to two other strands of literature: one on the effect
of IT on productivity and the other on the effect of organizational design on
productivity. The former is based almost exclusively on data aggregated at the
macroeconomic, industry, or firm level.5 This has the drawback of concealing
heterogeneity within the firm. In this paper, we study the impact of IT use on
workplace productivity.
The latter – the impact of organizational design on productivity – has a long3This is an oft lamented failure in the literature. See Brynjolfsson and Hitt (2000) for an
excellent review. There is also a large sociology literature on the impact of IT on organizationaldesign, ably surveyed in Burris (1998).
4Bresnahan, Brynjolfsson, and Hitt (2002) main estimates pertain to 250 firms. Ourspertain to 6,842 workplaces.
5Brynjolfsson and Hitt (1995), Brynjolfsson and Hitt (2003), and Stiroh (2004) survey theevidence.
4
tradition. Some of the earliest work in this area took the form of case studies.6
An alternative approach has exploited changes in organizational structure within
firms.7 Yet another approach has been to conduct intra-industry studies of
the effect of workplace practices on industry-specific measures of performance.8
These studies typically find that innovative workplace practices result in higher
productivity.
These approaches have the attractive quality of being rich in detail, thereby
permitting an intricate understanding of the channels through which innovative
workplace practices affect productivity. This level of detail is possible since the
studies in question focus on particular companies, firms, or industries, but comes
at a price, which is that one cannot make any generalizations to the broader
economy on the basis of their results.
Some headway has been made in overcoming this limitation by analyzing
data on a more representative sample of firms. But these studies typically
use cross-sectional data (sometimes complemented by a longitudinal component
which typically does not include business practices) with low response rates, and
measures of organizational design aggregated at the firm or business-line level.9
These, in turn, make it difficult to correct for firm unobserved heterogeneity,
compromises representativeness, and makes it difficult to interpret results since
workplace practices often vary across establishments (and not only firms.)
In this respect, recent work by Black and Lynch (2004) and Black and Lynch
6The classic study here on the NUMMI auto assembly plant in Fremont, California (Krafcik(1988) and Wilms (1995)) was followed by case studies of firms in other industries such an officemachine company (Cutcher-Gershenfeld (1991)), paper manufacturing (Ichniowski (1992))and apparel manufacturing (Berg, Appelbaum, Bailey, and Kalleberg (1996).)
7This literature typically concentrates on the effect of incentive pay on firm or workerperformance, and includes work by Lazear (2000), Knez and Simester (2001), and Hamilton,Nickerson, and Owan (2003).
8Papers taking this tack include Bailey (1993), Arthur (1994), Kelley (1994), Kelley (1996),Dunlop and Weil (1996) and Ichniowski, Shaw, and Prennushi (1997). More recently, Ann Bar-tel and Shaw (2007) have examined the presence of complementarities between IT and plant-level production mechanisms in the machine-valve industry.
9Huselid (1995), Greenan and Guellec (1997), Huselid and Becker (1996), Caroli andReenen (2001) and Kato and Morishima (2002).
5
(2001) is ground breaking since it exploits establishment level, partially panel,
data containing detailed questions on workplace practices. Nevertheless, the
cross-sectional nature of the data in their 2001 paper and the small panel in
their subsequent paper brings us full circle to the problems of unobserved het-
erogeneity and representativeness, respectively, alluded to earlier. Moreover,
although they examine the effect of computer use on productivity, they do not
explicitly explore the presence of interactions between computer use and work-
place practices in their empirical specifications.
In this paper we use longitudinal, establishment-level panel data, the Cana-
dian Workplace Employee Survey (WES) 1999-2004. WES is large (our final
panel comprises 26, 006 observations corresponding to 6, 842 workplaces), na-
tionally representative, and has detailed questions on organizational redesign,
computer use, as well as complementary hardware and software adoption and
investment. These features allow us to explore the effect of organizational re-
design and computer use on an objective measure of productivity in enormous
detail, while correcting for unobservability and producing results which are more
representative of the economy as a whole and industries therein.
3 Conceptual Preliminaries
Computers have been described as a general purpose technology – an enabling
technology whose value added to a firm derives from innovative uses (Bresnahan
and Trajtenberg (1995)), and innovative uses typically require organizational
redesign. To illustrate the complementarities between work organization and
computer use, consider the case study of “Aircraft”, described in Kling (1994).
In 1988 the Aircraft engineers work group convinced management to procure
them MACs, whose graphics capabilities would enhance the quality of their
designs. Management agreed. As a result, the company’s engineers increased
6
the range and scope of problems in which they were involved, gained greater
autonomy in decision making, and no longer had to rely on other workgroups
in order to complete their project documents. Gains from computerization in
this context resulted from a combination of IT-enabled graphics quality, and
decentralization as well as reengineering.
More generally, computer-based IT can increase value added in two ways.
First, it can directly increase the productivity of workers who use them (as
in the case of higher quality graphic design in the example above.) Second,
to the extent that one of the main things IT does is increase the potential
information available within the firm, it can reduce the costs of communication,
coordination, and information processing (Brynjolfsson and Hitt (2000)). The
extent to which firms benefit from the second depends on whether the “right”
organizational structures are in place.
In this paper, we consider the extent to which computer use at the workplace
– measured by the proportion of workers using a personal computer on the job –
is associated with increased productivity when accompanied by organizational
redesign. In particular, we consider 8 types of organizational redesign which
can be classified into 3 broad areas.
The first area relates to changes in business processes. This includes greater
integration among different functional units, reengineering of business processes,
and total quality management (TQM ). The second, closely related to the first, is
changes in delegation of decision making, by which we mean an increased degree
of decentralization, an increased degree of centralization, or a reduction in the
number of managerial levels (delayering). The third area concerns adjustments
in the workplace’s dealings with other firms and includes greater reliance on
external suppliers of products and services (outsourcing) and greater inter-firm
collaboration in R&D, production or marketing.
7
Whether or not IT and organizational redesign are complements in pro-
duction remains to be seen. What is immediately evident in our data is that
organizational redesign often goes hand in hand with IT use. This can be seen
in table 1. Column 2 (3) describes the proportion of workplaces, which insti-
tuted the workplace redesign indicated in column 1 and had a greater (lower)
than industry-average proportion of computer users, and column 4 indicates
the difference between the proportions in column 2 and 3. As the last column
indicates, workplaces which recently engaged in organizational redesign are also
substantially more likely to have above-average computer use.
We turn now to what the literature says about the presence or absence of
complementarities between the organizational redesign and IT use.
3.1 Business processes
References to integration, reengineering and TQM, though favourites of the
business community, find little by way of reference in the economics literature.
Generically, they relate to the interaction or allocation of work between different
parties, and management style in the business process.
Integration refers to increased communication and coordination among dif-
ferent functional units. Reengineering is in some sense, a more radical version
of integration. The main proponents of reengineering, Michael Hammer and
James Champy, argued that instead of organizing a firm into functional units,
such as production, research, accounting and marketing, the firm should be
reengineered into a series of processes governed by a team which is responsi-
ble for all the functions in the process (Hammer and Champy (1993)). TQM,
wildly popularized in the early 1990s by such management gurus as Joseph
Juran and Philip Crosby, is a somewhat amorphous concept, described as an
“integrated management philosophy”geared towards improving product quality
8
and customer satisfaction.10
By reducing the costs of communication and coordination, especially through
the use of computer-aided design and management systems, computers greatly
facilitate, and therefore increase the profitability associated with, the integration
of functional units. This is even more true of reengineering – a concept which
originated precisely in response to the possibilities afforded by new technologies.
This is reflected in one of Michael Hammer’s manifestos in which he declares,
“Instead of embedding outdated processes in silicon and software, we should
obliterate them and start over. We should “ reengineer” our businesses: use
the power of modern information technology to radically redesign our business
processes in order to achieve dramatic improvements in their performance.”
(Hammer (1990), p. 105.)
If integration and reengineering are well-acknowledged complements to com-
puter use, this is less obvious of TQM, given the breath and variety of its con-
stituent elements. On the one hand, the value added of such things as process
improvement and measurement are likely to be enhanced by computer use. But
the same need not be said for such factors as “committed leadership” or “em-
ployee empowerment”, which may well be compromised by computer use.
3.2 Delegation of decision-making authority
Of the three areas presented above, the second – the delegation of decision-
making authority within the firm – has received the most intense scrutiny from
economists. The theoretical literature has typically taken one of two tacks.
The first argues that the presence of communication or information processing10See Crosby (1984) and Juran (1992). Although different proponents place different em-
phases Powell (1995), in a survey of the literature maintains that TQM comprises 12 factors:committed leadership, adoption and communication of TQM through mission statements,closer customer relationships, closer supplier relationships, benchmarking, increased train-ing, open organiztion, employee empowerment, zero-defects mentality, flexible manufacturing,process improvement and measurement.
9
costs typically favour decentralization, to the extent that these structures better
exploit local information and avoid information transmission leakages.11 The
second approach focuses on incentive problems, in which the decision to decen-
tralize decision making involves a trade-off between agency problems on the one
hand, and the benefits associated with the informational advantage of agents
on the other.12
To the extent that computers lower communication and information process-
ing costs, the first strand of literature would suggest that increased computer use
would increase the relative profitability of centralized decision making. To the
extent that IT also improves central management’s ability to monitor agents,
the loss-of-control literature points to the increased relative profitability of de-
centralization. The net effect of computer use on the value of centralization
versus decentralization is therefore ambiguous.
The effect of increased IT use on the number of managerial levels is less
ambiguous.13 Firms which invest in computing technology are likely to pro-
cess more data and thereby increase their profitability by reducing delayering.14
Similarly, to the extent that IT facilitates communication, and faster commu-
nication reduces coordination problems, thereby alleviating loss-of-control over
layers of middle management, IT use reduces profitability associated with de-
layering.15
11See, for example, Bolton and Dewatripont (1994) and Radner (1993).12See, for example, Aghion and Tirole (1997) and Acemoglu, Aghion, Lelarge, Reenen, and
Zilibotti (2007). Mookherjee (2006) provides an excellent overview.13The literature on IT and heirarchies is thin and we are grateful to Roy Radner and Kieron
Meagher for invaluable input here.14See Cukrowski and Baniak (1999) for a model of the information-processing role of IT in
heirarchies.15See and Meagher (2003).
10
3.3 Inter-firm interaction
Increased outsourcing to external suppliers of products and services, and greater
inter-firm collaboration in R&D, production or marketing, and collaboration in-
volves at least two things. The first is the ability to find an appropriate partner,
and the second is being able to customize and coordinate the joint endeavour.16
In reducing the costs of communication and coordination, computer-based IT
is thought to increase the productivity associated with both of oursourcing and
inter-firm collaboration.
4 Data
Our data come from the Workplace and Employee Survey (WES) conducted
by Statistics Canada.17 WES has been conducted annually since 1999 and
we use all 6 years of available data (1999-2004). Our final sample comprises
26, 006 observations over 6, 842 workplaces. The original WES survey contains
37, 073 observations. The discrepancy between the original and our estimation
sample is mainly due to the fact that we drop non-profit-establishments (4, 593
observations) and establishments for which no employees were sampled (4, 803
observations). We also drop also observations with negative value added (1, 913
observations).
The survey is both longitudinal and linked in that it documents the char-
acteristics of workers and workplaces over time.18 The target population for
the workplace component of the survey is defined as the collection of all Cana-
dian establishments who paid employees in March of the year of the survey.
The sample comes from the “Business Register” of Statistics Canada, which16See Grossman and Helpman (2005) for a formal model.17This is a restricted-access data set available in Statistics Canada Research Data Centers
(RDC).18Abowd and Kramarz (1999) classify WES as a survey in which both the sample of work-
places and the sample of workers are cross-sectionally representative of the target population.
11
contains information on every business operating in Canada. The survey is
therefore nationally representative of Canadian businesses, except for those lo-
cated in Yukon, the Northwest Territories and Nunavut and firms operating
in fisheries, agriculture and cattle farming. For the employee component, the
target population is the collection of all employees working, or on paid leave, in
the workplace target population. Response rates for each cross-section are over
75 per cent.
The initial 1999 sample is followed over time and is supplemented at two-
year intervals with a sample of births selected from units added to the Business
Register since the last survey occasion. In the case of total non-response, re-
spondents are withdrawn entirely from the survey and sampling weights are
recalculated in order to preserve representativeness of the sample. In order to
control for the design effect in our estimations, we weighted our analysis with
the final sampling weights for workplaces as recommended by Statistics Canada.
In 1999, workplace data were collected in person; subsequent workplace sur-
veys were conducted by means of computer assisted telephone interviews. For
the employee component, telephone interviews were conducted with individu-
als who had agreed to participate in the survey by filling out and posting an
employee participation form.
We have a relatively precise measure of workplace productivity (our depen-
dent variable) in value added, defined as gross operating revenue minus expenses
on materials, training and non-wage benefits. Labor is measured through the
number of employees in the workplace. Our measure of capital stock is some-
what more problematic. As with most firm-level data, capital stocks for each
firm are not available in our data. We therefore proxy the capital stock by
taking the stock of the capital of the industry where the workplace evolved (at
the three-digits for the manufacturing sector and two-digits otherwise) divided
12
by the number of workplace in that particular industry (see Dostie and Pelletier
(2007) and Turcotte and Rennison (2004)).
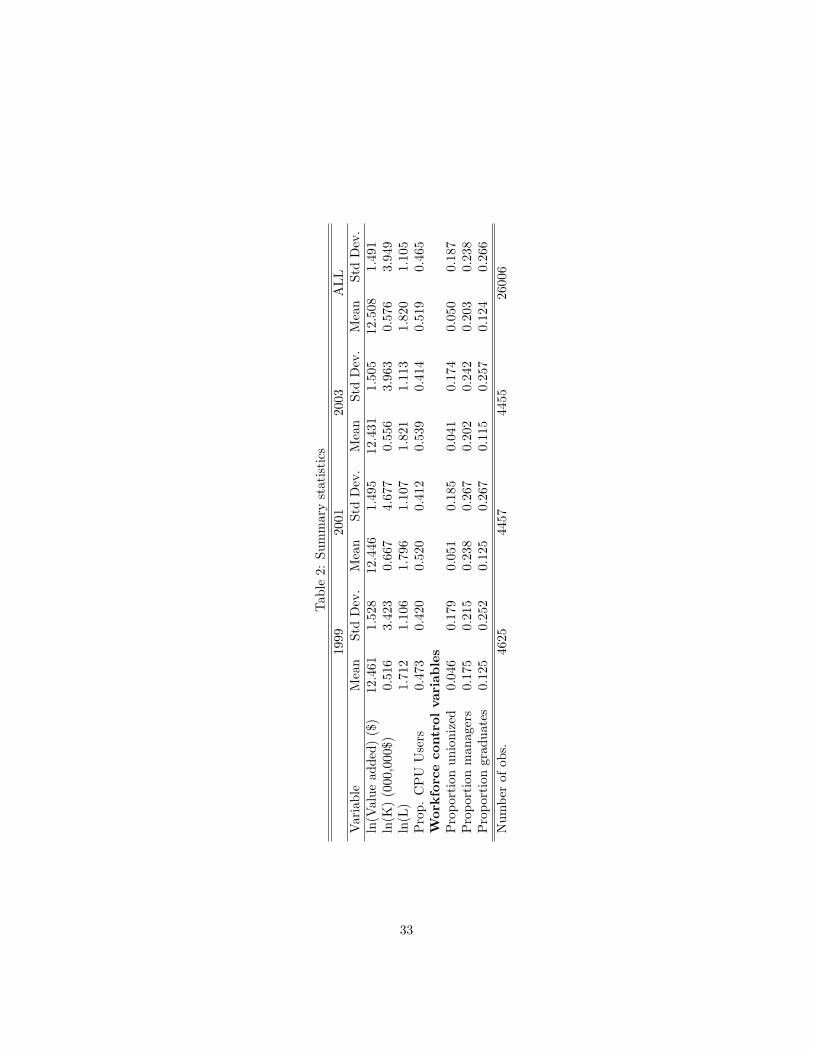
Our main measure of workplace IT use is the proportion of employees using
computers (CPU) as part of their normal duties, where the survey specifically
defines computers as “a micro computer, personal computer, minicomputer,
mainframe computer or laptop that can be programmed to perform a variety
of operations”. Table 2 presents summary statistics for our sample, where the
average is taken across workplaces. It indicates that the average workplace level
proportion of computer users in this sample is 52 per cent. Although there is
considerable inter-workplace variation in computer use, this variable does vary
substantially over time within any given workplace. We also control for work-
force characteristics such as union concentration, the proportion of managers
and workers with at least a university degree. The workplace averages for these
variables is 5%, 20% and 12%, respectively.
In addition to computer use, we control for new technology adoption and
new technology investment. The former comprises 3 separate dummy variables
which take on value 1 if, respectively, between April of the previous year and
March-end of the survey year a workplace implemented (i) a major new software
application and/or hardware installation (Soft/Hard); (ii) computer-controlled
or computer-assisted technology (CAD); and (iii) other major technologies or
machinery. The latter comprises Canadian dollar-amounts for each of these
three IT categories.
WES provides a rich set of measures of organizational redesign. The sur-
vey asks the following question: “Has your workplace experienced any of the
following forms of organizational change between April 1 [of the previous year]
and March 31 [of the current year]”, following which firms are asked to respond
“yes” or “no” to the 8 types of organizational redesign described in the previous
13
section: (i) greater integration, (ii) greater centralization, (iii) greater decentral-
ization, (iv) reengineering, (v) delayering, (vi) implementation of TQM, (vii)
increased outsourcing, and (viii) increased inter-firm collaboration.
As table 3 indicates, over the sample period roughly a tenth of all workplaces
experienced recent changes in business processes in the form of increased inte-
gration, reengineering and TQM. Increased centralization was the most common
change in delegation of decision-making authority, at 6 per cent over the 6 year
of observation, compared to the 2− 3 per cent of workplaces which experienced
more decentralization and delayering. And 6 − 7 per cent of firms recently
experienced increased interaction with outside firms.
In addition to the variables mentioned above, each of our regressions includes
controls for region and time dummies and, in our full sample, also two-digit
industry.
5 Empirical Strategy
We estimate a workplace-level Cobb-Douglas production function with longitu-
dinal data that is augmented by measures of organizational design and infor-
mation technology:
yjt = βkkjt + βlljt + δZjt + φXjt + γt + εjt (1)
where j represents workplaces and t time, y is the logarithm of the firm’s value-
added; l is the logarithm of the freely variable input labor, and k is the logarithm
of the state variable capital. Zjt is a vector comprising the proportion of workers
using a computer (Cjt), dummy variables denoting whether or not a workplace
instituted organizational redesign (Rjt), and interaction terms between IT mea-
sures and organizational redesign (CR). Xjt is a vector of additional control
14
variables. In all specifications, it includes workforce characteristics such as the
proportion of workers covered by a collective bargaining agreement, the propor-
tion of college graduates, the proportion of managers, and regional dummies; in
our full sample, it contains controls for industry; and in some specifications it
also includes controls for the investment in or adoption of complementary hard-
and software. γt are time-varying intercepts and ε is the error term.
When βl is close to 1, the coefficient on the proportion of workers using
a computer is interpreted as the percentage productivity differential between
computer users and non users.19 It is expected to be positive if employees using
a computer are more productive. Coefficients on organizational redesign tell
us whether those workplaces that implement changes in organizational design
are also more productive. Finally, interactions between the two components
capture possible complementarities between organizational redesign and com-
puter usage. A positive coefficient indicates that a certain practice may be
complementary to broad-based computer use at the workplace.
Of course, a significant coefficient is not necessarily indicative of the existence
of complementarities (or substitutability) between computer use and organiza-
tional design. In particular, if there something unobserved to the econometrician19To see this, one needs to interpret l in equation (1) as the number of effective labour units
that depends on the number of computer users lu and the number of non users lnu
ljt = λulujt + λnul
nujt = λnul
ajt + (λu − λnu)lujt (2)
where la is the actual total number of employees. λu (and λnu) are load factors convertingthe number of employees who use (and who not use) computers into effective labor units.Equation (2) can be rewritten as
ln l jt = lnλnu + ln lajt + ln
(1 +
(λu
λnu− 1
)Cjt
). (3)
Substituting equation (3) in (1), we obtain
yjt ' βkkjt + βlljt + βlκCjt + δZ∗jt + φXjt + γt + εjt (4)
where Z∗jt = Zjt as defined before minus variables representing the proportion of computer
users and interactions with R, and κ =(λuλnu− 1
)is one parameter of interest and is in-
terpreted as the relative productivity of an employee who use a computer compared to anemployee who does not.
15
which is correlated with both organizational design, computer use, and produc-
tivity, then the observed correlation between the them may be spurious.
The problem can be seen by disaggregating the error term in equation 1 as
follows:
yjt = βkkjt + βlljt + δZjt + φXjt + γt + uj + νjt (5)
where uj is the unobserved (time-invariant) workplace effect. We estimate equa-
tion (1) using pooled OLS and equation (5) using fixed effects (FE).20
6 Results
6.1 Full sample
Table 4 describes our pooled OLS estimates of equation for our augmented
Cobb-Douglas function in (1) using the full sample.
As the first two rows indicate, the elasticity of labor is close to 1 while that
of capital is close to zero, but of the wrong sign. The former is common in short
panels of this type. The latter is likely to reflect the poor quality of capital stock
variable, as well as the large fraction of small workplaces (over 80% have fewer
than 20 employees) and service sector workplaces in our sample. The coefficient
estimates for capital estimates are unfortunate and we would have liked to have
a better measure of capital stock. However, we are less troubled by this than
we might otherwise be for at least two reasons. First, the focus of this paper is
on organizational redesign and computer use and our results are qualitatively
robust to the exclusion of capital and labor inputs in our production function20We also extensively explored, but do not report, a third alternative explanation for ob-
served correlation, namely the possibility that that a firm may be subject to exogenous shocks(in, say, demand or efficiency advantages) which affects both the choice of inputs as well asproductivity; this is the so called simultaneity problem in production function estimation(Griliches and Mairesse (1998)). We used a GMM approach suggested by Blundell and Bond(2000). However, while the results were qualitatively similar, they were also very imprecise,probably because lagged values of potentially endogenous explanatory variables acted as weakinstruments.
16
estimation. Second, as can be seen in tables 5, 8, and 9, this elasticity of capital
is insignificant in our fixed effects estimates for our sample, and of a reasonable
positive magnitude (where significant) in our industry-disaggregated results.
Column 1 does not account for organizational redesign. The point estimate
in row 3 of this column indicates that a computer user is roughly 38% more
productive than a non user (since the coefficient on labor input is close to
unity).
Including dummies for organizational redesign – integration, re-engineering,
TQM, centralization, decentralization, delayering, outsourcing and collabora-
tion – in column 2 leaves this estimate unchanged: the point estimate drops
only slightly from 0.376 to 0.367 and this difference is not statistically signifi-
cant. Column 3 allows for potential complementarities between organizational
redesign and computer use by adding 8 interaction terms between our measures
of organizational redesign and computer use. Since both hardware and soft-
ware are presumably positively correlated with PC availability, organizational
redesign, and productivity, failure to control for these complementary inputs
may be responsible for an upward bias in our estimates. We address this in
columns 4 and 5, by correcting for the use of complementary hard- and software
and investments therein, respectively.
The estimated returns associated with computer use increase by 10 percent-
age points (columns 2 versus column 3) once potential complementarities are
permitted, and this increase is robust to our controls for complementary hard-
and software in columns 4 and 5.
Turning to the potential complementarities between computer use and orga-
nizational redesign, as summarized in table 6 the sign of the coefficients on the
interaction terms are generally remarkably consistent with the theory. More-
over, the point estimates in table 4 associated with the significant interaction
17
terms are sizeable. They suggest that in a workplace that further integrates
functional units, a computer user is an additional 30 percent more productive
than a nonuser. Moreover, the insignificant coefficient on the integration dummy
variable suggests that these gains associated with integration are enjoyed only
in conjunction with computer use. The negative coefficient on the delayering
interaction term coupled with the positive and significant coefficient on the cor-
responding dummy variable suggests, by contrast, that the average workplace
which delayered becomes less productive; this is because for the average work-
place, where 52% of the workforce used computers over our 6-year observation
period, the negative interaction term outweighs the positive level effect. To put
it differently, productivity gains upon delayering are only enjoyed among those
firms with below average computer use.
Two general results in table 4 are rather remarkable. First, although an
F-test for joint significance of the interaction terms cannot be rejected at the 10
percent level, only two − increased integration of functional units and delayering
− are significant. Second, of these the positive sign on integration would be
consistent with it being a complement, but the negative sign on delayering
would suggest that it is actually a substitute for computer use.
As discussed in the previous section, one obvious explanation for these puz-
zling results is workplace heterogeneity. If different types of organizational re-
design are pertinent to different types of workplaces, then our OLS estimates
are likely to be reflecting these unobserved differences rather than any true
productivity effect of redesign.21
21Another possible explanation is measurement error. Despite detailed clarification of whatis intended by each of the 8 types of organizational redesign, it is conceivable that, say, decen-tralization was confused with delayering, or that outsourcing was not properly distinguishedfrom collaboration. To account for this type of measurement error, we estimated the ef-fect of aggregated categories of organizational change. The results (not shown here) suggestthat accounting for potential measurement error in this manner does not change the findingthat significant interactions between computer use and organizational redesign are frequentlyabsent and of the “wrong” sign.
18
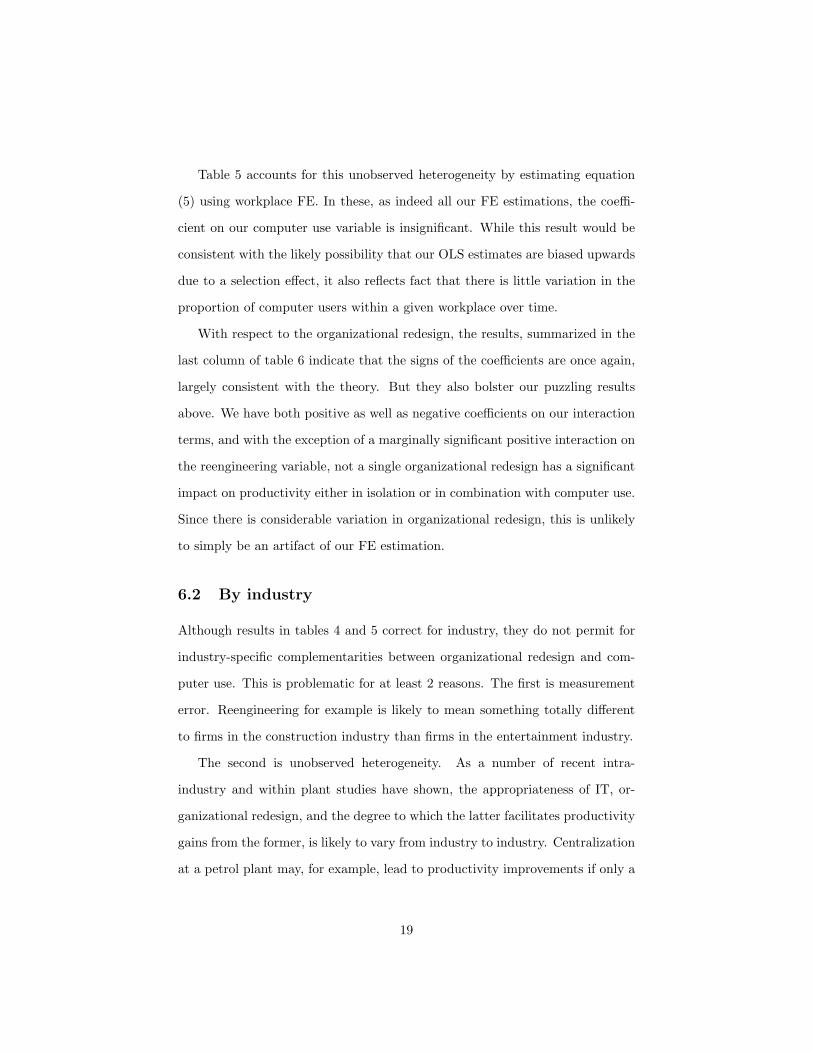
Table 5 accounts for this unobserved heterogeneity by estimating equation
(5) using workplace FE. In these, as indeed all our FE estimations, the coeffi-
cient on our computer use variable is insignificant. While this result would be
consistent with the likely possibility that our OLS estimates are biased upwards
due to a selection effect, it also reflects fact that there is little variation in the
proportion of computer users within a given workplace over time.
With respect to the organizational redesign, the results, summarized in the
last column of table 6 indicate that the signs of the coefficients are once again,
largely consistent with the theory. But they also bolster our puzzling results
above. We have both positive as well as negative coefficients on our interaction
terms, and with the exception of a marginally significant positive interaction on
the reengineering variable, not a single organizational redesign has a significant
impact on productivity either in isolation or in combination with computer use.
Since there is considerable variation in organizational redesign, this is unlikely
to simply be an artifact of our FE estimation.
6.2 By industry
Although results in tables 4 and 5 correct for industry, they do not permit for
industry-specific complementarities between organizational redesign and com-
puter use. This is problematic for at least 2 reasons. The first is measurement
error. Reengineering for example is likely to mean something totally different
to firms in the construction industry than firms in the entertainment industry.
The second is unobserved heterogeneity. As a number of recent intra-
industry and within plant studies have shown, the appropriateness of IT, or-
ganizational redesign, and the degree to which the latter facilitates productivity
gains from the former, is likely to vary from industry to industry. Centralization
at a petrol plant may, for example, lead to productivity improvements if only a
19
handful of people with computers have control over largely automated processes,
whereas centralization in an insurance firm where human-capital intensive data
gathering is important is likely to be effective only if most employees have com-
puters. Therefore, a zero aggregate impact could mask what is in fact a negative
interaction (substitutability) within some industries and a positive interaction
(complementarities) within others. Failure to allow for this type of measure-
ment error and unobserved heterogeneity may account for large standard errors
in our organizational redesign coefficients and interactions in tables 4 and 5.
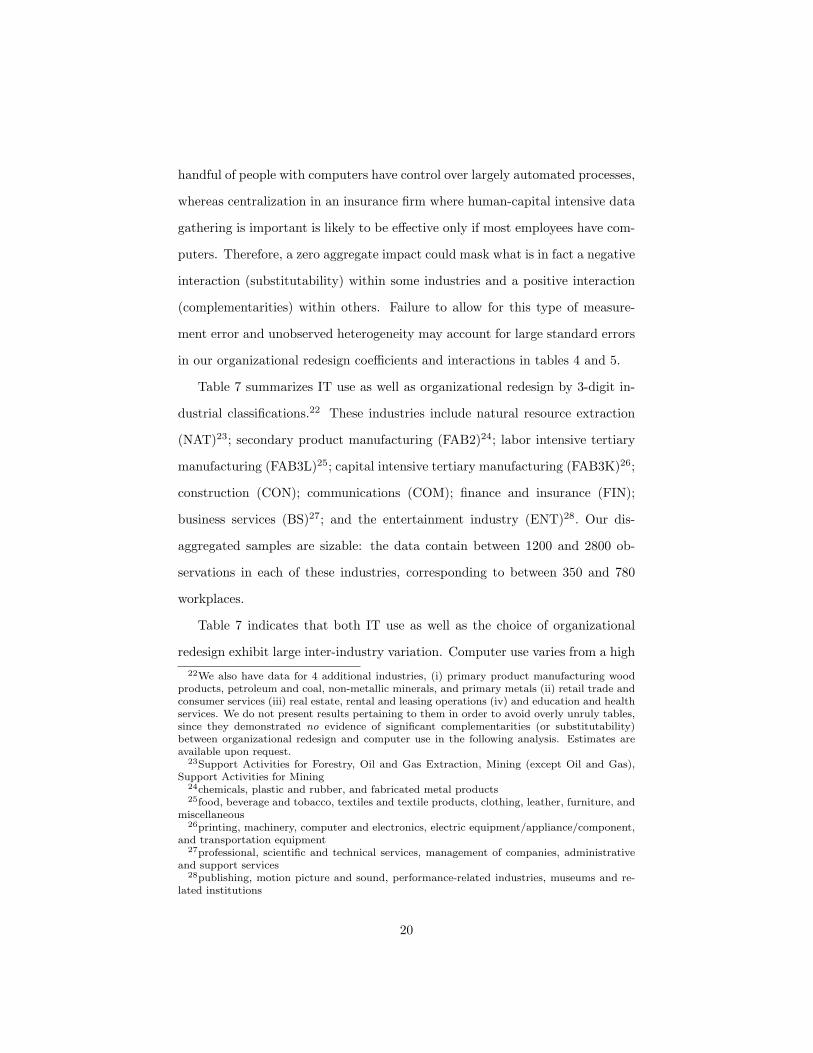
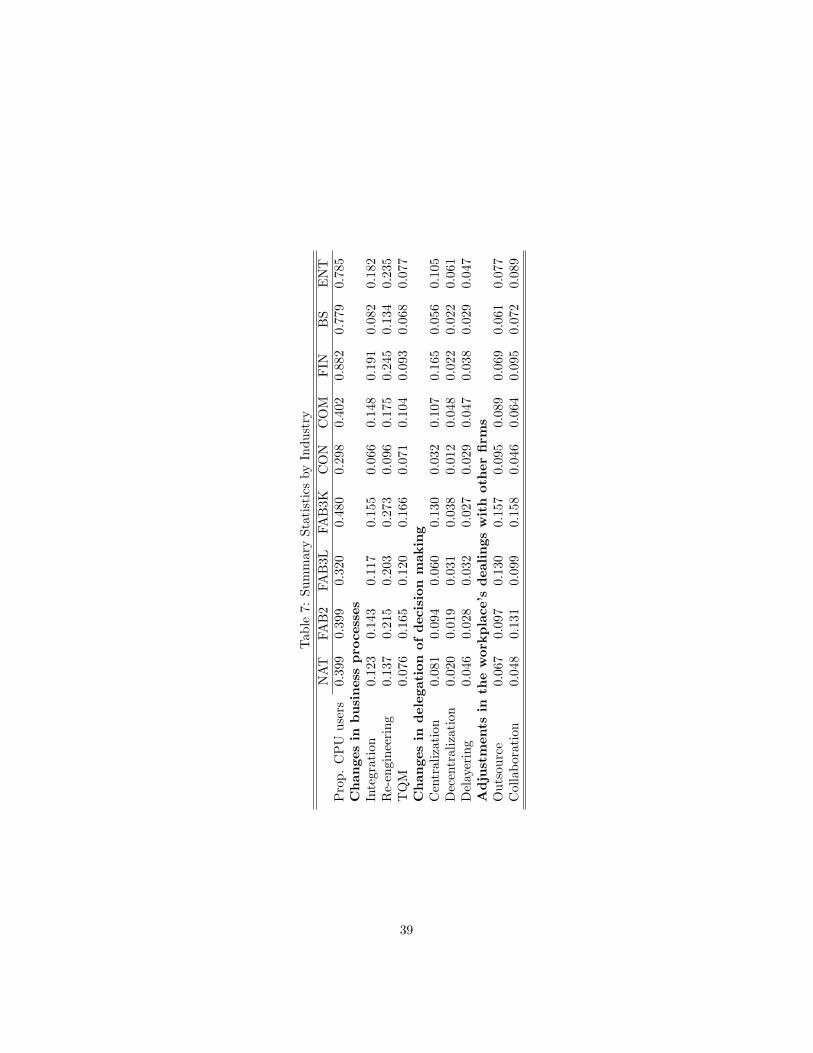
Table 7 summarizes IT use as well as organizational redesign by 3-digit in-
dustrial classifications.22 These industries include natural resource extraction
(NAT)23; secondary product manufacturing (FAB2)24; labor intensive tertiary
manufacturing (FAB3L)25; capital intensive tertiary manufacturing (FAB3K)26;
construction (CON); communications (COM); finance and insurance (FIN);
business services (BS)27; and the entertainment industry (ENT)28. Our dis-
aggregated samples are sizable: the data contain between 1200 and 2800 ob-
servations in each of these industries, corresponding to between 350 and 780
workplaces.
Table 7 indicates that both IT use as well as the choice of organizational
redesign exhibit large inter-industry variation. Computer use varies from a high22We also have data for 4 additional industries, (i) primary product manufacturing wood
products, petroleum and coal, non-metallic minerals, and primary metals (ii) retail trade andconsumer services (iii) real estate, rental and leasing operations (iv) and education and healthservices. We do not present results pertaining to them in order to avoid overly unruly tables,since they demonstrated no evidence of significant complementarities (or substitutability)between organizational redesign and computer use in the following analysis. Estimates areavailable upon request.
23Support Activities for Forestry, Oil and Gas Extraction, Mining (except Oil and Gas),Support Activities for Mining
24chemicals, plastic and rubber, and fabricated metal products25food, beverage and tobacco, textiles and textile products, clothing, leather, furniture, and
miscellaneous26printing, machinery, computer and electronics, electric equipment/appliance/component,
and transportation equipment27professional, scientific and technical services, management of companies, administrative
and support services28publishing, motion picture and sound, performance-related industries, museums and re-
lated institutions
20
of 88% in financial services to a low of 30% in construction, and various types of
organizational redesign are much more common in some industries than others.
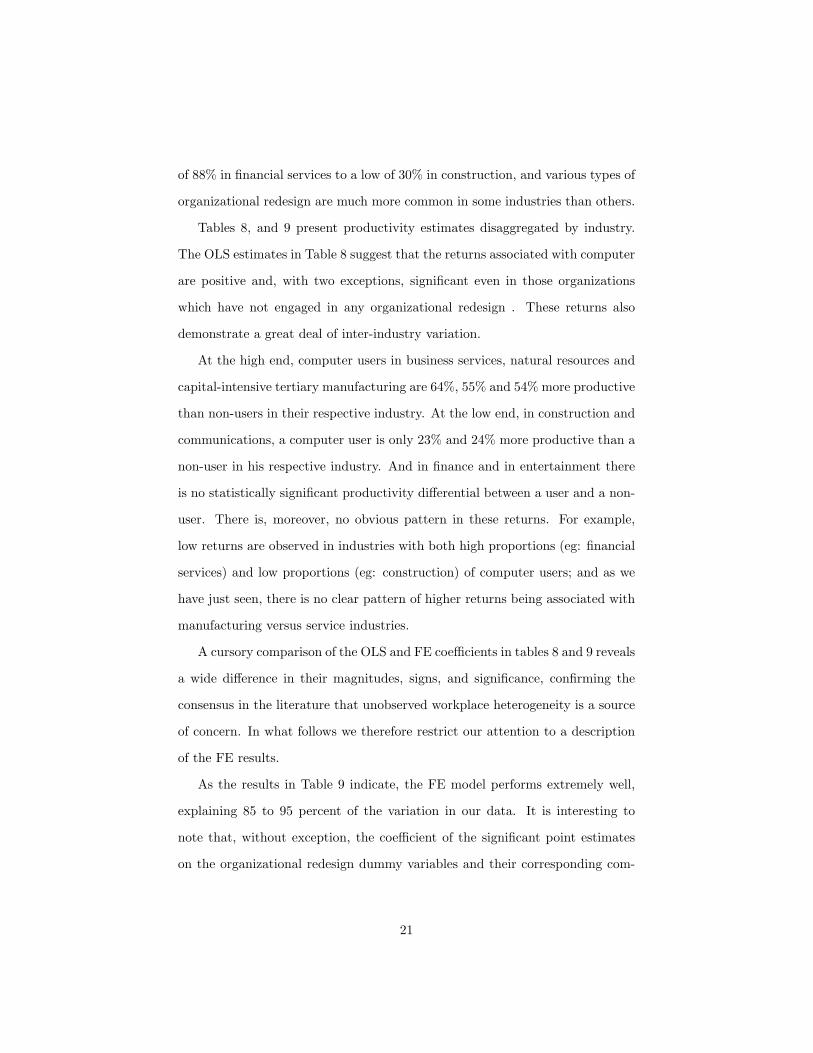
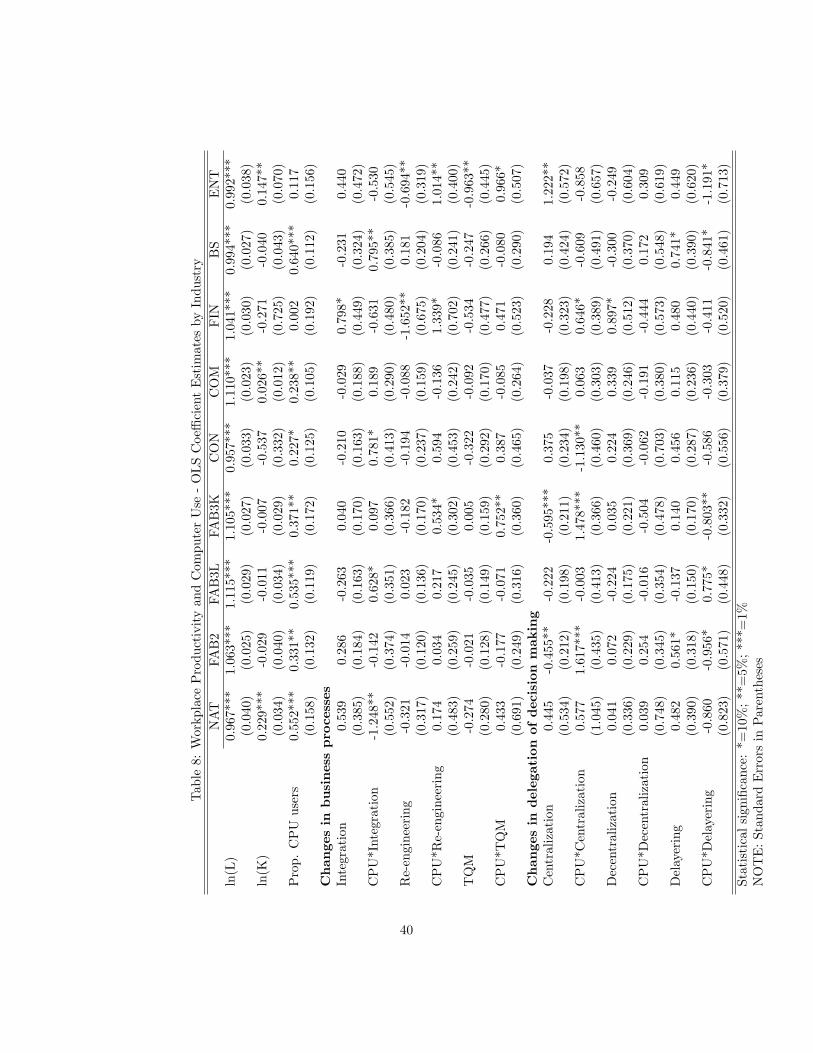
Tables 8, and 9 present productivity estimates disaggregated by industry.
The OLS estimates in Table 8 suggest that the returns associated with computer
are positive and, with two exceptions, significant even in those organizations
which have not engaged in any organizational redesign . These returns also
demonstrate a great deal of inter-industry variation.
At the high end, computer users in business services, natural resources and
capital-intensive tertiary manufacturing are 64%, 55% and 54% more productive
than non-users in their respective industry. At the low end, in construction and
communications, a computer user is only 23% and 24% more productive than a
non-user in his respective industry. And in finance and in entertainment there
is no statistically significant productivity differential between a user and a non-
user. There is, moreover, no obvious pattern in these returns. For example,
low returns are observed in industries with both high proportions (eg: financial
services) and low proportions (eg: construction) of computer users; and as we
have just seen, there is no clear pattern of higher returns being associated with
manufacturing versus service industries.
A cursory comparison of the OLS and FE coefficients in tables 8 and 9 reveals
a wide difference in their magnitudes, signs, and significance, confirming the
consensus in the literature that unobserved workplace heterogeneity is a source
of concern. In what follows we therefore restrict our attention to a description
of the FE results.
As the results in Table 9 indicate, the FE model performs extremely well,
explaining 85 to 95 percent of the variation in our data. It is interesting to
note that, without exception, the coefficient of the significant point estimates
on the organizational redesign dummy variables and their corresponding com-
21
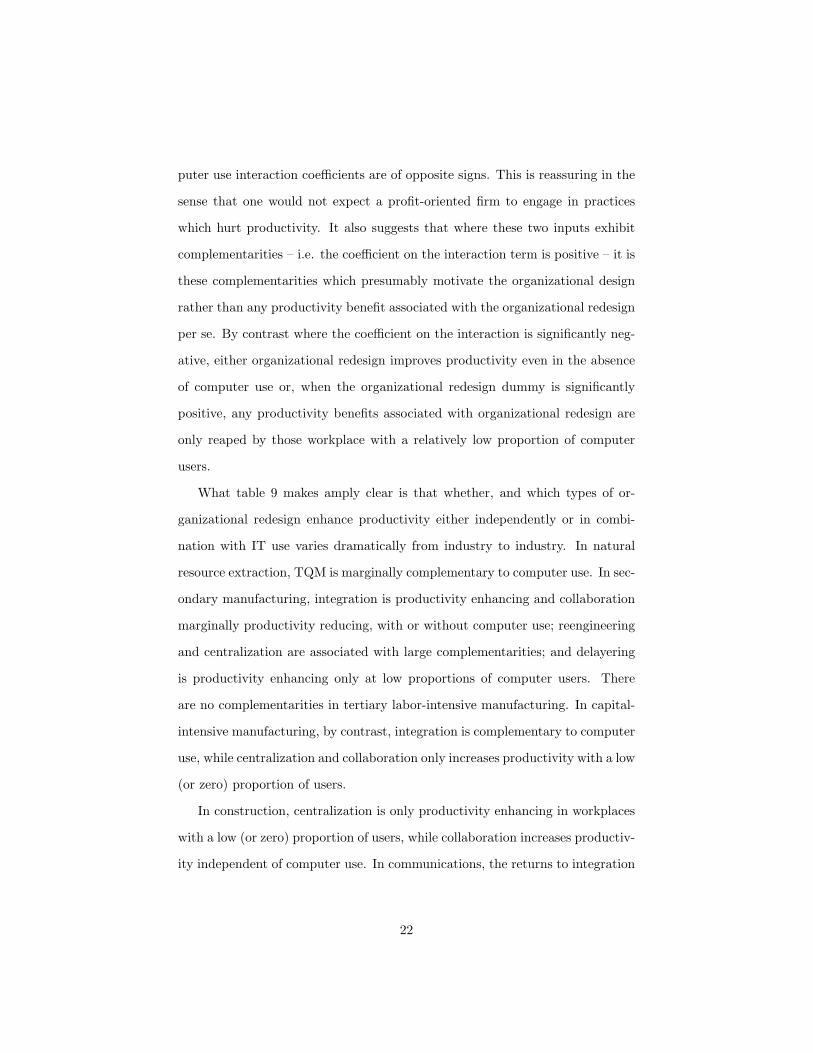
puter use interaction coefficients are of opposite signs. This is reassuring in the
sense that one would not expect a profit-oriented firm to engage in practices
which hurt productivity. It also suggests that where these two inputs exhibit
complementarities – i.e. the coefficient on the interaction term is positive – it is
these complementarities which presumably motivate the organizational design
rather than any productivity benefit associated with the organizational redesign
per se. By contrast where the coefficient on the interaction is significantly neg-
ative, either organizational redesign improves productivity even in the absence
of computer use or, when the organizational redesign dummy is significantly
positive, any productivity benefits associated with organizational redesign are
only reaped by those workplace with a relatively low proportion of computer
users.
What table 9 makes amply clear is that whether, and which types of or-
ganizational redesign enhance productivity either independently or in combi-
nation with IT use varies dramatically from industry to industry. In natural
resource extraction, TQM is marginally complementary to computer use. In sec-
ondary manufacturing, integration is productivity enhancing and collaboration
marginally productivity reducing, with or without computer use; reengineering
and centralization are associated with large complementarities; and delayering
is productivity enhancing only at low proportions of computer users. There
are no complementarities in tertiary labor-intensive manufacturing. In capital-
intensive manufacturing, by contrast, integration is complementary to computer
use, while centralization and collaboration only increases productivity with a low
(or zero) proportion of users.
In construction, centralization is only productivity enhancing in workplaces
with a low (or zero) proportion of users, while collaboration increases productiv-
ity independent of computer use. In communications, the returns to integration
22
as well as outsourcing are only positive for a large proportion of computer users,
whereas centralization has a positive association with productivity regardless of
the proportion of users.
In financial services, integration is productivity enhancing at lower propor-
tions of computer use, while in business services integration only increases pro-
ductivity when combined with computer use. In business services as well as
entertainment, delayering is associated with higher productivity when the pro-
portion of computer users is sufficiently low. In the latter industry, TQM and
computers are complements, while collaboration is productivity enhancing when
combined with a sufficiently high proportion of computer users.
In summary, the returns to some types of organizational redesign are increas-
ing in computer use, the returns to others are only positive when the number
of computer users is sufficiently small, and whether and to what extent orga-
nizational redesign has a bearing on productivity either in combination with
computer use or in isolation varies from industry to industry.
7 Conclusion
The first 5 years of the millennium witnessed a sustained increase in productiv-
ity despite a collapse in IT investment. It is often suggested that organizational
redesign which accompanies IT use may account for this. In this paper we exam-
ined this claim from a microeconomic perspective, exploiting a nationally rep-
resentative, longitudinal, establishment-level survey data spanning 1999-2004,
and containing a rich set of measures pertaining to IT use and organizational
redesign.
We found that returns associated with computer use are large – a computer
user is on average 37% more productive than a non-user – and this rises to
47% if one controls for potential interactions between organizational redesign
23
and and computer use. This lends some corroboratory micro-based evidence
to the suggestion that traditional growth accounting may underestimate the
returns to IT. It further suggests that even as macro data indicate a collapse in
IT investment, there remain large productivity gains associated with computer
use. Our data suggest that the seemingly elusive “computer revolution” is very
much at hand.
At the same time, there is a great deal of inter-industry variation in the
productivity gains associated with computer use, which does not follow any
immediately obvious pattern. The highest returns associated with computer use
are found in both manufacturing and service industries, and a high proportions
of computer use may be associated with very high returns (as in the business
services industry) or none at all (as in financial services.) This underscores the
point that it is not computers, but what one does with them which increases
productivity.
With respect to potential complementarities between computer use and orga-
nizational redesign, our aggregate data are on the whole remarkably consistent
with the theory – increased integration of functional units, reengineering and
decentralization exhibit complementarities with computer use while increased
delayering exhibits substitutability. A comparison of our OLS and FE results
also indicates that unobserved heterogeneity is a source for concern and this
suggests that results based on cross-sectional data should be treated with cau-
tion.
As to the main motivation of this paper, we find that if complementary
organizational redesign is, indeed, the new engine of growth, then the devil is in
the detail. Our fixed effects estimates using the aggregate data suggest that not
a single one of eight different types of organizational redesign has a significant
bearing on productivity.29 The action in our data is at the industry level, where29Reengineering exhibits complementarities with computer use, but only at the 10% level.
24
many types of organizational redesign do have a bearing on productivity either
independently or in conjunction with computer use.
Here we draw three lessons from our data. First, where there exist com-
plementarities between the proportion of computer users and organizational
redesign, it is these complementarities rather than any benefit associated with
the organizational redesign which drive productivity gains. Second, a firm need
not be highly computerized (i.e. have a high proportion of computer users) in
order to benefit from organizational redesign. Delayering, for instance, is pro-
ductivity enhancing precisely when there is a low proportion of users. Finally,
the nature in which computer use interacts with organizational redesign varies
dramatically from industry to industry, both in terms of significance and sign.
For firms, this means that there is no silver bullet for leveraging technological
advances through organizational redesign.
Although our data enable us to address many limitations of previous work,
it is not without its own drawbacks. While we control for a variety of comple-
mentary IT inputs, the proportion of computer users is simplistic measure of
IT use. It would interesting to explicitly examine the kind of work done using
these computers, or examine complementarities between organizational redesign
and different types of IT investment. Although our data contain a rich array of
organizational redesign variables, workplace organization remains a fundamen-
tally difficult concept to measure, let alone compare across workplaces. Finally,
although our panel data structure has enabled us to deal with unobserved work-
place heterogeneity, the short length of the panel did not permit us to control
for unobserved productivity shocks. This is left to future research.
25
References
Abowd, J. M. and F. Kramarz (1999). The analysis of labor markets using
matched employer-employee data. In O. Ashenfelter and D. Card (Eds.),
Handbook of Labor Economics, vol 3B, Chapter 40, pp. 2629–2710. Else-
vier Science North Holland.
Acemoglu, D., P. Aghion, C. Lelarge, J. V. Reenen, and F. Zilibotti (2007).
Technology, information and the decentralization of the firm. Quarterly
Journal of Economics 122, 1759–1799.
Aghion, P. and J. Tirole (1997). Formal and real authority in organizations.
Journal of Political Economy 105, 1–29.
Ann Bartel, C. I. and K. L. Shaw (2007). How does information technology
affect productivity? plant-level comparisons of product innovation, pro-
cess improvement, and worker skills. Quarterly Journal of Economics 122,
1721–1758.
Arthur, J. B. (1994). Effects of human resource systems on manufacturing
performance and turnover. Academy of Management Journal 37 (3), 670–
687.
Bailey, T. (1993). Organizational innovation in the apparel industry. Indus-
trial Relations 32 (1), 30–48.
Berg, P., E. Appelbaum, T. Bailey, and A. Kalleberg (1996). The perfor-
mance effects of modular production in the apparel industry. Industrial
Relations 35 (3), 356–73.
Black, S. and L. Lynch (2001). How to compete: The impact of workplace
practices and information technology on productivity. The Review of Eco-
nomics and Statistics 83 (3), 434–445.
26
Black, S. E. and L. M. Lynch (2004). What’s driving the new economy: the
benefits of workplace innovation. The Economic Journal 114, F97–F116.
Blundell, R. and S. Bond (2000). GMM estimation with persistent panel data:
An application to production functions. Econometric Reviews 19 (3), 321–
340.
Bolton, P. and M. Dewatripont (1994). The firm as a communication network.
Quarterly Journal of Economics 109, 809–339.
Bresnahan, T. F., E. Brynjolfsson, and L. M. Hitt (2002). Information tech-
nology, workplace organization and the demand for skilled labor: Firm
level evidence. Quarterly Journal of Economics 117 (1), 339–376.
Bresnahan, T. F. and M. Trajtenberg (1995). General purpose technologies
”engines of growth”? Journal of Econometrics 65, 83–108.
Brynjolfsson, E. and L. M. Hitt (1995). Information technology as a factor of
production: The role of differences among firms. Economics of Innovation
and New technology 3 (4), 183–200.
Brynjolfsson, E. and L. M. Hitt (2000). Beyond computation: Informa-
tion technology, organizational transformation and business performance.
Journal of Economic Perspectives 14 (4), 23–48.
Brynjolfsson, E. and L. M. Hitt (2003). Computing productivity: Firm-level
evidence. Review of Economics and Statistics 85 (4), 793–808.
Brynjolfsson, E. and S. Yang (2001). Intangible assets and growth accounting:
Evidence from computer investments. Technical report, Massachusetts In-
stitute of Technology.
Burris, B. H. (1998). Computerization of the workplace. Annual Review of
Sociology 24, 141–157.
27
Caroli, E. and J. V. Reenen (2001). Skilled biased organizational change? evi-
dence from a panel of british and french establishments. Quarterly Journal
of Economics 116 (4), 1449–92.
Crosby, P. (1984). Quality witht Tears: The Art of Hassle-Free Management.
New York: Mc-Graw-Hill.
Cukrowski, J. and A. Baniak (1999). Organizational restructuring in response
to changes in information-processing technology. Review of Economic De-
sign 4 (4), 295–305.
Cutcher-Gershenfeld, J. (1991). The impact on economic performance of a
transformation in workplace industrial relations. Industrial and Labor Re-
lations Review 44 (2), 241–260.
Dostie, B. and M.-P. Pelletier (2007). Les rendements de la formation en
entreprise. Canadian Public Policy 33 (1), 21–40.
Dunlop, J. and D. Weil (1996). Diffusion and performance of modular pro-
duction in the US apparel industry. Industrial Relations 35, 334–354.
Greenan, N. and D. Guellec (1997). Firm organization, technology and per-
formance: An empirical study. Economics of Innovation and New Tech-
nology 6 (4), 313–47.
Griliches, Z. and J. Mairesse (1998). Production functions: The search for
identification. In S. Strom (Ed.), Econometrics and Economic Theory in
the Twentieth Century: The Ragnar Frisch Centennial Symposium, pp.
169–203. Cambridge University Press.
Grossman, G. and E. Helpman (2005). Outsourcing in a global economy.
Review of Economic Studies 72 (1), 135–159.
Hamilton, B. H., J. A. Nickerson, and H. Owan (2003). Team incentives
and worker heterogeneity: An empirical analysis of the impact of teams
28
on productivity and participation. Journal of Political Economy 111 (3),
465–497.
Hammer, M. (1990). Reengineering work: Don’t automate, obliterate. Har-
vard Business Review July-August, 105–115.
Hammer, M. and J. A. Champy (1993). Reengineering the Corporation: A
Manifesto for Business Revolution. New York: Harper Business Books.
Huselid, M. A. (1995). The impact of human resource management practices
on turnover, productivity, and corporate financial performance. Academy
of Management Journal 38 (3), 635–672.
Huselid, M. A. and B. E. Becker (1996). Methodological issues in cross-
sectional and panel estimates of human resource-firm performance link.
Industrial Relations 35 (3), 400–422.
Ichniowski, C. (1992). Human resource practices and productive labor man-
agement relations. In D. Lewin, O. Mitchell, and P. Sherer (Eds.), Re-
search Frontiers in Industrial Relations and Human Resources, pp. 239–
271. IRRA, Madison, Wisconsin.
Ichniowski, C., K. Shaw, and G. Prennushi (1997). The effects of human
resource management practices on productivity: A study of steel finishing
lines. American Economic Review 87 (3), 291–313.
Jorgensen, D., M. S. Ho, and K. J. Stiroh (2006). Potential growth of the
u.s. economy: Will the productivity resurgence continue? Business Eco-
nomics 41 (1), 7–16.
Jorgensen, D. and K. J. Stiroh (2000). Raising the speed limit: Us economic
growth in the information age. Brookings Papers on Economic Activ-
ity 2000 (1), 125–135.
Juran, J. (1992). Juran on quality by Design. New York: Free Press.
29
Kato, T. and M. Morishima (2002). The productivity effects of participatory
employment practices: Evidence from new japanese panel data. Industrial
Relations 4 (4), 487–520.
Kelley, M. (1994). Information technology and productivity: The elusive con-
nection. Management Science 40, 1406–25.
Kelley, M. (1996). Participative bureaucracy and productivity in the ma-
chined products sector. Industrial Relations 35, 374–99.
Kling, R. (1994). Technology, ideology and social transformation: The case
of computerization and work organization. Revue International de Soci-
ologie 2 (3), 28–56.
Knez, M. and D. Simester (2001). Firm-wide incentives and mutual monitor-
ing at continental airlines. Journal of Labor Economics 19 (4), 743–72.
Krafcik, J. (1988). A triumph of the lean production system. Sloan Manage-
ment Review 30, 41–52.
Lazear, E. (2000). Performance pay and productivity. American Economic
Review 90 (5), 1346–361.
Meagher, K. (2003). Generalizing incentives and loss of control in an optimal
hierarchy: The role of information technology. Economics Letters 78 (2),
273–280.
Mookherjee, D. (2006). Decentralization, hierarchies, and incentives: A mech-
anism design perspective. Journal of Economic Literature 44 (2), 367–390.
Oliner, S. and D. Sichel (2000). The resurgence of growth in the late 1990s:
Is information technology the story? Journal of Economic Perspec-
tives 14 (1), 3–22.
Powell, T. C. (1995). Total quality management as competitive advantage: A
review and empirical study. Strategic Management Journal 16, 15–37.
30
Radner, R. (1993). The organization in decentralized information processing.
Econometrica 61 (5), 1109–1146.
Stiroh, K. (2004). Reassessing the role of IT in the production function: A
meta-analysis. Technical report, Working Paper - Federal Reserve Bank
of New York.
Turcotte, J. and L. W. Rennison (2004). Productivity and wages: Measuring
the effect of human capital and technology use from linked employer-
employee data. International Productivity Monitor (9), 25–36.
Wilms, W. (1995). NUMMI: An Ethnographic Study. New York: The Free
Press.
31
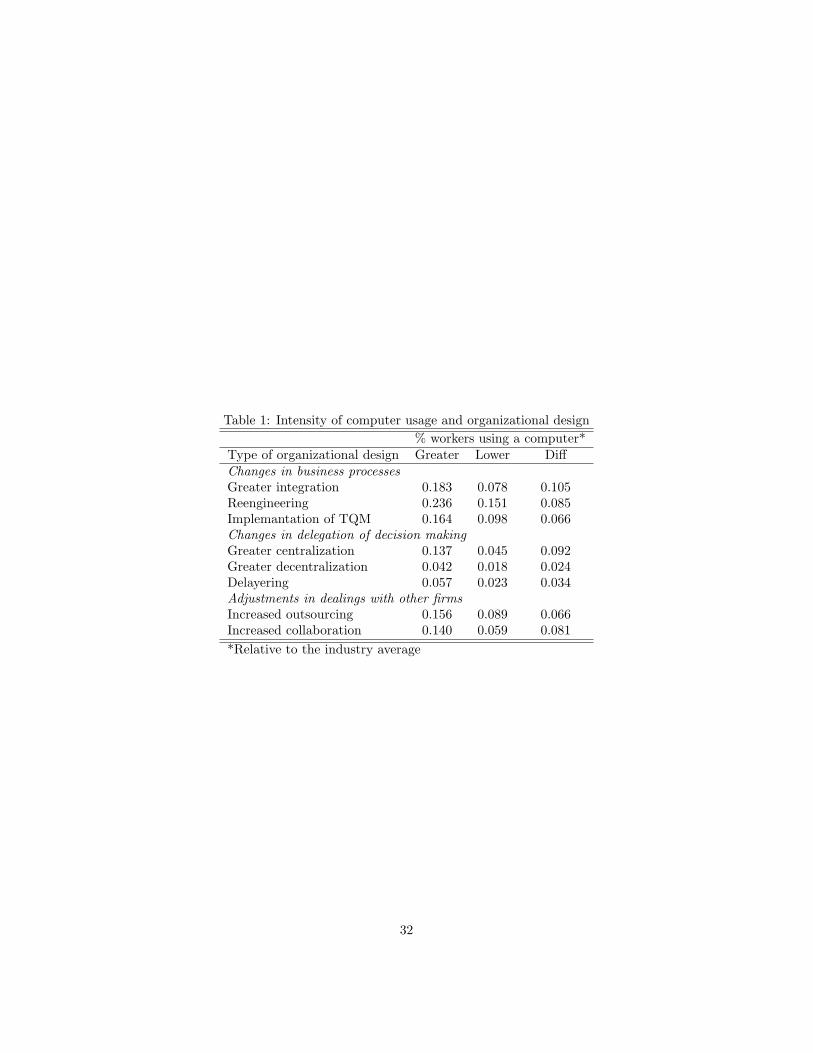
Table 1: Intensity of computer usage and organizational design% workers using a computer*
Type of organizational design Greater Lower DiffChanges in business processesGreater integration 0.183 0.078 0.105Reengineering 0.236 0.151 0.085Implemantation of TQM 0.164 0.098 0.066Changes in delegation of decision makingGreater centralization 0.137 0.045 0.092Greater decentralization 0.042 0.018 0.024Delayering 0.057 0.023 0.034Adjustments in dealings with other firmsIncreased outsourcing 0.156 0.089 0.066Increased collaboration 0.140 0.059 0.081*Relative to the industry average
32
Tab
le2:
Sum
mar
yst
atis
tics
1999
2001
2003
AL
LV
aria
ble
Mea
nSt
dD
ev.
Mea
nSt
dD
ev.
Mea
nSt
dD
ev.
Mea
nSt
dD
ev.
ln(V
alue
adde
d)($
)12
.461
1.52
812
.446
1.49
512
.431
1.50
512
.508
1.49
1ln
(K)
(000
,000
$)0.
516
3.42
30.
667
4.67
70.
556
3.96
30.
576
3.94
9ln
(L)
1.71
21.
106
1.79
61.
107
1.82
11.
113
1.82
01.
105
Pro
p.C
PU
Use
rs0.
473
0.42
00.
520
0.41
20.
539
0.41
40.
519
0.46
5W
orkfo
rce
contr
olva
riab
les
Pro
port
ion
unio
nize
d0.
046
0.17
90.
051
0.18
50.
041
0.17
40.
050
0.18
7P
ropo
rtio
nm
anag
ers
0.17
50.
215
0.23
80.
267
0.20
20.
242
0.20
30.
238
Pro
port
ion
grad
uate
s0.
125
0.25
20.
125
0.26
70.
115
0.25
70.
124
0.26
6N
umbe
rof
obs.
4625
4457
4455
2600
6
33
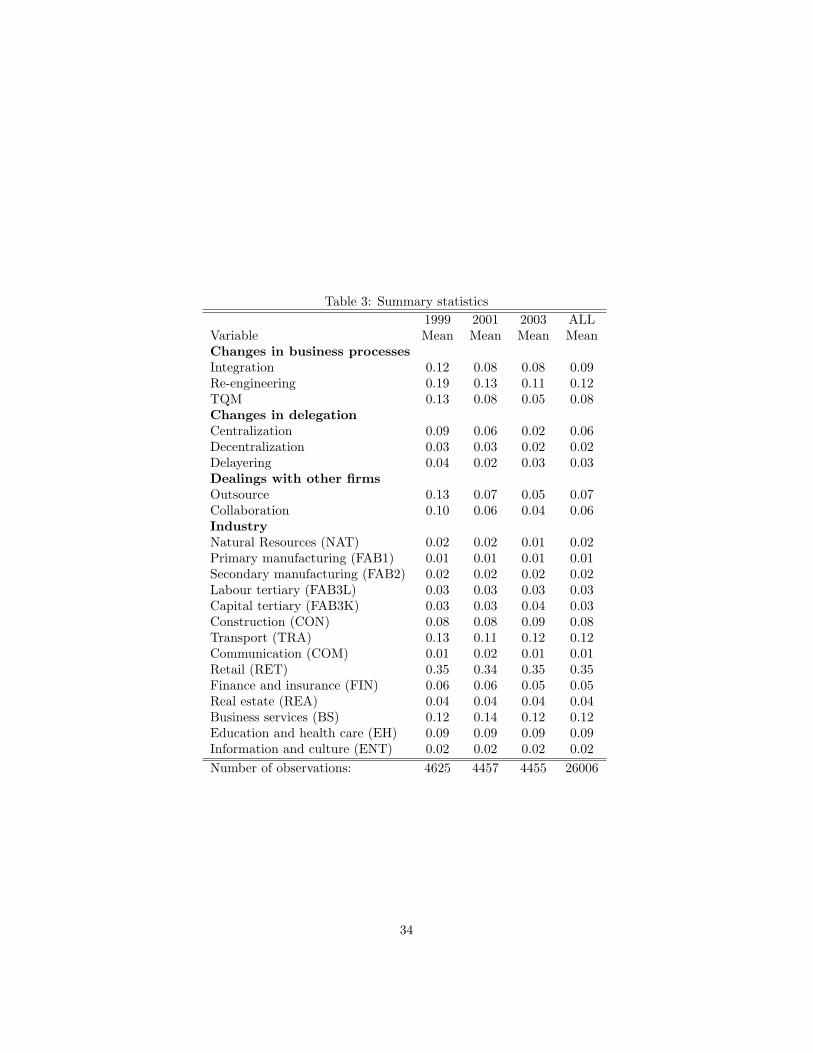
Table 3: Summary statistics1999 2001 2003 ALL
Variable Mean Mean Mean MeanChanges in business processesIntegration 0.12 0.08 0.08 0.09Re-engineering 0.19 0.13 0.11 0.12TQM 0.13 0.08 0.05 0.08Changes in delegationCentralization 0.09 0.06 0.02 0.06Decentralization 0.03 0.03 0.02 0.02Delayering 0.04 0.02 0.03 0.03Dealings with other firmsOutsource 0.13 0.07 0.05 0.07Collaboration 0.10 0.06 0.04 0.06IndustryNatural Resources (NAT) 0.02 0.02 0.01 0.02Primary manufacturing (FAB1) 0.01 0.01 0.01 0.01Secondary manufacturing (FAB2) 0.02 0.02 0.02 0.02Labour tertiary (FAB3L) 0.03 0.03 0.03 0.03Capital tertiary (FAB3K) 0.03 0.03 0.04 0.03Construction (CON) 0.08 0.08 0.09 0.08Transport (TRA) 0.13 0.11 0.12 0.12Communication (COM) 0.01 0.02 0.01 0.01Retail (RET) 0.35 0.34 0.35 0.35Finance and insurance (FIN) 0.06 0.06 0.05 0.05Real estate (REA) 0.04 0.04 0.04 0.04Business services (BS) 0.12 0.14 0.12 0.12Education and health care (EH) 0.09 0.09 0.09 0.09Information and culture (ENT) 0.02 0.02 0.02 0.02Number of observations: 4625 4457 4455 26006
34
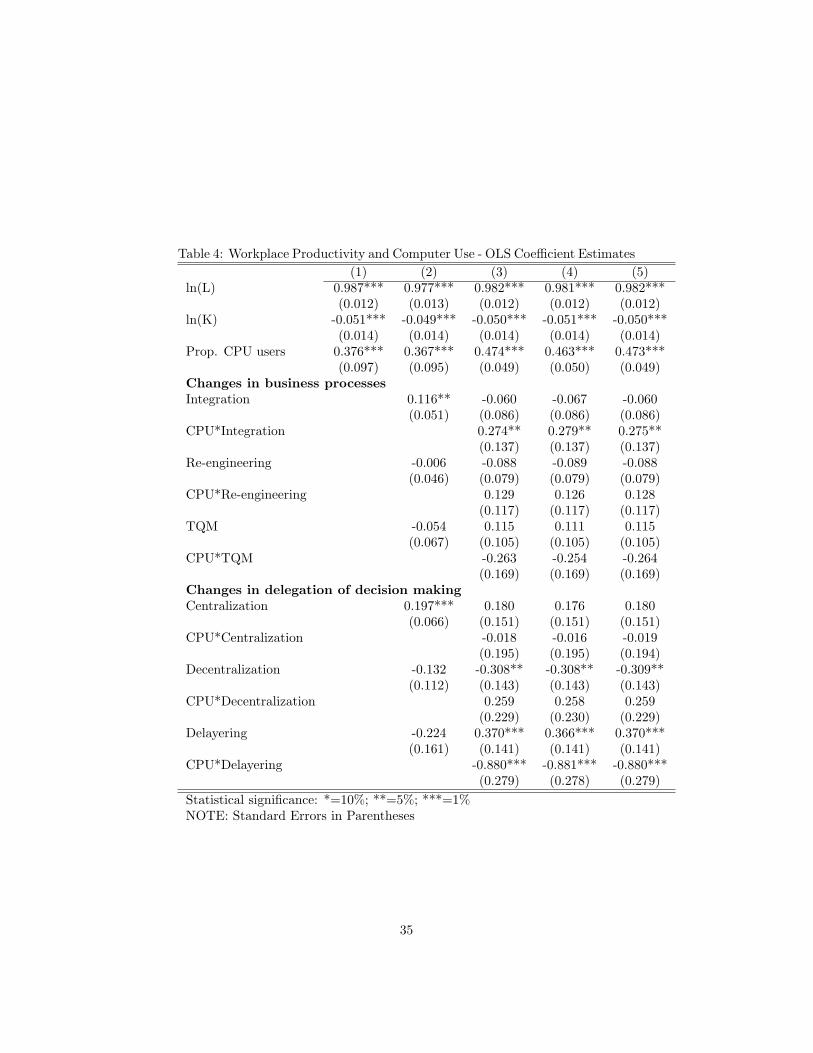
Table 4: Workplace Productivity and Computer Use - OLS Coefficient Estimates(1) (2) (3) (4) (5)
ln(L) 0.987*** 0.977*** 0.982*** 0.981*** 0.982***(0.012) (0.013) (0.012) (0.012) (0.012)
ln(K) -0.051*** -0.049*** -0.050*** -0.051*** -0.050***(0.014) (0.014) (0.014) (0.014) (0.014)
Prop. CPU users 0.376*** 0.367*** 0.474*** 0.463*** 0.473***(0.097) (0.095) (0.049) (0.050) (0.049)
Changes in business processesIntegration 0.116** -0.060 -0.067 -0.060
(0.051) (0.086) (0.086) (0.086)CPU*Integration 0.274** 0.279** 0.275**
(0.137) (0.137) (0.137)Re-engineering -0.006 -0.088 -0.089 -0.088
(0.046) (0.079) (0.079) (0.079)CPU*Re-engineering 0.129 0.126 0.128
(0.117) (0.117) (0.117)TQM -0.054 0.115 0.111 0.115
(0.067) (0.105) (0.105) (0.105)CPU*TQM -0.263 -0.254 -0.264
(0.169) (0.169) (0.169)Changes in delegation of decision makingCentralization 0.197*** 0.180 0.176 0.180
(0.066) (0.151) (0.151) (0.151)CPU*Centralization -0.018 -0.016 -0.019
(0.195) (0.195) (0.194)Decentralization -0.132 -0.308** -0.308** -0.309**
(0.112) (0.143) (0.143) (0.143)CPU*Decentralization 0.259 0.258 0.259
(0.229) (0.230) (0.229)Delayering -0.224 0.370*** 0.366*** 0.370***
(0.161) (0.141) (0.141) (0.141)CPU*Delayering -0.880*** -0.881*** -0.880***
(0.279) (0.278) (0.279)Statistical significance: *=10%; **=5%; ***=1%NOTE: Standard Errors in Parentheses
35
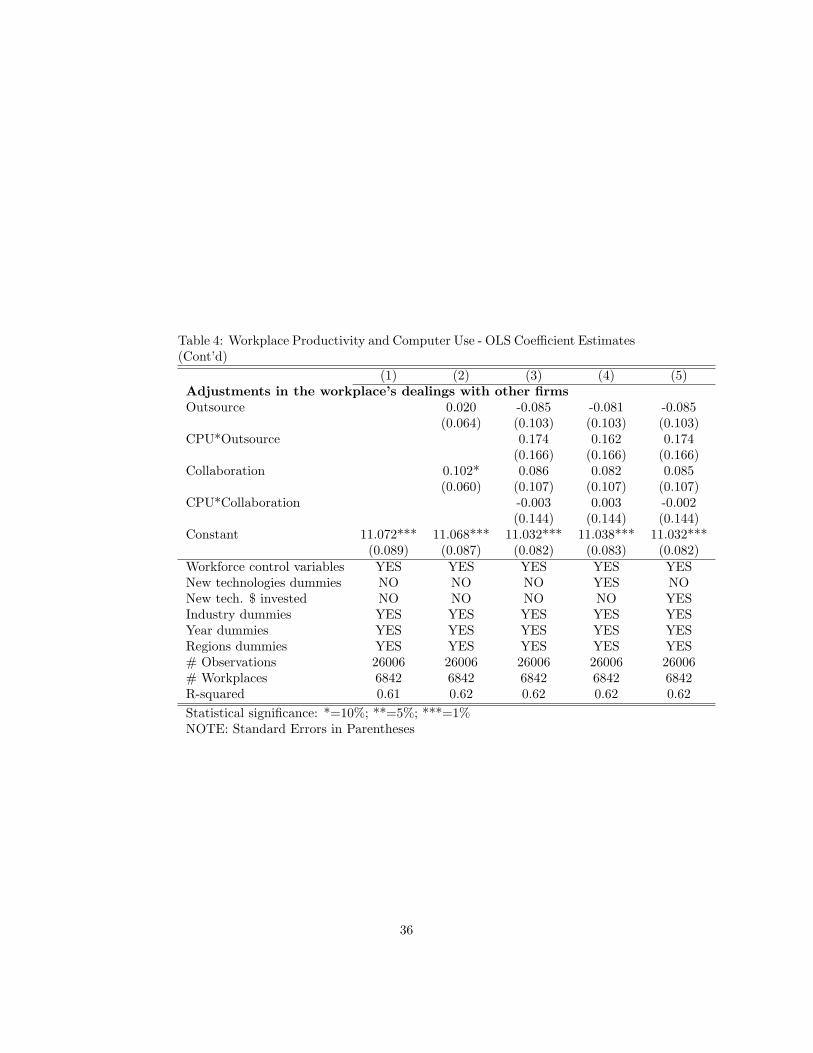
Table 4: Workplace Productivity and Computer Use - OLS Coefficient Estimates(Cont’d)
(1) (2) (3) (4) (5)Adjustments in the workplace’s dealings with other firmsOutsource 0.020 -0.085 -0.081 -0.085
(0.064) (0.103) (0.103) (0.103)CPU*Outsource 0.174 0.162 0.174
(0.166) (0.166) (0.166)Collaboration 0.102* 0.086 0.082 0.085
(0.060) (0.107) (0.107) (0.107)CPU*Collaboration -0.003 0.003 -0.002
(0.144) (0.144) (0.144)Constant 11.072*** 11.068*** 11.032*** 11.038*** 11.032***
(0.089) (0.087) (0.082) (0.083) (0.082)Workforce control variables YES YES YES YES YESNew technologies dummies NO NO NO YES NONew tech. $ invested NO NO NO NO YESIndustry dummies YES YES YES YES YESYear dummies YES YES YES YES YESRegions dummies YES YES YES YES YES# Observations 26006 26006 26006 26006 26006# Workplaces 6842 6842 6842 6842 6842R-squared 0.61 0.62 0.62 0.62 0.62Statistical significance: *=10%; **=5%; ***=1%NOTE: Standard Errors in Parentheses
36
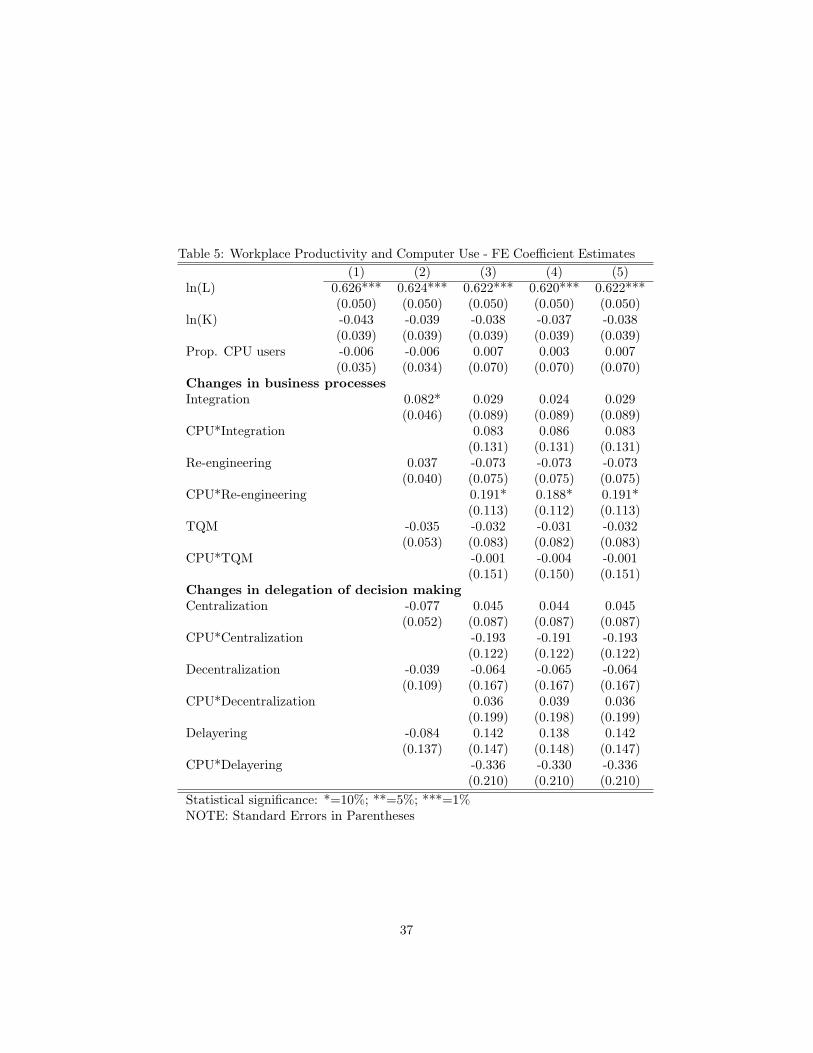
Table 5: Workplace Productivity and Computer Use - FE Coefficient Estimates(1) (2) (3) (4) (5)
ln(L) 0.626*** 0.624*** 0.622*** 0.620*** 0.622***(0.050) (0.050) (0.050) (0.050) (0.050)
ln(K) -0.043 -0.039 -0.038 -0.037 -0.038(0.039) (0.039) (0.039) (0.039) (0.039)
Prop. CPU users -0.006 -0.006 0.007 0.003 0.007(0.035) (0.034) (0.070) (0.070) (0.070)
Changes in business processesIntegration 0.082* 0.029 0.024 0.029
(0.046) (0.089) (0.089) (0.089)CPU*Integration 0.083 0.086 0.083
(0.131) (0.131) (0.131)Re-engineering 0.037 -0.073 -0.073 -0.073
(0.040) (0.075) (0.075) (0.075)CPU*Re-engineering 0.191* 0.188* 0.191*
(0.113) (0.112) (0.113)TQM -0.035 -0.032 -0.031 -0.032
(0.053) (0.083) (0.082) (0.083)CPU*TQM -0.001 -0.004 -0.001
(0.151) (0.150) (0.151)Changes in delegation of decision makingCentralization -0.077 0.045 0.044 0.045
(0.052) (0.087) (0.087) (0.087)CPU*Centralization -0.193 -0.191 -0.193
(0.122) (0.122) (0.122)Decentralization -0.039 -0.064 -0.065 -0.064
(0.109) (0.167) (0.167) (0.167)CPU*Decentralization 0.036 0.039 0.036
(0.199) (0.198) (0.199)Delayering -0.084 0.142 0.138 0.142
(0.137) (0.147) (0.148) (0.147)CPU*Delayering -0.336 -0.330 -0.336
(0.210) (0.210) (0.210)Statistical significance: *=10%; **=5%; ***=1%NOTE: Standard Errors in Parentheses
37
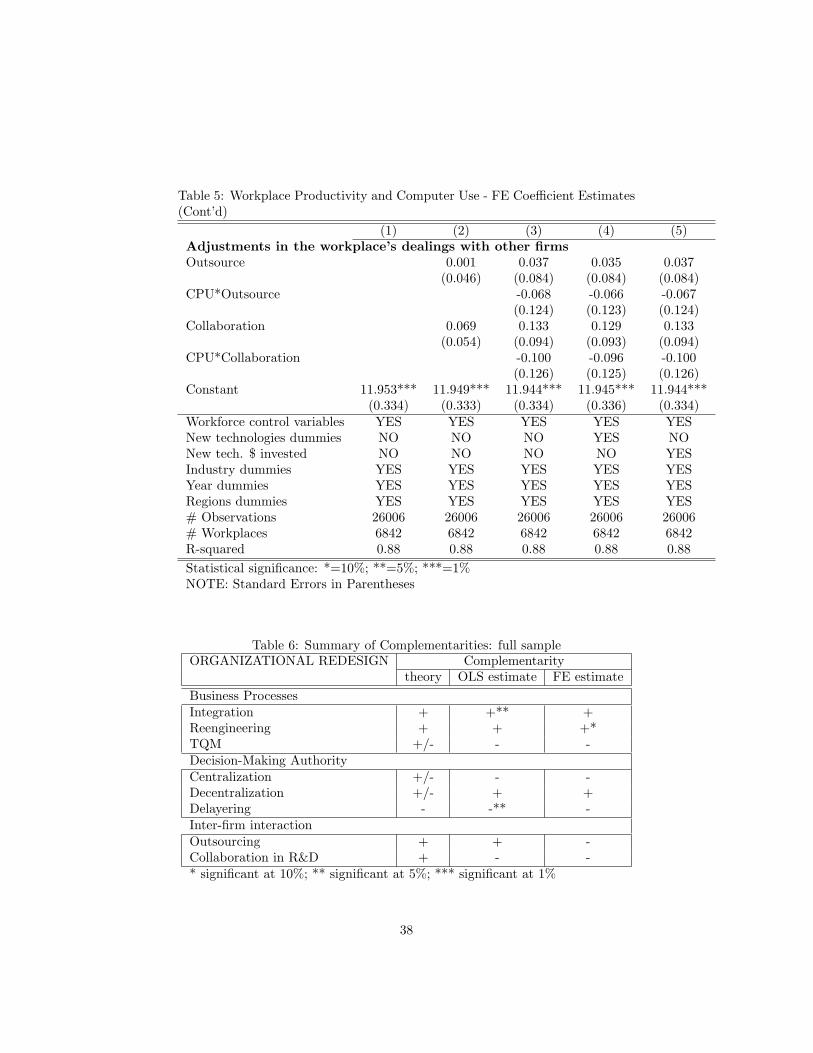
Table 5: Workplace Productivity and Computer Use - FE Coefficient Estimates(Cont’d)
(1) (2) (3) (4) (5)Adjustments in the workplace’s dealings with other firmsOutsource 0.001 0.037 0.035 0.037
(0.046) (0.084) (0.084) (0.084)CPU*Outsource -0.068 -0.066 -0.067
(0.124) (0.123) (0.124)Collaboration 0.069 0.133 0.129 0.133
(0.054) (0.094) (0.093) (0.094)CPU*Collaboration -0.100 -0.096 -0.100
(0.126) (0.125) (0.126)Constant 11.953*** 11.949*** 11.944*** 11.945*** 11.944***
(0.334) (0.333) (0.334) (0.336) (0.334)Workforce control variables YES YES YES YES YESNew technologies dummies NO NO NO YES NONew tech. $ invested NO NO NO NO YESIndustry dummies YES YES YES YES YESYear dummies YES YES YES YES YESRegions dummies YES YES YES YES YES# Observations 26006 26006 26006 26006 26006# Workplaces 6842 6842 6842 6842 6842R-squared 0.88 0.88 0.88 0.88 0.88Statistical significance: *=10%; **=5%; ***=1%NOTE: Standard Errors in Parentheses
Table 6: Summary of Complementarities: full sampleORGANIZATIONAL REDESIGN Complementarity
theory OLS estimate FE estimateBusiness ProcessesIntegration + +** +Reengineering + + +*TQM +/- - -Decision-Making AuthorityCentralization +/- - -Decentralization +/- + +Delayering - -** -Inter-firm interactionOutsourcing + + -Collaboration in R&D + - -* significant at 10%; ** significant at 5%; *** significant at 1%
38
Tab
le7:
Sum
mar
ySt
atis
tics
byIn
dust
ryN
AT
FAB
2FA
B3L
FAB
3KC
ON
CO
MF
INB
SE
NT
Pro
p.C
PU
user
s0.
399
0.39
90.
320
0.48
00.
298
0.40
20.
882
0.77
90.
785
Ch
ange
sin
bu
sin
ess
pro
cess
esIn
tegr
atio
n0.
123
0.14
30.
117
0.15
50.
066
0.14
80.
191
0.08
20.
182
Re-
engi
neer
ing
0.13
70.
215
0.20
30.
273
0.09
60.
175
0.24
50.
134
0.23
5T
QM
0.07
60.
165
0.12
00.
166
0.07
10.
104
0.09
30.
068
0.07
7C
han
ges
ind
eleg
atio
nof
dec
isio
nm
akin
gC
entr
aliz
atio
n0.
081
0.09
40.
060
0.13
00.
032
0.10
70.
165
0.05
60.
105
Dec
entr
aliz
atio
n0.
020
0.01
90.
031
0.03
80.
012
0.04
80.
022
0.02
20.
061
Del
ayer
ing
0.04
60.
028
0.03
20.
027
0.02
90.
047
0.03
80.
029
0.04
7A
dju
stm
ents
inth
ew
orkp
lace
’sd
eali
ngs
wit
hot
her
firm
sO
utso
urce
0.06
70.
097
0.13
00.
157
0.09
50.
089
0.06
90.
061
0.07
7C
olla
bora
tion
0.04
80.
131
0.09
90.
158
0.04
60.
064
0.09
50.
072
0.08
9
39
Tab
le8:
Wor
kpla
ceP
rodu
ctiv
ity
and
Com
pute
rU
se-
OL
SC
oeffi
cien
tE
stim
ates
byIn
dust
ryN
AT
FAB
2FA
B3L
FAB
3KC
ON
CO
MF
INB
SE
NT
ln(L
)0.
967*
**1.
063*
**1.
115*
**1.
105*
**0.
957*
**1.
110*
**1.
041*
**0.
994*
**0.
992*
**(0
.040
)(0
.025
)(0
.029
)(0
.027
)(0
.033
)(0
.023
)(0
.030
)(0
.027
)(0
.038
)ln
(K)
0.22
9***
-0.0
29-0
.011
-0.0
07-0
.537
0.02
6**
-0.2
71-0
.040
0.14
7**
(0.0
34)
(0.0
40)
(0.0
34)
(0.0
29)
(0.3
32)
(0.0
12)
(0.7
25)
(0.0
43)
(0.0
70)
Pro
p.C
PU
user
s0.
552*
**0.
331*
*0.
535*
**0.
371*
*0.
227*
0.23
8**
0.00
20.
640*
**0.
117
(0.1
58)
(0.1
32)
(0.1
19)
(0.1
72)
(0.1
25)
(0.1
05)
(0.1
92)
(0.1
12)
(0.1
56)
Ch
ange
sin
bu
sin
ess
pro
cess
esIn
tegr
atio
n0.
539
0.28
6-0
.263
0.04
0-0
.210
-0.0
290.
798*
-0.2
310.
440
(0.3
85)
(0.1
84)
(0.1
63)
(0.1
70)
(0.1
63)
(0.1
88)
(0.4
49)
(0.3
24)
(0.4
72)
CP
U*I
nteg
rati
on-1
.248
**-0
.142
0.62
8*0.
097
0.78
1*0.
189
-0.6
310.
795*
*-0
.530
(0.5
52)
(0.3
74)
(0.3
51)
(0.3
66)
(0.4
13)
(0.2
90)
(0.4
80)
(0.3
85)
(0.5
45)
Re-
engi
neer
ing
-0.3
21-0
.014
0.02
3-0
.182
-0.1
94-0
.088
-1.6
52**
0.18
1-0
.694
**(0
.317
)(0
.120
)(0
.136
)(0
.170
)(0
.237
)(0
.159
)(0
.675
)(0
.204
)(0
.319
)C
PU
*Re-
engi
neer
ing
0.17
40.
034
0.21
70.
534*
0.59
4-0
.136
1.33
9*-0
.086
1.01
4**
(0.4
83)
(0.2
59)
(0.2
45)
(0.3
02)
(0.4
53)
(0.2
42)
(0.7
02)
(0.2
41)
(0.4
00)
TQ
M-0
.274
-0.0
21-0
.035
0.00
5-0
.322
-0.0
92-0
.534
-0.2
47-0
.963
**(0
.280
)(0
.128
)(0
.149
)(0
.159
)(0
.292
)(0
.170
)(0
.477
)(0
.266
)(0
.445
)C
PU
*TQ
M0.
433
-0.1
77-0
.071
0.75
2**
0.38
7-0
.085
0.47
1-0
.080
0.96
6*(0
.691
)(0
.249
)(0
.316
)(0
.360
)(0
.465
)(0
.264
)(0
.523
)(0
.290
)(0
.507
)C
han
ges
ind
eleg
atio
nof
dec
isio
nm
akin
gC
entr
aliz
atio
n0.
445
-0.4
55**
-0.2
22-0
.595
***
0.37
5-0
.037
-0.2
280.
194
1.22
2**
(0.5
34)
(0.2
12)
(0.1
98)
(0.2
11)
(0.2
34)
(0.1
98)
(0.3
23)
(0.4
24)
(0.5
72)
CP
U*C
entr
aliz
atio
n0.
577
1.61
7***
-0.0
031.
478*
**-1
.130
**0.
063
0.64
6*-0
.609
-0.8
58(1
.045
)(0
.435
)(0
.413
)(0
.366
)(0
.460
)(0
.303
)(0
.389
)(0
.491
)(0
.657
)D
ecen
tral
izat
ion
0.04
10.
072
-0.2
240.
035
0.22
40.
339
0.89
7*-0
.300
-0.2
49(0
.336
)(0
.229
)(0
.175
)(0
.221
)(0
.369
)(0
.246
)(0
.512
)(0
.370
)(0
.604
)C
PU
*Dec
entr
aliz
atio
n0.
039
0.25
4-0
.016
-0.5
04-0
.062
-0.1
91-0
.444
0.17
20.
309
(0.7
48)
(0.3
45)
(0.3
54)
(0.4
78)
(0.7
03)
(0.3
80)
(0.5
73)
(0.5
48)
(0.6
19)
Del
ayer
ing
0.48
20.
561*
-0.1
370.
140
0.45
60.
115
0.48
00.
741*
0.44
9(0
.390
)(0
.318
)(0
.150
)(0
.170
)(0
.287
)(0
.236
)(0
.440
)(0
.390
)(0
.620
)C
PU
*Del
ayer
ing
-0.8
60-0
.956
*0.
775*
-0.8
03**
-0.5
86-0
.303
-0.4
11-0
.841
*-1
.191
*(0
.823
)(0
.571
)(0
.448
)(0
.332
)(0
.556
)(0
.379
)(0
.520
)(0
.461
)(0
.713
)St
atis
tica
lsi
gnifi
canc
e:*=
10%
;**
=5%
;**
*=1%
NO
TE
:St
anda
rdE
rror
sin
Par
enth
eses
40
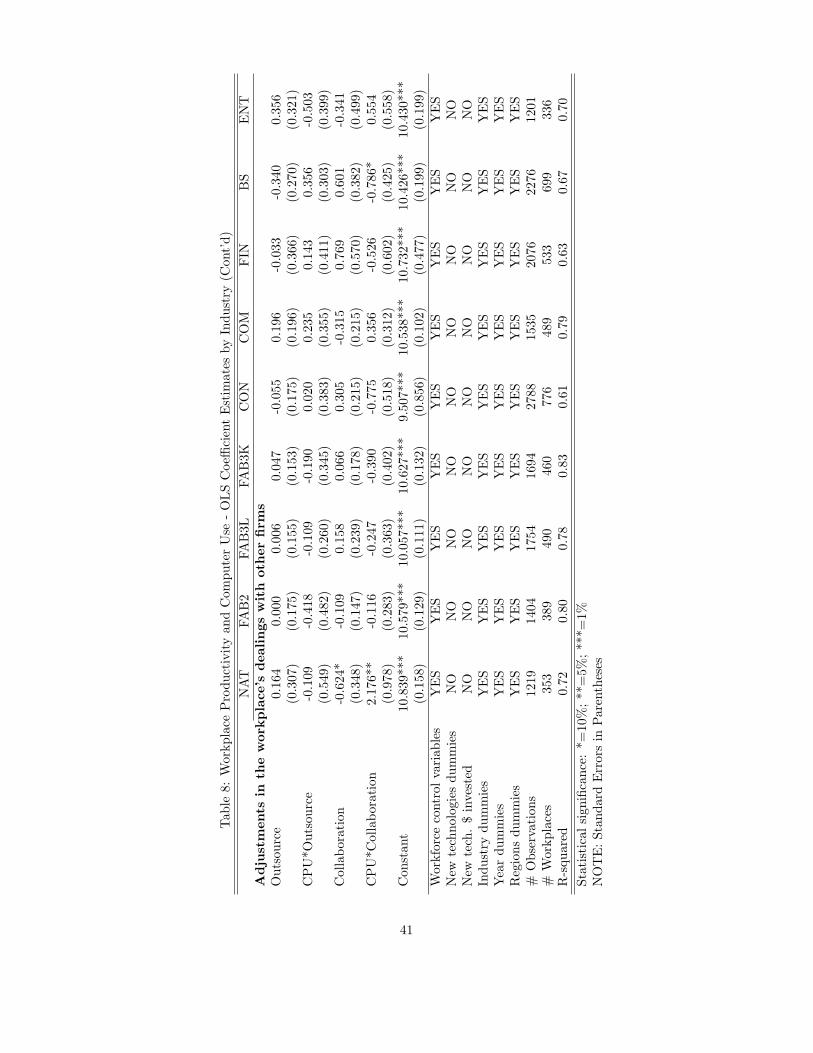
Tab
le8:
Wor
kpla
ceP
rodu
ctiv
ity
and
Com
pute
rU
se-
OL
SC
oeffi
cien
tE
stim
ates
byIn
dust
ry(C
ont’
d)N
AT
FAB
2FA
B3L
FAB
3KC
ON
CO
MF
INB
SE
NT
Ad
just
men
tsin
the
wor
kp
lace
’sd
eali
ngs
wit
hot
her
firm
sO
utso
urce
0.16
40.
000
0.00
60.
047
-0.0
550.
196
-0.0
33-0
.340
0.35
6(0
.307
)(0
.175
)(0
.155
)(0
.153
)(0
.175
)(0
.196
)(0
.366
)(0
.270
)(0
.321
)C
PU
*Out
sour
ce-0
.109
-0.4
18-0
.109
-0.1
900.
020
0.23
50.
143
0.35
6-0
.503
(0.5
49)
(0.4
82)
(0.2
60)
(0.3
45)
(0.3
83)
(0.3
55)
(0.4
11)
(0.3
03)
(0.3
99)
Col
labo
rati
on-0
.624
*-0
.109
0.15
80.
066
0.30
5-0
.315
0.76
90.
601
-0.3
41(0
.348
)(0
.147
)(0
.239
)(0
.178
)(0
.215
)(0
.215
)(0
.570
)(0
.382
)(0
.499
)C
PU
*Col
labo
rati
on2.
176*
*-0
.116
-0.2
47-0
.390
-0.7
750.
356
-0.5
26-0
.786
*0.
554
(0.9
78)
(0.2
83)
(0.3
63)
(0.4
02)
(0.5
18)
(0.3
12)
(0.6
02)
(0.4
25)
(0.5
58)
Con
stan
t10
.839
***
10.5
79**
*10
.057
***
10.6
27**
*9.
507*
**10
.538
***
10.7
32**
*10
.426
***
10.4
30**
*(0
.158
)(0
.129
)(0
.111
)(0
.132
)(0
.856
)(0
.102
)(0
.477
)(0
.199
)(0
.199
)W
orkf
orce
cont
rol
vari
able
sY
ES
YE
SY
ES
YE
SY
ES
YE
SY
ES
YE
SY
ES
New
tech
nolo
gies
dum
mie
sN
ON
ON
ON
ON
ON
ON
ON
ON
ON
ewte
ch.
$in
vest
edN
ON
ON
ON
ON
ON
ON
ON
ON
OIn
dust
rydu
mm
ies
YE
SY
ES
YE
SY
ES
YE
SY
ES
YE
SY
ES
YE
SY
ear
dum
mie
sY
ES
YE
SY
ES
YE
SY
ES
YE
SY
ES
YE
SY
ES
Reg
ions
dum
mie
sY
ES
YE
SY
ES
YE
SY
ES
YE
SY
ES
YE
SY
ES
#O
bser
vati
ons
1219
1404
1754
1694
2788
1535
2076
2276
1201
#W
orkp
lace
s35
338
949
046
077
648
953
369
933
6R
-squ
ared
0.72
0.80
0.78
0.83
0.61
0.79
0.63
0.67
0.70
Stat
isti
cal
sign
ifica
nce:
*=10
%;
**=
5%;
***=
1%N
OT
E:
Stan
dard
Err
ors
inP
aren
thes
es
41
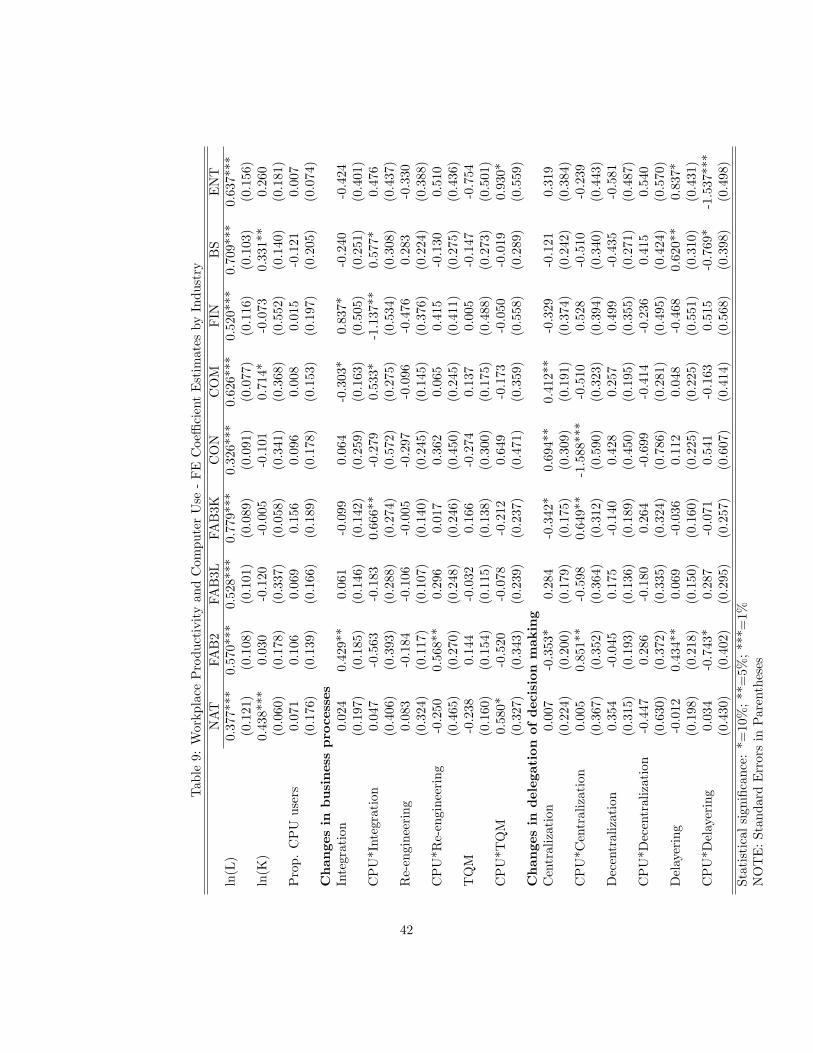
Tab
le9:
Wor
kpla
ceP
rodu
ctiv
ity
and
Com
pute
rU
se-
FE
Coe
ffici
ent
Est
imat
esby
Indu
stry
NA
TFA
B2
FAB
3LFA
B3K
CO
NC
OM
FIN
BS
EN
Tln
(L)
0.37
7***
0.57
0***
0.52
8***
0.77
9***
0.32
6***
0.62
6***
0.52
0***
0.70
9***
0.63
7***
(0.1
21)
(0.1
08)
(0.1
01)
(0.0
89)
(0.0
91)
(0.0
77)
(0.1
16)
(0.1
03)
(0.1
56)
ln(K
)0.
438*
**0.
030
-0.1
20-0
.005
-0.1
010.
714*
-0.0
730.
331*
*0.
260
(0.0
60)
(0.1
78)
(0.3
37)
(0.0
58)
(0.3
41)
(0.3
68)
(0.5
52)
(0.1
40)
(0.1
81)
Pro
p.C
PU
user
s0.
071
0.10
60.
069
0.15
60.
096
0.00
80.
015
-0.1
210.
007
(0.1
76)
(0.1
39)
(0.1
66)
(0.1
89)
(0.1
78)
(0.1
53)
(0.1
97)
(0.2
05)
(0.0
74)
Ch
ange
sin
bu
sin
ess
pro
cess
esIn
tegr
atio
n0.
024
0.42
9**
0.06
1-0
.099
0.06
4-0
.303
*0.
837*
-0.2
40-0
.424
(0.1
97)
(0.1
85)
(0.1
46)
(0.1
42)
(0.2
59)
(0.1
63)
(0.5
05)
(0.2
51)
(0.4
01)
CP
U*I
nteg
rati
on0.
047
-0.5
63-0
.183
0.66
6**
-0.2
790.
533*
-1.1
37**
0.57
7*0.
476
(0.4
06)
(0.3
93)
(0.2
88)
(0.2
74)
(0.5
72)
(0.2
75)
(0.5
34)
(0.3
08)
(0.4
37)
Re-
engi
neer
ing
0.08
3-0
.184
-0.1
06-0
.005
-0.2
97-0
.096
-0.4
760.
283
-0.3
30(0
.324
)(0
.117
)(0
.107
)(0
.140
)(0
.245
)(0
.145
)(0
.376
)(0
.224
)(0
.388
)C
PU
*Re-
engi
neer
ing
-0.2
500.
568*
*0.
296
0.01
70.
362
0.06
50.
415
-0.1
300.
510
(0.4
65)
(0.2
70)
(0.2
48)
(0.2
46)
(0.4
50)
(0.2
45)
(0.4
11)
(0.2
75)
(0.4
36)
TQ
M-0
.238
0.14
4-0
.032
0.16
6-0
.274
0.13
70.
005
-0.1
47-0
.754
(0.1
60)
(0.1
54)
(0.1
15)
(0.1
38)
(0.3
00)
(0.1
75)
(0.4
88)
(0.2
73)
(0.5
01)
CP
U*T
QM
0.58
0*-0
.520
-0.0
78-0
.212
0.64
9-0
.173
-0.0
50-0
.019
0.93
0*(0
.327
)(0
.343
)(0
.239
)(0
.237
)(0
.471
)(0
.359
)(0
.558
)(0
.289
)(0
.559
)C
han
ges
ind
eleg
atio
nof
dec
isio
nm
akin
gC
entr
aliz
atio
n0.
007
-0.3
53*
0.28
4-0
.342
*0.
694*
*0.
412*
*-0
.329
-0.1
210.
319
(0.2
24)
(0.2
00)
(0.1
79)
(0.1
75)
(0.3
09)
(0.1
91)
(0.3
74)
(0.2
42)
(0.3
84)
CP
U*C
entr
aliz
atio
n0.
005
0.85
1**
-0.5
980.
649*
*-1
.588
***
-0.5
100.
528
-0.5
10-0
.239
(0.3
67)
(0.3
52)
(0.3
64)
(0.3
12)
(0.5
90)
(0.3
23)
(0.3
94)
(0.3
40)
(0.4
43)
Dec
entr
aliz
atio
n0.
354
-0.0
450.
175
-0.1
400.
428
0.25
70.
499
-0.4
35-0
.581
(0.3
15)
(0.1
93)
(0.1
36)
(0.1
89)
(0.4
50)
(0.1
95)
(0.3
55)
(0.2
71)
(0.4
87)
CP
U*D
ecen
tral
izat
ion
-0.4
470.
286
-0.1
800.
264
-0.6
99-0
.414
-0.2
360.
415
0.54
0(0
.630
)(0
.372
)(0
.335
)(0
.324
)(0
.786
)(0
.281
)(0
.495
)(0
.424
)(0
.570
)D
elay
erin
g-0
.012
0.43
4**
0.06
9-0
.036
0.11
20.
048
-0.4
680.
620*
*0.
837*
(0.1
98)
(0.2
18)
(0.1
50)
(0.1
60)
(0.2
25)
(0.2
25)
(0.5
51)
(0.3
10)
(0.4
31)
CP
U*D
elay
erin
g0.
034
-0.7
43*
0.28
7-0
.071
0.54
1-0
.163
0.51
5-0
.769
*-1
.537
***
(0.4
30)
(0.4
02)
(0.2
95)
(0.2
57)
(0.6
07)
(0.4
14)
(0.5
68)
(0.3
98)
(0.4
98)
Stat
isti
cal
sign
ifica
nce:
*=10
%;
**=
5%;
***=
1%N
OT
E:
Stan
dard
Err
ors
inP
aren
thes
es
42
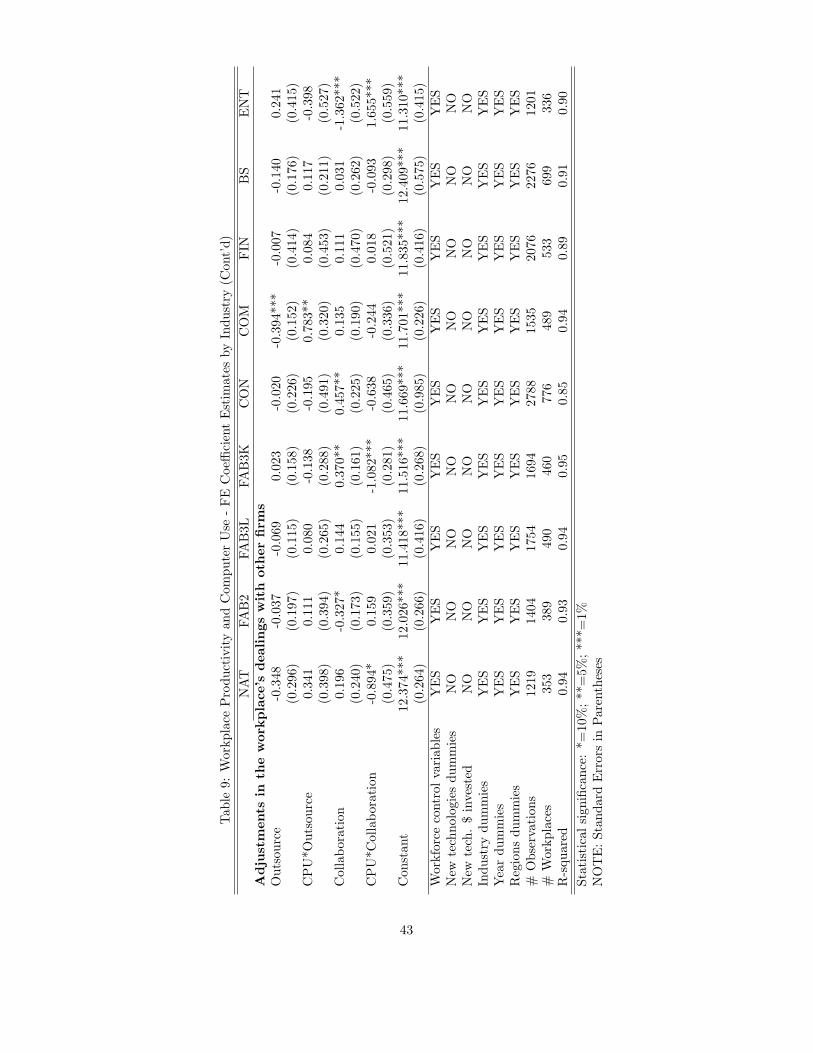
Tab
le9:
Wor
kpla
ceP
rodu
ctiv
ity
and
Com
pute
rU
se-
FE
Coe
ffici
ent
Est
imat
esby
Indu
stry
(Con
t’d)
NA
TFA
B2
FAB
3LFA
B3K
CO
NC
OM
FIN
BS
EN
TA
dju
stm
ents
inth
ew
orkp
lace
’sd
eali
ngs
wit
hot
her
firm
sO
utso
urce
-0.3
48-0
.037
-0.0
690.
023
-0.0
20-0
.394
***
-0.0
07-0
.140
0.24
1(0
.296
)(0
.197
)(0
.115
)(0
.158
)(0
.226
)(0
.152
)(0
.414
)(0
.176
)(0
.415
)C
PU
*Out
sour
ce0.
341
0.11
10.
080
-0.1
38-0
.195
0.78
3**
0.08
40.
117
-0.3
98(0
.398
)(0
.394
)(0
.265
)(0
.288
)(0
.491
)(0
.320
)(0
.453
)(0
.211
)(0
.527
)C
olla
bora
tion
0.19
6-0
.327
*0.
144
0.37
0**
0.45
7**
0.13
50.
111
0.03
1-1
.362
***
(0.2
40)
(0.1
73)
(0.1
55)
(0.1
61)
(0.2
25)
(0.1
90)
(0.4
70)
(0.2
62)
(0.5
22)
CP
U*C
olla
bora
tion
-0.8
94*
0.15
90.
021
-1.0
82**
*-0
.638
-0.2
440.
018
-0.0
931.
655*
**(0
.475
)(0
.359
)(0
.353
)(0
.281
)(0
.465
)(0
.336
)(0
.521
)(0
.298
)(0
.559
)C
onst
ant
12.3
74**
*12
.026
***
11.4
18**
*11
.516
***
11.6
69**
*11
.701
***
11.8
35**
*12
.409
***
11.3
10**
*(0
.264
)(0
.266
)(0
.416
)(0
.268
)(0
.985
)(0
.226
)(0
.416
)(0
.575
)(0
.415
)W
orkf
orce
cont
rol
vari
able
sY
ES
YE
SY
ES
YE
SY
ES
YE
SY
ES
YE
SY
ES
New
tech
nolo
gies
dum
mie
sN
ON
ON
ON
ON
ON
ON
ON
ON
ON
ewte
ch.
$in
vest
edN
ON
ON
ON
ON
ON
ON
ON
ON
OIn
dust
rydu
mm
ies
YE
SY
ES
YE
SY
ES
YE
SY
ES
YE
SY
ES
YE
SY
ear
dum
mie
sY
ES
YE
SY
ES
YE
SY
ES
YE
SY
ES
YE
SY
ES
Reg
ions
dum
mie
sY
ES
YE
SY
ES
YE
SY
ES
YE
SY
ES
YE
SY
ES
#O
bser
vati
ons
1219
1404
1754
1694
2788
1535
2076
2276
1201
#W
orkp
lace
s35
338
949
046
077
648
953
369
933
6R
-squ
ared
0.94
0.93
0.94
0.95
0.85
0.94
0.89
0.91
0.90
Stat
isti
cal
sign
ifica
nce:
*=10
%;
**=
5%;
***=
1%N
OT
E:
Stan
dard
Err
ors
inP
aren
thes
es
43