organizational social network analysis - dfkiobradovic/download/ma-schlauch.pdf · university of...
TRANSCRIPT

University of Kaiserslautern
Master Thesis
Organizational Social NetworkAnalysis
Author:Wolfgang Schlauch
Supervisor:Prof. Dr. Andreas Dengel
Darko Obradovic
May 7, 2012

2

Contents
1. Introduction 51.1. Objective . . . . . . . . . . . . . . . . . . . . . . . . . . . . . . 51.2. Introduction . . . . . . . . . . . . . . . . . . . . . . . . . . . . . 51.3. History of Social Network Analysis . . . . . . . . . . . . . . . . 61.4. Related Work . . . . . . . . . . . . . . . . . . . . . . . . . . . . 7
2. Introduction to Graph Theory 112.1. Knowledge Networks . . . . . . . . . . . . . . . . . . . . . . . . 122.2. Basic Graph Theory . . . . . . . . . . . . . . . . . . . . . . . . 122.3. Algorithms . . . . . . . . . . . . . . . . . . . . . . . . . . . . . . 15
3. Developing a Questionnaire 233.1. Online versus Offline . . . . . . . . . . . . . . . . . . . . . . . . 233.2. Questionnaire Development . . . . . . . . . . . . . . . . . . . . 24
4. Diving into the Real World 294.1. Co-Authorship Network . . . . . . . . . . . . . . . . . . . . . . 294.2. Analysis of the Survey-Data . . . . . . . . . . . . . . . . . . . . 324.3. Basic Network . . . . . . . . . . . . . . . . . . . . . . . . . . . . 334.4. Evolved networks . . . . . . . . . . . . . . . . . . . . . . . . . . 37
5. Conclusion 555.1. Summary . . . . . . . . . . . . . . . . . . . . . . . . . . . . . . 555.2. Future research . . . . . . . . . . . . . . . . . . . . . . . . . . . 565.3. Final words . . . . . . . . . . . . . . . . . . . . . . . . . . . . . 58
References 61References . . . . . . . . . . . . . . . . . . . . . . . . . . . . . . . . . 61
A. Network depictions 65

Contents
ii

List of Figures
1.1. Changes in a real network . . . . . . . . . . . . . . . . . . . . . 8
2.1. Example of an organigram . . . . . . . . . . . . . . . . . . . . . 112.2. Comparison Organigram - Network . . . . . . . . . . . . . . . . 13
4.1. Co-Authorship network . . . . . . . . . . . . . . . . . . . . . . . 304.2. Co-Authorship mapped to communities; the two small commu-
nities in the upper part are result of the omission of personswho did not respond to the survey . . . . . . . . . . . . . . . . 31
4.3. Collaboration network . . . . . . . . . . . . . . . . . . . . . . . 354.4. The basic network mapped to communitiesA.2 . . . . . . . . . . 364.5. Access-Network, Capabilities-Network . . . . . . . . . . . . . . . 384.6. Engagement-Network, Communication-Network . . . . . . . . . 394.7. Community-Structures . . . . . . . . . . . . . . . . . . . . . . . 424.8. Capabilities-Accessibility-Network and restricted version . . . . 444.9. Community structures for the combined networks . . . . . . . . 454.10. Network with three dimensions and restricted version . . . . . . 464.11. Network with four dimensions and restricted network . . . . . . 474.12. Time-influenced networks, time-influenced community structure 514.13. Co-Authorship network, basic network modified by interaction-
factor, mixed networks . . . . . . . . . . . . . . . . . . . . . . . 52

List of Figures
iv

List of Tables
2.1. Comparison Louvain method and reimplementation . . . . . . . 19
4.1. Participation . . . . . . . . . . . . . . . . . . . . . . . . . . . . 334.2. Analysis of the basic-network . . . . . . . . . . . . . . . . . . . 34

List of Tables
vi
List of Algorithms
1. Floyd-Warshall Algorithm . . . . . . . . . . . . . . . . . . . . . 162. Louvain Algorithm . . . . . . . . . . . . . . . . . . . . . . . . . 20

Abstract
For this thesis the relations of employees of a company were examined. For
this purpose, an online survey was created which is described in Chapter 3 .
This is followed by a detailed analysis of the results. We used the Louvain
algorithm to discover if people connected to their groups well or if there were
inner group conflicts resulting in splits. Furthermore we used betweenness
centrality to highlight the persons who can be asked if one needs guidance to
the knowledge of other persons. In general, a positive picture of the company
emerges because the groups are closely interconnected. Hazards are the few
connections that are between the groups since shared knowledge might increase
the results or the creativity.

List of Algorithms
2

Zusammenfassung
Im Verlaufe dieser Arbeit wurde eine Soziale Netzwerk Analyse innerhalb
einer Forschungsabteilung durchgefuhrt. Hierfur wurde zuerst eine Umfrage
mit Hilfe der Betreuer und der Firma erstellt, die sich auf die Mitarbeiter
konzentriert und erfasst wer mit wem arbeitet. Zudem sollte genannt wer-
den wie die Befragten ihre Beziehung zu ihren Kollegen selbst einschatzen.
Aus diesen Daten wurde dann ein Netzwerk konstruiert, welches innerhalb der
Forschungsgruppen der Abteilung einen guten Zusammenhalt zeigt wahrend
die Beziehungen zu den anderen Gruppen noch ausbaufahig sind. Auf dieses
Netzwerk wurden dann Algorithmen angewandt um wichtige Mitarbeiter zu
kennzeichnen die eine zentrale Position innerhalb der gesamten Abteilung in-
nehaben sowie Aufspaltungen innerhalb einer Gruppe zu erkennen. Die Resul-
tate dieser Bewertungen sind analog zu dem Gesamtnetzwerk gut, man erkennt
einzelne Forschungsgruppen innerhalb der Forschungsabteilung ohne großere
Abweichungen festzustellen.

List of Algorithms
4

1. Introduction
1.1. Objective
The objective of this thesis is to capture the knowledge and communicatonnetwork of a scientific research company. We will gather information aboutthe working relations. Afterwards we will analyze the relations to see if theconnections are sufficient and if the company has obvious deficits. Since we willlook at two different research groups we will also find out if they are connectedwell enough.
1.2. Introduction
Today online activities like watching youtube1 videos, posting on twitter2 orplaying on facebook3 are usual for the main street. In America there are atleast 51% of the nation on facebook in the age between 12 and 50 according toa study by Edison Research (Arbitron/Edison Research, 2011) and accordingto a study conducted by the Bank of America 96% of the people who haveparticipated in a survey were using facebook (Bank of America Merrill LynchGlobal Research, 2011). This leads to increased interest in social networkanalysis (SNA) to find specific relations between the persons on those networks.Even companies have recognized that social networking is not only a byproductof their work but that it can yield important information, better results andeven new ideas if the team gets assembled based on their social network. Thus,it is not surprising that social media and social networking have become moreimportant to everyone. One out of three employers rejected an applicant dueto something found about them online and the number might increase since
1http://www.youtube.com2http://www.twitter.com3http://www.facebook.com

1.3 History of Social Network Analysis
the percentage of HR professionals using social networking sites for sourcingpotential candidates increases (CareerEnlightment, 2011).
This interest is not limited to the process of hiring. The process of perfor-mance reviews is still common but according to Culbert (2008) this processis obsolete and should be changed to performance previews, involving directconversation between boss and employee. R. Cross and Parker (2004) providedeven more examples. In their book the authors show several companies and thelack of social ties between subgroups of them. Without social network analysisthey would not have seen the problem and thus could not have worked againstthat.
Therefore we gathered the social network of some of the groups in one branchoffice of a company. We did not stop there but gathered even more informationthan only the connections between the persons but also what they think aboutthere co-workers on several levels such that we were able to call it an informalknowledge network, containing not only relations but also how well the em-ployees know what their co-workers are capable of and their feeling about theease of access to their knowledge. We analyzed the network to get key-personsin different views, expecting to see changes in the importance of some of thepersons involved in the analysis due to their position in the company.
1.3. History of Social Network Analysis
Social Network Analysis as a term coined in the 1950s, even if the idea of asocial network existed long before. J. A. Barnes started using the term “socialnetwork” to denote patterns in networks he analysed such as groups or cluster-ing behaviour. That the analysis of groups and networks was done long beforeis well documented. Precursors of this theory were Emile Durkheim and Fer-dinand Tonnies. Tonnis was more interested in the existence of social groupsand the links between individuals whereas Durkheim was more interested inpatterns in the society. He also made the difference between “mechanicalsolidarity” – in which individual differences are minimized – and “organic sol-idarity” – the development based on cooperation of different individuals. Fora rather long time most studies seemed to be on small loose networks but inthe 1930s J. L. Moreno started recording and analyzing the social interactionsin small groups, while in Harvard W. Lloyd Warner and Elton Mayo started
6

1.4 Related Work
to explore interpersonal relations at work. Warner and Mayo were just ob-serving people and discovered something they called “informal organization”of an organization, a social structure not related to the organigram but con-tributing much to the productivity of the employees (Scott, 2000; Wikipedia,2011b; Chlldress, 2011). From there on many theories were developed like the“six degrees of separation”, which states that in a sufficiently large networkeveryone knows everyone else by six degrees, or to re-formulate that in averageeveryone can be reached without going further than six degrees. There wereexperiments conducted by Stanley Milgram, who used chain letters to showthat America is a “small world”, showing with the experiment that he couldsend a letter to several random persons with the aim to get them to a colleagueand they would arrive with approximately three friendships links on average.The experiment was performed by Duncan Watts in 2001 with e-mail chainletters who had a resulting average of six links. Nevertheless this experimentwas not related to the increasing number of spam mails today. Also for instantmessaging this was done in 2007 by Jure Leskovec and Eric Horvitz with asimilar result of an average path length of 6.6 (Wikipedia, 2011a).
1.4. Related Work
Of course big networks like Facebook, Twitter and LinkedIn4 are very interest-ing. But the networks of Warner and Mayo are more important in the contextof this thesis so we will take a closer look at them. Usually every company hasits own organization mapped as an organigram/organizational chart. Theyare expressive enough to convey the structure but they do not help in under-standing the social network of a company. In a company a social network mayhold cultural values or social values as it is capable of providing satisfaction bybackslapping of one’s peers or birthday cake. Those aspects are important forthe structure and are basically the glue that holds a company together. Wewill investigate the knowledge network of a company. They differ from a socialnetwork as it is not based on the same things a social network is. A knowledgenetwork tries to capture who works with whom for what reasons. Basically theknowledge of other people and their job description is an important part, sincein a standard social network those facts are not necessarily known. We can callit a communication network since we only get to know the others abilities by
4http://www.linkedin.com
7

1.4 Related Work
interacting or talking. For a good work relationship also trust is an importantcomponent such that some researchers tend to take this into account (Cross,Parker, Prusak, & Borgatti, 2001). Other researchers take more into accountwho talks to whom for what reasons. Cross, Borgatti and Parker asked towhom an employee would go for work related tasks and to whom for questionsconcerning not work related topics. The results were quite different (R. Cross,Borgatti, & Parker, 2002). In the same paper a manager was mentioned whorecognized that something was wrong in his company and the analysts foundwith a basic question, who works with whom, the problem. There was noreal interaction between the “soft skilled” and the “technical skilled” part ofthe team. With this very basic knowledge network the company then wasable to restructure and improve the productivity and also the knowledge ofthe employees in both topics (see Figure 1.1 for the network and it evolvedversion).
Figure 1.1.: The network before the intervention triggered by the investigationof Cross, Borgatti and Parker and afterwards
8

1.4 Related Work
Another important difference between a social network and a knowledgenetwork is the reflection where the company might lack skill. A very goodexample we already mentioned is given in the work of Cross, Borgatti andParker (R. Cross et al., 2002). There it was a lack of communication but therecan be also other important skills missing. Cross et al. (2001) showed differentinformal networks due to different levels of research. While the standard socialnetwork of the company researched was pretty dense, it got more sparse themore specific the questions were. As one might observe the ability to get incontact with the surroundings changed the dynamics of the network from denseto sparse and left several nodes with less or no connection to the group.
Research like this is used to increase the performance of a company or todiscover where the problems are in working groups. In the context of thisthesis we will retrieve the informal network of a company and analyse it forthem by the means of graph theory.
In the next chapter we will explain the basic mathematical theory to under-stand what the rest of the thesis will be about. In the following chapter wewill explain how we get the social network and how we did the questionnaire,resulting in the next part where we are going deeper into the observed knowl-edge network. We will close this thesis with a short overview about the thingswe did and give some ideas for further research on this topic.
9

1.4 Related Work
10

2. Introduction to Graph Theory
Companies are usually based on a formal scheme called organizational chart.In some variants of those a clear hierarchic structure is visible in which thehead of the organization is placed on top of all managers which are placedover their subsections (see Figure 2.1). The schemes not only show how thecompanies think they should be organized but also the way in which reports,news, updates and almost everything else should flow. And for some of theseit might be okay to have this chart, for example for news from the head of thecompany who gives it to the managers who redistribute it among their groups.But if information or a question on a certain topic would always go from onesubgroup to the managers level and from there down to the asked subgroupagain and the complete way back the task would probably be outdated orinvalid since employees can not waste their time with waiting for an answerbut have to work on the problem. With that in mind one will acknowledgethat there are other relations between employees than those defined in theorganizational chart. And those are only the obvious relations a manager hasto see, there are also many other relationships as social researchers remark.
B
SM C
Figure 2.1.: Example of an organigram

2.2 Basic Graph Theory
2.1. Knowledge Networks
Social networks are today very common to have. If we take a look in theonline community we see social networks everywhere, be it either connectionsby linkage (Obradovic, Rueger, & Dengel, 2011) or be it in a community likeFacebook1, the networks are everywhere. There are some things knowledgenetworks share with them. Social networks as well as knowledge networksare representable as graphs. But in a social network the main interest is howthe people are connected, who knows whom, who is related to whom andso on whereas in a knowledge network different factors are more important.The factor of familiarity is still in the network, but other questions emergeconcerning the working relationship like whom to ask for help, who is oftenavailable, who can explain a topic very well or help to get a different viewon a problem. Every question asked in the research of a company may givethe network a different shape and combined networks might look very differentfrom the networks where only one question was asked (for comparison see Crosset al. (2001)). But how are networks displayed the best?
One of the easiest ways to recognize who knows whom and how they areconnected is displaying the relationships and the persons graphically. Sinceit is practically impossible to observe this with pictures of persons and somecomplicated markers we will use graphs for that. People will be displayed asnodes and the relations between people will be the edges connecting two node.For an example we used the organigram from above and transformed it into agraph in Figure 2.2. To be able to use graphs we will introduce them formallyin the following.
In the next section we will introduce some of the basic concepts of graphtheory, followed by several algorithms. For the algorithms it is not necessaryto understand the definitions from graph theory completely.
2.2. Basic Graph Theory
Definition (Undirected Graph) (Nebel, 2010) Let G = (V,E) be a graph.We call a graph undirected if the edge connecting two vertices vi, vj ∈ V have
1http://www.facebook.com
12

2.2 Basic Graph Theory
B
SM C
(a) Organigramm
B
M
S
C
(b) Graph
Figure 2.2.: (a) shows again the organigram, (b) shows the same structure asa graph
no orientation. This means that there is no difference between the edges (a, b)and (b, a), i.e., they are not ordered pairs but sets {vi, vj}.
With this definition it is possible that a node is connected to itself what willnot harm and is for other examples not unusual. For the matter of a knowl-edge based social network it is not very useful to have those loops since theywould not yield any information but the persons know them selves, considerthemselves as trustworthy or else. So we introduce the notion of the simplegraph as the simplest kind of network.
Definition (Simple Graph) (Nebel, 2010) Let G = (V,E) be a graph. Wecall G a simple graph if it is undirected, contains no loops and if two verticesare connected only by one edge. This means that there are no edges {vi, vi}and if there is one edge {vi, vj} , i 6= j then removing this edge will disconnectthe two vertices.
Up to this point we introduced the very basic concepts needed to create anetwork. As one can see it already is useful to map an organigram to a network(see Figure 2.2).
The next useful concept for the idea of a knowledge network is to introducedirections to the network. This is based on the fact that one might ask oneperson for their help but this person would never ask the other person, be iteither for reasons of rank or lack of the needed knowledge or something else.
13

2.2 Basic Graph Theory
Definition (Directed Graph) (Nebel, 2010) Let G = (V,E). We call Ga directed graph if the edges connecting two node have an orientation. Thisis different from the undirected graphs since the edge (vi, vj) , i 6= j could bewalked in both directions in them. In a directed graph we could on this certainedge only walk from vi to vj but not the other way around. For that we needanother edge (vj, vi). This would then be a symmetric edge.
Remark Even if it is not defined as such we can speak of a simple directedgraph, if the graph does not contain more than one edge between two nodeswith the same direction.
Now we have the basic concepts to handle the basic case of a social network.The base case implies that it is only capable of handling one relation other-wise we would have several edges between two vertices. The general knowledgebased on examples like Facebook implies that ”add as friend” does not nec-essarily imply that one knows the befriended person on a personal basis orat any at all. This is a well recognized problem in studies concerning onlinesocial networks (Zain, 2011). For more complex research questions like theexamples mentioned in Section 2.1 it is more complex to predict the result. Ifwe want to have only one of the aspects in a network we can generate for eachresearch task a different network. But if we want to get a glimpse on how thedifferent research tasks interact then we have to put all the edges in one graphrepresentation. For that there is the definition of the multigraph.
Definition (Directed Multigraph) Let G = (V,E). We call G a multi-graph if between two vertices vi, vj, i 6= j there is more than one edge with thesame orientation. The edges in a multigraph are sometimes also called linksbut we will not use this term in the context of this thesis.
Remark We will not use the possibility to make loops, indicating some self-references, since they would not give any useful information for a knowledgenetwork.
We are now able to map a companies internal structure into a graphicalrepresentation. We mentioned before that this is useful for understandingconcepts more easily. Another reason for doing so is the ability to changesome of the edges in the graph to see if certain structures are common toa network like this or to discover dense connected subgroups. We now haveintroduced several different types of graphs. The most important to us will bethe undirected and directed simple graph and the directed multi-graph.
14

2.3 Algorithms
2.3. Algorithms
After explaining the theoretical foundation of the concepts used in this workwe will go ahead and name and explain the algorithms used. This will befollowed by the real world part of the thesis where we dive into the analysis ofthe network itself.
For the explanation of the algorithms we will introduce some additionalconcepts such that it is more clear what the algorithm is supposed to return.
Before any algorithm will run we can start with looking at the data toget an initial understanding of our network. Nodes with a low connectivityand nodes with a high connectivity will be easily recognised. One of theassumptions in social network analysis is that people with a high connectivityare very important, so called connectors or brokers since they are able to directa question to the correct person. People with low connections are assumed tobe either new to the network such that they have few connections or the areself-sufficient (Ingelbrecht, Patrick, & Foong, 2010).
2.3.1. Floyd-Warshall Algorithm
Everyone who ever had something to do with any kind of network will knowDijkstra’s algorithm by heart. Nevertheless we decided to go with the Floyd-Warshall algorithm since it gives us not only the best possible path but thedistances from all nodes to each other. Furthermore, it works with negativeedge weights what might be useful for the future (see Algorithm 1).
We create a matrix for the graph of size N × N where N is the number ofnodes in the graph. The entries denote in the initial version the weights of theedges that exist and infinity if there is no edge between two nodes. Afterwardswe go through the network and try to find shorter paths than the one givento connect the nodes. For example in 2.2 the nodes C and S would have noinitial connection, thus an entry equal to infinity. There is a path betweenthem via B such that the shortest path between them is the sum of the edgeweights on the edges between M and B and B and S.
In this thesis we will handle only small networks with less than 100 nodes sowe do not have to worry about the run time of the algorithm. However, if weshould extend this research to a greater community the run time of the Floyd-Warshall algorithm has to be considered. This algorithm has a time complexityof Θ (N3) which might be worse than the complexity of some other algorithms.
15

2.3 Algorithms
Algorithm 1 Floyd-Warshall Algorithm
Require: G = (V,E)Require: N {number of nodes in G}
for i = 1→ N dofor j = 1→ N do
if {i, j} ∈ E thend[0][i][j] := weight of edge
elsed[0][i][j] :=∞
end ifend for
end forfor k = 1→ N do
for i = 1→ N dofor j = 1toN dod[k][i][j] = min (d[k − 1][i][j], d[k − 1][i][k] + d[k − 1][k][j])
end forend for
end forreturn d;
16

2.3.1 Floyd-Warshall Algorithm
Dijkstra’s algorithm for example has time complexity O (‖E‖+ ‖V ‖2) which ismost of the time reduced to O (‖V ‖2) due to the fact that the squared numberof nodes should be much higher than the number of edges. Nevertheless, wedecided against Dijkstra due to the fact that we want to get the distancesfrom all nodes with possible negative edge weights. Dijkstra’s algorithm is notcapable to handle those correctly opposite to Floyd-Warshall’s algorithm. Ifwe assume we only have positive edge weights we derive a time complexity ofO (‖V ‖3) using Dijkstra’s algorithm if we want to get the shortest path fromeach node to every other node in the network, based on the assumption thatthe network is directed and not symmetric.
As stated above we will use this algorithm to get the shortest pathes fromthe nodes. We can use this knowledge to calculate the average path lengthby which we can judge if information flow is hindered or too slow in a certainpath. We will also get the longest and the shortest path with this methodsuch that we can see who appears to be the most central person in the net-work as also the most peripheral. With the distance matrix, the result of theFloyd-Warshall algorithm, we can also calculate the closeness centrality of anode, an indicator of how fast the person can reach each other person in thenetwork (M. Newman, 2005). It is also possible to calculate the betweennesscentrality that indicates how much the person is able to influence communica-tion between other persons (Brandes, 2001; M. E. J. Newman, 2010). For theformer it is enough to sum up all distances a node has to other nodes. Thesmaller the sum, the more central it is. For the latter it is counted on howmany shortest paths the nodes in question is. This gets divided by the numberof possible pairs of nodes in the network. The higher the resulting value themore between is the node. Those values are important for a network sincethey can also show who is too frequented and whose removal would damagethe network (in the real world the company). For nodes that are too betweenit is useful to create new connections that can compensate that damage. Asone can see in Figure 1.1 there was a node with high betweenness (Alam) inthe state before the intervention. He was a bottleneck and thus a great dangerfor the company if he would have misguided any of the teams he was connectedto.
From the centrality it is not very far to get to Google’s PageRank algorithmsince it is a variant of something called Eigenvector-centrality.
17

2.3 Algorithms
2.3.2. PageRank-Algorithm
Here we will describe how the PageRank algorithm works and we will also giveone important variant of this algorithm.
The purpose of the PageRank algorithm was to estimate how popular awebsite is. This was done by finding out how many sites linked to it. Themore sites linked to a specific one, the higher its influence on the whole networksince it guides visitors to the sites linked on it. So a site linked on a highlylinked site is assigned a higher probability to get visited. This is expressedwith a simple equation (see equation 2.1). The damping factor d is set to avalue between 0 and 1, usually d = 0.85. It refers to a random surfer, endingup on a page without links. He would have to jump to another random pageto continue surfing. The value Cj refers to how many sites are linked, PRj
is the pagerank of the other site. PRi would then be the probability that arandom surfer will visit the page (Brin & Page, 1998).
PRi =1− d
N+ d ·
∑∀j∈{(j,i)}
PRj
Cj
(2.1)
The idea to use this in the context of a social network is valid. It is usedfor example to recognize leadership (see Pedroche (2010), Pedroche, Moreno,Gonzalez, and Valencia (2011)) or simply key users (Heidemann, Klier, &Probst, 2010). We will consider that we have weighted edges and thus use notonly PageRank, which uses unweighted edges, but also an enhanced versionthat uses this weights changing the equation (see equation 2.1 and equation 2.2for comaprison).
PRi =1− d
N+ d ·
∑∀j∈{(j,i)}
wjiPRj
Cj
(2.2)
In this equation Cj is not the number how many sites are linked but thesum of the weighted out-degree of the nodes linked to. wij is the weight of theedge between the two nodes considered (Wiggins, McQuaid, & Adamic, 2006).It is also stated that the PageRank-equation can be used do derive a similarformula that is able to calculate the SocialRank (Turling, 2007), a value thatdetermines the influence of a person to a social network.
18

2.3.3 Louvain Algorithm
We will use both variants of this algorithm to discover not only who isregarded highly as a important person (first variant) but also in terms ofthe question who is good to be known. This can be found if the weightsacknowledge the person an amount of knowledge or reach or power in thenetwork.
2.3.3. Louvain Algorithm
Usually in a social network like Facebook groups are acting on common so-cial interests or on social bindings like relationship easily discoverable. Withorganizations it is the same due to the projects persons are working on. Wewant to know if the informal network represents the paradigm required by theorganization. We do this with the Louvain-Algorithm (compare Algorithm 2)developed by Blondel, Guillaume, Lambiotte, and Lefebvre (2008). They de-scribe a method that should be capable to find communities in large networksby maximizing the modularity of the network. For that it assigns in the firstiteration each node an own community it belongs to and then looks repeatedlyif there are communities whose modularities would increase if a node wouldbe added. If there is no such community it stays in the old. As soon asthere is no community that can increase its modularity the process stops. Wereimplemented the algorithm presented by Blondel et al. (2008) and comparedthe results to those of the original version on some artificial networks. Theresults are the same up to naming such that we can go on and argue aboutthe problem with a community finding algorithm.
The problem with a community finding algorithm is that it is not guaranteedto succeed, in explicit it does not necessarily derive the best possible communi-ties from a given structure. It is not claimed that the algorithm is correct butBlondel et al. (2008) wrote they compared their data with true networks withknown communities and found good results. We took the examples providedby their working group and applied both versions on them.
Table 2.1.: Comparison Louvain method and reimplementation
Network Name #nodes #cLouvain #cour version matchingZachary’s Karate club 34 4 4 100%
arXiv citation 9377 59 59 61.03%
19

2.3 Algorithms
Algorithm 2 Short description of the Louvain algorithm
Require: G = (V,E) ;for all i ∈ V doCi := i;
end forimprovment = Truewhile improvment do
improvment := False;for all i ∈ V doCi := Ci\ {i} ; {remove node from its community}best community := Ck;best gain := 0;for all j ∈ C do
calculate modularity gainif modularity gain ¿ best gain thenbest community := Cj;best gain := modularity gain;
end ifif best community <> Ci then
improvment := True;end ifadd node to best community
end forend for
end while
20

2.3.3 Louvain Algorithm
For the small real world network Zachary’s karate club, a pretty popularnetwork in social network analysis, the algorithm performs very well for ourpurpose. For a bigger network, the arXiv2 citation network, the level droppeddramatically and had high changes. After looking into it and into the data wefound that this depends heavily on the order in which the nodes are considered.This is supported by the authors who claimed exactly that. Taking this intoaccount we have an algorithm that works good for our purpose.
We will use this algorithm to check if there are hidden subgroups in thecompany investigated or if there are only the communities given by the projectstructure. The existence of groups besides the groups supported by the com-pany itself might be of good use in new projects.
2http://www.arxiv.org
21

2.3 Algorithms
22

3. Developing a Questionnaire
In this chapter we want to explain how the questionnaire was developed. Wewill give a short overview over the problems we had to consider given time andexpandability of the survey.
3.1. Online versus Offline
There are several options one can use if he wants to investigate a communityto get the structure. At first there is the option to conduct interviews. Wedismissed this option due to several facts. The first one was that people tendeither to not know people outside of their working group or to misjudge thembased on the so called intergroup bias hypothesis that leads to a negativejudgements of persons who are not in the subjects own group (Seger, Smith,Kinias, & Mackie, 2009). Secondly. it would have been very time-consumingto conduct a survey with each employee and the extendability would be verylimited due to this fact. Additionally there was the potential to make theanswers sound better due to the direct contact between the interviewer andthe respondent.
Conducting the survey in an offline mode by handing out questionnairesto the employees was another option. Like the interviews the major problemwas the time - sending out questionnaires and getting them back in a certainamount of time is time-consuming and can be an impossible task if a 100%return rate is needed. Luckily that was not wanted but a high participationwas needed to get sufficient results. Other problems were printing costs anddistribution costs and for future surveys there would be additional mailingcosts which are eliminated by using online surveys (Kaplowitz, Hadlock, &Levine, 2004; Cobanoglu, Warde, & Moreo, 2000). Cobanoglu et al. (2000)even claimed that without the coding costs the online version would be not onlycheaper but would also have a significantly higher response rate. That was truein their experiment and is supported by other research that states the response

3.2 Questionnaire Development
rates of web-based surveys are at least as high as in mail surveys (Kaplowitzet al., 2004; D. M. Bushnell & Parasuraman, 2003; Medlin & Whitten, 2001).
The fact that the average American person is in front of a screen approxi-mately for 8.5 hours a day (Jameson, 2012) which should not be much differentin Germany deemed us reasonable to conduct an online survey (Bitkom/gh,2008). Expandability to other groups than the surveyed is a bonus for futureresearch on this topic or for the company if it should be decided to investigatethe overall communication network.
3.2. Questionnaire Development
After we decided to go with an online questionnaire we implemented the GUIin the web application framework Catalyst1. We will not provide details howit was implemented.
In several steps we developed the question set for the survey, following someguidelines provided by R. Cross and Parker (2004). The major problem isposing questions that do not influence the surveyed person nor should thequestion itself sound negative. It should also not carry any positive meaningotherwise the respondent might answer different than he would if the questionis stated negatively or neutrally (Malhotra, 2006). The questions should alsobe closed and leave as little room as possible for interpretation such that theyconvey the same to every asked person. Thus we decided to give the questionsa main text in which the actual question is contained and a additional infor-mation text which clarifies what is meant. We will now examine the questionswithout the answers and will discuss why each questions are important for thecommunication network.
Please identify persons who are important for your work in any form of infor-mation delivery, discussion, collaboration, delegation or coordination?
Starting with this question we get a nice overview of whom a personconsiders as important. We decided against providing a list of personsthey could select with whom they work out of several reasons. First ofall, the company investigated was a small to medium-sized business and
1http://www.catalystframework.org/
24

3.2 Questionnaire Development
going through a list of all employees might be too time-consuming. Itmight also be confusing if there are names too similar or persons whoare actually unimportant and get contacted rather infrequently mightget choosen since they are listed. We hoped to get a description of thereal work environment as precise as possible.
Please identify persons who have knowledge you might need in your daily workbut you do not ask?
This question was supposed to get information about persons who are notasked either out of conflicts or time issues or or there are other sourcesor other reasons. The question is capable of revealing unused potentialssince more contact to those persons might increase the productivity. Infact it is also able to show if someone is strained. If the contact hasmany listings in this category he may either be very distant to be anuseful source of knowledge or he is too involved in other projects anddoes not have the time to get involved in other projects.
For this question it was problematic to convey what was meant withoutgiving people misleading information.
From now on we always provided the list of persons the respondent gavein the first two questions such that we could assess the value of theconnection between the persons.
How close to you do these persons work?
First of all this gives us some geographic information about the personsinvolved. If they work in the same room or in the same floor it is naturalthat they know and talk to each other even if it is just chatting in thecorridor since it relaxes and increases creativity (Why You Should WasteTime Chatting at Work , 2011). If the connections are made to otherfloors or different departments in another city the connection seems tobe more important since the maintenance of such relations is harder.
The locations were chosen according to how it was perceived the mostreasonable. Some of the employees in the company investigated had aroom with one of their coworkers, others were only on the same floor.Since the company is small to medium sized some branches have morethan one floor so it is also reasonable to ask if it is only a different flooror a completely different city.
25

3.2 Questionnaire Development
For how long do you know these persons?
This question gives not only information about how long the respondentworks for the company but is also able to reveal together with otherquestions how good he is at social networking. If he has only contactshe taps since 10 years and no newer contacts this might be due to alack of interest in new colleagues. The possible answers included up toone year if it was a new acquaintance, up to four years for some of thebetter established relations and up to ten years for long relations and tenyears and longer for real long relations like it is usual for persons withadministrative purposes in the company investigated.
How often do you typically interact with these persons in your work?
The information this gives might reveal some interesting informationabout the network itself. For example it might give some additional in-formation about a connection to someone chosen as important co-worker.If one should be in this group but not often contacted the claim he wouldbe important might give us a hint that the person in question is too in-volved in work as that he could be asked more often.
How much do you agree with the following statement for each person: “I knowthe capabilities, skills and knowledge the person has.”?
In the additional text it was explicitly mentioned that this does notinclude capabilities to do anything related to them. Nevertheless it isimportant to know if a person has knowledge needed to solve a task andthus this question had to be included. It might have been purposeful tohave information about the knowledge a person has himself to see if theconnections are made by shared knowledge or if they are made to haveaccess to different knowledge.
Do you agree with the following statement for each person: “I would be moreefficient in my daily work if I were able to communicate more with thisperson.”?
Together with the question regarding the interaction with other personsthis might reveal structural issues or problems with co-workers who arerarely available due to meetings or business travel. As a stand-alonequestion it is also interesting to see with whom of the co-workers one
26

3.2 Questionnaire Development
remembered he would like to be more involved since this might be helpfulfor future projects if it is mutual.
Does the person engage in the question?
This question was at first intended to see how useful the answers a per-son provides are. Due to the formulation it sounded very negative andasking the other way around, who could give more useful answers, wasconsidered as rude also. In the progress we decided to go with this ques-tion and added as additional information that one should consider howhelpful the answer was. Please mind that we did not ask for useful buthelpful since even chatting can be very helpful to come up with newideas (Why You Should Waste Time Chatting at Work , 2011).
Did the intensity of communication with the person change over time?
This was asked to support some of the other questions. Mainly the ques-tion looking for co-workers not asked often is very interesting with thisinformation since this could model a recent event between two persons.It is also worthwhile to see if new acquaintance are good to talk to or ifthey are regarded as too new to talk to.
The options of the last four questions were clustered in values since exactnaming differs for everyone and people hesitate to give names to relations.Nevertheless, it is hard to decide if the value assigned is the same between twodifferent respondents.
Now we have established a reasonable foundation for the questions askedand we will see in the next chapter some analysis for the answers we received.
27

3.2 Questionnaire Development
28

4. Diving into the Real World
Up to now we discussed how Social Network Analysis emerged and got moreand more important for work settings. We also discussed the graph theorythat we will need for the analysis of the data which we discussed how to get inthe last chapter. Therefore, we are now able to analyze the data we gatheredand use the algorithms described in Section 2.3. Nevertheless, before we startanalyzing we will present a different network for comparison.
4.1. Co-Authorship Network
This network captures the co-authorship of papers written by participants ofthe survey. It is created by the data gathered from the paper archive of thecompany. We extracted the authors and compared that list first of all to theactual name of the author. Then we reduced the amount of nodes by restrictingit to the employees of the company and edited the weight of an edge to thenumber of papers the persons wrote together.
As one can see in Figure 4.1 the network looks nice. Besides that it isacknowledgeable that it does not tell very much without knowing what thepurpose of the edges is. Edges indicate in this network if persons are co-authors for a paper. The thicker the edges are, the more papers name themas co-authors. The lowest number of co-authorship found was just one paperwritten together. The highest amount of papers written by an author togetherwith one of the groups as co-authors was 20, the average was 4.39. The networkhas a diameter of 5 and a low density value of 0.125. Nevertheless it is just onecomponent which means that there are no obvious working group separations.To find those we applied the Louvain algorithm (see Section 2.3.3 for furtherdetails) for finding communities. It resulted in a reduction to six communities.As one can see in Figure 4.2 there are two communities that are isolated fromthe overall network. That is reasoned by the fact that we did not take intoaccount persons who did not respond to the survey. Thus some of the links

4.1 Co-Authorship Network
Figure 4.1.: The thickness of an edge indicates on how many papers the personsworked together
30

4.1 Co-Authorship Network
Figure 4.2.: Co-Authorship mapped to communities; the two small communi-ties in the upper part are result of the omission of persons whodid not respond to the survey
that exist in the real world do not exist in the shown network. For the othercommunities the result is reasonable. The working relations reflected in theco-authorship of the papers do exist to a great extent even if they are not anexact matching to the work groups. However, we found that there are certainproblems with the co-authorship claims for research groups. Tarnow (1999)claimed that for physicists it would hold true that there were several names asco-authors or supervisors listed who did not write anything and sometimes noteven read the articles. He wrote several follow-ups on this topic (see (Tarnow,2002, 2008)) and came to the conclusion that there are usually more peoplenamed as co-authors than needed. It might be interesting to investigate thisfor the company.
We compared the communities yielded by the Louvain algorithm to theactual working groups and found that the partitioning done based on theco-authorship holds true forfive of the found communities. The algorithm wasprecise enough to distinguish a subgroup within one of the investigated groups.Three of the other communities that holds true after a closer look at the paperswritten since they are either written together or on the same topic.
For comparison we used an algorithm online designed by Rosvall and Bergstrom(2008) that analyses the flow of information to reveal a community structure.We took advantage of the already found co-authorship network and assumedthat information flow is high between co-authors even if it is arguable accordingto Tarnow (1999, 2002, 2008). The algorithm found the same communities.
31

4.2 Analysis of the Survey-Data
Despite the interesting research that this yields we will compare the commu-nication network we developed with the questionnaire to the network presentedhere to see differences and commonalities the networks have.
4.2. Analysis of the Survey-Data
In this section we will investigate the data gathered by the survey and applythe former mentioned algorithms (compare Section 2.3). At first we will go tothe basic network that shows who works with whom. Then we will analyse thedifferent dimensions of the network (accessibility, knowledge of capabilities,engagement, communication changes) and combine them in the same order.We perform the research in this order since it is reasonable to say that if weknow someones capabilities we will try to access him more often. Furthermore,if we know someones capabilities and have enough access it is interesting toknow if the perceived engagement is sufficient. We apply in a last layer thechanged communication behaviour since it modifies the overall evaluation toa more recent snapshot.
4.2.1. Data Gathering
Before we go into the analysis of the data we will shortly describe where wefound problems.
First of all we want to mention the response rate since that was the mostconcerning problem. Without consistent reminding the people the responserate would probably be below 50% as in many other questionnaires. Even byreminding people it was hard to get to the response rate we got. We had theadvantage that we could go to the persons directly and ask if they would notwant to participate to reinforce them. Still, the response rate was below 80%(see Table 4.1).
The result of the questionnaire was quite satisfying. Looking at the plaindata we found that there are many connections inside groups and only fewboundary spanning connections. This might be a problem if one needs knowl-edge that is not contained in the group knowledge provided by his group andis thus dangerous. However, since it is intended that this separation in groupsexists it is fair enough. We would have to remove only a small fraction of
32

4.3 Basic Network
Table 4.1.: Participation
Group
Participation
no
Group 1 15.4%Group 2 48.3 %Overall 29.4%
the surveyed people from the company to completely disconnect both of thegroups. The importance of the nodes creating the connections proved to betrue by calculating their betweenness value which was the highest for thosefew nodes since they held the shortest connections between the groups. Afterwe looked into the group with more answers we found two persons were notmentioned at all but they also did not respond to the survey. Overall, therewere 7 persons in total who did neither respond nor were they mentioned asimportant.
In comparison to the co-authorship network (see Figure 4.1) there weremuch more nodes due to communication with organizational units while wehad a concise description for the groups for the co-authorship network suchthat we were able to include only the persons who actually worked there. Wedecided to exclude persons who were only mentioned and did not work inthe surveyed groups else we would have too different results and a much lowernetwork density. Also, if we consider the PageRank value, there might be somemisconceptions caused by the random surfer model. For the nodes that wereonly mentioned we would have an edge added to each other node with the sameprobability to use this edge and this would lead to wrong values if we includeevery mentioned person. Still, we will include members of the surveyed groupswho did not respond as long as they were mentioned by someone. The missingresponse of those persons can be a result of vacations, or privacy concerns oranything else.
4.3. Basic Network
Moving on to the next investigative step we looked at the distribution of in-and out-degree in the network. In the real-world example investigated this
33
4.3 Basic Network
is who is considered as important for work (in degree) and whom does oneconsider as important (out-degree). We hoped to see something like a powerlaw distribution in the connectivity. For the in-degree this did not hold butfor the out-degrees the assumption that a social network has a power lawdistribution did hold. Nonetheless, we had more nodes with low than highin-degrees. Some of the persons did not reply and thus had an out-degree of 0while their in-degrees varied between 1 and 17.
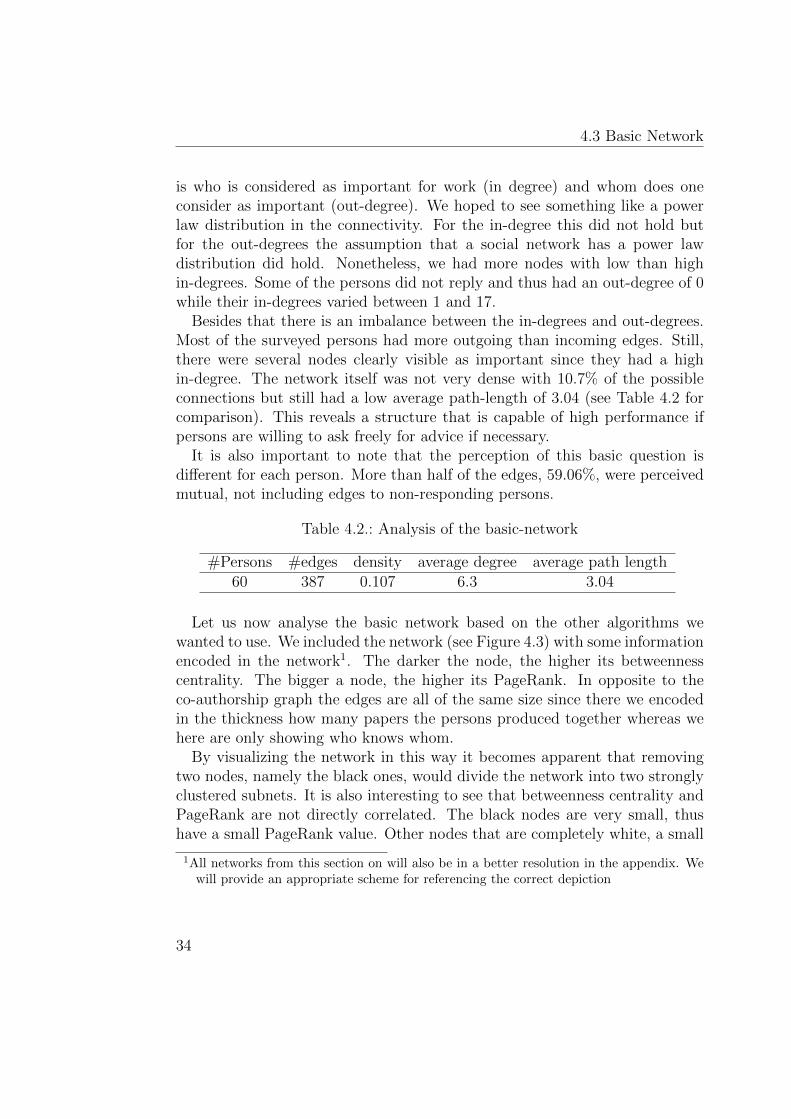
Besides that there is an imbalance between the in-degrees and out-degrees.Most of the surveyed persons had more outgoing than incoming edges. Still,there were several nodes clearly visible as important since they had a highin-degree. The network itself was not very dense with 10.7% of the possibleconnections but still had a low average path-length of 3.04 (see Table 4.2 forcomparison). This reveals a structure that is capable of high performance ifpersons are willing to ask freely for advice if necessary.
It is also important to note that the perception of this basic question isdifferent for each person. More than half of the edges, 59.06%, were perceivedmutual, not including edges to non-responding persons.
Table 4.2.: Analysis of the basic-network
#Persons #edges density average degree average path length60 387 0.107 6.3 3.04
Let us now analyse the basic network based on the other algorithms wewanted to use. We included the network (see Figure 4.3) with some informationencoded in the network1. The darker the node, the higher its betweennesscentrality. The bigger a node, the higher its PageRank. In opposite to theco-authorship graph the edges are all of the same size since there we encodedin the thickness how many papers the persons produced together whereas wehere are only showing who knows whom.
By visualizing the network in this way it becomes apparent that removingtwo nodes, namely the black ones, would divide the network into two stronglyclustered subnets. It is also interesting to see that betweenness centrality andPageRank are not directly correlated. The black nodes are very small, thushave a small PageRank value. Other nodes that are completely white, a small
1All networks from this section on will also be in a better resolution in the appendix. Wewill provide an appropriate scheme for referencing the correct depiction
34

4.3 Basic Network
Figure 4.3.: The network show who works with whom and includes thebetweenness centrality (color coded) and the PageRank (sizecoded)A.1
35

4.3 Basic Network
betweenness centrality, are very big, having a high PageRank value. Thisreveals that those persons are highly regarded as contact person. It is notobvious if this circumstance is caused by their seniority or their knowledge orsomething different as important but they have many ingoing connections.
The Louvain community detection algorithm was very precise and foundfour communities. Two of those communities are exactly one (sub-)group.For the remaining two it is an interesting fact to acknowledge that one of thecommunities is actually one person who did not participate. Apparently he wasalso not very often named and would thus not have increased the modularityof any of the existing communities. This result is very good and gives us morereason to trust the Louvain algorithm.
Figure 4.4.: The basic network mapped to communitiesA.2
The Louvain algorithm reveals at this point two important things. This firstnetwork was only based on the fact who works with whom the most. Keepingthis in mind we see that the main groups as well as the subgroup are wellpresented in this network as they are prescribed by the organigram. Moreimportant, the connections are tied to the organigram, too. The subgroupcommunicates with its main group and the two main groups with each otherbut one main group does not communicate with the subgroup. The extracommunity for the single person has no tie to the groups it does not belongto, also.
Up to know we looked only at the basic network including the work re-lationship without further adjustments. In the next section we will look atdifferent variations of this network according to the dimensions presented withthe survey.
36

4.4 Evolved networks
4.4. Evolved networks
At first we analysed the network along the basic dimensions, namely whohas access to whom or where is a lack thereof, do the participants know thecapabilities of each other, do the persons known engage in questions they areasked and did the communication with someone change recently.
As before we did run the analysis for each of the networks. The density andthe average degree did not change since we wanted to get the information for allpersons that were named in the survey. Also, the betweenness centrality andthe closeness centrality stayed the same since the calculation is done withoutweights on an edge.
4.4.1. Access-network
As one might observe the structure of the network, shown in Figure 4.5(a) isthe same as we had before. There are three subgroups clearly visible and onlytwo nodes are really dark, indicating a high betweenness value. The PageRankvalue did change. The most changes were small and only one place up or down.In the middle range the values stayed even constant due to having not as manyconnections as other nodes. It was not very surprising to see that personswho were known by most of the people also had a higher PageRank value.According to Pedroche (2010) using PageRank to model social competences ispossible. So we do have a slightly different ranking in this network.
With the Louvain algorithm we did discover interesting changes on the edgeweights as also in the grouping behaviour (see Figure 4.7(a) for comparison).The intergroup values stayed high as one would expect. The group spanningconnections were more interesting. The edge from the subgroup to its maingroup increased in the same manner as the reverse edge did. The other maingroup split into three groups. One consists like before out of one person, theother one of only three. The weights on the edges from these subgroup to theirmain group and vice versa are actually pretty low, indicating that the personsinside the groups either did not participate in the survey or that they are aself-sufficient subgroup or they are just new to the company. Moreover, theyare not accessible for anyone in the group but the persons in this communitywho participated in the survey. Still, to those subgroups there are no edgesfrom the other groups.
As we can see inside the groups there is a pretty good communication and
37

4.4 Evolved networks
(a) Access-NetworkA.3
(b) Capabilities-NetworkA.4
Figure 4.5.: (a) shows the feeled accessibility; edges are darker if the people feltthey have good access to each other. (b) shows the capabilitiesnetwork where edges are darker the more people thought theyknow the capabilities of the other
38

4.4.1 Access-network
(a) Engagement-NetworkA.5
(b) Communication-NetworkA.6
Figure 4.6.: (a) shows the perception of engagement; edges are darker if theengagement perceived is higher. (b) shows how the communica-tion changed recently. The darker the edges are the more thecommunication increased and vice versa.
39

4.4 Evolved networks
the persons do not need more access to each other. Especially the lower group,the subgroup, is very well connected and has good access to each other. Themost interesting part of the analysis was to see that people who were thoughtafter the most by some persons were mentioned as very good accessible byother persons.
Based on the interaction between the persons we were able to see somequite different interaction patterns. While most of the mutual edges seemedto be well established there were some edges where a clear lack of mutualitywas obvious. Some of the persons needed more access to the knowledge ofthe counterpart of the interaction while they were satisfied with the existinginteraction.
4.4.2. Capabilities
The second dimension we wanted to look at was the knowledge about otherpersons, i.e., how well do employees know what their co-workers are capable of.For the weighted PageRank this did not have any major influence, the order isthe same up to some nodes in the range where the values were the same suchthat a new order there can be ignored. The top nodes and the low nodes didnot change which shows that persons who are well known or easily accessibleare considered as well known or their experience is well known. It is a naturalbehaviour for humans that they tend to think to know their surrounding verywell. Actually only two persons admitted not to know very well what the otherperson knows or does. This is a pretty good result. It shows that employees ofthe company known their peers well enough to make a statement about theirknowledge and they know whom to ask if a problem occurs. If this knowledgewould not exist it would hinder the work flow since they might ask co-workerswho do not have the correct knowledge. This would not only be confusing forthe other part but would also take some time to figure out and thus delay thesolution of the problem.
The frequency of interaction was better than before. According to our surveymost of the mutual edges indicated that people who talk to each other morefrequently also know each others capabilities very well. Only a few edgeswith to little interaction had a high amount of knowledge of the other personscapabilities.
The Louvain algorithm gave us this time a very loose network (for compari-son see Figure 4.7(b). There is no possibility to come from one group to every
40

4.4.3 Engagement
other. This is similar to the community structure from the basic-network (seeFigure 4.4). In comparison to the access-community structure it seems like thepersons would know the capabilities of the three person group even if they arenot accessible.
4.4.3. Engagement
This time we start with the result of the Louvain algorithm. We found fourcommunities at all which is a result of the very strong structure of the networkshown in Figure 4.6(a). In the network a strong colored edge means thatthe persons feel that the other engages very much in the question and triesto be of assistance in answering the question. As we can see there are a lotof strongly colored edges. 11% of the edges are actually indicating too littleengagement. Nevertheless, over 50% of the edges indicate that the engagementis either not known because the persons are not asked enough or the answersprovided are satisfying but not significantly better than other answers. Dueto so many good answers we have quite a different structure and the nodesare evenly distributed in the communities. This circumstance explains thatthe betweenness centrality of all communities is the same. Due to the shiftedcommunity affiliation the network is completely connected and every node ison all shortest path or all paths are shortest paths.
4.4.4. Communication
Let us now have a look at the communication network. Here we wanted to geta look at how the communication changed recently in the groups asking if thelevel of communication increased or decreased or stayed the same. The visual-ization is here the most helpful part (see Figure 4.6(b)). As we can see there areagain the three clusterings, this time indicating that the communication insidethe clusters is very good. Like usual the color of the edges indicates how goodthe connections are, the darker an edge the more the persons communicatedrecently. As expected only a small percentage decreased their communication(14.8% of all edges have weights indicating a decrease) whereas there are moreincreased communication channels (27.7% of the edges show weights indicat-ing an increase in communication). The rest of the communication stayed thesame over time or did not change in the recent past. The most interesting inthis network is the black node that is in the middle of the complete network.
41

4.4 Evolved networks
(a) Access-CommunityA.7 (b) Capabilities-CommunityA.8
(c) Engagement-CommityA.9 (d) Communication-CommunityA.10
Figure 4.7.: The community networks of the corresponding network. Colorindicates the betweenness centrality. For (c) there is no differentcolor since the path is fully connected.
42

4.4.5 Capabilities-Access
Due to the layout algorithm used a node tends to be near nodes where theedge weight is high. In the previous networks the node was always on the edgeto its man group but still far away from the other groups since it has manyconnections not only in its group but also to the other. Since the weight ofthe edges influences the placement of a node and the groups are not as farfrom each other as in the other networks it is fair to say that the person whois behind this node is to the other groups as communicative than he is to theother groups.
The Louvain algorithm yielded a network with 5 communities. This networkis very different from the ones we saw before. The community in the lower rightcorner consists out of one person belonging to the group right next to it. Thecommunity in the upper left corner consists also of one single person. Thosepersons did not seem to be as important to the judgement of the algorithm.It may very well be that another order of the nodes might pull them to theiraccording group. Nevertheless, we can also observe a split of the group thatis in all other community-networks in Figure 4.7 the black or the big one.This sounds reasonable if we take into account that most of the edges in thisnetwork had a weight that indicated neither more nor less communication.
After analysing the four basic dimensions we investigated we will have alook at the combinations. This idea was shown to work well in (R. Cross &Parker, 2004). There the researches had a different type of questionnaire andwere thus able to cut edges if they had a weight below a certain threshold orif the person was not mentioned at all. We added the weight of the edges upto get a simple, directed network.
The statistics for the next networks stay the same like provided in Table 4.2.
4.4.5. Capabilities-Access
As we mentioned above we had always the complete data set given. Thisenabled us to do a qualitative research of the network. For two dimensionswe were able to determine a certain threshold where the persons had enoughaccess to each other as also enough knowledge about the capabilities. Thus weare able to compare the actual network resulting from adding the edge valuesand a comparison network we analyzed.
As one can see in Figure 4.8(b) the overall combination of accessibility andknowledge of capabilities is pretty good. To be exact there are still 51.85% ofall edges that were in the network in Figure 4.8. That is a really good value
43

4.4 Evolved networks
(a) Capabilities-AccessA.11 (b) restricted Capabilities-AccessA.12
Figure 4.8.: (a) shows the combined network for the dimensions of knowledge ofcapabilities and accessibility; (b) shows only edges with a sufficientweight such that those edges do not lack in any of the specifieddimensions.
44

4.4.5 Capabilities-Access
since we left out all edges that showed a lack of accessibility or showed somehowa lack of knowledge about the capabilities. It increased also the betweennesscentrality of some of the nodes. Of course this is caused by the vanished edgessuch that there had to be new shortest ways calculated. More importantly,it shows that there are several nodes inside the groups which can be easilyaccessed and they can be used as so called connectors. They might be ableto retrieve needed knowledge or handle questions to the correct persons. It isalso important to note that some of the former more between nodes, possibleconnectors so to say, are now lower while others have arisen due to a goodcombination of accessibility and their known capabilities. Specifically we wantto note the three big nodes in the upper right cluster which increased theirbetweenness. They all have a high number of in-degrees but also a reasonableto high number of out-degrees. This provides even more reason to believe inthose persons as connectors.
The Louvain algorithm gave us a new layout (see Figure 4.9(a)). All ofthe connections are bidirectional and we ended up with only three nodes. Wehave to take into account that this is a result of the order the communitiesgot calculated but it is a convincing result. Considering the distribution ofthe knowledge of the capabilities and the accessibility of the co-workers thealgorithm ended up with only three communities with is congruent with thenumber of actual work groups.
(a) Capabilities-Access-CommunitiesA.13
(b) Capabilities-Access-Engagement-CommunitiesA.14
(c) Capabilities-Access-Engagement-Communication-CommunitiesA.15
Figure 4.9.: Community structures for the combined networks
45

4.4 Evolved networks
4.4.6. Capabilites-Access-Engagement
(a) Capabilities-Access-EngagementA.16
(b) restricted Capabilities-Access-EngagementA.17
Figure 4.10.: (i) shows the combined network for the dimensions of knowledgeof capabilities and accessibility and engagement; (j) shows onlyedges with a sufficient weight such that those edges do not lackin any of the specified dimensions.
As before we restricted the edges in Figure 4.10(b) such that the worstoptions dropped off the list. The remaining edges capture mostly edges withat least average valuation or if one of the options is high and the others are inthe mediocre range. In contrast with the network shown in Subsection 4.4.5the nodes changed their betweenness centrality differently. The change in thebetweenness is based probably on the fact who engages more. We can notconclude from this fact that persons who are not as engaging as others are notwilling to since it may be that they have only limited time. As a significantchange one might observe the lower subgroup. In Figure 4.8(b) there were
46

4.4.7 Capabilities-Access-Engagement-Communication
two nodes with high betweenness centrality values whereas in Figure 4.10(b)is actually only one node with a high and one with a fairly high value. Theone with the fairly high value is the former high valued node.
The Louvain algorithm showed us four different communities (see Figure 4.9(b)).The lower left three communities are completely connected even if the connec-tion from the lowest community to the most left community is relatively weak.The community in the upper right consists only of one person. This couldbe again a result of the order in which the algorithm works his way throughthe nodes but it may also be a result of a low connection. The person is stillconnected to the network in Figure 4.10(b) but the connection is overall theonly this person has.
4.4.7. Capabilities-Access-Engagement-Communication
(a) Capabilities-Access-Engagement-CommunicationA.18
(b) restricted Capabilities-Access-Engagement-CommunicationA.19
Figure 4.11.: (a) shows the combined network for the dimensions of knowledgeof the four dimensions; (b) shows only edges with a sufficientweight such that those edges do not lack in any of the specifieddimensions.
Finally, we combined all four dimensions into one evaluation. The edges are
47

4.4 Evolved networks
all not very strong but we are still able to make some assumptions about them.Overall there are 35.71% of the edges with a very low weight indicating thatthey not only lack in the first three dimensions but that also the communicationbetween the persons decreased. The rest of the edges, 64.29%, are in a rangewhere it is reasonable to say that they have the needed access to personswith knowledge and either a normal or increased communication with them.We can see the restricted network (Figure 4.11(b)) with only the reasonableedges in comparison to the complete network (Figure 4.11(a)). It is simpleto recognize why some nodes in the right figure have a higher betweennesscentrality. Taking the vanished edges into account we see that several of theold shortest paths have vanished leaving fewer of them. In comparison withFigure 4.10(b) we have more nodes with a higher betweenness centrality. Sincethis is the most complicated network we can assume that those persons areimportant connectors in each of the groups. If these nodes would vanish it willhave an impact to the complete network.
The Louvain algorithm gave a network consisting out of three communities.It is fair to assume that this network is a good representation of the workingrelations we were able to discover with the survey. Of course this dependson the willingness to answer which was not 100% (see Table 4.1). Importantfor this community network is to recognize the missing link between the twowhite nodes, implying that the communities are not exactly a mapping to theworking groups.
4.4.8. Difference-Network
After we have analyzed the four basic dimensions we will take a short breakfrom going deeper into this and we will analyze the difference network. We wereable to produce a difference network based on the first and second question,showing people who were not chosen as important co-workers. Now we areable to see where the problem is.
Although we call this section difference-network we will not show the actualnetwork since it would increase the possibility to conclude which company wasinvestigated and even the persons.
Overall, there were only 14 connections between very few persons. Acces-sibility was only mentioned two times as a major problem. In both cases thecommunication did also not increase, so we have to assume that these connec-tions will eventually fade completely from the network. The most prominent
48

4.4.8 Difference-Network
problem seemed to be the willingness to engage in a question followed by thecommunication. While the former was always voted really low the latter wasalmost always showing either no recent changes. That may include no com-munication at all. Thus we needed to analyze this with the three additionaldimensions, namely time, interaction and physical proximity. With the interac-tion as additional value alone it was obvious why there was no communicationchange and why there was also little to none engagement. They just did in-teract with each other too irregularly to get to a better value. This does notimply that this is a crux. It can be that those sporadic connections are onlyfor administrative issues and thus they should not be forced to change theirpattern of behaviour. It would require a personal interview with the personsto investigate these issues.
We did not include the three dimensions before for a simple reason. Neitherdid it change the overall appeareance of the network – it was still clustered inthree regions – nor did it do anything for the analysis. Most of the employeesdo work in the same building and a working group is most of the time settledon one floor. So the factor of the closeness does not reveal very much only fora scant few connections that spanned not only floors but cities. These con-nections proved to be stronger and changed the PageRank value accordingly.Still, the changes were not significant since there were only few connections toother cities. On the other hand, the number of connections to another floorwas higher but it still did not change much since the people tended to connectmore to their floor than to the other floor. Overall, there were only 11.9% con-nections made not on the same floor. The interaction between persons did alsonot influence the network very much. With only 10.5% of all edges classified asunregular (or not at all, 0.7%) contacted persons the company can be seen aspretty communicative. The additional 13.75% classified as fewer than severaltimes a month might be more influencing but there is still to consider thatthe questions were not answered by the same person. Therefore we can notbe entirely sure if some answers do not fall actually in the category “severaltimes a month” and the other way around.
Up to now we omitted the question about the time two persons know eachother. And this is the first time the results changed. Figuring that newerworking relations are not as well established as old relations we set the weightfor newer connections higher. As it is visible in Figure 4.12(a) the clusteringfrom the other networks seems to dissolve but in the lower left corner. Thisgroup appears to be fairly new assembled or it contains a lot of new hires such
49

4.4 Evolved networks
that there the edges had more weight. This proved to be true after a lookupin the extracted data. The upper half contains both, persons who are longin the company and are responsible for the far spread as also some relativelynew guys as also new hires. For example, in the upper right corner we can seea small clustering consisting out of several persons who know each other forroughly the same amount of time.
In Figure 4.12(b) is this group even tighter clustered as in Figure 4.12(a)and we can distinguish it as the former mentioned subgroup again. In thisvisualization seems to develop a new cluster in the upper right part of thenetwork. This proved to be true in the community analysis with the Louvainalgorithm. As it is shown in Figure 4.12(c) we now have five communities, oneconsists almost out of the node in the mentioned new cluster in Figure 4.12(b).The other clusters are actually the communities we were able to find in all theother networks.
Since the other networks did not yield any new information about the struc-ture of the groups we will now consider again the co-authorship network fromSection 4.1.
4.4.9. Comparsion between different networks
First of all we will compare the connectivity. Since in the co-authorship net-work are less nodes than in the networks retrieved by the survey the values ofthe PageRank-vectors were different. But there were other changes as well. Asthe most important, the order of the persons sorted according to their PageR-ank value changed very much. This is important to consider for the relations.If we are in the co-authorship network there are different nodes important.That might lead a new hire to judge that those persons are either competentor helpful in writing a paper. Taking some different network like the basicnetwork modified with the interaction evaluation a new hire would see moreimportant persons to contact if he wants to get to know people who can helphim in his research.
To make this more explicit look at Figure 4.13(a). A new hire might tryto communicate with the dark node at first and discover that he could leadhim where he needs to be. Since this node has a high betweenness valueit is fair to assume his time is already scarce and he might not have theneeded time to supply the new employee with the needed information. Inthe Figure 4.13(b) he not only has more choices but he also has the ability
50

4.4.9 Comparsion between different networks
(a) Time modified basic networkA.20 (b) Time modified access networkA.21
(c) Time modified access networkcommunitiesA.22
Figure 4.12.: (a), (b): Two examples of how the relations are changed if timeis considered as an influencing factor; (c) shows a different com-munity structure than observed before due to the time-factor
51

4.4 Evolved networks
(a) Co-AuthorshipA.23 (b) Basic-Network, modified withinteracitonA.24
(c) Both networks mixedA.25 (d) Four dimension-network, mixedwith co-authorshipA.26
Figure 4.13.: (a) shows the co-authorship network from Section 4.1 again witha different view; (b) shows the basic network modified for theinteraction; it is clearly visible that not only the PageRank valueshave a different distribution but also the betweenness values havechanged; (c) shows the mixture of both networks.52

4.4.9 Comparsion between different networks
to discover to which working group the person belongs to. He can still askthe persons with the highest betweenness values if they have time to showhim to the needed contacts. Now he has also the information needed to tellgroups apart and thus he can interact with the correct persons immediately.Both networks together might tell him even more about the working relationsinside the company and thus lead him more directly to the needed contacts(Figure 4.13(c)). For the combination of the two networks we restricted ourselves to the persons who participated in the survey. Or the combination ofthe network with the four dimensions from Figure 4.11(a) together with theco-authorship network as a map of whom to talk to in this matter might bean even better idea to guide new employees. This network has like the co-authorship network only one very between node but as before we can see thegroups more clearly and we have a slightly better adjusted estimation of thePageRank.
53

4.4 Evolved networks
54
5. Conclusion
We will give a short summary at first about what we have seen. After this wewill give some options on how to improve the ideas used and how the developedquestionnaire might be improved for further uses. Also we will revisit theanalysis to give examples about possible variations of our algorithms or otheralgorithms that might be used not only for companies but also for researchinterests. In the end the own opinion of the author will be stated with somethoughts about how to increase the willingness of employees to participate inthe survey and why not everyone participated.
5.1. Summary
After the introduction to the topic where we introduced several other re-searchers and their findings we introduced the reader to graph theory. Thiswas a basis for our research and thus needed. With the concepts introducedwe were able to explain the algorithms used. For some of the algorithms, forexample the Louvain-algorithm, it would have been possible to explain this onewithout the graph theoretical background and explain it by talking about so-cial communities and how to set them the best but this would need much moreexperience on social behaviour on our behalf and is thus left. Nevertheless,this chapter was not necessary to be understand completely to get the ideaof the next chapter where we dived into the explanation of the questionnaire.Afterwards we went on and examined the results of the four weeks survey withsome interesting results. As we saw most of the communities we found wereeither close or exactly the existing working groups which shows that the ties inthe company are well made. Also, it shows that the existing relations shouldeither be deepened or at least maintained. Some of the community structuresshowed that very clearly, see Figure 4.12(c) for comparison, where we had onenew community based on the ages of their relationship. If they should driftof from the network there is the possibility for a loss of knowledge for the

5.2 Future research
company. Overall, the results showed a positive result indicating no furtherproblem inside the investigated research groups. In addition to the existingcommunication network we compared it with the co-authorship network anddiscovered that the combined network might yield more information if we wantto find the correct research group. Nevertheless it is not as helpful to use theco-authorship network since there are first of all not alls employees mentionedwhereas in the survey everyone is mentioned or able to answer.
5.2. Future research
The main idea of doing the survey online was saving money and saving time.This is still valid but it is complicated to motivate everyone to participatein an online survey. Reminding them via mail might lead to the feeling ofan obnoxious researcher who is only interested in his success. Thus it mightbe more intelligent to go with the idea of D. M. Bushnell and Parasuraman(2003) who send their survey either with mail or a postcard in advance andhad relative good response rates. Admittedly this results in higher prices toconduct the complete survey with prices between 1.10¤ for a letter and answerletter up to more than 11 ¤ for a certified mail package. It might also be agood idea to get the employees more motivated by informing the head of thecorresponding group of the lack of motivation.
Nevertheless, there are also algorithmic ideas that can be introduced intothe field of research to improve the analysis. We know there is research in mailcorrespondence as well as in email correspondence (Adamic & Adar, 2008;Culotta, Bekkerman, & Mccallum, 2004; Viegas, Golder, & Donath, 2006)and this might be useful to get an additional social network with references tothe abilities the persons involved have. To the best of our knowledge no useof both, the social network as perceived by the persons as well as their emailnetwork, has been reported. Thus it might be interesting to see if there areadditional persons in one of both networks yielding information about why,how or where the person had been contacted. As an additional advantageof this research the company would also get extensive information about theknowledge the scientist have since it is possible to extrapolate the topics emailsare about (Culotta et al., 2004).
While this might yield additional information about the persons involvedin the daily work it also might be interesting to introduce a flow analysis
56

5.2 Future research
based on the email correspondence to discover communities as it is done byRosvall and Bergstrom (2008) (Rosvall & Bergstrom, 2007). Furthermore, itmight be interesting to predict changes and thus it might be interesting touse the Alluvial-algorithm developed by Rosvall and Bergstrom (2010) thatimplements bootstrap resampling of an existing network to get the structualchange in the network. Doing so not with bootstraped networks but realnetworks might reveal important changes over time as for example behaviouralchanges depending on projects or arguments.
Up to now we presented only additional ideas how to get information. Weknow, there are problems with some of the ideas due to the data protectionact. One would have to guarantee that all emails either are only work relatedbefore evaluating them or evaluating all without looking into them and discardall mislead topics. Both are not necessarily suitable solutions but to our bestknowledge there is no email system that separates emails directly in only-work-related and miscellaneous. Thus we will now also go shortly over somealgorithms that we were not able to test due to time restrictions.
There are algorithms that are supposed to analyze opinion propagation dy-namics. They can be influenced by vanity. Usually this is modeled with staticvalues for influence of the propagation factor and the vanity factor (Deffuant,Carletti, & Huet, 2012) but one can easily think about inverse PageRank val-ues as the propagation factor for each person. Without loss of generality weexpect to see from these algorithms some interesting predictions for the futuretrend of communication and opinion making. Considering the wide range ofbehaviours defined by the social sciences one can model even more diversebehaviours. For example, Rosvall and Sneppen (2006) developed a differentmodel in which chatting, cheating and lying was considered and edges got cre-ated by random and they talked always about one other person in the networkwhere in the Leviathan model (Deffuant et al., 2012) the talk was about theminimum of people known and a hard defined minimum higher than 1. Alsothe models differ in the link-behaviour, the Leviathan model keeps informationand therefore links while the model presented by Rosvall and Sneppen loseslinks by rewiring. It is possible to define a combined model or to define some-thing completely different, an advantage of the social sciences. We can alsothink about some non-social uses of the algorithm. Considering the scale-freenature of social networks one might use this network and apply a Monte-Carlo-Markov-Chain-algorithm to get different configurations of the network.In these the researcher then might try to find interesting patterns that are not
57

5.3 Final words
special on a first peek.
The questionnaire itself can be improved by asking the participants how thequestions can be made shorter, more self-explaining and more clear. While wehave there some easy options for the simple improvement of the language andmaybe the appearance we still do not have the wanted response rate of 100%.To the best of our belief it is not possible to get this response rate in a reallife survey. Nevertheless we have some ideas how to improve the number ofresponses:
• visit the department investigated and explain yourself
• get the head of the department to support your interest
• set an incentive
Although we followed all of our suggestions we did not get close to the ratewe were hoping for. After re-consideration we came to the conclusion that weshould have been more persistent and spoken more directly to the employeesof the departments.
5.3. Final words
To come to an end of this thesis I will present my own opinion about theproblems I had to face.
One of the biggest problems was of course the response rate like writtenabove. Even with the support of the heads of the departments it was hard toget the people to collaborate with me. It depended strongly on the relationwith the person and where the person worked. For one group it was very easysince I knew most of the people and they knew me such that answering thequestionnaire was not a problem. Still, that defied the fact that an interviewershould be neutral against the interviewed person (Rubin & Babbie, 2005).The other group was neutral and the number of responses dropped with thefamiliarity. I guess it was good that I was only to investigate the two groups.If I would have done all of them it would have been more than complicated toget he people to participate if they do not know me. Even in the departmentsinvestigated there were enough problems, even after setting an incentive andgetting the heads of the departments to have my back and support me.
58

5.3 Final words
It was also an interesting task to develop a questionnaire. I never thoughtthat there are so many different interpretations of so few words like I usedin the questions posed. I want to thank specially my advisor for his help inthe design of the questions and also the persons who helped me improving thequestions.
59

5.3 Final words
60
References
Adamic, L., & Adar, E. (2008, July 3). How to search a social network (Vol. 27)(No. 3). Available from http://arxiv.org/abs/cond-mat/0310120
Arbitron/Edison Research. (2011). The infinite dial 2011.http://www.edisonresearch.com/home/archives/2011/04/
the infinite dial 2011.php.Bank of America Merrill Lynch Global Research. (2011, May). Re-
port: Do almost all americans use facebook yet? Retrieved02.11.2011, from http://www.allfacebook.com/report-do-almost
-all-americans-use-facebook-yet-2011-05
Bitkom/gh. (2008). Umfrage: Deutsche sitzen lange vor dem computer.Retrieved 27.03.2012, from http://www.computerbild.de/artikel/
cb-News-PC-Hardware-Bitkom-Umfrage-Deutsche-sitzen-lange
-vor-dem-Computer-3276484.html
Blondel, V. D., Guillaume, J.-L., Lambiotte, R., & Lefebvre, E. (2008).Fast unfolding of communities in large networks. J. Stat. Mech. (2008)P10008 .
Brandes, U. (2001). A faster algorithm for betweenness centrality. Journal ofMathematical Sociology , 25 (2), 163-177.
Brin, S., & Page, L. (1998). The anatomy of a large-scale hypertextual searchengine. In Proceedings of the ACM Conference on the World Wide Web.
CareerEnlightment. (2011, August). How businesses use social media forrecruiting. Retrieved 19.04.2012, from http://mashable.com/2011/08/
28/social-media-recruiting-infographic/
Chlldress, B. (2011). Hawthorne experiments. Retrieved 02.11.2011, fromhttp://www.referenceforbusiness.com/encyclopedia/Gov-Inc/
Hawthorne-Experiments.html
Cobanoglu, C., Warde, B., & Moreo, P. J. (2000). A comparison of mail, fax,ans web-based survey methods.
Cross, Parker, A., Prusak, L., & Borgatti, S. (2001, November). Knowing whatwe know: Supporting knowledge creation and sharing in social networks.Organizational Dynamics , 30 (2), 100.
Cross, R., Borgatti, S. P., & Parker, A. (2002). Making invisible work vis-ible: Using social network analysis to support strategic collaboration.California Management Review , 44 (2), 25–46.
Cross, R., & Parker, A. (2004). The hidden power of social networks:

understanding how work really gets done in organizations. Boston:Harvard Business School Press. Hardcover. Available from http://
books.google.de/books?id=vQ3mM4Vpix8C
Culbert, S. A. (2008, October). Get rid of the performance re-view! Retrieved 19.04.2012, from http://online.wsj.com/article/
SB122426318874844933.html
Culotta, A., Bekkerman, R., & Mccallum, A. (2004). Extracting socialnetworks and contact information from Email and the Web. In Ceas-1. Available from http://citeseerx.ist.psu.edu/viewdoc/summary
?doi=10.1.1.59.7117
Deffuant, G., Carletti, T., & Huet, S. (2012, March). The leviathan model:Absolute dominance, generalised distrust and other patterns emergingfrom combining vanity with opinion propagation.
D. M. Bushnell, M. L. M., & Parasuraman, B. (2003). Electronic versus paperquestionnaires: Comparison in persons with asthma. Journal of Asthma,40 (7), 1-11.
Heidemann, J., Klier, M., & Probst, F. (2010). Identifying key users in onlinesocial networks: A pagerank based approach. In Icis 2010 proceedings.
Ingelbrecht, N., Patrick, C., & Foong, K.-Y. (2010). User survey anal-ysis: Consumer marketing using social network analysis, worldwide(Tech. Rep.). Gartner. Available from http://www.gartner.com/it/
page.jsp?id=1409213
Jameson, M. (2012, January 2). From more time in front of screens and less inbed, the american lifestyle promotes added pounds. Retrieved 23.01.2012,from http://www.sun-sentinel.com/health/os-why-americans-are
-fat-lifestyle-20120102-20,0,5960309.story
Kaplowitz, M. D., Hadlock, T. D., & Levine, R. (2004). A comparison of weband mail survey response rates. Public Opinion Quarterly , 68 (1), 94-101. Available from http://poq.oxfordjournals.org/content/68/1/
94.short
Malhotra, N. (2006). The handbook of market research: Uses, misuses, andfuture advances (R. Grover & M. Vriens, Eds.). Rajiv Grover and MarcoVriens.
Medlin, B., & Whitten, D. (2001, Juli). A comparions of in-ternet and mail survey methodologies. Retrieved 23.01.2012,from http://www.quirks.com/articles/a2001/20010703.aspx
?searchID=331297459&sort=9
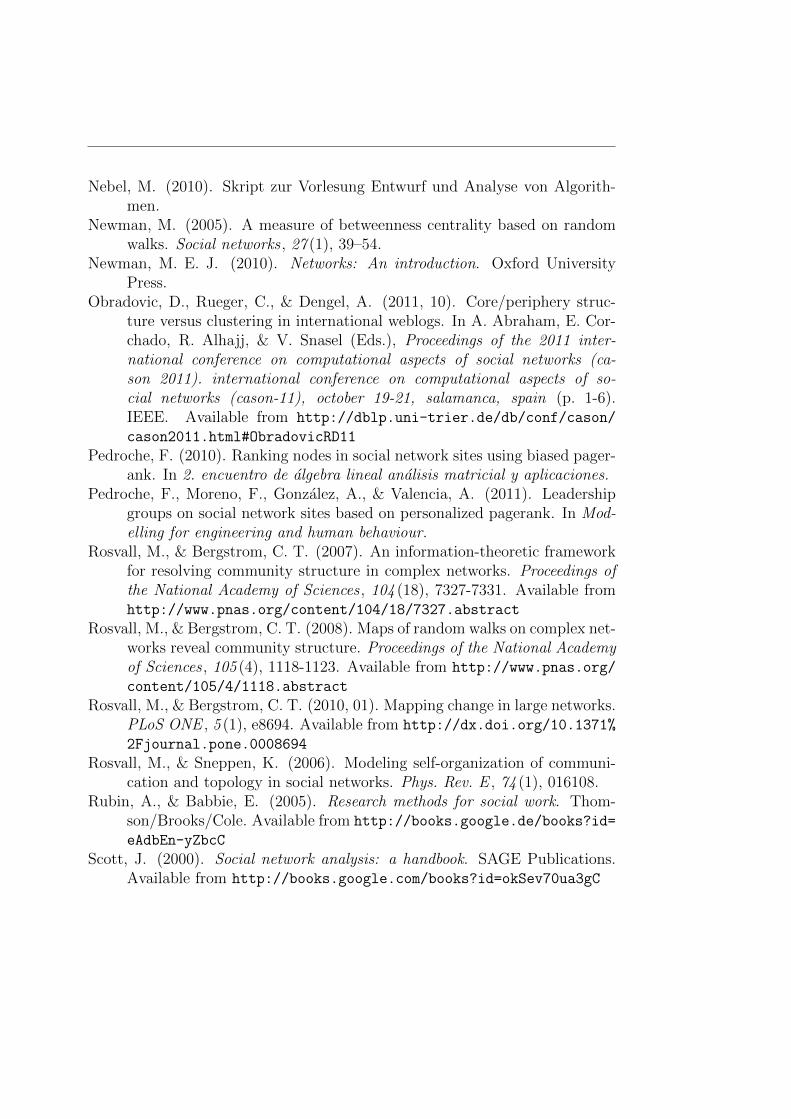
Nebel, M. (2010). Skript zur Vorlesung Entwurf und Analyse von Algorith-men.
Newman, M. (2005). A measure of betweenness centrality based on randomwalks. Social networks , 27 (1), 39–54.
Newman, M. E. J. (2010). Networks: An introduction. Oxford UniversityPress.
Obradovic, D., Rueger, C., & Dengel, A. (2011, 10). Core/periphery struc-ture versus clustering in international weblogs. In A. Abraham, E. Cor-chado, R. Alhajj, & V. Snasel (Eds.), Proceedings of the 2011 inter-national conference on computational aspects of social networks (ca-son 2011). international conference on computational aspects of so-cial networks (cason-11), october 19-21, salamanca, spain (p. 1-6).IEEE. Available from http://dblp.uni-trier.de/db/conf/cason/
cason2011.html#ObradovicRD11
Pedroche, F. (2010). Ranking nodes in social network sites using biased pager-ank. In 2. encuentro de algebra lineal analisis matricial y aplicaciones.
Pedroche, F., Moreno, F., Gonzalez, A., & Valencia, A. (2011). Leadershipgroups on social network sites based on personalized pagerank. In Mod-elling for engineering and human behaviour.
Rosvall, M., & Bergstrom, C. T. (2007). An information-theoretic frameworkfor resolving community structure in complex networks. Proceedings ofthe National Academy of Sciences , 104 (18), 7327-7331. Available fromhttp://www.pnas.org/content/104/18/7327.abstract
Rosvall, M., & Bergstrom, C. T. (2008). Maps of random walks on complex net-works reveal community structure. Proceedings of the National Academyof Sciences , 105 (4), 1118-1123. Available from http://www.pnas.org/
content/105/4/1118.abstract
Rosvall, M., & Bergstrom, C. T. (2010, 01). Mapping change in large networks.PLoS ONE , 5 (1), e8694. Available from http://dx.doi.org/10.1371%
2Fjournal.pone.0008694
Rosvall, M., & Sneppen, K. (2006). Modeling self-organization of communi-cation and topology in social networks. Phys. Rev. E , 74 (1), 016108.
Rubin, A., & Babbie, E. (2005). Research methods for social work. Thom-son/Brooks/Cole. Available from http://books.google.de/books?id=
eAdbEn-yZbcC
Scott, J. (2000). Social network analysis: a handbook. SAGE Publications.Available from http://books.google.com/books?id=okSev70ua3gC

Seger, C. R., Smith, E. R., Kinias, Z., & Mackie, D. M. (2009). Knowing howthey feel: Perceiving emotions felt by outgroups. Journal of ExperimentalSocial Psychology , 45 (1), 80 - 89.
Tarnow, E. (1999, Juni). An offending survey. Retrieved 02.04.2012, fromhttp://www.salon.com/1999/06/14/scientific authorship/
Tarnow, E. (2002). Coauthorship in physics. Science and Engineering Ethics .Tarnow, E. (2008). Subconscious ratings of inappropriate coauthorship in
physics. The Open Ethics Journal .Turling, F. (2007, Juni). Business intelligence und web 2.0: Modellierung von
social networks. http://www.prudsys.de/Service/Downloads/files/DMC2007 tuerling shsviveon.pdf.
Viegas, F. B., Golder, S., & Donath, J. (2006). Visualizing email content:portraying relationships from conversational histories. In Chi ’06: Pro-ceedings of the sigchi conference on human factors in computing sys-tems (pp. 979–988). New York, NY, USA: ACM Press. Available fromhttp://dx.doi.org/10.1145/1124772.1124919
Why you should waste time chatting at work. (2011, September). Re-trieved 26.03.2012, from http://bitesizebio.com/articles/why-you
-should-waste-time-chatting-at-work/
Wiggins, A., McQuaid, M., & Adamic, L. (2006). The small world of academichiring networks. In Applications of social network analysis: Proceedingsof the 3rd conference on applications of social network analysis.
Wikipedia. (2011a, October). Six degrees of separation. Retrieved 02.11.2011,from http://en.wikipedia.org/wiki/Six degrees of separation
Wikipedia. (2011b, October). Social network: Social network analysis.Retrieved 02.11.2011, from http://en.wikipedia.org/wiki/Social
network#Social network analysis
Zain, B. (2011). How many real offline friends do you really have? Retrieved20.01.2012, from http://thereasoner.com/articles/how-many-real
-offline-friends-do-you-really-have

A. Network depictions

Figure A.1.: Basic-Network: Who works with whom4.3

Figure A.2.: Basic-Network mapped to communities4.4

Figure A.3.: Access-Network4.5(a)

Figure A.4.: Capabilities-Network4.5(b)

Figure A.5.: Engagement-Network4.6(a)

Figure A.6.: Communication-Network4.6(b)

Figure A.7.: Access-Network mapped to communities4.7(a)

Figure A.8.: Capabilities-Network mapped to communities4.7(b)

Figure A.9.: Engagement-Network mapped to communities4.7(c)

Figure A.10.: Communication-Network mapped to communities4.7(d)

Figure A.11.: Combination of capabilities and accessibility4.8(a)

Figure A.12.: Capabilities and accessibility network restricted to most promis-ing connections4.8(b)

Figure A.13.: Capabilities and accessibility network mapped tocommunities4.9(a)

Figure A.14.: Capabilities and accessibility and engagement network mappedto communities4.9(b)

Figure A.15.: Capabilities and accessibility and engagement and communica-tion network mapped to communities4.9(c)

Figure A.16.: Capabilities and accessibility and engagement network4.10(a)

Figure A.17.: Capabilities and accessibility and engagement network restrictedto most promising connections4.10(b)
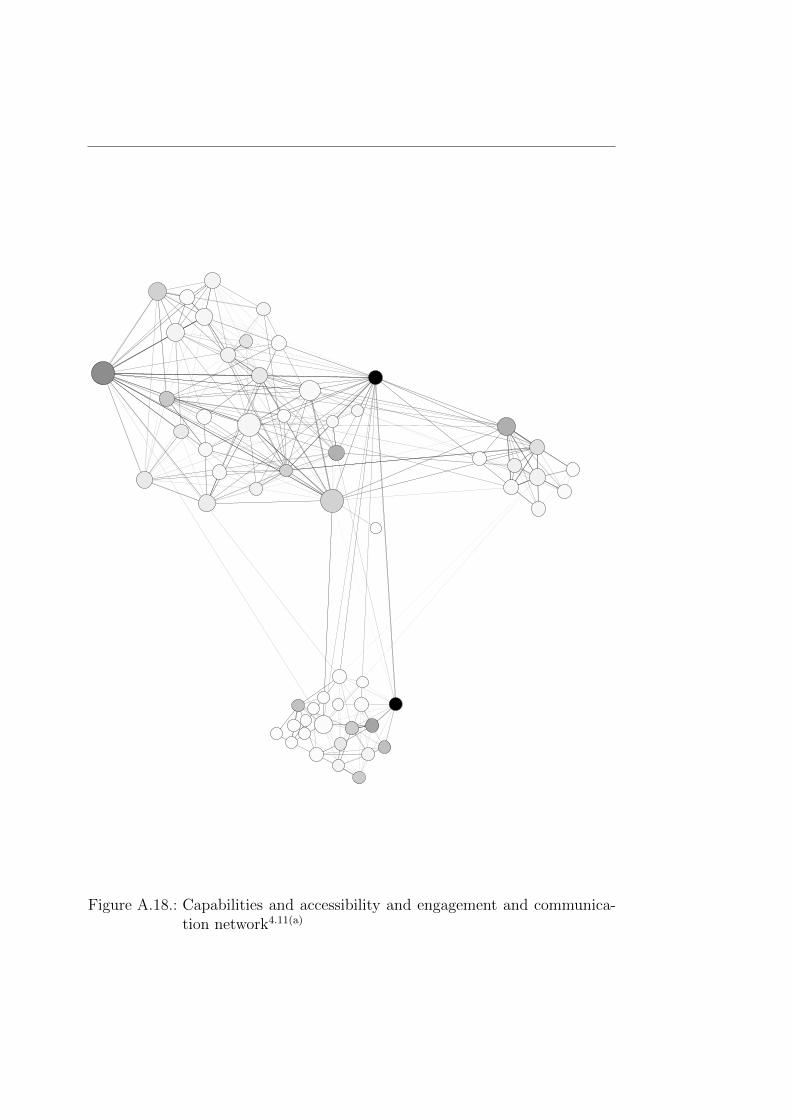
Figure A.18.: Capabilities and accessibility and engagement and communica-tion network4.11(a)

Figure A.19.: Capabilities and accessibility and engagement and communica-tion network restricted to most promising connections4.11(b)

Figure A.20.: Basic-Network: who works with whom modified by timeknown4.12(a)

Figure A.21.: Access network modified by time known4.12(b)
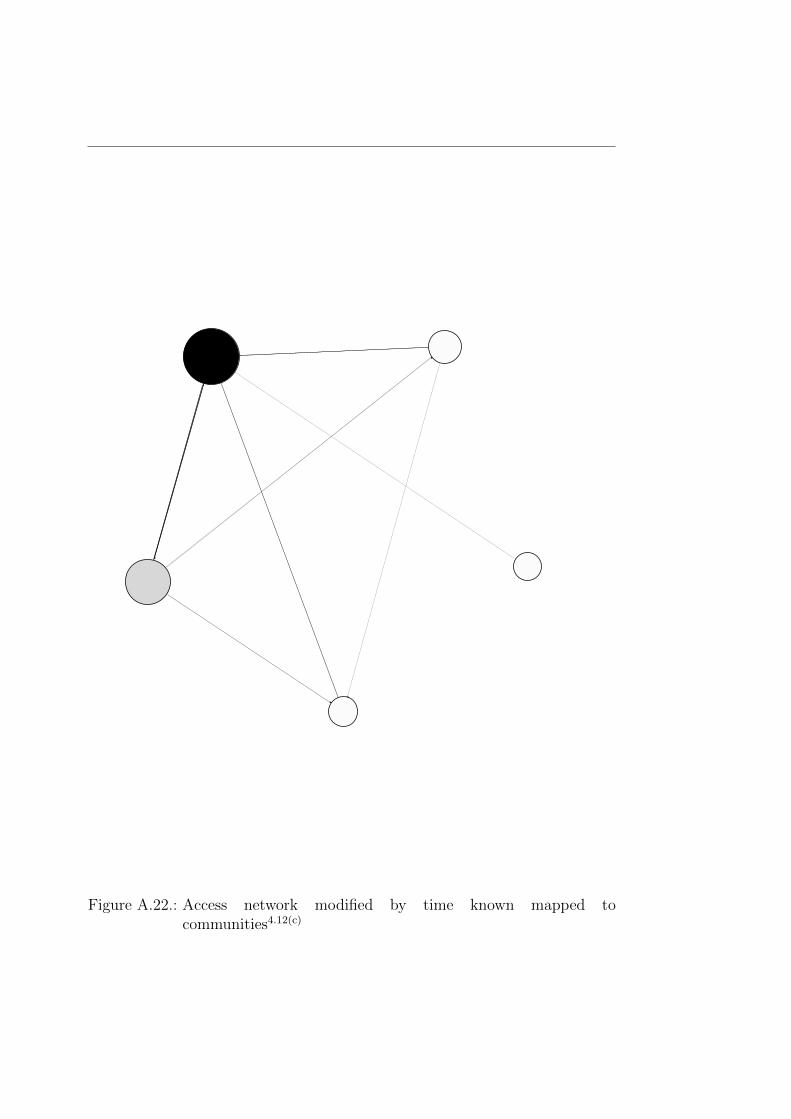
Figure A.22.: Access network modified by time known mapped tocommunities4.12(c)

Figure A.23.: Co-Authorship network4.13(a)
Figure A.24.: Basic-Network: who works with whom modified by amount ofinteraction4.13(b)

Figure A.25.: Combined network of co-authorship and the interaction-basedmodification of the basic network4.13(c)

Figure A.26.: Combined network of the co-authorship and the four dimensionnetwork4.13(d)

Statement of Authorship
I, Wolfgang Schlauch, hereby declare that this submission is my own work
and to the best of my knowledge it contains no materials previously published
or written by another person, or substantial proportions of material which
have been accepted for the award of any degree at any educational institution,
except where due acknowledgement is made in the thesis. I also declare that
the intellectual content of this thesis is the product of my own work, except to
the extent that assistance from others in the project’s design and conception
or in style, presentation and linguistic expression is acknowledged.
Signature: . . . . . . . . . . . . . . . . . . . . . . . . . . . . . . . . . . . . . . . . . . .
Date: . . . . . . . . . . . . . . . . . . . . . . . . . . . . . . . . . . . . . . . . . . . . . . . .