organized delivery systemuclaisap.org/dmc-ods-eval/assets/documents/dmc-ods-year...5 the drug...
TRANSCRIPT

UCLA Integrated Substance Abuse Programs Darren Urada, Ph.D., Valerie P. Antonini, M.P.H., Cheryl Teruya, Ph.D.,Vandana Joshi, Ph.D.,
Anne B. Lee, MFT, LCSW, Isabel Iturrios-Fourzan, M.A., Elise Tran, David Huang, Ph.D., and M. Eva Vazquez
Drug Medi-Cal
Organized Delivery System
2019 Evaluation Report
Prepared for the Department of Health Care Services California Health and Human Services Agency
September 16, 2019

1
Table of Contents Note on Terminology .................................................................................................................. 3
Executive Summary ........................................................................................................................ 4
Access to Care ............................................................................................................................ 5
Quality of Care ........................................................................................................................... 6
Integration and Coordination of Care ......................................................................................... 7
Recommendations ...................................................................................................................... 9
General Background Information ................................................................................................. 10
Overview of waiver implementation in FY 2018-2019 ........................................................... 11
Methodology ................................................................................................................................. 14
Evaluation Questions and Hypotheses ...................................................................................... 15
Evaluation Design ..................................................................................................................... 15
Target and Comparison Populations ......................................................................................... 16
Evaluation Period ...................................................................................................................... 18
Evaluation Measures ................................................................................................................. 18
Access Measures ...................................................................................................................... 18
Quality Measures ...................................................................................................................... 18
Coordination/Integration Measures .......................................................................................... 19
Data Sources ............................................................................................................................. 19
Administrative data sources ..................................................................................................... 19
UCLA evaluation data collection activities (ongoing) ............................................................. 20
Analytic methods ...................................................................................................................... 29
Methodological Limitations ...................................................................................................... 30
Results ........................................................................................................................................... 31
Access to Care........................................................................................................................... 32
Patient Demographics ............................................................................................................... 32
Number of Patients Served ....................................................................................................... 33
Beneficiary Access Line ........................................................................................................... 35
Penetration Rates ...................................................................................................................... 36
Expansion Challenges .............................................................................................................. 38

2
Access to MAT ......................................................................................................................... 38
Access to Telehealth ................................................................................................................. 39
Access to Recovery Support Services ...................................................................................... 40
Recovery Support Services: Peer Support Specialists – Case Study ....................................... 44
Recovery Support Services: A Paradigm Shift – Case Study .................................................. 46
Quality of Care .......................................................................................................................... 49
Quality Improvement Activities ............................................................................................... 49
Use of Evidence-Based Practices ............................................................................................. 50
Use of American Society of Addiction Medicine (ASAM) Criteria-based tool(s) for Patient
Placement and Assessment ....................................................................................................... 51
Treatment Engagement ............................................................................................................. 58
Patient Participation in Treatment Planning ............................................................................. 58
Readmissions to Withdrawal Management .............................................................................. 59
Patients’ Perceptions of Care/Satisfaction with SUD Treatment Services: The Treatment
Perceptions Survey (TPS) ........................................................................................................ 59
Integration and Coordination of Care ....................................................................................... 64
Coordinating/Integrating Care across the Health Care System ................................................ 64
Cross-system Care Coordination – Case Study ........................................................................ 71
Coordination and Continuity of Care Within the SUD system ................................................ 76
Transitions of Care from Withdrawal Management – Case Study .......................................... 80
Key Tool for Integration/Coordination: Case management services ....................................... 83
Delivering Case Management Services – Case Study .............................................................. 89
Conclusions ................................................................................................................................... 93
Lessons Learned and Recommendations .................................................................................. 95
Successful strategies were described in case studies on: ......................................................... 95
Recommendations for DHCS and other states interested in implementing a similar approach95
Interpretations, Policy Implications, and Interactions with Other State Initiatives .................. 97
Appendices .................................................................................................................................... 98

3
Note on Terminology
Individuals Receiving Services
Individuals who are eligible for, or are receiving, substance use or behavioral health services
have been referred to as “clients,” “consumers,” “beneficiaries,” and “patients.” While “client” is
still the dominant term in the substance use field, the increasing integration of behavioral health
with physical health care suggests clinicians will need to unify around standard terms. Therefore,
for consistency, we use the term “patients” throughout this report, except where “client” is used
in a direct quote.
First Wave, Second Wave, and Other Counties
In this report, “First Wave” counties refer to the group of seven counties that were approved by
the California Department of Health Care Services and the federal Centers for Medicare and
Medicaid Services to provide Drug Medi-Cal Organized Delivery System services and began
providing them as of July 1, 2017. These are the same counties that were referred to as “Live
Waiver Counties” in UCLA’s previous evaluation report: Contra Costa, Los Angeles, Marin,
Riverside, San Francisco, San Mateo, and Santa Clara. “Second Wave” counties refer to the 12
counties that began providing DMC-ODS services as of July 1, 2018. “Other” counties refers to
the remaining counties.
Acronyms
A reference for all acronyms used in this report can be found in Appendix A.

4
Executive Summary
5
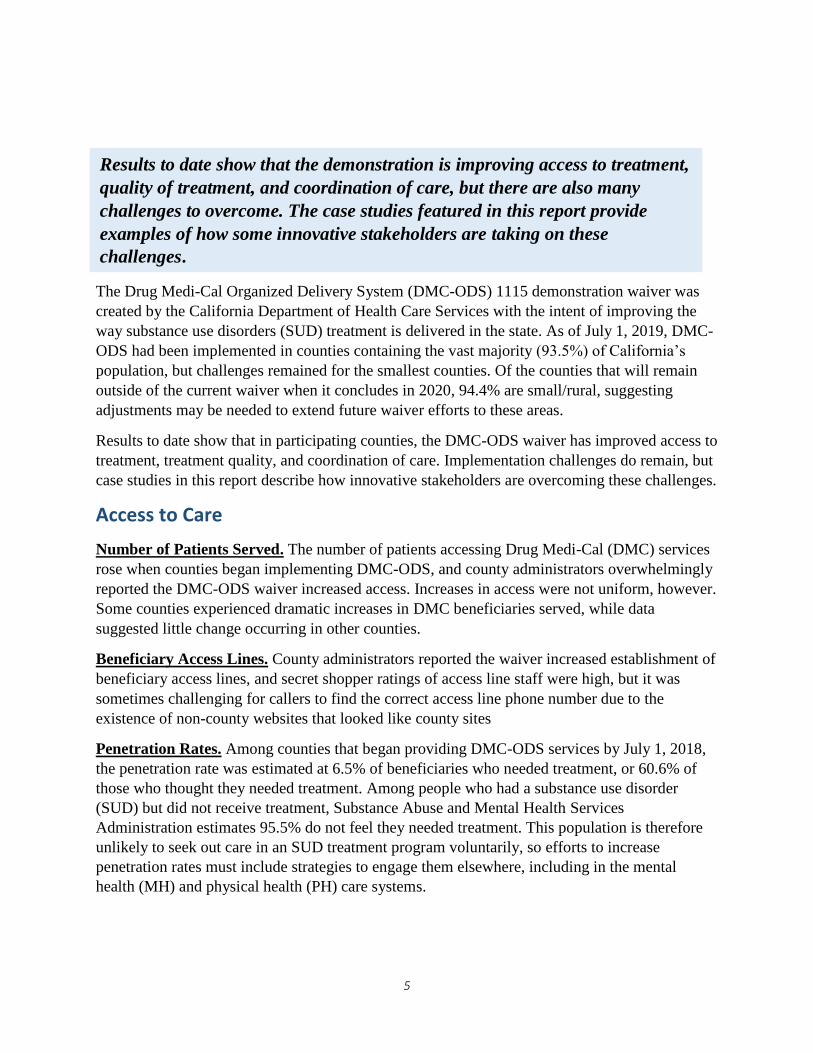
The Drug Medi-Cal Organized Delivery System (DMC-ODS) 1115 demonstration waiver was
created by the California Department of Health Care Services with the intent of improving the
way substance use disorders (SUD) treatment is delivered in the state. As of July 1, 2019, DMC-
ODS had been implemented in counties containing the vast majority (93.5%) of California’s
population, but challenges remained for the smallest counties. Of the counties that will remain
outside of the current waiver when it concludes in 2020, 94.4% are small/rural, suggesting
adjustments may be needed to extend future waiver efforts to these areas.
Results to date show that in participating counties, the DMC-ODS waiver has improved access to
treatment, treatment quality, and coordination of care. Implementation challenges do remain, but
case studies in this report describe how innovative stakeholders are overcoming these challenges.
Access to Care
Number of Patients Served. The number of patients accessing Drug Medi-Cal (DMC) services
rose when counties began implementing DMC-ODS, and county administrators overwhelmingly
reported the DMC-ODS waiver increased access. Increases in access were not uniform, however.
Some counties experienced dramatic increases in DMC beneficiaries served, while data
suggested little change occurring in other counties.
Beneficiary Access Lines. County administrators reported the waiver increased establishment of
beneficiary access lines, and secret shopper ratings of access line staff were high, but it was
sometimes challenging for callers to find the correct access line phone number due to the
existence of non-county websites that looked like county sites
Penetration Rates. Among counties that began providing DMC-ODS services by July 1, 2018,
the penetration rate was estimated at 6.5% of beneficiaries who needed treatment, or 60.6% of
those who thought they needed treatment. Among people who had a substance use disorder
(SUD) but did not receive treatment, Substance Abuse and Mental Health Services
Administration estimates 95.5% do not feel they needed treatment. This population is therefore
unlikely to seek out care in an SUD treatment program voluntarily, so efforts to increase
penetration rates must include strategies to engage them elsewhere, including in the mental
health (MH) and physical health (PH) care systems.
Results to date show that the demonstration is improving access to treatment,
quality of treatment, and coordination of care, but there are also many
challenges to overcome. The case studies featured in this report provide
examples of how some innovative stakeholders are taking on these
challenges.

6
Expansion Challenges. A shortage of qualified medical directors, licensed practitioners of the
healing arts, and bilingual staff were challenges to expansion, according to providers. Survey
results suggest challenges remain in expanding withdrawal management and youth treatment.
Access to Medications for Addiction Treatment. Use of medications for addiction treatment
increased somewhat, but some providers experienced challenges billing and getting reimbursed
for it, and stigma against medications remains among a minority of providers.
Access to Telehealth. A few providers reported beginning to use telehealth, but this remained
the exception rather than the rule.
Access to Recovery Support Services. Recovery support services were seen as valuable, and
providers reported delivering these services, but recovery support service claims were submitted
for fewer than 3% of patients. County administrators suggested this was due to lack of clarity on
allowable use of peers (seen as key players in delivering this service), as well as general billing
and documentation questions. The state initially took
a well-intended approach of not being overly
prescriptive in the implementation of this benefit in
an effort to promote innovation, but the resulting
uncertainty may be inadvertently having the opposite
effect. Some counties have managed to take
advantage of the benefit, however. Case studies
highlight implementation in Riverside and Santa
Clara counties, the two counties that are submitting
the most claims for recovery support services.
Quality of Care
Overall, data suggest that the DMC-ODS waiver is improving treatment quality. Patients rate
their quality of care high, and county administrators report that the DMC-ODS waiver has
positively influenced quality improvement efforts.
Evidence-Based Practices. Counties reported that complying with the evidence-based practice
requirements of DMC-ODS was only somewhat challenging and ratings suggested it was getting
easier over time. However, counties also struggled with assessing implementation fidelity and
requested technical assistance on this topic.
ASAM Criteria. Similarly, implementing the American Society of Addiction Medicine (ASAM)
Criteria has become less challenging for counties over time, but counties indicated interest in
receiving technical assistance for fidelity assessment, as well as integrating ASAM Criteria
assessment information with electronic health records, and using this information for treatment
planning.
Most patients (84.7%) were referred to the level of care indicated by their ASAM criteria
screenings or assessments, and most of these referred patients (72.3%) went on to receive
“Don’t hire peers cause of their
lived experience. We hire peers
because of their recovery from their
lived experience. They have to be
the evidence that recovery is
possible.”
Riverside County Recovery Support
Services Case Study Interviewee
7
treatment at the providers to which they were referred within 30 days of their initial screening or
assessment.
Treatment Engagement. Treatment engagement, as measured by three visits within the first 30
days using DMC claims data, improved slightly for calendar year (CY) 2018 compared to CY
2017. The rates in CY 2018 ranged from 53.2% in outpatient treatment to 93.6% in residential
treatment. These rates are comparable to or higher than rates published in the peer-reviewed
literature from other states.
Patient Participation in Treatment Planning. Both providers (78.2%) and patients (87.2%)
indicated that patients participated in the development of their treatment plans and goals,
suggesting patient-centered treatment planning was common, though not universal.
Readmissions to Withdrawal Management. According to DMC claims data for CY 2018,
among patients with withdrawal management episodes, 13.8% had at least one more withdrawal
management episode within 14 days of discharge.
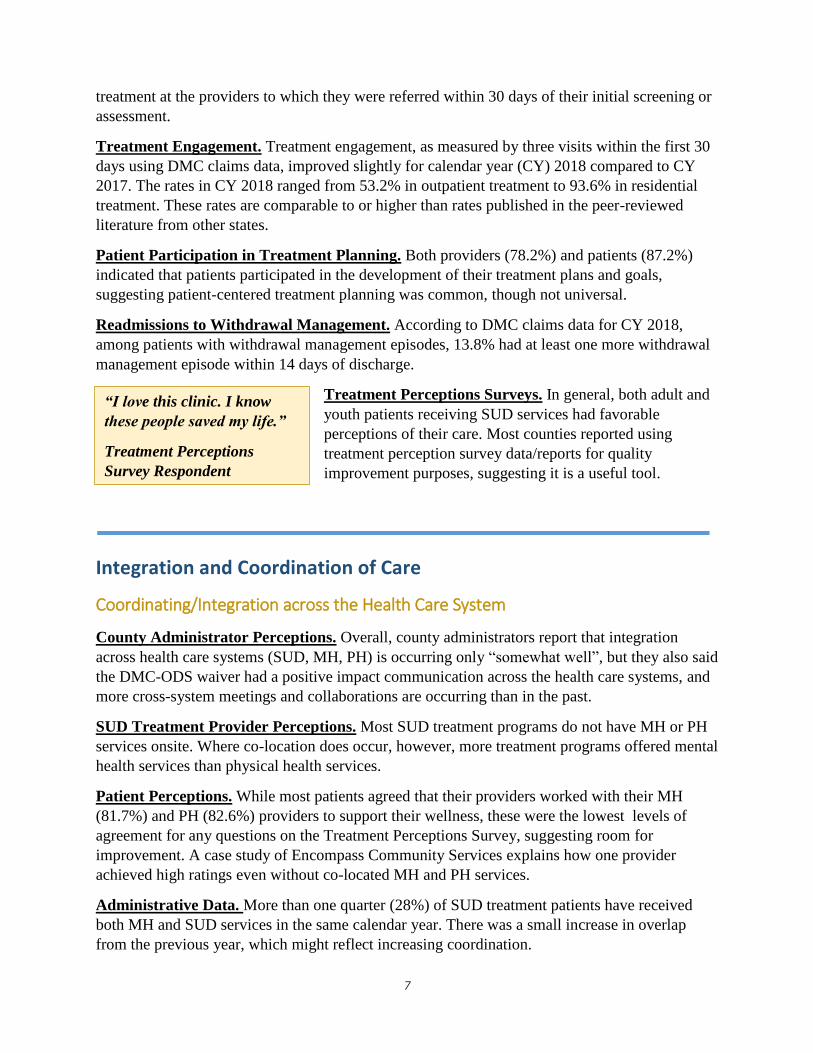
Treatment Perceptions Surveys. In general, both adult and
youth patients receiving SUD services had favorable
perceptions of their care. Most counties reported using
treatment perception survey data/reports for quality
improvement purposes, suggesting it is a useful tool.
Integration and Coordination of Care
Coordinating/Integration across the Health Care System
County Administrator Perceptions. Overall, county administrators report that integration
across health care systems (SUD, MH, PH) is occurring only “somewhat well”, but they also said
the DMC-ODS waiver had a positive impact communication across the health care systems, and
more cross-system meetings and collaborations are occurring than in the past.
SUD Treatment Provider Perceptions. Most SUD treatment programs do not have MH or PH
services onsite. Where co-location does occur, however, more treatment programs offered mental
health services than physical health services.
Patient Perceptions. While most patients agreed that their providers worked with their MH
(81.7%) and PH (82.6%) providers to support their wellness, these were the lowest levels of
agreement for any questions on the Treatment Perceptions Survey, suggesting room for
improvement. A case study of Encompass Community Services explains how one provider
achieved high ratings even without co-located MH and PH services.
Administrative Data. More than one quarter (28%) of SUD treatment patients have received
both MH and SUD services in the same calendar year. There was a small increase in overlap
from the previous year, which might reflect increasing coordination.
“I love this clinic. I know
these people saved my life.”
Treatment Perceptions
Survey Respondent

8
Coordination and Continuity of Care within the SUD treatment system
County Administrator Perceptions. Administrators reported that they were tracking patient
movement in the SUD system “somewhat well,” a slight improvement from the previous year.
Federal regulations on confidentiality (42 CFR,
part 2) remain a significant barrier to
collaboration, according to county
administrators. Obtaining the required patient
consents to release information continues to be a
challenge for providers and a significant barrier
to coordination of care. County administrators
requested technical assistance and/or guidance.
Implementing a countywide electronic health
record has helped some counties navigate privacy
and confidentiality regulations.
Transitions of Care. Transitioning patients from
withdrawal management and residential treatment
to lower levels of care are challenging, but improvement is possible, as highlighted in a
Riverside case study. Riverside increased the number of patients transitioning from withdrawal
management to treatment by 48% using a regional care coordination team.
Case Management
A relatively small amount of claims for case management services have been submitted, but,
over 90% of county administrators reported that the DMC-ODS waiver positively impacted the
delivery of case management services in their counties.
Los Angeles County is highlighted in a case study
because the county provides case management to a
higher percentage of their clients than any other DMC-
ODS county. The county made an effort to make clear
which activities could and could not be billed as case
management, and emphasized that everyone should be
offered case management. The county subsequently
determined through their own analyses that case
management recipients, compared to patients that did
not receive case management, were more likely to have a successful discharge status, be
abstinent at discharge, and report improvement in their physical and mental health from
admission to discharge.
Implementation of the DMC-ODS waiver is still unfolding, and by all accounts, the DMC-ODS
waiver has required profound changes in practices and culture shifts that take time to develop.
Current recommendations are listed below.
“We wanted providers to first be
aware of the benefit since it was
something that was newly
billable …. It was a culture shift
in that there wasn’t explicit
bandwidth for case management
before.”
Los Angeles County Case Study
Interviewee
“With the waiver, we implemented a new
ROI [release of information] that allows
providers . . . to communicate for
purposes of coordination of care. We
have also adopted a common EHR
[electronic health record] used across
portals: outpatient/intensive, residential,
withdrawal management, and recovery
residence providers”
County Administrator Survey Respondent

9
Recommendations
Provide greater clarity on what activities are billable for recovery support services and case
management, and what documentation is needed.
o Providing lists of practices that have successfully been approved, as well as those that have
not, with the understanding that actual claim approval or denial depends on the exact details of
the implementation, would be a good start.
Re-institute the standard CalOMS-Tx reports that were available before the dataset migrated to the
BHIS system. Re-initiate “CalOMS-Tx rewrite” efforts to better align CalOMS-Tx with the DMC-
ODS waiver (e.g. incorporation of ASAM levels of care to replace older treatment modalities).
Explore options to address non-county websites that may be misleading beneficiaries into thinking
they are county websites.
Promote screening for SUD in MH and PH settings and linkage to onsite or well-coordinated SUD
treatment for those who need it to increase treatment penetration rates.
Continue to address MAT stigma among providers.
Provide Technical Assistance on:
o Data collection and submission: Provide technical assistance to counties regarding the data to
be collected and submitted under the waiver (e.g., ASAM LOC, claims), monitor whether the
data are being submitted in a timely fashion, and give initial feedback to minimize missing or
inaccurate data.
o ASAM Criteria: Provide technical assistance to counties on how to implement various aspects
of the ASAM Criteria (e.g., brief screening, initial assessment, follow-up assessment,
treatment planning), including optional DHCS-approved ASAM Criteria-based
screening/assessment tools, and guidance for assessing fidelity to the ASAM Criteria, while
allowing room for flexibility to address each county’s unique needs.
o Evidence-based practices: How to assess fidelity to evidence-based practices.
o EHR systems: (e.g., to incorporating ASAM Criteria-based assessments, ASAM LOC data
collection, billing, flag high utilizers).
o Memorandums of understanding (MOUs): Provide sample MOUs to establish formal
collaborations for both BH and PH partners.
o 42 CFR privacy regulation: Provide additional guidance and examples of 42 CFR-compliant
Release of Information forms to facilitate referrals and care coordination
o Tracking referrals: Provide examples from other counties that have systemized tracking
referrals (that show actual movement in EHRs) and other existing practices that have been
helpful
o Case management and Recovery support services: Provide clearer guidance and examples of
case management and recovery support service implementation from counties.
o Curriculum for certifying staff in case management core competencies, e.g. how much case
management a patient should receive, how to approach reimbursement for clients who have
been assessed but not treated.
o Youth treatment practices: ASAM criteria assessment for youth, and evidence-based practices
for youth treatment.

10
General Background Information

11
Overview of waiver implementation in FY 2018-2019
Issues California is Addressing with the 1115 Demonstration Waiver
The Drug Medi-Cal (DMC) Organized Delivery System 1115 demonstration waiver (henceforth
referred to as the DMC-ODS waiver) was created by the California Department of Health Care
Services (DHCS) with the intent of improving many issues with the DMC system. Prior to the
waiver, the system was comprised of fragmented services, creating gaps that negatively impacted
patient access and success in treatment. Services were uncoordinated, making it difficult for
patients to navigate the system. Providers indicated that many important services they provided
or wished to provide for patients were not billable, were only reimbursable if delivered by a
limited number of provider types, or were too limited to provide proper care to patients.
Providers were not necessarily required to deliver evidence-based practices in line with current
research, and counties lacked the authority to fully ensure the quality and accountability of their
local providers.
The DMC-ODS waiver was created to test the impact of organizing substance use disorder
(SUD) services to better meet the needs of Medicaid-eligible individuals with SUD. The intent is
to demonstrate how organized SUD care improves quality, access, and coordination/integration
of treatment for beneficiaries while decreasing other system health care costs. Under the DMC-
ODS waiver, care is organized according to the American Society of Addiction Medicine
(ASAM) Criteria for SUD services. The ASAM Criteria are a set of guidelines developed by
ASAM to set a standard for appropriate assessment, placement, treatment planning of patients
with SUD and co-occurring disorders. Services under the waiver also create a continuum of care
and create requirements allowing for local control, accountability, and greater administrative
oversight.
Brief Description and History of Waiver Implementation
The DMC-ODS waiver was approved by CMS in August 2015, with the active demonstration
period lasting through December 31, 2020. The UCLA evaluation plan was approved on June 20,
2016. This evaluation report primarily focuses on data collected in 2018 and early 2019, with
earlier periods used for comparison purposes where available.
Now in its fourth year, the DMC-ODS waiver has been shaping changes in the 30 counties
participating in the waiver (as of July 1, 2019). Ten counties that originally submitted
implementation plans have yet to “go live”, including eight counties that submitted a regional
implementation plan under the Partnership Health Plan (PHP; Humboldt, Lassen, Mendocino,
Modoc, Shasta, Siskiyou, Solano, and Trinity). It is anticipated that the PHP plan will “go live”
in early 2020. For a map of these counties, see Figure 1.

12
Figure 1. Map of live California counties in the DMC-ODS waiver as of July 1, 2019.1
Live (n=30)
01 Alameda
07 Contra Costa
09 El Dorado
10 Fresno
13 Imperial
15 Kern
19 Los Angeles
21 Marin
24 Merced
27 Monterey
28 Napa
29 Nevada
30 Orange
31 Placer
33 Riverside
34 Sacramento
35 San Benito
36 San Bernardino
37 San Diego
38 San Francisco
39 San Joaquin
40 San Luis Obispo
41 San Mateo
42 Santa Barbara
43 Santa Clara
44 Santa Cruz
50 Stanislaus
54 Tulare
56 Ventura
57 Yolo
Not Yet Live (n=10) Non-Waiver (n=18)
12 Humboldt (PHP) 49 Sonoma 02 Alpine 17 Lake 55 Tuolumne
16 Kings 53 Trinity (PHP) 03 Amador 20 Madera 52 Tehama
18 Lassen (PHP) 04 Butte 22 Mariposa 23 Mendocino (PHP) 05 Calaveras 26 Mono 25 Modoc (PHP) 06 Colusa 32 Plumas 45 Shasta (PHP) 08 Del Norte 46 Sierra 47 Siskiyou (PHP) 11 Glenn 51a Sutter 48 Solano (PHP) 14 Inyo 51b Yuba
1 DHCS and the EQRO use county codes which assign a number to each county ordered alphabetically. For consistency with this convention, maps within the report use this numbering system.
13
The current live waiver counties cover 93.5% of the state’s population. If all counties that
submitted implementation plans “go live”, DMC-ODS will cover 97.5% of the population. Of
those that have gone Live, 83.3% are medium or large counties.2 Currently, only 16.7% are
small and none is a small rural county. When the eight Partnership Health Plan counties “go
live”, the total percentage of small or small rural counties that are live will increase to 31.6%.
Significant challenges remain for smaller counties, many of which will be left out of changes
brought about by the waiver. Of the 18 non-waiver counties, 94.4% are either small or small
rural.
Population groups impacted by the demonstration
The DMC-ODS waiver targets Medi-Cal eligible individuals with SUD. As described in the
waiver special terms and conditions (STCs), for counties that opt in to the waiver, individuals
must meet the medical necessity criteria and reside in a participating county to receive waiver
services. In addition, individuals receiving services from tribally operated and urban Indian
health providers, and American Indian and Alaska Native Medi-Cal beneficiaries, will also be
impacted by the waiver.
Additional Information
For a more detailed description of the DMC-ODS and an overview of earlier years of
implementation, please refer to the previous evaluation reports submitted by UCLA in CYs
2016, 2017, and 2018.3
2The following population cutoffs were used: Small Rural < 50,000, Small 50,000-199,999, Medium 200,000-
749,000, Large 750,000-3,999,999, Very Large: 4,000,000+. These were based on:
https://www.dhcs.ca.gov/services/MH/Documents/POS_PopBased_LargeCounty.pdf
3 http://uclaisap.org/dmc-ods-eval/html/reports-presentations.html

14
Methodology

15
Evaluation Questions and Hypotheses
Evaluation hypotheses are organized into the following four categories, or domains:
Access to Care
Beneficiary access to treatment will increase in counties that opt into the DMC-ODS waiver
compared to access in the same counties prior to waiver implementation and in comparison to
access in counties that have not opted in.
Quality of Care
Quality of care will improve in counties that have opted into the DMC-ODS waiver compared to
quality in the same counties prior to waiver implementation and in comparison to quality in
counties that have not opted in.
Costs of Care
Health care costs will be more appropriate pre/post DMC-ODS waiver implementation among
comparable patients; e.g., SUD treatment costs will be offset by reduced inpatient and
emergency department use.
Integration and Coordination of Care
SUD treatment coordination with physical health (PH), mental health (MH), and recovery
support services will improve.
Evaluation Design
The evaluation uses a mixed-methods design that takes advantage of different comparisons based
on the measure in question.
As discussed in the approved evaluation plan, where available data was sufficient (primarily
administrative data), a multiple baseline (aka “stepped wedge”) approach was applied to account
for different county implementation periods, consistent with CMS recommendations for strong
evaluation designs.4 This approach essentially combines pre-post comparisons and comparisons
across counties to test whether changes are detected when counties “go live” but not at the same
time in other counties. In other cases (e.g., Provider Surveys, interviews, ASAM Level of Care)
data was only available post-implementation, in which case post-only analysis was conducted.
4 Reschovsky, J.D. and Bradley, K. (2019). Planning Section 1115 Demonstration Implementation to Enable Strong Evaluation Designs. Available at: https://www.medicaid.gov/medicaid/section-1115-demo/downloads/evaluation-reports/enable-strng-eval-dsgn.pdf

16
Target and Comparison Populations
Due to the normal lag between service delivery and data reporting, it was not possible to analyze
data for all 30 counties that had gone live at the time of this report. For evaluation purposes, the
first 19 counties to “go live” were therefore selected. These were further broken down into First
Wave and Second Wave counties. First Wave counties were early adopters that went live as of
July 1, 2017. Second Wave counties went live as of July 1, 2018. For comparison, Other counties
include all counties that had not gone live as of that date. Other counties are a mix of counties
that did not submit implementation plans and counties that did but had not managed to “go live”
until after July 1, 2018. Since administrative data after July 1, 2018 were not generally complete,
and exploratory analyses of 2019 survey data responses indicated counties that went live after
July 1, 2018 were more similar to responses from Other counties rather than responses from
Second Wave counties, they were placed in the Other counties group for this report.
The counties included in each group are shown in Figure 2, while basic demographic and service
information are shown in Table 1 (see Results section under Access to Care). Target and
comparison populations and inclusion/exclusion criteria differ by data source. For more
information see the Evaluation Measures section.

17
Figure 2. Map of county groups used for evaluation analyses.
First Wave (n=7)
07 Contra Costa
19 Los Angeles
21 Marin
33 Riverside
38 San Francisco
41 San Mateo
43 Santa Clara
Second Wave (n=12)
01 Alameda
13 Imperial
27 Monterey
28 Napa
29 Nevada
30 Orange
36 San Bernardino
37 San Diego
39 San Joaquin
40 San Luis Obispo
44 Santa Cruz
57 Yolo
Other Counties (n=39)
02 Alpine 14 Inyo 26 Mono 49 Sonoma
03 Amador 15 Kern 31 Placer 50 Stanislaus
04 Butte 16 Kings 32 Plumas 51a Sutter
05 Calaveras 17 Lake 34 Sacramento 51b Yuba
06 Colusa 18 Lassen 35 San Benito 52 Tehama
08 Del Norte 20 Madera 42 Santa Barbara 53 Trinity
09 El Dorado 22 Mariposa 45 Shasta 54 Tulare
10 Fresno 23 Mendocino 46 Sierra 55 Tuolumne
11 Glenn 24 Merced 47 Siskiyou 56 Ventura
12 Humboldt 25 Modoc 48 Solano
18
Evaluation Period
Broadly speaking, the evaluation period spans from the DMC-ODS waiver’s approval in CY
2015 through the end of the waiver in CY 2020. However, as described earlier, counties began
participating in the DMC-ODS waiver on different dates. The first counties went live on
February 1, 2017, and new ones are continuing to “go live.” The implementation period being
evaluated is therefore best described as February 1, 2017 through December 31, 2020. A pre-
waiver period extending back to CY 2015 is used where data sources allow (administrative data,
county administrator surveys).
Evaluation Measures
The following measures are included in this report. For a fuller description of these measures, see
the Evaluation Plan (Appendix B). Due to data availability, not all measures described in the
evaluation plan are included in this report. In particular, cost measures are not included because
Medi-Cal Managed Care/Fee for service data was not available in time for this report.
Access Measures
Patient demographics
Number of patients served
Stakeholder perceptions of access to care
Existence of a 24/7 functioning beneficiary access phone number
Penetration rates
Expansion challenges
Access to Medications for Addiction Treatment (MAT)5
Access to Telehealth
Access to Recovery Support Services
Quality Measures
Quality improvement activities
Use and monitoring of evidence-based practices
Use of ASAM criteria-based tool for patient placement and assessment
5 MAT is commonly referred to as Medication-Assisted Treatment. Wakeman (2017) argues this contributes to stigma by treating addiction medications as secondary, and different from medications for other conditions. We therefore use the more neutral term Medications for Addiction Treatment. Wakeman (2017). Medications for Addiction Treatment: Changing language to improve care. Journal of Addiction Medicine. 11(1):1–2

19
Appropriate treatment placement
Treatment initiation/engagement
Patient participation in treatment planning
Readmissions to withdrawal management
Patient perceptions of care
Coordination/Integration Measures
Integration of MH and PH services with SUD services (across the health care systems)
Coordination and continuity of care within the SUD system
Utilization and impact of the case management benefit
Each measure draws on different data sources, described below. UCLA is generally the steward
of these measures, except for initiation/engagement (NQF #0004).
Data Sources
Administrative data sources
California Outcome Measurement System, Treatment (CalOMS-Tx)
CalOMS-Tx is California's existing data collection and reporting system for all patients in
publicly-funded SUD treatment services. Treatment providers collect information from patients
at admission and discharge and send this data to DHCS each month. CalOMS-Tx provides
California’s contribution to the Treatment Episode Dataset (TEDS) maintained by the Substance
Abuse and Mental Health Services Administration (SAMHSA) and includes National Outcome
Measures (NOMS). More information on CalOMS-Tx can be found at:
http://www.dhcs.ca.gov/provgovpart/Pages/CalOMS-Treatment.aspx
Drug Medi-Cal Claims (DMC Claims)
In California, Medicaid-funded SUD treatment is paid for through DMC claims. DMC is a carve-
out for specialty care SUD treatment. For the UCLA evaluation, claims data provided
information on the dates, types, and quantities of services provided.
Mental Health Claims
In California, Medicaid-funded MH treatment is paid for through Short Doyle Medi-Cal claims
(SD/MC). SD/MC is a carve-out for certain MH services to persons eligible for Medi-Cal. For
the UCLA evaluation, SD/MC claims data provided information on the dates, types, and
quantities of MH services provided.

20
Medi-Cal Eligibility Data System (MEDS)
The MEDS database provides information on all California Medi-Cal beneficiaries. These data,
particularly the MEDS Monthly Extract File (MMEF) were used to calculate penetration rates.
National Survey on Drug Use and Health
SAMHSA’s National Survey on Drug Use and Health (NSDUH) provides limited state-level
estimates of substance use prevalence. These data were used for analyses of penetration rates.
Provider Data
DHCS’ Prime system contains the Master Provider File, which includes information on all SUD
provider facilities, including mailing addresses and DMC certification and decertification dates,
among other provider-level information. This information, along with lists of providers
participating in the DMC-ODS waiver obtained directly from each individual county
participating in the waiver, were used to identify, sample, and contact providers for the Provider
Survey.
UCLA evaluation data collection activities (ongoing)
ASAM Level of Care (LOC) Placement Data
Given that the ASAM Criteria are a defining feature of the DMC-ODS waiver, a large new data
collection effort was initiated across waiver counties to collect data on the use of ASAM LOC
brief initial screenings, initial assessments, reassessments, and services delivered. This endeavor
has been a collaborative effort between UCLA-ISAP, DHCS, and counties to collect these data.
DHCS Information Notice 17-035 describing the requirements and procedures to collect ASAM
LOC data was released in September 2017 and was superseded by Information Notice 18-046 in
October 1, 2018. These data include the date of screening or assessment, type (brief initial
screen, initial assessment, follow-up assessment), indicated LOCs, actual placement decision(s),
the reason for the difference between indicated and actual LOCs (if any), and the reason for
delays in placement (if any). While some counties have been experiencing technical issues in
data collection/submission, CY 2018 data for five out of the seven First Wave and eight out of
the twelve Second Wave counties were available for analysis. First Wave counties (eight out of
twelve) included Contra Costa, Marin, Riverside, San Francisco, and Santa Clara counties.
Second Wave counties included Imperial, Monterey, Napa, Nevada, Orange, Placer, San
Joaquin, and San Luis Obispo counties. Data for the other counties are expected to be available
for future reports.
Data on three types of screenings or assessments are possible, defined as follows on the data
collection instrument.
Brief Initial Screen: a brief initial screening that preliminarily determines an LOC
placement until a full assessment can be performed

21
Initial Assessment: a longer comprehensive assessment meant to determine the LOC
recommendation and establish medical necessity
Follow-up Assessment: following an initial assessment, any re-assessment of the patient
occurring during the same treatment episode
Up to three indicated and actual levels of care could be recorded, defined as:
Indicated LOC initially recommended according to screening/assessment instrument prior
to taking patient preference into account. For example, this would be listed under "Final
Level of Care Recommendations" if using CONTINUUMTM software.
Actual LOC/Withdrawal Management placement decision. This is the actual LOC
decided upon after patient input and the LOC where the patient is referred.
The options for LOC, as worded in the LOC reporting template, are listed below. These included
broad to be determined (TBD) options to allow for the results of brief initial screenings that may
indicate a general treatment setting the patient should report to for further assessment (e.g.,
outpatient) without specifying the exact LOC to be received there (e.g., outpatient or intensive
outpatient). The list also includes withdrawal management levels of treatment, which can be
combined with other levels of care.
Level of Care
None
Outpatient/Intensive Outpatient (OP/IOP), exact level TBD
Residential, exact level TBD
Withdrawal Management (WM), exact level TBD
Ambulatory WM, exact level TBD
Residential/Inpatient WM, exact level TBD
Narcotic Treatment Program/Opiate Treatment Program (NTP/OTP)
0.5 Early Intervention
1.0 OP
2.1 IOP
2.5 Partial Hospitalization
3.1 Clinically Managed Low-Intensity Residential
3.3 Clinically Managed Population-Specific High-Intensity Residential
3.5 Clinically Managed High-Intensity Residential Services
3.7 Medically Monitored Intensive Inpatient Services
4.0 Medically Managed Intensive Inpatient Services
1-WM Ambulatory WM without Extended Onsite Monitoring
2-WM Ambulatory WM with Extended Onsite Monitoring
3.2-WM Clinically Managed Residential WM
3.7-WM Medically Monitored Inpatient WM
4-WM Medically Managed Intensive Inpatient WM

22
If at least one of the indicated and actual levels of care did not match, providers were asked to
select the reason for the difference. The options were:
Reason for difference
Not applicable - no difference
Clinical judgement
Lack of insurance / payment source
Legal issues
Level of care not available
Managed care refusal
Patient preference
Geographic accessibility
Family responsibility
Language
Used two residential stays in a year already.
Other
Beneficiary Access Line Secret Shopper Calls
Beneficiary access lines are an important point of access to SUD treatment. For many patients,
the staff who answer calls to these lines may be the first person they speak to about their need for
help. Furthermore, the beneficiary access line may be the only avenue patients are aware of to
get help. For these reasons, these lines are vital to creating and maintaining access to care.
In order to evaluate the practical availability of county beneficiary access lines, a total of 85
secret shopper calls were made to these lines since implementation of the DMC-ODS waiver.
Secret shopper calls were made to 26 of the First and Second Wave counties that went live under
the DMC-ODS waiver prior to July 1, 2019.6 Each county was called at least once during regular
business hours (between 8am – 5pm), and most were called at least once after hours (between
5pm – 7am or on a weekend). After each call, the same county was not called again for a period
of at least three weeks in order to capture an in-depth picture of the beneficiary access line
performance over time. As the secret shopper calls are ongoing, not every county was called
three or more times within this reporting period. Twenty one of the calls were conducted in
English, 53 were conducted in Spanish, and the remaining 11 calls were sent to an answering
machine/voicemail or were otherwise not answered.
First, the secret shopper attempted to find the beneficiary access line phone number using an
internet search. The relative ease of finding the correct number was rated on a ten-point scale,
with one being hard and ten being easy. Before the call, the secret shopper selected one from
eight possible scenarios (e.g., a 57-year-old man living in West Covina with an alcohol and
6 Alameda, Contra Costa, El Dorado, Fresno, Imperial, Kern, Los Angeles, Merced, Monterey, Napa, Nevada,
Orange, Placer, Riverside, San Bernardino, San Diego, Sajhn Francisco, San Joaquin, San Luis Obispo, San Mateo,
Santa Barbara, Santa Clara, Santa Cruz, Stanislaus, Ventura, Yolo

23
marijuana use problem). The caller then called the beneficiary access line assuming the role of
the person or an advocate of the person in the chosen scenario and measured the following: time
until call was answered (greater or less than 2 minutes), whether a person or automatic message
answered the call, and the total length of the call. If the call was dropped, the caller called the
number again after one minute. After the call, the caller rated the friendliness of the access line
worker on a ten-point scale, with ten representing the friendliest score. Lastly, the secret shopper
wrote notes on the qualitative experience of the call, noting irregularities or particular positives
or negatives.
Secret shopper calls are ongoing so that counties that have received feedback based on the first
round of three or more secret shopper calls will continue to get feedback based on future rounds
of three or more calls throughout the duration of the UCLA-ISAP evaluation.
County Administrator Survey
UCLA developed an online County Administrator Survey to obtain information and insights
from all SUD/behavioral health administrators (regardless of waiver opt-in status or intent). The
survey addresses the following topics: access to care; screening and placement practices; services
and training; quality of care; collaboration, coordination, and integration of services; and DMC-
ODS waiver implementation preparation/status. In CY 2019, UCLA conducted a follow-up
County Administrator Survey to track annual changes, collecting data from April 4 to May 15,
2019. Responses from 54 counties were received (93% response rate), including partially
completed surveys, and compared with baseline data collected in CY 2015. The survey took
about 37 minutes to complete. Throughout the report, these surveys are referred to as the CY
2019 and CY 2015 surveys, respectively. Items from the County Administrator Survey relevant
to access, quality, and coordination of care will be described in the pertinent report sections.
Key Informant Interviews
Key Informant Interviews were conducted with county administrators and SUD provider
programs administrators from counties participating in the DMC-ODS waiver to develop case
studies on topics of particular interest to DHCS. The semi-structured group interviews, which
were conducted via conference call, each lasted approximately one hour. The purpose of the
interviews was to deepen our understanding of promising models and practices (e.g.,
descriptions, challenges, keys to success) associated with newly billable services under the
DMC-ODS waiver (e.g., case management, recovery support services).
In addition, the case studies aimed to inform other counties’ and the State’s waiver
implementation efforts as well as the interpretation of the quantitative survey results and
administrative data for the waiver evaluation. Counties/providers were selected based on
available data/empirical evidence of successful outcomes or promising models/practices (e.g.,
Drug Medi-Cal claims, Performance Improvement Project results, TPS results, Provider Survey
results).
24
The case studies included:
Recovery Support Services: Peer Support Specialists (Riverside county)
Recovery Support Services: A Paradigm Shift (Santa Clara county)
Cross-system Care Coordination (Encompass treatment program/Santa Cruz county)
Transitions of Care from Withdrawal Management (Riverside county)
Delivering Case Management Services (Los Angeles County)
The interviews were conducted in June – July 2019 with county and/or provider administrators.
The recordings were transcribed and then written up as case studies, which were reviewed and
approved by the key informants. Supplemental materials were provided by the key informants
and are included in the appendices of this report.
Provider Survey
UCLA conducted web-based surveys of a selected sample of providers at the care delivery unit
level, defined as one treatment modality (outpatient/intensive outpatient, residential,
detoxification/withdrawal management) delivered at one physical location. Organizations that
had multiple sites or modalities were eligible to receive multiple surveys. The Provider Survey
was addressed to the clinical director of this unit, and respondents were offered a $100 gift card
for their time (39 minutes on average). The Provider Survey achieved a 40% response rate. For
simplicity, respondents are simply referred to as “providers” in this report.
Provider Surveys were sent to a representative sample of providers stratified by size, region, and
LOC. Providers were drawn from each county’s list of treatment programs participating in their
DMC-ODS waiver implementation, and surveys were administered following each county’s
individual Go Live date.
Data collection for this survey is ongoing, but preliminary results from analyses from the first 62
providers from 13 counties are included in this report.
Survey questions addressed different domains, including Access (e.g., treatment capacity),
Quality (e.g., ASAM criteria, evidence-based practices) and Coordination of Care (e.g.,
partnerships with other treatment providers, PH and MH care systems).
Integrated Practice Assessment Tool
To measure provider level of integration with MH and PH, questions from the Integrated
Practice Assessment (IPAT)7 tool were incorporated as a component within the Provider Survey.
The IPAT was developed to help place provider practices on levels of integrated care as defined
by the Standard Framework for Levels of Integrated Healthcare. The framework, released in
2013 by SAMHSA-HRSA Center for Integrated Health Solutions, identified three main
overarching categories — Coordinated care, Co-located care, and Integrated care – with two
levels within each category, producing a national standard of six levels of
7 https://www.integration.samhsa.gov/operations-administration/IPAT_v_2.0_FINAL.pdf

25
collaboration/integration ranging from Minimal Collaboration to Full Collaboration in a
Transformed/Merged Integrated Practice.
SAMHSA Framework for Levels of Integrated Healthcare
The IPAT uses a series of yes/no questions that cascade (like a decision tree) to one of the six
levels of integrated care. See Appendix C for IPAT questions and decision tree. Because this tool
was developed to assess integration of behavioral health in primary care settings, in this
evaluation it was necessary to adapt the IPAT questions to assess levels of integration for both
MH and PH services in SUD settings. Thus, completion of the Provider Survey results in two
IPAT ratings, one for each of the service systems pairings (SUD and MH, referred to as
Behavioral Health integration; SUD and PH, referred to as PH integration). The categories and
levels within each category are defined below (*note where the terms MH and primary care
were interchanged based on the pairing of the service systems under assessment):
Coordinated Care
Level 1: Minimal Collaboration: Communication between SUD providers and *primary
care (*replace: MH) providers is low and they operate in separate facilities with separate
systems. Patients are given referrals to MH with little follow-up.
Level 2: Basic Collaboration at a Distance: Periodic communication between providers
differentiates this level from the previous level, although physical and systems separation
is maintained. SUD and *primary care (*replace: MH) providers may communicate
occasionally about shared patients and view each other as resources in providing
coordinated care.
Co-Located Care
Level 3: Basic Collaboration On-site: Closer proximity due to co-location of SUD and
*primary care (*replace: MH) providers allows for more frequent communication about
shared patients. Providers may begin to feel like part of a larger team, and referrals are
more likely to be successful due to reduced distance between providers in the same
facility. However, SUD and *primary care (*replace: MH) systems are still kept separate.
Level 4: Close Collaboration On-site with Some System Integration: SUD and *primary
care (*replace: MH) providers begin to share some systems, leading to greater

26
integration. Increasing consultation and collaboration occurs between providers as they
learn each other’s roles and share information to help patients with multiple complex
behavioral health issues.
Integrated Care (also referred to as Fully Integrated Care)
Level 5: Close Collaboration Approaching an Integrated Practice: SUD and *primary
care (*replace: MH) providers communicate frequently and regularly and have started to
function more as a team, actively seeking solutions to integrate care for more of their
patients. Certain barriers still exist but work is being done to create a more fully
integrated system (such as through an integrated health record).
Level 6: Full Collaboration in a Transformed/Merged Integrated Practice: “Practice
change” defines this level; systems and people are blended together so that they operate
as one single practice and are recognized as such by both providers and patients. The
system applies principles of whole health in treating the entire patient population.
The numerical ordering of levels suggests that the higher the level of collaboration/integration
the more potential for positive impact on health outcomes and patient experience. This belief
remains a hypothesis and has not been empirically tested. However, the framework creates
concrete descriptions and benchmarks defining the various strategies to implement integrated
care. This framework allows organizations implementing integration to gauge their degree of
integration against acknowledged benchmarks and serves as a foundation for comparing
healthcare outcomes between integration levels.8 States can use this data to monitor progress
along the integration continuum, to conduct comparative analysis, to examine network readiness
for integration, to establish thresholds for differential reimbursement, or to tailor technical
assistance programs to a practice's needs. In addition, tools such as the IPAT help normalize the
process of moving along a continuum of integrated care and inspire the undertaking of system
transformation.9
Treatment Perceptions Survey (TPS)
The TPS for adults was developed by UCLA based on San Francisco County’s Treatment
Satisfaction Survey, and the TPS for youth was based on Los Angeles County’s Treatment
Perceptions Survey (Youth). (Both survey questionnaires include items from the Mental Health
Statistics Improvement Program, MHSIP.) Input on the survey development was solicited from
and provided by: DHCS; the Substance Abuse Prevention Treatment+ Committee (SAPT+) of
the County Behavioral Health Director’s Association (CBHDA) of California; the DMC-ODS
External Quality Review Organization (EQRO) Clinical Committee, Behavioral Health Concepts
(BHC); the Youth System of Care Evaluation Team at Azusa Pacific University; and other
stakeholders. The TPS was designed to serve multiple purposes. The first purpose is to fulfill
8 Heath B, Wise Romero P, and Reynolds K. (2013). A Standard Framework for Levels of Integrated Healthcare. Washington, D.C. SAMHSA-HRSA Center for Integrated Health Solutions. 9 Auxier, A. M., Hopkins, B. D., & Reins, A. E. (2015). Under Construction: One State's Approach to Creating Health Homes for Individuals with Serious Mental Illness. AIMS public health, 2(2), 163–182. doi:10.3934/publichealth.2015.2.163

27
counties’ EQRO requirement related to conducting a patient satisfaction survey at least annually
using a validated tool. The TPS also addresses the data collection needs for the CMS required
evaluation of the DMC-ODS waiver. Lastly, the TPS supports DMC-ODS quality improvement
efforts and provides key information on the impacts of the waiver.
The TPS is administered annually during a specified five-day survey period. The survey for
adults includes 14 statements addressing patient perceptions of access, quality, care coordination,
outcome, and general satisfaction. The survey for youth includes 18 statements and the same five
domains as the adult survey plus an additional domain, therapeutic alliance. Survey respondents
indicate the extent to which they disagree or agree with statements using a 5-point Likert scale
(1= Strongly disagree and 5= Strongly agree). The survey also collects demographic information
(i.e., gender, age, race/ethnicity, and length of time receiving services at the treatment program).
TPS Adult Survey Items by Domain
Access
1. The location was convenient (public transportation, distance, parking, etc.).
2. Services were available when I needed them.
Quality
3. I chose the treatment goals with my provider's help.
4. Staff gave me enough time in my treatment sessions.
5. Staff treated me with respect.
6. Staff spoke to me in a way I understood.
7. Staff were sensitive to my cultural background (race, religion, language, etc.).
Care Coordination
8. Staff here work with my PH care providers to support my wellness.
9. Staff here work with my MH care providers to support my wellness.
Outcome
10. As a direct result of the services I am receiving, I am better able to do things that I want
to do.
General Satisfaction
11. I felt welcomed here.
12. Overall, I am satisfied with the services I received.
13. I was able to get all the help/services that I needed.
14. I would recommend this agency to a friend or family member
TPS Youth Survey Items by Domain
Access

28
1. The location of services was convenient for me.
2. Services were available at times that were convenient for me.
3. I had a good experience enrolling in treatment.
Therapeutic Alliance
4. My counselor and I work on treatment goals together.
5. I feel my counselor took the time to listen to what I had to say.
6. I developed a positive, trusting relationship with my counselor.
7. I feel my counselor was sincerely interested in me and understood me.
8. I like my counselor here.
9. My counselor is capable of helping me.
Quality
10. I received the right services.
11. Staff treated me with respect.
12. Staff were sensitive to my cultural background (race/ethnicity, religion, language, etc.).
13. My counselor provided necessary services for my family.
Care Coordination
14. Staff here make sure that my health and emotional health needs are being met (physical
exams, depressed mood, etc.).
15. Staff here helped me with other issues and concerns I had related to legal/probation,
family and educational systems.
Outcome
16. As a result of the services I received, I am better able to do things I want to do.
General Satisfaction
17. Overall, I am satisfied with the services I received.
18. I would recommend the services to a friend who is need of similar help.
TPS survey forms for both adults and youth are available in 13 languages (English, Spanish,
Chinese, Tagalog, Farsi, Arabic, Russian, Hmong, Korean, Eastern Armenian, Western
Armenian, Vietnamese, Cambodian) and in one-page and two-page (larger font) versions. The
relevant MHSUD Information Notices, survey instructions, forms in multiple threshold
languages, and other materials (i.e., Frequently Asked Questions, TPS Codebook, sample county
and program summary reports) are available online at http://www.uclaisap.org/dmc-ods-
eval/html/client-treatment-perceptions-survey.html.
County administrators coordinated the survey administration and data collection within their
provider network and submitted the paper forms or electronic data files to UCLA for processing.
The data were analyzed and county- and provider-level summary reports were prepared and

29
made available to participating counties. Counties were also given access to their raw data files
and respondents’ written comments.
Seven First Wave counties participated in the first TPS survey period for adults in November
2017 (Contra Costa, Marin, Riverside, San Francisco, San Mateo, Santa Clara, and January 2018
for Los Angeles). During the second survey period in October 2018, 19 live waiver counties
participated in the TPS for adults, including the First and Second Wave counties: Alameda,
Contra Costa, Imperial, Los Angeles, Marin, Monterey, Napa, Nevada, Orange, Riverside, San
Bernardino, San Diego, San Francisco, San Joaquin, San Luis Obispo, San Mateo, Santa Clara,
Santa Cruz, and Yolo counties. Fourteen of these counties also administered the TPS survey for
youth for the first time. Programs included outpatient/intensive outpatient treatment, Residential
treatment, Opioid Treatment Programs / Narcotic Treatment Programs, and Withdrawal
Management standalone.
The analytic sample for the October 2018 TPS included 15,259 adult respondents and 669 youth
respondents. A summary of the data analysis results is included in this report within the Quality
section and in Appendix D. TPS results are also referenced and/or included in other relevant
waiver evaluation domains (i.e., Access and Coordination of Care) in this report. The next survey
period is October 7-11, 2019.
Analytic methods
Except where otherwise noted, this report focuses primarily on descriptive analyses. Due to the
size of California’s population, comparisons using inferential statistics on many of the datasets
used in this report would yield statistical significance even when these differences were small
and not meaningful. Furthermore, inferential statistics, as the name suggests, are meant to make
inferences about a population from a random sample taken from that population. However, many
of the datasets used in this evaluation (e.g., DMC claims, CalOMS-Tx, county administrator
surveys) represented data on essentially the population of interest rather than a random sample,
making descriptive statistics more appropriate.
Provider Surveys are an exception, since they are based on a random sample of treatment
providers, and future inferential statistics are planned for these surveys. Data collection is
ongoing, however, and the Provider Survey is not adequately powered for inferential statistics by
planned groupings (e.g., treatment modality) at this time. Early results from the partial survey
data are therefore also only conveyed descriptively for this report.
Another exception is that a special kind of Autoregressive Integrated Moving Average (ARIMA)
time-series model called Intervention Model or Interrupted Time Series Model was used on
DMC claims data to test the effect of the DMC-ODS Go Live date on the increase in number of
clients being provided with DMC-funded SUD treatment. The "Impulse Intervention" which
tests for a one-time event was used, which, in this case was the DMC-ODS Go Live date for each

30
county. The intervention is specified as 0 and 1, where the input variable has a value of 1 for all
months after the Go Live date and value of 0 for all months prior to it.
Methodological Limitations
The California Administrative data sets used in this evaluation have many of the same
shortcomings as other administrative data sets, particularly related to inconsistent reporting and
missing data (see for example Evans, et al, 2010 for a discussion of CalOMS-Tx). Delays in data
reporting also limit analyses of recent data. UCLA has attempted to address these issues by only
analyzing CalOMS-Tx data up to June 2018 and DMC claims data through December 2018 or
earlier (LA county data was analyzed through September 2018). Beyond these dates, the data
was not sufficiently complete to provide accurate counts.
CalOMS-Tx data is partly reliant on self-reported data, particularly with respect to outcome
questions (e.g., drug use in the last 30 days). Some terms are also somewhat subjective, such as
discharge status terms such as completed treatment, satisfactory progress, and unsatisfactory
progress. To partly ameliorate this problem, these categories were combined into “successful”
(completed, satisfactory progress) and “unsuccessful” (unsatisfactory progress) discharges.
CalOMS-Tx also shifted from being hosted on one data system to another during this reporting
period, resulting in some disruption of the data.
DMC Claims data tends to be more complete than CalOMS-Tx data, since providers are more
motivated to submit them quickly for payment, but this is not universally true. In some cases, it
appears billable services may be being delivered but DMC claims are not being submitted, in
part due to confusion over what is allowable.
ASAM Level of Care referral data was limited by incomplete data. As with any new data
collection system, there have been issues with the collection and submission of data due to a
variety of technical and human factors, and as a result, not all counties have reported data, and
data from the counties that have reported are not always reported for all people screened or
assessed. In particular, data from Los Angeles County was not available in time to be included in
these analyses, while Riverside County provided extensive data and is over-represented. The
results therefore may not necessarily be representative of the rest of the state. Development and
refinement of this new data source is ongoing.
Interview and survey data are limited by the honesty of respondents and the response rate.
Where possible, different types of data were examined in parallel in an attempt to converge on
underlying constructs being measured and thereby mitigate the limitations of each dataset.

31
Results

32
Access to Care
Patient Demographics
Table 1 shows CY 2018 demographic and LOC breakdowns for patients by county group.
Counties in the “Other” category tended to have higher percentages of Whites, youth, and
females compared to First and Second Wave counties, and they received a narrower selection of
levels of care since DMC-ODS benefits were not available to them.
Table 1. Demographics and services for First and Second Wave Counties - CY 2018
First Wave Second Wave Other Counties
N % N % N %
Race / Ethnicity
White 14,894 34.7% 12,873 41.9% 16,327 48.9%
Latino 16,508 38.4% 9,438 30.7% 9,208 27.6%
African-American 5,569 13.0% 3,118 10.1% 2,020 6.1%
Asian/Pac Islander 873 2.0% 610 2.0% 632 1.9%
Native American /
Alaskan Native 260 0.6% 221 0.7% 501 1.5%
Missing/Unknown 3,155 7.3% 2,050 6.7% 2,251 6.7%
Other 1,697 4.0% 2,412 7.9% 2,428 7.3%
Age Group
Youth (12-17) 2,451 5.7% 1,364 4.4% 3,143 9.3%
Adults (18-59) 39,248 91.4% 28,536 93.0% 29,588 87.9%
Older Adults (59+) 1,232 2.9% 794 2.6% 914 2.7%
Gender
Females 16,905 39.3% 12,669 41.2% 14,608 43.3%
Males 26,091 60.7% 18,057 58.8% 19,121 56.7%
Primary Language
English 40,399 94.0% 29,163 94.9% 31,272 92.7%
Spanish 1,865 4.3% 1,176 3.8% 1,487 4.4%
Other 732 1.7% 387 1.3% 971 2.9%
Level of Care
Outpatient 11,911 27.7% 11,008 35.8% 15,305 45.4%
Intensive Outpatient 2,473 5.8% 2,158 7.0% 1,147 3.4%
Narcotic Tx Pgm /
Opioid Tx Pgm 14,077 32.7% 14,409 46.9% 16,552 49.1%
Residential 3.1 9,434 21.9% 1,787 5.8% 552 1.6%
Residential 3.3 111 0.3% 0 0.0% 0 0.0%
Residential 3.5 2,847 6.6% 1,011 3.3% 80 0.2%
Withdrawal Mgmt 3.2 2,132 5.0% 353 1.1% 76 0.2%
Total 42,985 100.0% 30,726 100.0% 33,712 100.0%

33
Number of Patients Served
Figure 3 shows the number of patients that received DMC-ODS services before and after each
county’s Go Live date.
Figure 3. Unique number of patients receiving services before and after Go Live date by county.

34
There has been great variation between counties, with some increasing services immediately and
others showing little change. However, in at least 12 of the 19 cases, there was a clear increase in
the number of beneficiaries accessing DMC-ODS services following the county’s Go Live date.
Furthermore, this set of graphs shows that each county’s increases generally coincided with the
Go Live date specific to that county, which tends to rule out the alternative explanation that
broader changes external to DMC-ODS could have accounted for the difference.
Napa County in particular is an outlier in that billing dropped immediately following the
county’s Go Live date. According to Napa’s administrator, when Napa went live, finalizing
contracts and successfully obtaining DMC certification for all providers took a number of
months, but Napa was covering those services with County General Funds in the meantime.
Consistent with this, Napa’s CalOMS-Tx data does not show the same steep decrease in services
as the DMC claims data. As noted in last year’s evaluation report, a similar phenomenon
occurred in San Francisco, where services were also reportedly being provided, but not billed to
DMC.
For greater clarity of the overall trend, Figure 4 shows the same information aggregated over the
19 First and Second Wave counties.
Figure 4. Unique number of patients receiving services before and after Go Live date aggregated over First and Second Wave counties.
In order to quantify the effects of ODS Implementation Start Date, an ARIMA intervention
analysis was carried out. The intervention analysis attempts to quantify the influence of a
particular event in a time series, whose duration is known. In this case, the assumption is that
fewer clients received SUD services prior to county Go Live dates and a higher number of clients
received SUD services after.
-20.0%
0.0%
20.0%
-12 -11 -10 -9 -8 -7 -6 -5 -4 -3 -2 -1 0 +1 +2 +3 +4 +5
Months before / after Go Live Date
DMC-ODS Go Live

35
The least square regression coefficient for the intervention model for all counties combined that
went Live as of July 2018 showed a significant positive regression estimate of 141.2 (SE = 35.0),
p < .001. This meant that there was a significant increase in the number of clients being served
for SUD immediately after the DMC-ODS Go Live date in counties, analyzed in aggregate.
Analyzing the increase in CalOMS-Tx is an important next step to determine the degree to which
the increases represent an overall change in access, as opposed to people changing to Medi-Cal
from another funding source (e.g., the federal Substance Abuse Prevention and Treatment block
grant). Due to data reporting issues, this analysis was not available at the time of this report.
Stakeholder Perceptions: County Administrators
Consistent with the DMC claims results, county administrators overwhelmingly reported the
DMC-ODS waiver increased access to services in their county (85.7% in First Wave counties,
83.3% in Second Wave counties).
Stakeholder Perceptions: Patients
In the TPS, adult patients from live waivered counties were asked two items about access: “The
location was convenient (public transportation, distance, parking, etc.).” (84.5% agreement) and
“Services were available when I needed them.” (88.1% agreement). Youth agreement was
somewhat lower for these questions, but the majority of youth still agreed with these questions
(75.2% and 77.8% respectively). They also tended to agree with a question added for youth, “I
had a good experience enrolling in treatment.” (78.3% agreement). While the lower agreement
among youth compared to adults may have reflected lower availability of youth services, youth
ratings were also generally lower than adult ratings across all survey questions, not just the ones
pertaining to treatment access. For more information, see the full TPS report in Appendix D.
Beneficiary Access Line
Stakeholder Perceptions: County Administrators
County administrators reported the DMC-ODS waiver had facilitated either the establishment of
a beneficiary access line phone number or the addition of SUD services to an existing number
(91.7% in First Wave counties, 91.7% in Second Wave counties).
Secret Shopper Calls
For the 85 secret shopper calls completed in FY 2018-2019:
On average, secret shoppers rated the difficulty of finding beneficiary access line phone
numbers 8.5 out of 10, indicating it was fairly easy, though misleading non-county
websites in the search results prevented this rating from being higher.
For 24.7% of the calls, the wait time for an answer was over two minutes; for the rest it
was less than two minutes.
Beneficiary access line staff were rated as friendly, with an average score of 9.8 out of
ten.

36
Not surprisingly, as new beneficiary access lines and procedures are established and call volumes
increase, there are start-up challenges. UCLA-ISAP continues reaching out to individual counties
to provide individualized feedback and will continue to monitor beneficiary access line
functioning.
Misleading Non-County Websites
UCLA secret shoppers’ attempts to find beneficiary access line numbers
through Google searches were sometimes sidetracked by sites that looked
like county websites. One of these sites in particular has web pages set up
for the majority of California counties and touts being “state accredited”
on these pages. While this suggests a connection with DHCS, it in fact
refers to licensure of a call center by the state of Florida Department of
Agriculture and Consumer Services as a Substance Abuse Marketing Service Provider.10 The
license simply states that the marketing service “has paid the required fee.” The site also goes on
to say “We are also trying to refer you to treatment that believes in good treatment practice, not
rehabs that substitute an addiction with another dependency using medication . . . Medication can
be used but only for detox purposes.” These statements are in fact in a direct contradiction of
well-established evidence-based practices. To the extent these sites intercept people seeking
DMC-ODS services, they serve as a barrier to accessing the evidence-based MAT provided by
the waiver. It may be prudent for DHCS explore options to address the misleading statements on
these sites.
Penetration Rates
According to the most recently available (CY 2016-2017) NSDUH state estimates11 7.5% of
California’s 2017 age 12 and over population of 32,991,24212, or 2,474,343 had an SUD. Since
NSDUH is based on a household population, we applied an adjustment for the estimated 129,972
homeless persons in the state13 applying a 50.5% SUD estimate (for more information on this
adjustment, see UCLA’s 2018 DMC-ODS evaluation report14). This meant the household need
estimate was (32,991,242-129,972) x 7.5% = 2,464,595, while the homeless need estimate was
10 https://www.addicted.org/licensed-substance-abuse-marketing-service-provider.html 11 https://www.samhsa.gov/data/nsduh/state-reports-NSDUH-2017 12 http://www.dof.ca.gov/Forecasting/Demographics/projections/documents/P1_Age_1yr_interim.xlsx 13 https://www.usich.gov/homelessness-statistics/ca/ 14 Urada, D., Teruya, C., Antonini, V. P., Joshi, V., Padwa, H., Huang, D., Lee, A.B., Castro-Moino, K., & Tran, E. (2018). California Drug Medi-Cal Organized Delivery System, 2018 Evaluation Report. Los Angeles, CA: UCLA Integrated Substance Abuse Programs. Available at: http://uclaisap.org/dmc-ods-eval/assets/documents/2017-2018%20UCLA%20DMC-ODS%20Evaluation%20Report%2011192018.pdf

37
129,972 x 50.5% = 65,636. Adding these together produces 2,530,231. Dividing this by the age
12 and over population of 32,991,242 yields an SUD rate of 7.7%.15
This rate was applied to the average monthly number of Medi-Cal eligible beneficiaries in First-
and Second-Wave counties according to the California Medi-Cal Eligibility Data System
Monthly Extract File (6,891,262) to obtain a need estimate 6,891,262 x 7.7% = 530,627. In these
counties, an average of 34,376 patients per month received DMC-ODS services in 2018 in the
months after going live (or all 12 months for counties that went live in 2017), according to DMC
claims. This suggests a penetration rate of 34,376 / 530,627 = 6.5% based on the total Medi-Cal
eligible population across these waiver counties. The penetration rate in the First Wave counties
was 6.0%, up from the 4.3% rate estimated in the California DMC-ODS 2018 Evaluation Report.
This was in roughly equal parts due to an increase in patients served and a reduction in estimated
treatment need.
These penetration rates do not take into account people receiving treatment outside of the DMC-
ODS system (e.g., MAT occurring in primary care). Some counties have made a major effort in
these areas to complement their DMC-ODS system, so this penetration rate may somewhat
understate the true treatment penetration. True need may also be higher (and thus penetration
rates may be lower), since SUD rates are likely higher among the Med-Cal population than the
general population.16 More sophisticated calculation of penetration rates is possible, but is
unlikely to change the conclusion that rates overall are low.
While DMC penetration remained relatively low in California waiver counties, the same is also
true nationally. SAMHSA (2017) estimated that nationally 10.8% of people who needed SUD
specialty treatment actually received it. Importantly, SAMHSA also estimated that among the
people who did not receive treatment, 95.5% felt they did not need treatment.17 Assuming the
same pattern in California DMC-ODS waiver counties, this suggests 530,627-34,376 = 496,251
people needed treatment but did not get it, but only 496,251 x 4.5% = 22,331 of people who did
not receive treatment felt they needed it. Put differently, the penetration rate may have been
about 34,376 / (34,376 + 22,331) = 60.6% of Medi-Cal eligible patients who thought they needed
treatment. While this number is considerably higher, emphasizing it risks obscuring the need to
engage people who don’t think they need treatment.
Efforts to increase penetration rates can and should include expansion of SUD specialty care
capacity, but efforts to reach out to patients in other settings to engage patients who do not
currently recognize their need for treatment will be critically important to increase penetration
rates. This includes coordination with the MH and PH care systems, to be discussed in the
Coordination of Care section of this chapter.
15 We are applying the 2016-2017 NSDUH rate to 2018 data because it is the closest available NSDUH rate. 2018 data will not become available until late 2020. 16 Adelmann, P.K. (2003). Mental health and substance use disorders among Medicaid recipients: Prevalence estimates from two national surveys, Administration and Policy in Mental Health, 31(2). 17 Park‑Lee, E., Lipari, R.N., Hedden, S.L., Kroutil, L.A., Porter, J.D. (2017). Receipt of Services for Substance Use and Mental Health Issues among Adults: Results from the 2016 National Survey on Drug Use and Health https://www.samhsa.gov/data/sites/default/files/NSDUH-DR-FFR2-2016/NSDUH-DR-FFR2-2016.pdf

38
There are some signs that penetration rates may continue to improve incrementally. For example,
53.8% of providers indicated having plans to expand capacity in the next 12 months (e.g.,
increase their caseload, number of groups, or number of beds/treatment slots). On the other hand,
11.3% of providers cited “lack of demand” as a reason for not expanding capacity, and several
noted that they will expand if they reach capacity with comments such as, “If the need continues
to grow, we will propose additional expansion.”
Expansion Challenges
As in prior years, county administrators reported that medical detoxification/withdrawal
management (ASAM Levels 3.7 and 4.0) were the most challenging modality to expand. These
services are typically delivered in medical settings that are not under the control of the county
behavioral health administrator. Historically, challenges have also revolved around a
combination of difficulty in obtaining licensure and billing challenges. For a more in-depth
discussion of this recurring finding, see the CY 2017 and CY 2018 reports.18 Non-medical
detoxification/withdrawal management was rated as the next most challenging to expand,
suggesting withdrawal management in general continues to be a challenge.
In CY 2019, top challenges reported by treatment providers included a lack of qualified
individuals to fill their medical director position (42.0%) and Licensed Practitioner of the
Healing Arts (LPHA) positions (36.0%), difficulty finding bilingual or multilingual staff to
provide services in patients’ preferred languages (68.0%) and staff turnover (54.0%).
Top expansion-related requests for technical assistance included youth and co-occurring
disorders. For co-occurring disorders, “cross-training” was requested. For youth, requests
frequently centered around a need for technical assistance on youth assessment and evidence-
based practices. One comment was instructive on current challenges:
“We struggle with Youth residential treatment services. We don't have a provider in our
county or any neighboring counties. This appears to be a difficult treatment modality to
offer from a provider perspective since it is very difficult to fiscally maintain. We learned
that a provider . . . just announced closing its door after less than a year in business due to
lack of placements.”
Access to MAT
The percentage of patients in treatment with an opioid as their primary drug who received any
medications increased slightly overall from 65.5% to 67.1% in First Wave counties. Notably, use
of buprenorphine in SUD care settings nearly tripled from 2.6% in 2017 to 7.3% in 2018. In First
Wave Narcotic Treatment Program / Opioid Treatment Program settings buprenorphine use
increased from 1.6% to 4.4%. In Second Wave counties, use of any MAT increased from 58.4%
18 2018 report: http://uclaisap.org/dmc-ods-eval/assets/documents/2017-2018%20UCLA%20DMC-ODS%20Evaluation%20Report%2011192018.pdf see p.22-23. 2017 report http://uclaisap.org/dmc-ods-eval/assets/documents/DMC-ODS-Evaluation-Report-FY-2016-2017%20final.pdf see p. 15-16

39
to 62.9%, with increases in both methadone and buprenorphine. In Other counties, medications
remained relatively steady.
Table 2. Access to MAT among patients in treatment with an opioid as their primary drug
2017 2018
First
Wave Second
Wave
Other
Counties
First
Wave
Second
Wave
Other
Counties
Methadone 58.5% 56.3% 63.1% 57.5% 59.4% 61.5%
Buprenorphine 2.6% 1.5% 1.7% 7.3% 2.3% 3.0%
Other 4.4% 0.6% 0.4% 2.3% 1.1% 0.4%
Total 65.5% 58.4% 65.2% 67.1% 62.9% 64.9%
Stakeholder Perceptions: County Administrators
Most First Wave county administrators reported access to MAT improved in outpatient (57.1%)
and residential treatment (71.4%). In Second Wave counties, administrators also reported
improved access but to a lesser extent (33.3% outpatient, 41.7% residential).
In First Wave counties, 85.7% of administrators reported their Narcotic Treatment
Programs/Opioid Treatment Programs had experienced challenges billing DMC for non-
methadone MAT (e.g., buprenorphine, naltrexone). This percentage dropped to 45.5% in Second
Wave counties and compares to 20.7% in other counties.
Stakeholder Perceptions: Providers
Providers were asked to rate the acceptability of MAT with the question, “To you as a treatment
professional, how acceptable is the use of buprenorphine (Suboxone) and methadone as
treatment techniques for opioid use disorders?” (1= Completely unacceptable, 7= Very
acceptable). While most providers indicated it was acceptable, 7.2% of providers gave a rating of
3 or below, indicating the perseverance of a degree of professional stigma against MAT.
Access to Telehealth
A minority (16.1%) of surveyed providers indicated they use some form of telehealth, including
services by telephone. Telehealth counseling was provided by phone by 9.7% of providers, video
teleconferencing by 8.1% of providers, and mobile applications by 1.6% (one respondent).
Results for recovery coaching/monitoring and case management by telehealth were similar.
Among the ten responding treatment providers that reported using telehealth, 40.0% reported that
the DMC-ODS waiver had “significantly” influenced their use of telehealth. A lack of
training/knowledge was the most frequently indicated barrier (33.9%).

40
Access to Recovery Support Services
Stakeholder Perceptions: County Administrators
County administrators in First and Second Wave counties reported the DMC-ODS waiver had a
positive impact on the delivery of recovery support services in their counties (see Figure 5). They
also expressed appreciation for the new benefit and saw its potential value. Comments included:
“It’s a great opportunity.”
“Wide recognition of the value and potential for [recovery support services]”
“(the new benefit) Increased and improved the quality of recovery services provided to
clients”
Figure 5. Percentage of county administrators agreeing that the DMC-ODS waiver positively impacted the delivery of recovery support services in their county.
However, when asked to rate the degree to which recovery support services were being delivered
under the DMC-ODS waiver on a 5-point Likert scale (1= Still figuring it out; 5= Consistently
delivering and billing), average ratings from both First Wave counties (1.8) and Second Wave
counties (2.8) were closer to “still figuring it out” than to “consistently delivering and billing.”
Several counties commented that they were still developing or just starting their benefit. Several,
however, strongly expressed their wishes for greater clarity on the use of peers and billing more
generally. Comments included:
“The ability of providers to build out this component of the benefit has been challenging,
particularly with restrictions on use of peers.”
57.1%
63.6%
3.2%
0.0%
20.0%
40.0%
60.0%
80.0%
100.0%
First Wave Second Wave Others

41
“. . . [the lack of] understanding how billing will work is a problem to make it viable and
sustainable”
“. . . lots of questions linger about [recovery support] service model, and about what
pieces of this service peers can deliver under "substance use assistance"
“development/submission of Peer Recovery Support Plan to DHCS for review/approval -
still waiting for a response from DHCS.”
“We have not received answers to critical questions . . . about how to implement this
service.”
Consistent with these findings, 83.3% of First Wave county administrators and 40.0% of Second
Wave administrators reported wanting technical assistance for the delivery of recovery support
services. In open-ended responses, four counties mentioned wanting training around the use of
peers, including:
“Recommendations for, or actual development of, a standardized curriculum for peer
certification”
“How to do peer certification”
“Development of Peer Training Program; how to build capacity of a peer led/run non-
profit to be able to obtain and delivery RS as a managed care provider. We don't want to
undermine current provider, looking to support/sustain their work in future under DMC
ODS RS...but am interested in strategies for building their org capacity to operate as a
managed care health provider.
“We are especially interested in assistance on what qualifies a best practice training plan
for peers to be part of the recovery services delivery.”
Four mentioned a general need for technical assistance around billing and/or documentation, and
three mentioned general promising/best practices. Several expressed support for training more
broadly, with requests for “any and all” training on the topic, and “a practical understating and
idea of what recovery services are.”
UCLA discussed the apparent confusion surrounding recovery support services with DHCS staff.
Some of the responses reflect specific issues during the survey period that may now be out of
date. For example, Peer Recovery Support Plans submitted by counties have reportedly been
approved at the time of this report. Broader issues remain, however. DHCS emphasized that they
allow flexibility in an effort to encourage innovation. Questions from providers are generally
referred back to the counties, and DHCS staff stress that the counties have the authority to
provide decisions on whether a service is billable as long as the medically necessary service was
provided by a certified provider within the terms of the STCs and the intergovernmental
agreement (contract) between the state and county.
Beyond that, DHCS indicated that blanket allowances could not be provided to pre-approve
activities based on plan interpretations. Claims are “accepted or denied based on the services that
are actually provided and not based on interpretation of a stated plan.”

42
Taken together, a balanced approach is needed that stops short of a blanket allowance yet
provides guidance to counties in interpreting the STCs and contract terms. One interim solution
might involve compiling and providing descriptions of recovery support services practices that
have successfully been approved, as well as those that have not, with the understanding that
actual claim approval or denial depends on the exact details of the implementation. To the extent
this moves stakeholders toward a better mutual understanding of terms and leads to additional
discussions, it may facilitate the types of innovation being sought by all parties.
Stakeholder Perceptions: Providers
Respondents to the Provider Surveys reported varying frequencies of recovery support service
delivery. Overall the majority (61.2%) of providers reported delivering recovery support services
at least “Sometimes.”
Figure 6. Percentage of providers reporting they deliver recovery support services after discharge
Administrative Data
Based on the DMC claims data, recovery support service claims existed for only a very small
percentage of patients in treatment. Of those billing for recovery support services, 77.5% are
from First Wave counties with majority attached to outpatient services.
18.4% 20.4%24.5%
16.3%20.4%
0.0%
20.0%
40.0%
60.0%
80.0%
100.0%
Never Rarely Sometimes Often Always

43
Figure 7. Percentage of patients served for whom a claim for recovery support services is present, by Wave in CY 2018
Taken together, the data suggest providers may be delivering recovery support services, but they
are not billing DMC for them. This is consistent with a comment in the County Administrator
Survey saying, “We understand that there are some recovery support services occurring, but we
are not really seeing invoicing for this.”
Case studies from Riverside and Santa Clara (below) suggest that in spite of challenges,
successful delivery and billing for recovery support services is possible and is occurring. In
addition to these case studies, administrators responding to the County Administrator Survey
offered the following advice when asked what strategies have they used to deliver recovery
support services that they would recommend to other counties.
Setting clear expectations that this is a service that should be offered. Develop procedures
that make it seamless for the patient to access the service.
Developing a flow chart and a detailed process for service providers to use.
Utilizing peers to increase retention and engagement
2.5% 1.4%
0.0%
20.0%
40.0%
60.0%
80.0%
100.0%
First Wave Second Wave

44
Recovery Support Services: Peer Support Specialists – Case Study
Method: Qualitative Interview
Objective: To learn how one county utilized peer support specialists (PSS) to deliver Recovery
Support Services under the DMC-ODS waiver.
Organization/County: Riverside University Health System – Behavioral Health; Riverside
County
Interviewees: April Marier, LCSW, LAADC, Administrator Substance Abuse Prevention and
Treatment Program
William Harris, MPS, CCPS, CADC-II, Prevention Services Coordinator
Kristin Duffy, RADT-I, Senior Peer Support Specialist
Background: Riverside County developed and received approval in CY 2017 from DHCS for
its peer support specialist (PSS) program for use under the DMC-ODS waiver. Riverside is
among only a handful of counties that have been consistently providing and billing for recovery
support services.
Description: There is one PSS in almost all of the county-operated substance abuse clinics (one
of the clinics has two PSSs) and one in each of the two regional Care Coordination Teams and
Substance Abuse Treatment and Recovery Teams (START).19 PSS candidates who are not
already trained upon hiring receive 72 hours of intensive training (Peer Employment Training
provided by Recovery Innovations) over a two-week period. (See the appendices for the Training
Plan.) According to the County’s PSS Role and Duty Statement (see the appendices):
The PSS works as a member of the clinic/program team. The PSS brings unique experiences and
perspective as a consumer, and someone in recovery themselves. This Peer assists the team in the
development and provision of culturally competent and recovery oriented behavioral health/substance
abuse services. The Peer Support Specialist contributes their personal experience, appropriate self-
disclosure and empathy to support and engage with consumers of the agency.
The Peer Support Specialist also adds the consumer experience and perspective to the
development of programming, service delivery, formulation of treatment strategies, review of
program efficacy and recovery planning. The experience of having “walked the same path” as
other consumers while partnering with staff, enriches the culture of the agency and improves
program effectiveness.
19 The START program is an intensive case management team designed to decrease repeated admissions to Riverside County’s MH programs.

45
Patients receiving recovery support have both a PSS and a substance abuse counselor who is
responsible for ensuring that treatment plans and documentation are completed and for “guiding
the patient through their services”. According to one of the interviewees, the PSS does “most of
the one-on-one and group work with the consumer.” However, the PSS and counselor work
together to support the patients who may receive recovery support as long as they meet medical
necessity. One of the interviewees explained:
“We’ve had people show up at our door with 10 years clean but now they’re having
cravings….They’re at that stage where they could start using again, but they want that support
and they know that we provide after-care. We’ve enrolled them then. They had to have prior
treatment experience…but they wouldn’t meet the medical necessity for OT [outpatient
treatment], so we would then put them in recovery services.”
Challenges: According to interviewees, the biggest challenge is not being able to bill for the
majority of the peer services provided, although the services are still rendered. As one of the
interviewee’s explained, “That happens a lot where people just pop in to their office because
they’ve built that rapport with them and the consumer trusts them that they can just pop in there
and have a one-on-one, and it’s not billable.”
Keys to success:
Interviewees identified some of the keys to the success of their PSS program.
When asked about lessons learned with respect to the PSS program, an interviewee commented,
“Don’t hire peers cause of their lived experience. We hire peers because of their recovery from
their lived experience. They have to be the evidence that recovery is possible.”
At one of the clinics, peer specialists are included in orientation groups for patients entering
outpatient or intensive outpatient treatment so that “they start from day one building rapport and
meeting the patients and talking about recovery services.”
Peer specialists are also “formally integrated into our collaborative programs [i.e., drug court,
family preservation court] as the final phase” so there is an expectation that “you finish
outpatient, then you go to recovery services.”
Supplemental Materials (see Appendix E)
E1: PSS Role and Duty Statement Substance Abuse & Forensics Programs
E2: SAPT Peer Support Specialist Workflow
E3: SUD Peer Support Training Plan (March 2017)
Recommendation for DHCS Consideration Drawn from the Case Study
Allow counties with approved Peer Support Specialist Plans to deliver and bill for
recovery support services during the treatment episode to increase patient engagement
and rapport throughout the episode and encourage the use/continuing use of recovery
support services following discharge.

46
Recovery Support Services: A Paradigm Shift – Case Study
Method: Qualitative Interview
Objective: To learn how one county successfully launched the use the of the Recovery Support
Service benefit under the DMC-ODS waiver.
County/Organization: Alcohol, Drug, and Access Services, County of Santa Clara Health
System - Substance Use Treatment Services (SUTS)
Interviewees: Bruce Copley, Director of Alcohol, Drug, and Access Services
Kakoli Banerjee, PhD, Director, Research & Outcome Measurement
Tianna Nelson, PhD, LMFT, Division Director, Quality Improvement & Data
Support
Background: Building on the continuous relapse monitoring (CRM) work, Santa Clara County
has encouraged its provider network to continue to use such support and relapse prevention
services past treatment as part of recovery support services under the DMC-ODS waiver. The
county considers recovery support services as a way to “provide a much longer period of
engagement and connection” with patients, and aims to help patients see such services as a
resource that is ongoing. According to Drug Medi-Cal claims data, Santa Clara County is one
among only a handful of counties that have been consistently delivering and billing for recovery
support services under the waiver.
Description: In Santa Clara County, recovery support services has been added as a “level of
care” within the outpatient services side of its contracts with providers. Individuals are eligible to
step down to recovery support services if they are in remission or partial remission in the
broadest sense. For example, if someone has a history of having treatment in the county and
wants to “come back…and get a tune-up,” they can access recovery services as part of their
recovery plan, which for the most part has meant case management and group counseling. The
length of stay for recovery services in Santa Clara County is not prescribed but rather is “driven
by clinical consideration” and the philosophy of individualized treatment.
The County has deliberately taken a “relatively unstructured approach” to recovery support
services, and encourages providers to be creative and open to opportunities in working with
patients. Different providers offer different recovery support options (i.e., follow-up, alumni
group). The patient’s primary clinician develops a recovery plan for the patient upon discharge
and offers recovery services as part of that plan. The county gives providers “a lot of freedom in
terms of how [they] look at relapse prevention” and how they connect with patients (i.e., phone
call once a month, case management). Santa Clara County uses its monthly innovative
partnership meetings, routine meetings with the different modalities, and clinical supervisors

47
meetings as opportunities for providers to share their experiences and creative ways to provide
recovery services.
Challenges: The interviewees raised some of the challenges they have experienced and
discussed possible ways to overcome them.
Interviewees expressed that a constant challenge is “how do we have people not become
prescriptive in terms of how they provide services and do really individualized services?”
One strategy is to “continually ask…how is this individualized and how are you evolving
it over time as the person’s needs change?”
As recovery support services are available to patients following discharge from outpatient
services, the county’s largest LOC, interviewees expected that more patients would be
referred for these services, and wondered why they were not being referred. Interviewees
have heard anecdotally that patients are just not interested in continuing services after
discharge from outpatient treatment, and that “clients just want to be done with
treatment”. Interviewees discussed possible strategies for addressing this challenge,
including engaging with patients early on to develop clinical relationships;
“fram[ing]”recovery services as a benefit and the system as helping clients understand
what the journey to rehabilitation looks like;” and facilitating a “paradigm shift” among
patients as well as clinicians from older ideas of completion (i.e., graduation ceremonies)
to continued success by “celebrating the length of sobriety time.” This involves changing
the language both within the treatment system and beyond.
In working with the criminal justice system, the need for a paradigm shift is reflected in
the language used with respect to patients who are referred to treatment. One of the
interviewees explained that when patients go to court or see a probation officer, one of
the first questions they are asked is, “How close are you to completing treatment?” The
County has been working with the courts to build a common language and continues to
educate and inform new judges and probation officers about how the new system benefits
defendants more than the old system.
Recovery support services in Santa Clara County under the DMC-ODS waiver are much
broader and flexible in terms of how they can be developed and implemented, presenting
a unique challenge for providers. An interviewee mentioned that while there are “rules”
for the treatment side, “there are far fewer rules around recovery services,” which “drives
some of the hesitancy in using that particular modality”. Therefore, providers are
tentative about “stepping out of what is a comfort zone for billing.” However, the county
has been working with providers on this issue, and interviewees emphasized that “that’s
the refreshing aspect of recovery services. It leaves us open to really explore new ways to
engage and continue to support people.”
The county has also been having difficulty recruiting LPHAs, which puts additional
pressure on existing LPHAs who make the medical necessity determinations when they
have to review and sign off on recovery services plans as well. Interviewees wondered
whether a more “relaxed requirement for recovery services” (i.e., sign off by a certified
counselor or community worker) might facilitate the provision and use of such services.

48
Keys to Success: Interviewees indicated that training is really important given that recovery
support services are a “new concept.” Most of the providers (i.e., certified counselors, LPHAs)
have been trained in treatment and not necessarily in how to follow patients to provider aftercare.
recovery support services are outside of the old models of aftercare (i.e., twelve step meetings).
Providers need further training and education on recovery support services. Interviewees
suggested that statewide training in recovery support services would be very helpful.
Supplemental Materials (see Appendix F)
F1: Santa Clara County Recovery Services brief description (from the County’s Provider
Handbook)
F2: Continuous Recovery Monitoring (CRM) Call Record
Recommendations for DHCS Consideration Drawn from the Case Study
Provide statewide training on recovery support services.
Compile and make available a list of recovery support services being used around the
state as a resource of possible options to consider.
Consider allowing counties to create “soft guidelines” for providers around recovery
services (e.g. evaluate medical necessity for continued recovery support services at six
months).

49
Quality of Care
Quality Improvement Activities
Stakeholder Perceptions: County Administrators
In 2015, the majority of county administrators reported the DMC-ODS waiver had positively
impacted quality improvement activities in their counties (between 73% and 86%) in all three
groups.20 As shown in Figure 8, perceptions of the waiver’s impact largely remained the same in
First Wave counties between CY 2015 and CY 2019, increased somewhat in Second Wave
counties, and decreased in Other counties as their participation in the waiver failed to
materialize.
Figure 8. Percentage of county administrators agreeing that the DMC-ODS waiver positively impacted quality improvement activities in their county.
Survey comments from 22 county administrators described how various aspects of the DMC-
ODS waiver positively influenced their counties’ quality improvement activities. These included:
adding quality improvement staff in the department; clarifying the need to enhance electronic
health record (EHR) capabilities; increasing accountability for quantity, cost, quality and
timeliness of services; increasing oversight and understanding of contract provider service
delivery; improving measures; and weighing costs of services with quality of care and participant
well-being. A few comments also suggested how the DMC-ODS waiver may be having a
positive impact on non-waiver counties as well, with one administrator writing, “Although we
20 While it may seem surprising that this would be the case in the Other counties group had not gone Live as of July 2018, many counties in this group initially anticipated participating in the DMC-ODS waiver when asked in 2015.
2015 2019
First Wave 85.7% 85.7%
Second Wave 82.0% 100.0%
Others 72.7% 36.4%
0.0%
20.0%
40.0%
60.0%
80.0%
100.0%
First Wave Second Wave Others

50
are not in the waiver, it has highlighted the need for us to increase these activities in preparation
for DMC certification and the likely implementation of the waiver on a statewide basis.”
Establishment of Quality Improvement Committees and Plans
According to county administrators, all of the DMC-ODS waiver counties had a Quality
Improvement Committee, and nearly all had a quality improvement plan by 2019. The
percentage of Other counties with a plan also increased in the same four-year period, perhaps in
anticipation of DMC-ODS participation in the future.
Figure 9. Percentage of counties with a written SUD treatment quality improvement plan
Use of Evidence-Based Practices
Stakeholder Perceptions: County Administrators
Counties opting in to the DMC-ODS waiver are required to use two of the five evidence-based
practices listed in the STCs, which include trauma-informed treatment, motivational interviewing
(MI), cognitive-behavioral therapy (CBT), relapse prevention, and psycho-education. Responses
from the CY 2019 County Administrator Survey showed that at least 83% of both First and
Second Wave counties are using a combination of MI, CBT and relapse prevention. In addition,
at least 71% of First and Second Wave counties are using psycho-education and 71% of First
Wave counties are using trauma-informed treatment as compared to 67% of Second Wave
counties. Meanwhile, slightly more than half (51.9%) of providers reported that use of evidence-
based practices increased in preparation for the DMC-ODS waiver.
2015 2019
First Wave 85.7% 85.7%
Second Wave 0.0% 90.9%
Others 17.1% 48.5%
0.0%
20.0%
40.0%
60.0%
80.0%
100.0%
First Wave Second Wave Others
51
County administrators were also asked to rate how challenging it was to meet the evidence-based
practice requirement, and their ratings decreased slightly from CY 2015 to CY 2019 for both the
First and Second Wave counties. The requirement continued to be perceived as only somewhat
challenging (2.0 and 2.4, respectively, on a 5-point Likert scale, with a higher number indicating
more difficulty), suggesting counties have not found evidence-based practice requirements to be
overly difficult, and that meeting the requirements is getting easier over time.
Fidelity to Evidence-based Practices
While counties reported meeting the requirements for evidence-based practices, assessing
fidelity is another matter. Only slightly more than a quarter (28.6%) of the First Wave counties
and a little more than half (54.6%) of the Second Wave counties reported on the County
Administrator Survey that they assessed fidelity to these practices. Although systematic
assessments of fidelity exist that use audio recording, coding, and established tools like the
Motivational Interviewing Treatment Integrity (MITI) Code21 to assess fidelity using quantitative
methods, based on survey results, these types of methods do not appear to be in wide use.
Perhaps counties are not well-versed in these fidelity assessment methods or consider them to be
resource-intensive and/or not always practical to implement.
In addition, counties’ assessment tools and strategies appeared to vary widely. The following are
examples of how counties described their efforts to assess fidelity:
one county requires programs to document how they assess fidelity to the evidence-based
practices and then the county monitors providers’ adherence to their plans;
another county conducts chart reviews; and
a third county conducts periodic compliance reviews of each provider program/modality
via site visits and EHR documentation.
When asked to describe what technical assistance would help them implement evidence-based
practices, administrators in all three groups typically requested training on best practices for and
tools/measures to assess fidelity, highlighting an opportunity to improve the quality of care by
providing technical assistance on evidence-based practice fidelity assessment.
Use of American Society of Addiction Medicine (ASAM) Criteria-based tool(s) for Patient Placement and Assessment
The ASAM Criteria22 provides a common standard for assessing patient needs, improving
placement decisions, and documenting the appropriateness of placement. They facilitate the
appropriate matching of a patient’s severity of SUD illness along six dimensions with levels
along a continuum of SUD treatment. While use of an ASAM-based assessment is a requirement
21 Moyers, T.B., Martin, T., Manuel, J.K., Hendrickson, S.M.L., & Miller, W.R. (2005). Assessing competence in the use of motivational interviewing, Journal of Substance Abuse Treatment, 28, 19–26 22 Mee-Lee D, Shulman GD, Fishman MJ, Gastfriend DR, Miller MM, eds. (2013). The ASAM Criteria: Treatment
Criteria for Addictive, Substance-Related, and Co-Occurring Conditions. 3rd ed. Carson City, NV: The Change
Companies

52
under the DMC-ODS waiver, counties have discretion over which ASAM Criteria-based
assessment tools best meet their needs.
Use of ASAM Criteria-based Assessments
As expected, all of the First and Second Wave County Administrator Survey respondents
reported using an ASAM Criteria-based tool to assess patients. Surprisingly, 64.5% of the Other
counties also reported using such tools, which suggests the DMC-ODS waiver influenced the use
of ASAM Criteria-based assessments beyond the counties that have gone live. A few
administrators from counties that had not yet gone live also indicated they are working on
transitioning to ASAM assessments. The majority (64%) of providers reported the DMC-ODS
waiver influenced the use of their ASAM Criteria-based tool “significantly (primary influence).”
A slightly higher percentage of First Wave county administrators reported using an ASAM
Criteria-based assessment and screening tool specific to youth at 85.7% compared to 80.0% of
administrators among Second Wave counties.
Respondents to the Provider Survey reported that they assess patients using an ASAM Criteria-
based tool for new patient intake (77.4%), transitions from another LOC (64.5%), and discharge
or transition to another LOC (59.7%). Providers also reported using this tool every 90 days while
the client was in treatment (40.3%), when a significant event required a new treatment plan
(40.3%), or at other intervals (19.4%). As shown in Figure 10, nearly a third of providers
typically reassessed patients to develop treatment plans, suggesting a substantial proportion of
patients are being subjected to two lengthy and very similar assessments in quick succession.
Figure 10. Treatment program responses to “When a client transfers to your treatment program from another LOC or from an external assessment center, is the ASAM criteria assessment information from these sources used in treatment planning?”
19.2%
48.1%
32.7%
0.0%
20.0%
40.0%
60.0%
80.0%
100.0%
Not applicable-the CDU doesnot typically receive ASAM
criteria assessmentinformation from outside
sources
Yes, this information istypically used for treatment
planning
No, clients are typicallyreassessed in order to develop
a treatment plan
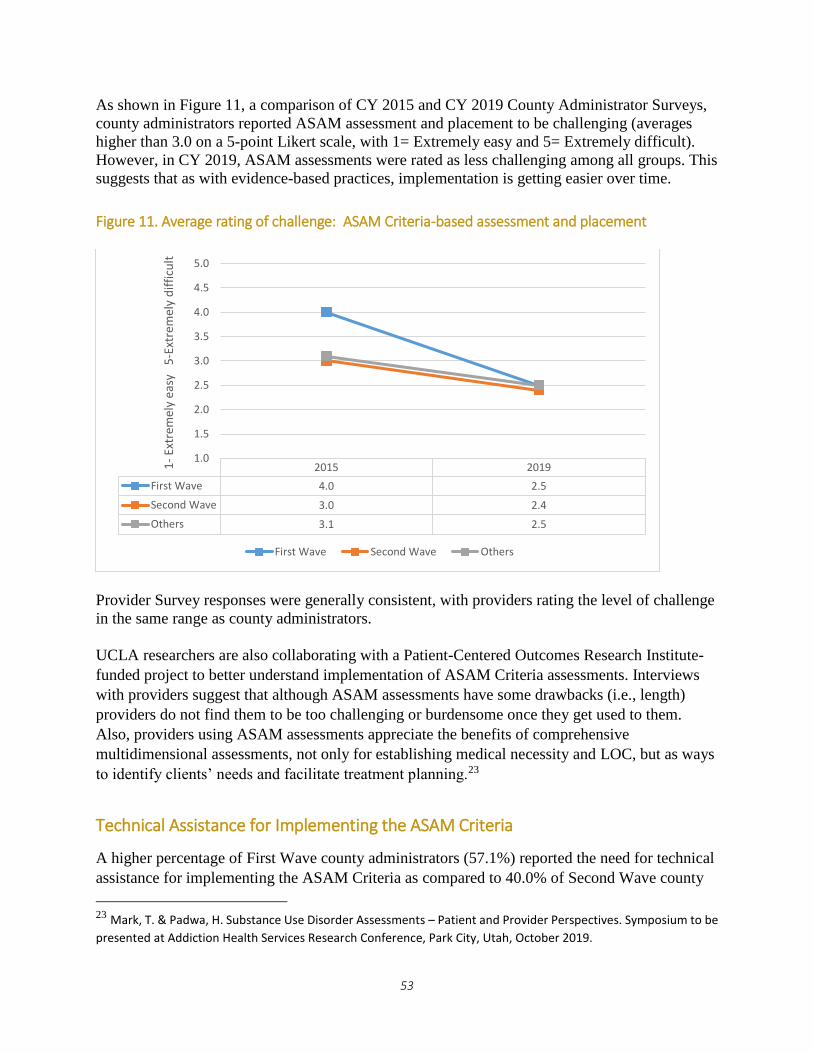
53
As shown in Figure 11, a comparison of CY 2015 and CY 2019 County Administrator Surveys,
county administrators reported ASAM assessment and placement to be challenging (averages
higher than 3.0 on a 5-point Likert scale, with 1= Extremely easy and 5= Extremely difficult).
However, in CY 2019, ASAM assessments were rated as less challenging among all groups. This
suggests that as with evidence-based practices, implementation is getting easier over time.
Figure 11. Average rating of challenge: ASAM Criteria-based assessment and placement
Provider Survey responses were generally consistent, with providers rating the level of challenge
in the same range as county administrators.
UCLA researchers are also collaborating with a Patient-Centered Outcomes Research Institute-
funded project to better understand implementation of ASAM Criteria assessments. Interviews
with providers suggest that although ASAM assessments have some drawbacks (i.e., length)
providers do not find them to be too challenging or burdensome once they get used to them.
Also, providers using ASAM assessments appreciate the benefits of comprehensive
multidimensional assessments, not only for establishing medical necessity and LOC, but as ways
to identify clients’ needs and facilitate treatment planning.23
Technical Assistance for Implementing the ASAM Criteria
A higher percentage of First Wave county administrators (57.1%) reported the need for technical
assistance for implementing the ASAM Criteria as compared to 40.0% of Second Wave county
23 Mark, T. & Padwa, H. Substance Use Disorder Assessments – Patient and Provider Perspectives. Symposium to be
presented at Addiction Health Services Research Conference, Park City, Utah, October 2019.
2015 2019
First Wave 4.0 2.5
Second Wave 3.0 2.4
Others 3.1 2.5
1.0
1.5
2.0
2.5
3.0
3.5
4.0
4.5
5.0
1-
Extr
emel
y ea
sy
5-E
xtre
mel
y d
iffi
cult
First Wave Second Wave Others
54
administrators on the CY 2019 County Administrator Survey. One of the difficulties reported by
counties in completing ASAM assessments included integrating it with their EHR systems. Since
a higher percentage of First Wave counties use their EHR for ASAM assessments, their need for
technical assistance may also be related to their need for integrating ASAM into their electronic
databases.
County administrators in all three groups of counties requested technical assistance in using the
ASAM Criteria to do treatment planning (including documentation). Other requests included:
access to coaching resources (e.g., “getting the severity number to match the assessment notes,”
“inter-rater reliability for county developed ASAM tools,” “reassessment”), assessment tools
(e.g., “universal assessment format,” “youth assessment,” “State-approved ASAM based tools”),
and training (“need continual refresh of A, B, and C trainings,” “train providers to actually
determine appropriate level of care – not just affirm that clients belong in our EHR”).
Fidelity to the ASAM Criteria
When counties were surveyed about whether they assess fidelity to the ASAM, a higher
percentage of First Wave county administrators (85.7%) reported they assess fidelity to the
ASAM Criteria compared to only 30.0% of Second Wave and 35.0% of the Other counties.
Strategies used by counties to assess fidelity varied according to county administrators. Many
mentioned “review” of assessments, but did not include details of what that entails. Examples of
comments include:
“Review of claims data, client data for duration of services by level of care, focus groups,
care coordination.”
“This is in the early phases and largely dependent on the QI-UM [Quality Improvement-
Utilization Management] team during the service authorization process”
“UR [Utilization Review] specialists review assessments for all admissions to DMC-ODS
services, which includes a review of application of ASAM criteria.”
“Reviewing ASAM assessments at residential authorization process, as well as at
monthly and annual reviews.”
“We have our expert staff review all ASAMs submitted with a request for residential
and/or withdrawal management services.”
Further exploration of ASAM Criteria fidelity assessments would be helpful to better understand
counties’ current practices.
A higher percentage of Second Wave counties at 80.0% reported the need for technical
assistance to assess fidelity to the ASAM Criteria as compared to First Wave counties at 71.4%.
A handful of county administrators commented they would like “anything,” and are “open to
suggestions,” while others were more specifically interested in instruments/tools and inter-rater
reliability. It is recommended that technical assistance, including tools and guidance on assessing
fidelity to the ASAM Criteria, be provided to ensure consistency across providers and counties
and to maximize the use of best practices to improve the quality of care and patient outcomes.

55
ASAM Level of Care Placement Data
Since the ASAM Criteria are a defining feature of the DMC-ODS waiver, counties are required
to collect and submit LOC placement data to DHCS. Some counties have been experiencing
technical issues in data collection/submission, but data was collected and analyzed for 13 of the
19 First and Second Wave counties (Contra Costa, Imperial, Marin, Monterey, Napa, Nevada,
Orange, Placer, Riverside, San Francisco, San Joaquin, San Luis Obispo, and Santa Clara). The
majority of the ASAM LOC placement data for CY 2018 was for initial assessments (71.1%).
There were substantially less data for brief initial screenings (9.7%) and follow-up assessments
(19.2%). All counties conduct initial assessments, but not all conduct brief initial screenings, and
not all patients receive a follow-up assessment (e.g., people who drop out of treatment early).
The distribution of the types of screenings/assessments is consistent with these practices, but it is
unclear to what extent, if any, data collection challenges may also bias these numbers.
Difference between indicated and LOC placement decision
As shown in Figure 12, most treatment referrals (84.7%) were made to the same LOC indicated
by the screening/assessment, particularly at the initial assessment and follow-up assessment, and
less so at the brief initial screening. When the actual placement decision could not be confirmed
to match the indicated LOC, it was generally because the actual placement decision was missing
(e.g., a match may have actually occurred but the data were missing).24
Figure 12. Percentage of clients for whom indicated LOC and placement decision matched
24 This information was missing 24.8% of the time for Brief Initial Screenings, 5.1% of the time for Initial
Assessments, and 2.8% of the time for Follow-up Assessments.
64.2%
87.4% 85.0% 84.7%
0.0%
20.0%
40.0%
60.0%
80.0%
100.0%
Brief Screening Initial Assessment Follow-Up Assessment Total

56
Reasons for the difference between indicated LOC and LOC placement decision
As shown in Table 3, the reasons for the indicated and actual LOC not matching (excluding
cases where the reason for the difference was missing) differed depending on the type of
assessment. At the brief initial screening, the reason with the highest percentage was patient
preference (50.2%), followed by other reasons (e.g., “Client is ordered through CPS [Child
Protective Services] to complete Family Ties program,” “Client reported that he is attending to
training school Monday to Friday 8 am to 2:30 pm and he is not allowed to miss days;” 22.0%),
clinical judgement (13.5%), unavailable LOC (7.3%), legal issues (4.0%), and geographic
accessibility and family responsibility both at 0.9%. In contrast, among initial assessments, the
most common reason for the difference between indicated and actual LOC placement was
clinical judgement (32.0%), followed by patient preference (27.6%), other reasons (23.9%), legal
issues (9.1%), lack of insurance (0.7%), and family responsibility and geographic accessibility
both at 0.2%. The reasons among the follow-up assessments were somewhat similar to the brief
initial screening in that the most recurrent reason was patient preference (43.5%), followed by
other reasons (22.6%), clinical judgement (18.9%), unavailability of LOC (7.0%), legal issues
(5.5%), lack of insurance (i.e., some potential patients/patients may not have been eligible for
Medi-Cal but were included in counties’ reporting; 1.1%), and family responsibility and
geographic accessibility both at 0.6%. The adjustments to the LOC based on patient preference,
especially at the brief initial screening early on while the prospective patient is motivated to seek
treatment may be a reflection of patient engagement and patient-centered care. As
counselors/clinicians are more apt to conduct full ASAM Criteria-based assessments than brief
initial screenings, the higher percentage for clinical judgement as the reason for difference is not
surprising.
Table 3. Reasons for difference in LOC
Brief initial screening Initial assessment Follow-up assessment
Patient preference 50.2% 27.6% 43.5%
Clinical judgment 13.5% 32.0% 18.9%
Family responsibility 0.9% 0.2% 0.6%
Geographic accessibility 0.9% 0.2% 0.6%
Lack of insurance 1.3% 0.7% 1.1%
Legal issues 4.0% 9.1% 5.5%
LOC not available 7.3% 6.4% 7.0%
Other 22.0% 23.9% 22.6%
Preliminary ASAM LOC data suggest that more technical assistance may be needed to decrease
the amount of data missing on the reason for difference, especially for brief initial screenings and
initial assessments. As one of the aims under the DMC-ODS waiver is to expand access to SUD
care, it was notable that the unavailability of LOC for screening and assessments was relatively
low, ranging from 6.4% to 7.3%, and geographic accessibility was at less than 1%.

57
In addition, patients whose indicated and placement decision LOCs matched had a positive
discharge status (completed treatment or left with satisfactory progress) 64.9% of the time
compared to patients whose LOCs did not match (63.0%).
It is important to keep in mind that the above ASAM LOC data analyses are preliminary. The
analyses were conducted on data from 13 counties that had submitted LOC placement data in
time for this report. However, these analyses do provide an early snapshot of screening and
ASAM Criteria-based assessment under the DMC-ODS waiver and suggest a need for technical
assistance in terms of collection and submission of ASAM LOC data (i.e., missing data).
Receipt of SUD treatment services following ASAM Criteria-based screening/assessment
Although the indicated LOC and placement decisions had a high match rate, patients who were
screened or assessed did not always successfully navigate the next step by actually receiving
treatment at the provider to which they were referred. To measure the success rate of this step,
DMC claims data for CY 2018 were used.
Overall, 72.3% of patients who were screened, assessed initially, or followed-up with actually
received treatment in the LOC that they were referred to within 30 days. (See Figure 13.)
However, rates were substantially lower for brief initial screenings. These types of screening
often occur over the phone, so it is not surprising that rates are lower compared to initial
assessments or follow-up assessments that tend to occur at a treatment provider, where it is easier
to immediately begin treatment (or continue it, if appropriate, in the case of follow-up
assessments).
Figure 13. SUD treatment received after ASAM assessment
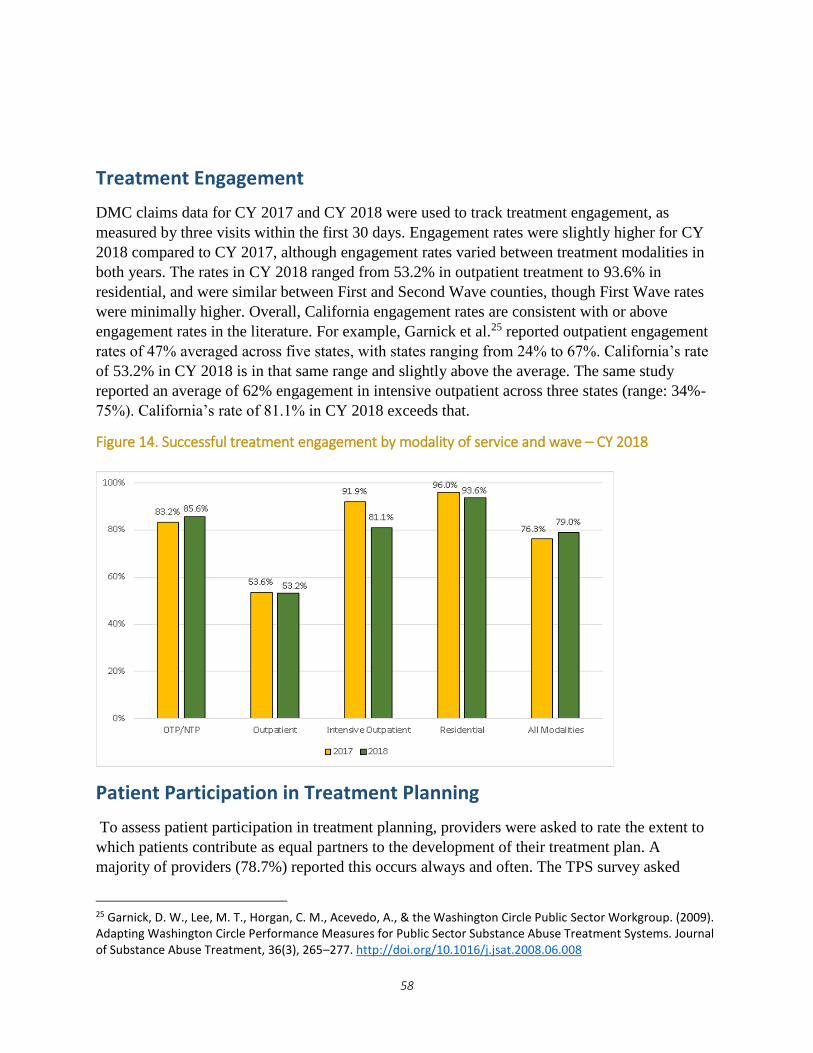
58
Treatment Engagement
DMC claims data for CY 2017 and CY 2018 were used to track treatment engagement, as
measured by three visits within the first 30 days. Engagement rates were slightly higher for CY
2018 compared to CY 2017, although engagement rates varied between treatment modalities in
both years. The rates in CY 2018 ranged from 53.2% in outpatient treatment to 93.6% in
residential, and were similar between First and Second Wave counties, though First Wave rates
were minimally higher. Overall, California engagement rates are consistent with or above
engagement rates in the literature. For example, Garnick et al.25 reported outpatient engagement
rates of 47% averaged across five states, with states ranging from 24% to 67%. California’s rate
of 53.2% in CY 2018 is in that same range and slightly above the average. The same study
reported an average of 62% engagement in intensive outpatient across three states (range: 34%-
75%). California’s rate of 81.1% in CY 2018 exceeds that.
Figure 14. Successful treatment engagement by modality of service and wave – CY 2018
Patient Participation in Treatment Planning
To assess patient participation in treatment planning, providers were asked to rate the extent to
which patients contribute as equal partners to the development of their treatment plan. A
majority of providers (78.7%) reported this occurs always and often. The TPS survey asked
25 Garnick, D. W., Lee, M. T., Horgan, C. M., Acevedo, A., & the Washington Circle Public Sector Workgroup. (2009). Adapting Washington Circle Performance Measures for Public Sector Substance Abuse Treatment Systems. Journal of Substance Abuse Treatment, 36(3), 265–277. http://doi.org/10.1016/j.jsat.2008.06.008

59
patients how much they agreed with the statement: “I chose the treatment goals with my
provider's help.” Patient respondents reported an 87.2% agreement rate on the item. Both data
points show a positive indication that patients are participating in their treatment planning
process.
Readmissions to Withdrawal Management
According to DMC claims data for CY 2018, overall, there were 4,714 patients with withdrawal
management episodes. Among this group, 86.2% (n=4,064) had only one episode, whereas
13.8% had at least one more episode within 14 days of discharge from the first. An additional
5.5% of the patients with multiple episodes returned for additional withdrawal management
services within 30 days, and another 11.6% (547/4,714) returned within 90 days.
Patients’ Perceptions of Care/Satisfaction with SUD Treatment
Services: The Treatment Perceptions Survey (TPS)
Patients’ perceptions of care/satisfaction with the SUD services they are receiving are essential
in assessing the quality of care and informing efforts to improve such care, as they may be
associated with treatment outcomes26, 27, 28, 29 (See Appendix D for the TPS statewide report and
the TPS section in the Methodology section of this report.)
TPS Forms Returned and Response Rates
In the CY 2018 survey period a total of 15,928 TPS forms were received from 19 participating
counties from both adults and youth. Adults accounted for the majority of the survey forms at
96% (n = 15,259), and youth accounted for 4% (n= 669).
All seven counties in the First Wave returned adult (n = 9,123) and youth forms (n = 389) for a
total of 9,512 surveys. Among the Second Wave counties, all twelve counties returned adult
forms (n = 6,136) and seven counties returned youth forms (n = 280) for a total of 6,416 forms.
The overall response rate for all adult and youth surveys was high at 60.9%. The response rate
was calculated as the number of surveys received divided by the number of patients that received
services during the survey period as reflected in the administrative DMC claims database. If
programs collected TPS forms from non-Medi-Cal beneficiaries, this may have inflated the rate.
However, according to CalOMS-Tx data, 32.6% of patients were not Medi-Cal beneficiaries in
26 Carlson, M. J., & Gabriel, R. M. (2001). Patient satisfaction, use of services, and one-year outcomes in publicly
funded substance abuse treatment. Psychiatric Services, 52(9), 1230-6. 27 Garnick, D. W., Lee, M. T., Horgan, C. M., Acevedo, A., & the Washington Circle Public Sector Workgroup. (2009). Adapting Washington Circle Performance Measures for Public Sector Substance Abuse Treatment Systems. Journal of Substance Abuse Treatment, 36(3), 265–277. 28 Shafer, A., & Ang, R. (2018). The mental health statistics improvement program (MHSIP) adult consumer satisfaction survey factor structure and relation to external criteria. Journal of Behavioral Health Services and Research 29 Zhang, Z., Gerstein, D. R., & Friedmann, P.D. (2008). Patient satisfaction and sustained outcomes of drug abuse
treatment. Journal of Health Psychology, 13(2), 388-400.

60
CY 2018. Therefore, even if we conservatively assume this percentage of TPS respondents were
non-Medi-Cal beneficiaries and exclude them from the numerator in the response rate
calculation, the response rate would be 41.0%, about double the response rate for the 2017 MH
adult consumer perception survey (20.4%).30
The highest percentage of adult survey forms was received from respondents in Narcotic
Treatment Programs / Opioid Treatment Programs (38.5%), followed by outpatient/intensive
outpatient programs (37.8%) and residential programs (21.9%), as compared to standalone
withdrawal management programs (1.6%). In contrast, the vast majority of surveys from youth
respondents (91.0%) were returned from outpatient/intensive outpatient/partial hospitalization
programs, while only 9.0% of surveys were returned from residential programs.
Demographics
A higher percentage of adult survey respondents identified as male (56.6%); 37.6% identified as
female; and 1.1% identified as transgender or other gender identity. Similarly, among youth
survey respondents a higher percentage identified as male (58.3%); 24.4% identified as female;
and 11.9% identified as transgender or other gender identity.
While the gender distribution was quite similar among adult surveys between First and Second
Wave counties, a higher percentage of youth (67%) identified as male in the Second Wave as
compared to 51.9% in the First Wave counties. A higher percentage of Youth surveys (24.5%)
identified as transgender or other gender identity among the First Wave counties as compared to
only 0.4% among the Second Wave counties.
By race/ethnicity, the highest percentage of adult survey respondents identified as White
(40.6%), followed by Latino (32.5%), and the lowest percentage identified as Asian and Native
Hawaiian/Pacific Islander (4.1%). Among youth survey respondents, the highest percentage
identified as Latino (59.3%), followed by African American (16.0%), and the lowest percentage
identified as American Indian/Alaska Native and Native Hawaiian/Pacific Islander (4.7%).
Nearly 97% of the adult survey forms were returned in English (n = 14,774) and 3.2% were
returned in Spanish (n = 483). Similarly, 98.6% of the youth survey forms were returned in
English (n = 660) and 1.4% were returned in Spanish (n = 9).
Average perceptions of care/satisfaction score by treatment setting
Survey respondents used a 5-point Likert scale (strongly disagree to strongly agree) scale where
higher numbers indicated more positive perceptions of care/satisfaction.
Adults
Average scores were similar between First and Second Wave counties. The average score among
both First and Second Wave counties was 4.4 for Narcotic Treatment Programs / Opioid
Treatment Programs and 4.3 for residential.
30 https://caleqro.com/data/MH/Reports%20and%20Summaries/Fiscal%20Year%202017-2018%20Reports/CalEQRO%20Statewide%20Annual%20Report%20FY%2017-18.pdf

61
Youth
Among youth respondents, the highest average score was 4.2 across outpatient/intensive
outpatient/partial hospitalization and residential settings for both Waves of counties. The overall
average score for residential settings across both Waves was 3.9, with a higher average score of
4.1 for First Wave and 3.6 for Second Wave counties. The findings suggest youth respondents
perceived there is room for improvement particularly in residential settings. However, based on
the results of the First Wave counties, which have been implementing the waiver for a longer
period, the scores of the Second Wave counties may improve over time.
Percent in agreement for each survey item by domain
Adults
As shown in Figure 15, the percent of responses in agreement for all of the 14 survey items was
at least 81%, indicating overall favorable perceptions of care among adults. The two questions
with the highest agreement (94.8% for “staff treated me with respect” and 94.8% for “staff spoke
to me in a way I understood”) were in the Quality domain. The two lowest (82.6% for “staff here
work with my PH care providers to support my wellness” and 81.7% for “staff here work with
my MH care providers to support my wellness) were in the Care Coordination domain.
Figure 15. Percent in agreement for each survey item by domain – Adults
Youth
Among youth respondents, the percent of responses in agreement for each of the 18 survey items
was at least 72.8%. Both the highest and lowest response percentages in agreement were
84.5% 88.1% 87.2%90.7% 91.7% 93.2% 88.8%
83.… 82.0%86.5%
92.9% 90.6% 86.6%90.1%
0.0%
20.0%
40.0%
60.0%
80.0%
100.0%
Access Quality Care Cordination Outcome General Satisfaction

62
observed in the Quality domain: 92.6% of respondents agreed with “staff treated me with
respect,” while 72.8% of respondents agreed with “my counselor provided necessary services for
my family.”
Figure 16. Percent in agreement for each survey item by domain – Youth
Average perceptions of care/satisfaction score by domain
Overall among all adults, all domains were rated high (4.3-4.5), while among youth they ranged
from 4.0-4.3. Among both age groups, First and Second Wave scores were very similar, with
First Wave scores generally rating 0.1 point higher. The CY 2018 average scores among the First
Wave counties were essentially the same as during the CY 2017 survey period, suggesting
stability in patient perceptions over time.
In summary, overall average scores across all counties for adults were at least 4.3, which
suggests that patients generally had positive perceptions of the care they were receiving.
Similarly, average scores across all counties for youth were at least 4.0.
While at the statewide level wide variation was not evident in the average perceptions of
care/satisfaction scores, slightly more variation was observed at the county level, with more
diversity at the provider level and by survey item. As part of the evaluation, counties received
their own county- and provider-level summary reports as well as their raw data and patient
comments to help inform their quality improvement efforts. (Sample TPS reports are available
on the TPS website at http://uclaisap.org/dmc-ods-eval/html/client-treatment-perceptions-
survey.html.)
75.2%77.8%78.3% 77.5%80.3%
90.0%
71.6%81.9%85.3%83.6%
88.2%84.9% 88.9%78.6% 81.8%
75.2%81.3%77.2%
0.00%
20.00%
40.00%
60.00%
80.00%
100.00%
Access Quality Therapeutic Alliance Care Coordination Outcome General Satisfaction

63
Use of Client Perceptions of Care/satisfaction for Quality Improvement
A higher percentage of First Wave county administrators reported on the 2019 County
Administrator Survey that they used TPS results for quality improvement purposes (86%)
compared to Second Wave counties (73%). In addition, a higher percentage of First Wave
counties as compared to Second Wave counties reported they used the TPS for quality
improvement planning (100% vs. 50%), feedback to individual providers (83% vs. 37%), and re-
allocation of resources (17% vs. 12%). A few county administrators indicated they used the TPS
data to inform performance improvement projects. Based on the greater use of TPS data in First
Wave counties, the number of Second Wave counties reporting use of TPS results for quality
improvement purposes may increase over time.
Preliminary data from the Provider Survey showed early indications of a pattern consistent with
the counties in that the majority of providers (86.8%) reported that they collect patient
satisfaction or perceptions data (e.g. surveys, focus groups) and use it to improve services.

64
Integration and Coordination of Care
The term “integration” is widely and inconsistently used to describe the bringing together of
healthcare components. Coordination of care is defined here as the deliberate organization of
patient care and communication among all the participants responsible for a patient's care.31 One
of the goals of the DMC-ODS waiver is to improve the coordination and integration of SUD
treatment services with PH and MH services.
Monitoring progress toward achieving a more integrated and coordinated SUD system of care
was conducted using results from the County Administrator Survey, Provider Survey, TPS,
CalOMS-Tx, and DMC claims data. Results are organized to describe 1) progress of integration
of MH and PH with SUD (across the health care systems), 2) coordination and continuity of care
within the SUD system, and 3) utilization and impact of the case management benefit. Case
studies to explore processes and promising practices were conducted on the following system
components: care coordination, case management, and transition of care.
Coordinating/Integrating Care across the Health Care System
Stakeholder Perceptions: County Administrators
General rating of integrated services
SUD county administrators were asked broadly to rate the degree to which their SUD and MH
services were integrated as well as the degree to which their SUD and PH services were
integrated. County administrators used a 5-point Likert scale ranging from “Very poorly
integrated” to “Very well integrated” to rate each system pairing, and ratings were then
compared by wave groupings over two time points (CY 2015 and CY 2019).
For SUD-MH integration, County Administrator Survey ratings slightly decreased from CY
2015 to CY 2019 across the three waves, hovering around “Somewhat well.” (See Figure 17.)
For SUD-PH integration, an increase in ratings was found only in the First Wave counties from
2.2 to 3.3. Second Wave and Other county ratings decreased slightly, with overall ratings nearing
“Somewhat well.” (See Figure 18.)
Based on these results, the DMC-ODS waiver seems to have had a stronger impact on SUD-PH
integration in First Wave counties so far. The decrease in ratings across all three groups for
SUD-MH integration is counterintuitive to the re-organization efforts to support behavioral
health integration. However, this trend presented in past reports as counties newly became live
under the waiver. Previously collected qualitative comments from county administrators revealed
that the decrease in the ratings reflected the greater realism of the challenges to integrate MH
services, and less attention toward collaboration with MH was an unintended consequence.
31 https://www.ahrq.gov/professionals/prevention-chronic-care/improve/coordination/index.html

65
2016 report32: “This is really a pretty monumental change for our system, and I think
there are some places within our county behavioral health where…maybe the assumption
that because on the mental health side, a lot of kinds of processes are in place…is that it
would be an easy roll out to the SUD, but that's not necessarily the case…” and “I think
sometimes people don't realize what a significant change it's gonna be, until it goes into
effect.
2017 report33: "Our system is resource-confined and people are stretched thin," one
administrator explained, "MH and SUD staff need more time and bandwidth to facilitate
integrated care... (this) leads some to push back on integration and collaboration."
Further investigation can be conducted to identify challenges to improve behavioral health
integration if the trend continues.
Figure 17. Ratings of the degree to which SUD and MH departments/divisions are integrated within their counties
32 http://uclaisap.org/dmc-ods-eval/assets/documents/DMC-ODS-Evaluation-Report-FY-2016-2017%20final.pdf 33 http://uclaisap.org/dmc-ods-eval/assets/documents/2017-2018%20UCLA%20DMC-ODS%20Evaluation%20Report%2011192018.pdf
2015 2019
First Wave 3.0 2.7
Second Wave 3.6 3.1
Others 3.8 3.1
1.0
1.5
2.0
2.5
3.0
3.5
4.0
4.5
5.0
1-
Ver
y p
oo
rly
5-
Ver
y w
ell
First Wave Second Wave Others
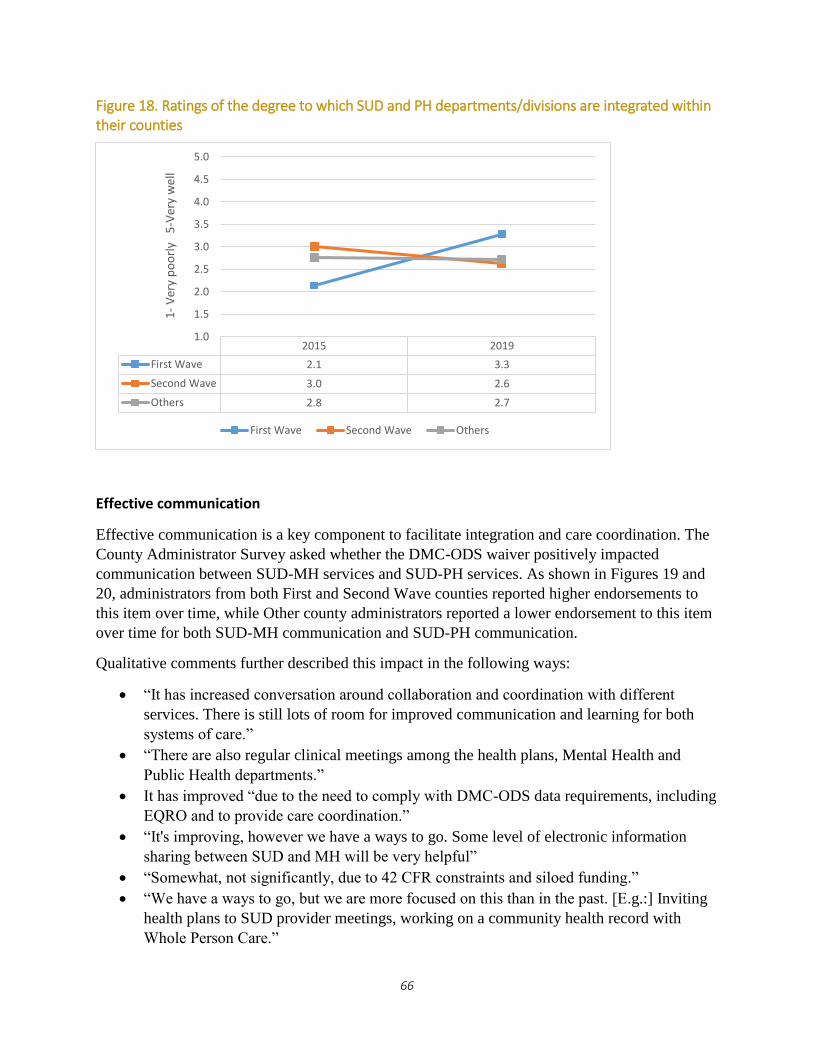
66
Figure 18. Ratings of the degree to which SUD and PH departments/divisions are integrated within their counties
Effective communication
Effective communication is a key component to facilitate integration and care coordination. The
County Administrator Survey asked whether the DMC-ODS waiver positively impacted
communication between SUD-MH services and SUD-PH services. As shown in Figures 19 and
20, administrators from both First and Second Wave counties reported higher endorsements to
this item over time, while Other county administrators reported a lower endorsement to this item
over time for both SUD-MH communication and SUD-PH communication.
Qualitative comments further described this impact in the following ways:
“It has increased conversation around collaboration and coordination with different
services. There is still lots of room for improved communication and learning for both
systems of care.”
“There are also regular clinical meetings among the health plans, Mental Health and
Public Health departments.”
It has improved “due to the need to comply with DMC-ODS data requirements, including
EQRO and to provide care coordination.”
“It's improving, however we have a ways to go. Some level of electronic information
sharing between SUD and MH will be very helpful”
“Somewhat, not significantly, due to 42 CFR constraints and siloed funding.”
“We have a ways to go, but we are more focused on this than in the past. [E.g.:] Inviting
health plans to SUD provider meetings, working on a community health record with
Whole Person Care.”
2015 2019
First Wave 2.1 3.3
Second Wave 3.0 2.6
Others 2.8 2.7
1.0
1.5
2.0
2.5
3.0
3.5
4.0
4.5
5.01
-V
ery
po
orl
y 5
-Ver
y w
ell
First Wave Second Wave Others

67
Figure 19. Percentage of county administrators reporting the waiver has had a positive influence on communication between SUD and MH
Figure 20. Percentage of county administrators reporting the waiver has had a positive influence on communication between SUD and PH
2015 2019
First Wave 60.0% 85.7%
Second Wave 63.6% 81.8%
Others 45.5% 25.0%
0.0%
20.0%
40.0%
60.0%
80.0%
100.0%
First Wave Second Wave Others
2015 2019
First Wave 28.6% 100.0%
Second Wave 63.6% 81.8%
Others 42.4% 19.4%
0.0%
20.0%
40.0%
60.0%
80.0%
100.0%
First Wave Second Wave Others

68
Stakeholder Perceptions: SUD Providers
Preliminary ratings of integrated care
To further assess cross-system integration and collaboration, sampled SUD treatment programs
(one modality/one location) were surveyed to learn how integration/collaboration was being
implemented at the point of service delivery. Questions from the Integrated Practice Assessment
(IPAT) tool were incorporated as a component within the Provider Survey. At the time of this
report, data collection was only partially completed. Results from the Provider Survey collected
thus far (N=62) provide a preliminary description of the current landscape of the SUD system
and service delivery with regard to collaboration/integration as defined by the SAMHSA
Framework. However, due to the small sample size at this time, IPAT results could not be
compared by wave, and the level ratings 1-6 were collapsed and analyzed by the three main
overarching categories: Coordinated Care, Co-located Care, and Fully Integrated Care.
Of the 62 survey responses, 50% were from outpatient programs, 17.7% were from Narcotic
Treatment Programs / Opioid Treatment Programs , and 32.3% were from residential programs.
Sampled treatment programs from thirteen counties, all providing services under the DMC-ODS
waiver, have contributed to this initial dataset. See Figure 21 for a preliminary look at the
distribution of IPAT ratings for both behavioral health integration and PH integration within this
snapshot of the SUD system of care.
Figure 21. IPAT rating of MH and PH service integration in SUD programs
For the SUD-MH service system pairing (behavioral health integration, n=56), half of the SUD
treatment programs (50%) rated in the Coordinated Care category (i.e., “minimal/basic
integration at a distance”), followed by 30.4% in the Co-located Care category and 19.6% in the
Fully Integrated Care category. Six providers did not submit all answers to calculate the IPAT
rating.
50.0%
78.2%
30.4%
10.9%19.6%
10.9%
0%
20%
40%
60%
80%
100%
SUD/MH-Behavioral health integration SUD/PH-Physical health integration
Coordinated care Co-located Fully integrated

69
For the SUD-PH service system pairing (PH integration, n=57), the majority of SUD providers
(78.2%) rated in the Coordinated Care category, followed by 10.9% in the Co-located Care
category and 10.9% in the Fully Integrated Care category. Seven providers did not submit all
answers to calculate an IPAT rating.
Overall, SUD-MH integration was distributed more broadly across the three implementation
categories than PH integration. Although most treatment programs placed in the Coordinated
Care category across both service system pairings, there were more treatment programs offering
on-site MH services than on-site PH services.
The SAMHSA Framework defines physical proximity of service delivery (e.g., providing on-site
services) as the key element to move beyond the Coordinated Care integration category. The key
element to becoming fully integrated is to achieve practice change with a transformation of the
program’s business model. Based on this preliminary dataset, there were more SUD treatment
programs delivering services as Fully Integrated SUD-MH programs compared to Fully
Integrated SUD-PH treatment programs, which is likely due to the overarching efforts from the
state and counties to transition, where possible, from siloed MH and SUD
departments/infrastructures toward integrated behavioral health departments/infrastructures.
Exploratory analysis of integration using SAMHSA Framework
Following determination of the IPAT rating, providers were asked additional questions about
screening practices, on-site service availability, perceptions of meeting the health needs of their
patient populations, referral practices, and perceptions of effective coordination practices for
their patient population. Responses were grouped into the three integration categories and then
compared. A snapshot of the preliminary findings is described below, and a full summary of the
exploratory analysis is in Appendix G.
As the first set of data applying the SAMHSA Framework and adapting the IPAT tool to
measure how integration is occurring within DMC-ODS waivered SUD treatment programs,
these findings should be perceived as a starting point which can be monitored over time.
Although a full randomized sample of provider survey data has not yet been completed, this
cursory and exploratory look at how services are delivered based on the SAMHSA Integration
Framework can help identify barriers for technical assistance guidance.
Overall, findings from this preliminary analysis indicated that while most programs offer
integrated services “at a distance” (in the Coordinated care category), there are more programs
offering on-site MH services than on-site PH services, and there are more programs with Fully
Integrated MH services than Fully Integrated PH services.
Generally, and not surprisingly, the more a program is integrated, based on the SAMHSA
Framework, the more it is systematically and comprehensively screening for MH and PH service
needs, the more capacity it has to treat patients on-site, and the more partnerships it has in place
to refer patients off-site when needed. However, a common theme surfaced around the provision
of Co-locating services as an integration strategy, particularly Co-locating PH services.

70
Again generally, programs providing Co-located services did not show the incremental
progression along the SAMHSA Framework noted above on the following items. Programs with
Co-located services reported low ratings that their on-site services met the needs of the patients
and organizations. In addition, programs with Co-located services reported the lowest ratings that
their off-site collaborations met the needs of their patients and organizations.
These data also highlight additional challenges for Co-locating PH services, compared to Co-
locating MH services. For example, systematic screening for PH conditions was lowest among
programs Co-locating PH services, which was not consistent with the growing progression of
MH screening practices across the SAMHSA Framework. In addition, provider perceptions of
PH needs were the lowest among the Co-located PH category as well as the provider perception
that patients actually received the treatment they needed. Another notable difference appeared
when comparing capacity to treat on-site patients with MH and PH problems with Co-located
services. Programs providing Co-located services seemed to have a lower capacity to treat
moderately complex PH conditions than moderately complex MH conditions on-site. Finally,
when asked if patients were receiving adequate care coordination, programs providing Co-
located PH services reported a lowest agreement rating among all three integration categories.
Co-location reduces time spent travelling from one practitioner to another, but does not
guarantee integration. While a relevant benchmark and facilitator for integrated care, Co-located
services has its challenges to meet the needs of both the patients and organizational integration
goals. Providers can be co-located and have no integration of their healthcare services. Each
provider can still practice independently without communicating with others and with an
integrated healthcare plan. These findings are important to note when programs are evaluating
next steps for integrating services. Utilizing the benchmarks identified in the SAMHSA
Framework is a useful tool to strategically set realistic goals to improve integration of services.
While these data are preliminary, recommended technical assistance resulting from this
exploratory analysis include:
Guidelines for universal screening tools and practices for PH conditions in SUD settings
that include issues addressing the workforce needed to conduct the screening and
applicable billing codes in both residential and outpatient settings.
Technical assistance on the development of Memorandums of Understanding (MOUs) to
establish formal collaborations for both MH and PH partners, which includes the
importance and practice of obtaining consent for release of information forms (ROIs) to
facilitate referral and care coordination.
Stakeholder Perceptions: Patients
In the TPS, patients from live waiver counties were asked two items about care
coordination/integration. While overall perceptions were favorable, these items exhibited the
lowest percentages in agreement (82.6% for “staff here work with my PH care providers to
support my wellness” and 81.7% for “staff here work with my MH care providers to support my
wellness). Patients from First Wave counties reported slightly higher agreement rates for both

71
?
?
items as well (PH item: 84.5% compared to 82.4% and MH item: 82.7% compared to 81.0%).
See full report in Appendix D.
As an effort to learn more about how care coordination can be implemented, a qualitative
interview was conducted with lead administrators from Encompass treatment program.
Encompass was selected as an example of a provider that achieved high patient ratings on care
coordination with MH and PH despite having an IPAT rating in the “Coordinated Care” category
(coordinating at a distance) with these services.
Cross-system Care Coordination – Case Study
Method: Qualitative Interview
Objective: To learn how a SUD treatment program delivering MH and PH services “at a distance”
was able to achieve high satisfaction ratings in Care Coordination
Treatment Program/County: Encompass Community Services, Alto Counseling Center–South;
Santa Cruz County
Interviewees: Sara Anderson, Director of Integrated Behavioral Health, Adult
Lun Wang, Senior Manager of Adult Outpatient Services
Background: UCLA-ISAP interviewed several administrators at Encompass Community Services
because patients who responded to the CY 2018 TPS generally reported a high degree of satisfaction
with the care coordination they received, particularly in the outpatient treatment programs. This case
study explores how Encompass has been able to achieve these high ratings of their care coordination
across MH and PH services, despite being at a distance from MH and PH services.
Description: Under the DMC-ODS waiver, Encompass has been enabled to hire a four member SUD
intake team to go between four locations where Encompass offers services, including criminal justice
settings. At Encompass, two of the four members of the Encompass intake team initiate care
coordination plans. The patient’s need for coordination with MH and PH is assessed prior to, or at
intake so that each treatment plan incorporates care coordination needs from the outset. This protocol
prevents MH/PH needs from falling through the cracks. The intake staff do a risk assessment, and if
the patients’ scores indicate high MH risk, they will be referred to the appropriate co-occurring
placement or MH services from the start.
Once patients have been admitted, care coordination is provided by each patient’s primary clinician,
and care coordination is discussed at regular intervals in treatment planning meetings. At Encompass,
care coordination can include staff accompanying patients to outside appointments, as needed in
acute cases, to ensure follow through.
Also, Encompass has multiple modalities including outpatient, residential and co-occurring
programs. Patients can be referred within these Encompass programs quickly when they need a
higher LOC. Additionally, Encompass contracts with both the county MH division as well as the

72
?
SUD. So Encompass is able to have very close collaborative relationships within the Santa Cruz
County Behavioral Health system, which facilitates meeting MH needs.
In residential, Encompass uses nursing staff to deliver medical case management services and ensure
that PH needs are addressed in a timely fashion. Nurses at Encompass perform important triage,
reducing emergency department visits by 60% according to Encompass quality improvement data.
Encompass leverages residential day rates, Incidental Medical Services (IMS) billing and other funds
from collaborators and grants to fund care coordination services provided by the intake team and
nurses.
Challenges:
Time demands: It is challenging for clinicians to provide quality care coordination when
they have high caseloads. “We are all too busy… When you’re working with folks and
have caseloads of 30 to 35, it’s really challenging to do that well.”
Retaining patients: Even with good care coordination staffing, it’s hard to retain patients
in SUD, MH and PH care and keep them engaged in treatment once they leave
residential. Many patients are transient or homeless and don’t have the stability which
would enable them to continue appropriate care.
Meeting PH needs: The current Medi-Cal system is predicated on the idea that patients
already have a medical home and/or primary care physician. This is not the case for
almost half of Encompass patients. Most Encompass patients have not had a physical in
the last 12 months and there is a 3-6 month wait for appointments at the Medi-Cal
primary care clinics. Encompass would like to be able to hire medical providers and
provide required physicals to expedite care.
Long term MH engagement: It’s difficult to get patients to engage in longer term MH
therapy. “We are finding that it’s a little hard to sell to someone who has SUD issues and
mental health issues on really establishing a long-term relationship—with a therapist.”
This may be due to stigma.
Reimbursement rates: Despite the DMC-ODS waiver, Medi-Cal reimbursement still
might fall short. Residential rates may not be high enough to provide the care that is
warranted. “Now our IMS rates aren’t enough to cover our medical staff. The reason why
we have a part-time nurse practitioner instead of a full-time nurse practitioner is because
we can’t afford to have a full-time nurse practitioner.”
Lack of billing codes for nursing: Nurses provide a variety of services, however the
current billing codes do not represent the breadth of those services.
Keys to Success:
Mission to deliver integrated care: The commitment to deliver integrated care needs to be
part of the mission from the top leadership, on down.
“[Encompass] hired a new CEO within the last five years who is very invested in equitable
access to healthcare. Whether it’s mental health care or it’s physical health care. She really
took us on a journey over the last four years to prime us for becoming a provider that really
is focused on providing integrated behavioral health.”

73
?
Start on day one: Assess need for care coordination with PH/MH at or before intake.
Initiating care coordination protocols from the first contact is one of the secrets to
Encompass’ success.
Leverage existing relationships: Encompass has had contracts facilitating collaboration
with county MH programs for many years. “The fact that we have those close relationships
makes it easier to access those services when we need it.”
Collaborate with referring agencies and MH/PH providers: Encompass met with agencies
from across the county weekly at first to establish workflows. This involved their intake team
manager, and topics included, “How do we standardize care across these different contract
providers? How do we make sure that we are providing continuity when people transfer or
transition in between levels of care and in between agencies?”
Collaborate with Criminal Justice: A positive relationship with the Sheriff fosters
collaboration and ability to offer treatment groups in the county jail, which contributes to
groundwork for care coordination once the patients are released.
Leverage all sources of funding: Probation Department funds SUD services provided by
Encompass in CJ settings.
Billing for IMS in residential
“If you’re going to run a substance use treatment residential facility, you absolutely need to
have a full-time nurse and also apply for IMS so that you can have a doctor who oversees the
care there. It’s just the level of physical health acuity that we see among the Medi-Cal
population—… 40 percent of the population that we see in the residential facility are
homeless.”
Hub and Spoke funding & state block grants
In-house nursing: Care coordination and medical case management provided by nurses at
Encompass in residential settings are vital. Nursing can address many immediate needs and
advocate directly with other providers for patients’ ongoing needs.
Recommendations for DHCS’ Consideration Drawn from the Case Study
Explore options for increasing the variety of billing codes for services that nurses provide
both in residential and outpatient services. Encompass suggested the need for more billing
codes for nursing/medical case management in SUD treatment programs for patients with
multiple chronic health conditions. Perhaps incorporating nurse case management rate and
billing codes such as those offered under Medi-Cal Chronic Case Management.34
Consider providing guidance to counties and providers on collaborating with systems outside
Medi-Cal (e.g. child protective services, criminal justice, private foundations) for financial
sustainability.
34 https://www.cms.gov/outreach-and-education/medicare-learning-network-mln/mlnproducts/downloads/chroniccaremanagement.pdf

74
Administrative Data
Analysis of CY 2018 DMC claims data and SD/MC claims revealed that 28% of SUD patients
have received both MH and SUD services in the same calendar year. Comparing these data by
wave groupings over time, First Wave counties show a 3.8% increase from before the DMC-
ODS waiver implementation in CY 2016 (baseline) to CY 2018 (29.5% to 33.3%). Second Wave
counties show a 2% increase from before waiver implementation in CY 2017 (baseline) to CY
2018 (18.9% to 20.9%). While First Wave counties demonstrated a higher baseline rate than the
Second Wave counties, the higher percent change occurred in the second year of implementation
of services under the DMC-ODS waiver. It is possible that this trend will present for the Second
Wave counties in CYs 2019/20. These figures are a positive indication that coordination of
services is occurring across the SUD and MH systems, but further analysis is needed to
understand referral processes and how well the services are coordinated with integrated treatment
plans.
Another data source to inform on cross system coordination is the CalOMS-Tx measure of
referral source. Overall, the data show that 2.5% of admissions to SUD treatment services came
from health care providers. This data is similar to previous years denoting little growth of
incoming referrals from MH or PH systems. Further exploration will be conducted to understand
referral practices across systems as well as whether there are some directional variations or
trends.
Figure 22. Percentage of SUD patients with MH and SUD services claims data, First Wave only
29.5% 30.2%33.0%
0.0%
20.0%
40.0%
60.0%
80.0%
100.0%
2016 (Baseline) 2017 2018

75
Figure 23. Percentage of SUD patients with MH and SUD services claims data, Second Wave only
For systems of care to improve coordination of care across the three systems (SUD, MH, and
PH), it is important for counties to monitor how things are working or not working together. In
the CY 2019 County Administrator Survey, over half (57.1%) of First Wave county
administrators reported having monitoring procedures in place, followed by Second Wave
county administrators (45.5%), and Other county administrators (38.7%). While many counties
do not yet have set procedures in place and report that 42 CFR part 2 regulations remain a
significant barrier to collaboration, qualitative comments yielded the following strategies to
improve coordination across the three systems:
Utilizing a Health Information Exchange (HIE) to flag high utilizers and utilize case
management services
Developing universal ROIs and obtaining consents routinely
Conducting case conferences for high utilizers
Training case managers/care coordinators on client engagement and care coordination
Educating and training staff to understand each system and combining meetings to
address integration and coordination
Identifying champions within each system to build those relationships and facilitate
communication
Participating in DHCS-sponsored activities that bring together key players in each system
However, additional comments suggested these types of strategies are costly and “much is
unbillable as initial coordination often happens before client has been formally admitted to an
ODS service.”
18.9% 20.9%
0.0%
20.0%
40.0%
60.0%
80.0%
100.0%
2017 (Baseline) 2018

76
Coordination and Continuity of Care Within the SUD system
Stakeholder Perceptions: County Administrators
SUD county administrators were asked to rate how well their county tracks referrals and patient
movement within the SUD system. CY 2019 County Administrator Survey respondents used a 5-
point Likert scale ranging from “Very poorly” to “Very well,” and ratings were then compared
by wave groupings. On average, all counties reported at or just above “Somewhat well.” First
wave counties reported the highest rating (3.42), but without significant differences to either
wave groupings. There was a slight improvement, albeit not significant, on this measure
compared to CY 2017.
Figure 24. Average rating of how well counties track referrals and patient movement within the SUD system
CY 2019 County Administrator Survey respondents reported a multi-pronged approach to
facilitate tracking of patient movement along the SUD continuum of care. First Wave counties
utilized predominately electronic databases (85.7%) and phone call (71.4%) approaches to
facilitate tracking of patient movement. Second Wave counties reported using predominantly
electronic databases (66.7%) and paper (41.7%) approaches. First Wave counties reported
highest use of electronic databases (85.7%) compared to Second Wave and Other counties
(66.7% and 60.6%, respectively).
3.1
2.8
3.23.4
3.0
3.3
1.0
1.5
2.0
2.5
3.0
3.5
4.0
4.5
5.0
First Wave Second Wave Others
1-V
ery
po
orl
y 5
-V
ery
wel
l
2017 2019

77
Figure 25. Methods used to track patient movement within the SUD continuum of care
The capability to share patient data as a patient moves from one LOC to another is a critical
component to facilitate successful transitions along the continuum of care. The County
Administrator Survey asked whether the DMC-ODS waiver positively impacted the sharing of
patient data. Fewer than half of county administrators from both First and Second Wave counties
reported the waiver has impacted positively the facilitation of sharing patient data. (See Figure
26.) Qualitative comments further reveal the 42 CFR Part 2 regulation remains as the critical
barrier to improving this practice; yet, implementing a countywide EHR has helped navigate
privacy and confidentiality regulations.
“While the awareness of the importance and desire to share client data has increased, the
same struggles regarding 42 CFR, Part 2 persist.”
“Part 2 restrictions continue to require multiple ROI signatures, constricting possibility of
case conferencing, etc.”
“42 CFR Part 2 still exists, so while transitions between levels of care has improved the
sharing of client information has not changed.”
“Currently, we still have many issues to resolve in this area with our providers. This is
mostly due to us using our EHR. The providers have a designated portal through which
they communicate with county staff on clients. As with any EHR implementation, we are
encountering issue on how to make this process smooth. But I am optimistic, that this
will improve in the long term.”
“With the waiver, we implemented a new ROI that allows providers within ODS to
communicate for purposes of coordination of care. We have also adopted a common EHR
used across portals, outpatient/intensive, residential, withdrawal management, and
recovery residence providers.”
85.7%
42.9%
71.4%
28.6%
66.7%
41.7%
33.3%
16.7%
60.6%
42.4%
51.5%
15…
0.0%
20.0%
40.0%
60.0%
80.0%
100.0%
Electronic database Paper (e.g. fax, mail) Phone calls Other
First Wave Second Wave Others

78
Figure 26. Percentage of county administrators agreeing that the DMC-ODS waiver positively impacted the sharing of patient data across the SUD continuum of care in their county.
Figure 27. Percent agreement that Treatment programs have a formal protocol to facilitate successful transfers along the SUD continuum of care
Stakeholder Perceptions: Providers
As shown in Figure 27, approximately two-thirds of providers (67.7%) reported their treatment
program had a formal protocol to facilitate successful transfers along the SUD continuum of
care. As shown in Figure 28, about half of providers reported “always” (22%) or “often” (32.7%)
receiving confirmation of successful admissions following transfer to another LOC. These two
items suggest more work is needed to improve communication.
42.9% 45.5%
18.2%
0.0%
20.0%
40.0%
60.0%
80.0%
100.0%
First Wave Second Wave Others
67.7%
11.3%
0.0%
20.0%
40.0%
60.0%
80.0%
100.0%
Yes No

79
Figure 28. Percentage of treatment programs that receive confirmation of successful admission following an attempt to transfer a patient to another LOC
Providers were also asked an open-ended question to identify what factors had the most
significant impact on the success of patient transfers. Collaboration/discussion (e.g., between
clinicians and often with the patient, between the county case managers, between treatment team
and patient, between the Access line staff, client and new provider) was mentioned the most (11
times). Succeeding collaboration/discussion were follow-ups (e.g., by counselors and case
managers), availability for the patient to make the actual transfer when ready (e.g., beds), and
warm handoffs. A few providers also mentioned setting the “culture” and “communication with
the client from first contact about the continuum of care and the need for ongoing treatment
including step-downs and eliminating the concept of “graduation,” and having an “internal
continuum of care” as having a positive impact on patient transfers.
Administrative Data: Transitions of Care
According to both CalOMS-Tx data, transitions from both residential treatment to lower levels of
care, and transitions from detoxification/withdrawal management to any LOC do not occur in the
vast majority of cases. UCLA will update statistics when CalOMS-Tx data quality issues are
resolved. For reference, however, in CY 2017, 86.4% of patients did not receive further
treatment within 14 days after residential treatment discharge and 72.6% did not receive
treatment within 14 days after withdrawal management discharge,35 and preliminary analyses
suggest these numbers did not change much in CY 2018.
Further exploration is recommended to determine why patients do not accept or are not offered
additional services. It would be helpful to talk to patients and treatment providers to better
35 http://uclaisap.org/dmc-ods-eval/assets/documents/2017-2018%20UCLA%20DMC-ODS%20Evaluation%20Report%2011192018.pdf, p. 42
15.0%
21.0%
20.0%5.0%
39.0%
Always Often Sometimes Rarely Never
80
?
understand why residential patients who do not continue along the continuum of care, and to
potentially identify promising practices to address this.
Some treatment programs may be successful at transferring patients from withdrawal
management to treatment in part because they offer multiple LOCs. For example, Tarzana
Treatment Centers, which offers both withdrawal management and treatment services, reported
that 70% of patients who complete inpatient detox transition into treatment (National Council
webinar: Translating Detox into Recovery: Innovations in Opioid Treatment, presented on July
16, 2019). However, even where withdrawal management and treatment services are not offered
within the same program, it is possible to achieve successful levels of transitions. (See Riverside
County’s case study on Transitions from Withdrawal Management.)
Providers were also asked an open-ended question to identify factors that had the most
significant impact on the success of patient transfers. Collaboration/discussion (e.g. between
clinicians and often with the patient, between the county case managers, treatment team and
patient, between the Access line staff, client and new provider) was mentioned the most (11
times), then follow-up (e.g. by counselors, case managers), and availability for the patient to
make the actual transfer when ready (e.g. beds), and warm handoffs. A few providers also
mentioned setting the “culture” and “communication with the client from first contact about the
continuum of care and the need for ongoing treatment including step-downs and eliminating the
concept of “graduation”, and having an “internal continuum of care” as having a positive impact
on patient transfers.
These and other strategies to facilitate patient transitions along the continuum of care should
continue to be explored, and promising practices shared among counties and providers.
Transitions of Care from Withdrawal Management – Case Study
Method: Qualitative Interview
Objective: To learn how one county improved linkage and engagement of patients from
withdrawal management to another LOC using a regional Care Coordination Team (CCT)
approach.
Organization/County: Riverside University Health System – Behavioral Health; Riverside
County
Interviewees: Suzanna Juarez-Williamson, MA, Supervising Research Specialist
April Marier, LCSW, LAADC, Administrator Substance Abuse Prevention and
Treatment Program
William Harris, MPS, CCPS, CADC-II, Prevention Services Coordinator
Rodney Miker, Behavioral Health Specialist III

81
?
Background: Riverside County designed and successfully completed a two-year performance
improvement project36 to improve linkage and engagement of patients in a full continuum of care
using a regional CCT approach. The county found significant improvements for adults
transitioning after discharge from withdrawal management to either residential or outpatient
services as a result of CCT case management. The number of cases transitioning from
withdrawal management to residential or outpatient care increased by 20.5% percentage points to
63.6% which is a 48% increase from baseline.37
Description: The CCT’s primary focus is to provide and support each patient in connecting to
necessary services. Case management services are provided by two regional CCTs. The Western
Regional CCT is comprised of six certified SUD counselors, while the Desert Region has four
licensed SUD counselors.38 Both regional CCTs include a peer support specialist and a
Community Services Assistant. CCT staff receive ongoing, intensive training on a variety of
relevant topics (i.e., evidence-based practices). (See the appendices for the Training Schedule.)
CCT case managers are assigned to patients at the time of referral for withdrawal management
services at county contracted providers. Prior to actual placement, they assist patients in
addressing potential barriers to successfully entering and completing treatment (i.e., orienting
and preparing the patient for treatment in the new setting). The CCT continues to provide case
management services throughout the episode and during transitions to residential or outpatient
(up to two weeks in to outpatient).39 (See the Assignment to Intake Workflow in the appendices.)
CCTs provide weekly or bi-weekly face-to-face case management services at the treatment
facility which include: conducting ASAM assessments; development of treatment plans in
collaboration with the patient; follow-up on treatment progress or barriers to progress; preparing
documentation; assisting the patient in obtaining Medi-Cal benefits, prenatal care, MH, medical,
housing, and family services; and transportation to and from appointments. (See the Case
Management Needs Assessment in the appendices.) In addition, these case managers coordinate
placement and assist in maintaining patient engagement during treatment. They advocate for
patients and work closely with the patient’s primary counselor.
Challenges: Interviewees raised the following challenges:
The pre-placement services that a consumer may need prior to opening the episode
cannot be billed under the DMC-ODS waiver (i.e., taking the consumer for a psychiatric
clearance, medication refills, and medical clearance). The county has had to use its
general funds.
36 The project included transitions from residential treatment to another LOC upon discharge, which is not the focus of the case study highlighted in this report. Implementation of a clinical performance improvement project is one of the External Quality Review Organization (EQRO) requirements under the DMC-ODS waiver. 37 The results were extracted from the Riverside County performance improvement project document. 38 The CCTs also include counselors who specialize in adolescent, perinatal, and/or severely mentally ill populations. 39 Pregnant women can received case management services from the CCT for a longer period of time.

82
?
Because transferring a patient’s DMC from county to county for withdrawal management
services takes time and the patient is with the treatment provider for only a short period
of time, the transfer often does not take place until after the patient has already
transitioned to residential.
CCTs find it challenging to place patients who are not mentally stable or medically
compliant or who have PH problems that have not been addressed. The team has
established “connections” with public health, so they can make a phone call to get
patients “tied in to public health clinics.”
Keys to Success:
According to interviewees, keys to success include: (a) thorough initial assessments; (b)
developing rapport and good relationships with providers; and (c) providing all the
information to the provider before the patients present there to avoid inconsistencies or
patients being sent away because something is missing.
Supplemental Material (see Appendix H)
H1: Riverside County Care Coordination Team 2019 Master Training Schedule
H2: SAPT Care Coordination Team – Assignment to Intake Workflow
H3: SAPT Care Coordination Team Discharges
H4: Riverside University Health System – Behavioral Health: Case Management Needs
Assessment
Recommendations for DHCS’s Consideration Drawn from the Case Study
Consider allowing counties to bill for pre-placement services without the consumer
having a full assessment and care plan in place.
Explore options to expedite transfer of a patient’s DMC from county to county.
Technical Assistance
Technical assistance for tracking referrals and client movement within the SUD system was
highly endorsed across both First and Second Wave counties, more so than Other counties. (See
Figure 29.) Given the complexities of sharing protected information, more guidance was
requested in the following ways:
Provide and share sample MOUs if available.
Describe examples from other counties that have systemized tracking referrals (that show
actual movement in EHRs) and other existing practices that have been helpful.
Provide state level guidance regarding what waiver-related care coordination is possible
without patient signature under 42 CFR Part 2.
Provide assistance to fund additional IT personnel (programmers) so that systems can be
configured to track referrals/patient movement more efficiently
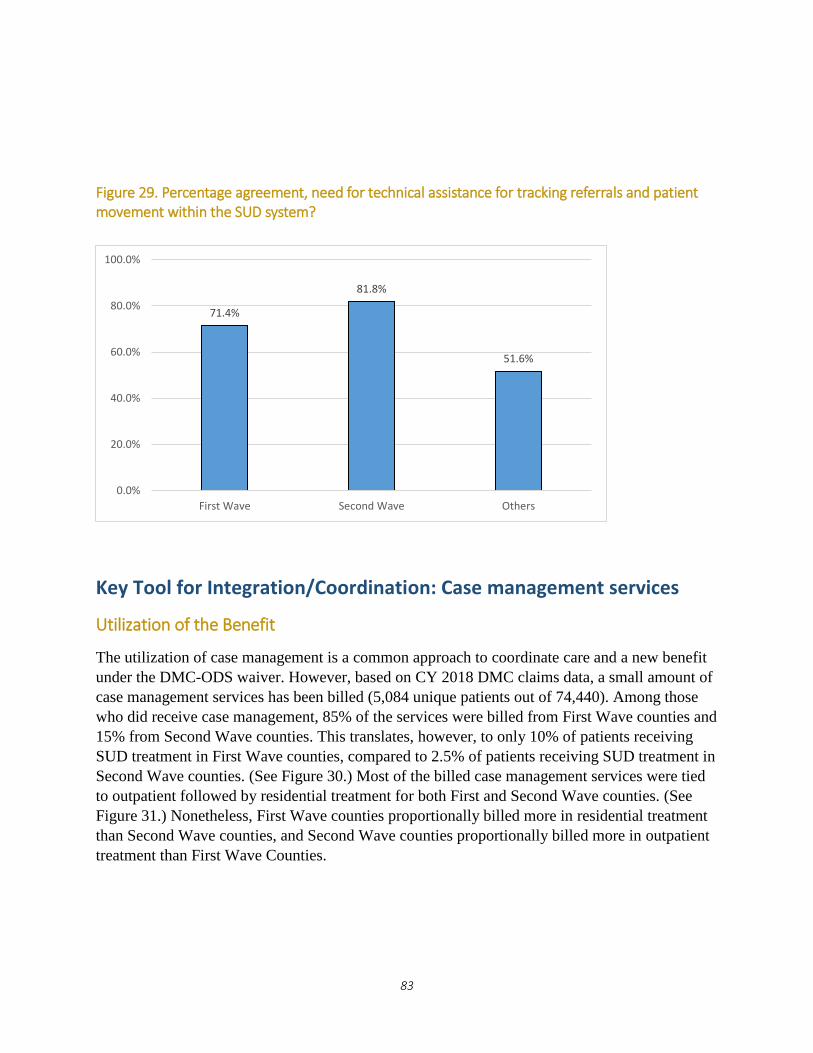
83
Figure 29. Percentage agreement, need for technical assistance for tracking referrals and patient movement within the SUD system?
Key Tool for Integration/Coordination: Case management services
Utilization of the Benefit
The utilization of case management is a common approach to coordinate care and a new benefit
under the DMC-ODS waiver. However, based on CY 2018 DMC claims data, a small amount of
case management services has been billed (5,084 unique patients out of 74,440). Among those
who did receive case management, 85% of the services were billed from First Wave counties and
15% from Second Wave counties. This translates, however, to only 10% of patients receiving
SUD treatment in First Wave counties, compared to 2.5% of patients receiving SUD treatment in
Second Wave counties. (See Figure 30.) Most of the billed case management services were tied
to outpatient followed by residential treatment for both First and Second Wave counties. (See
Figure 31.) Nonetheless, First Wave counties proportionally billed more in residential treatment
than Second Wave counties, and Second Wave counties proportionally billed more in outpatient
treatment than First Wave Counties.
71.4%
81.8%
51.6%
0.0%
20.0%
40.0%
60.0%
80.0%
100.0%
First Wave Second Wave Others

84
Figure 30. Percentage of patents in SUD treatment for whom a claim for case management services is present (CY 2018)
Figure 31. Among patients who received case management services, distribution by modality and wave
10.0%
2.5%6.8%
0.0%
20.0%
40.0%
60.0%
80.0%
100.0%
First Wave Second Wave Total
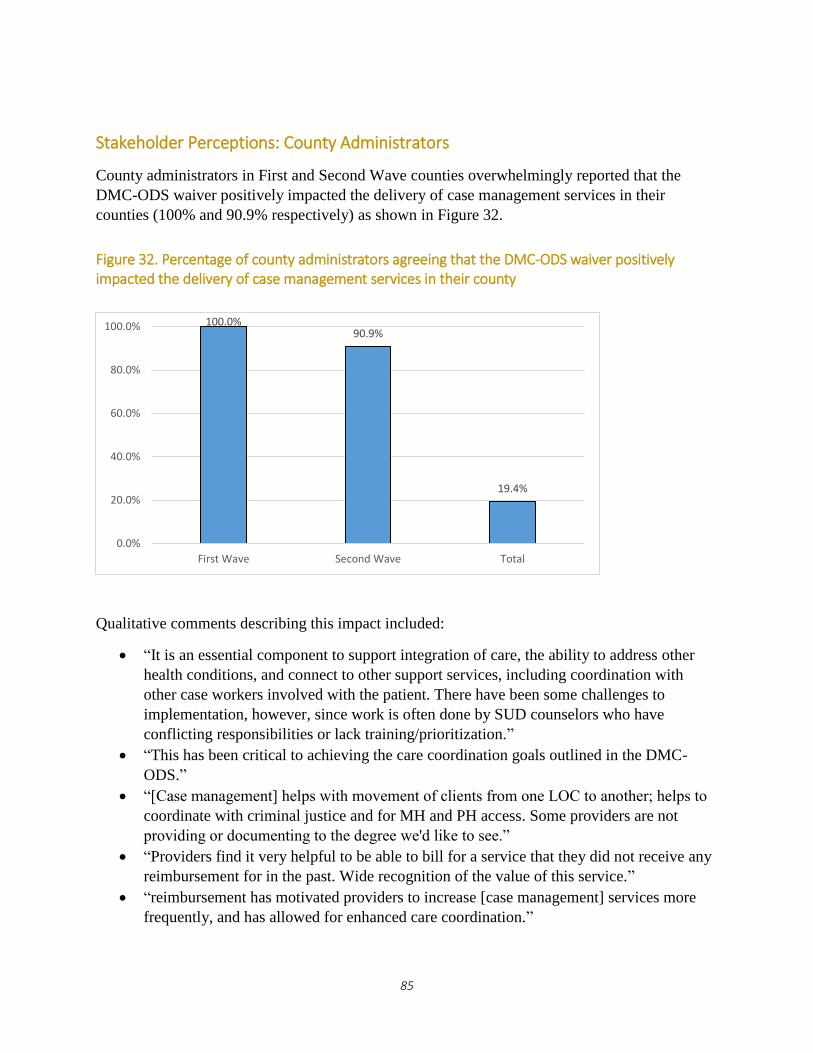
85
Stakeholder Perceptions: County Administrators
County administrators in First and Second Wave counties overwhelmingly reported that the
DMC-ODS waiver positively impacted the delivery of case management services in their
counties (100% and 90.9% respectively) as shown in Figure 32.
Figure 32. Percentage of county administrators agreeing that the DMC-ODS waiver positively impacted the delivery of case management services in their county
Qualitative comments describing this impact included:
“It is an essential component to support integration of care, the ability to address other
health conditions, and connect to other support services, including coordination with
other case workers involved with the patient. There have been some challenges to
implementation, however, since work is often done by SUD counselors who have
conflicting responsibilities or lack training/prioritization.”
“This has been critical to achieving the care coordination goals outlined in the DMC-
ODS.”
“[Case management] helps with movement of clients from one LOC to another; helps to
coordinate with criminal justice and for MH and PH access. Some providers are not
providing or documenting to the degree we'd like to see.”
“Providers find it very helpful to be able to bill for a service that they did not receive any
reimbursement for in the past. Wide recognition of the value of this service.”
“reimbursement has motivated providers to increase [case management] services more
frequently, and has allowed for enhanced care coordination.”
100.0%90.9%
19.4%
0.0%
20.0%
40.0%
60.0%
80.0%
100.0%
First Wave Second Wave Total

86
“The main improvement is that field services are allowed. The most dramatic example of
this is intensive case management at sobering center.”
“SUD providers have been slow to … capture billing for this service; often times stating
that they either don't clearly understand what can be billed as case management and
inability to document these activities due to the increased demand for time as a result of
DMC-ODS documentation requirements.”
“Very minimally, while we recognize the importance and positive impact, our providers
have gradually added case management services due to workforce shortage”
County administrators were then asked broadly to rate the degree to which case management is
being delivered under the DMC-ODS waiver. County administrators used a 5-point Likert scale
ranging from “1-We are still trying to figure out how to implement it” to “5-We are consistently
delivering and billing for case management.” First Wave counties reported a higher mean score
(3.28) on the degree to which case management is being delivered under the waiver as compared
to 3.1 for Second Wave counties. (See Figure 33.)
Figure 33. Degree to which case management is being delivered under the DMC-ODS waiver
County administrators who reported above a 3 rating were asked to share strategies used to
deliver case management. These included:
Hiring Recovery Coach/Care Managers that can work with beneficiaries throughout their
engagement with the DMC-ODS (not tied to a specific provider)
Establish Intensive Case Management Teams focused on specific populations and/or
levels of care
Provide technical training and clinical discussions to providers
3.33.1
2.5
0.0
1.0
2.0
3.0
4.0
5.0
First Wave Second Wave Others
1-S
till
figu
rin
g it
ou
t 5
-Co
nsi
sten
tly
del
iver
ing
and
bill
ing

87
Distinguish between "service coordination" and "care coordination" within case
management services, and identify these separate in procedure codes.
Give clear directions to staff and providers about the expected role of case management.
County has developed a 2-page guide on case management services. County monitors
case management services on an annual basis through medical record reviews.
How to work collaboratively and not duplicate services with other system case
managers/care coordinators (physical care clinics, MH, probation, whole person care,
etc.)
One key is to make sure there are clear guidelines around who is doing what when
linking to different LOCs and if the county case managers are involved.
Respondents to the Provider Survey indicated various ways in which case management services
were delivered at their treatment program. The majority of providers (72.6%) indicated
counselors on staff provide case management to patients when needed, followed by those
indicating dedicated staff perform case management as their primary role (21.0%), and those
indicating case management is provided through the county/counties (17.7%). And a small
portion are being delivered via telehealth methods: 12.9% via telephone, 6.5% by video
conferencing, and 1.6% by mobile apps.
Figure 33. Treatment program-reported use of case management services delivered
Stakeholder Perceptions: Providers
Most providers reported patients at their treatment program are receiving adequate case
management services. As shown in Figure 34, on a 5-point Likert scale (1= Strongly disagree; 5=
Strongly agree) 40.4% of providers chose agree (4), followed by 25% indicating strongly agree
(5) and 25% indicating neither agree nor disagree (3).
1.6%
72.6%
21.0%
9.7%17.7%
0.0%
20.0%
40.0%
60.0%
80.0%
100.0%
N/A-casemanagement is
not delivered outour Treatment
Program
Counselors onstaff provide casemanagement to
clients whenneeded
Dedicated staffperform case
management astheir primary role
Outside agenciesare contracted to
deliver casemanagement to
clients
Casemanagement is
provided throughthe county

88
Figure 34. Percentage of providers agreeing that patients are receiving adequate case management services at their location.
While case management is being underutilized, Los Angeles County developed a strategic plan
to utilize this new benefit which is showing to have a large impact on outcomes. See case study.
25.0%
40.4%
25.0%
5.8% 3.8%
0.0%
20.0%
40.0%
60.0%
80.0%
100.0%
5-Strongly agree 4 3-Neither agreenor disagree
2 1-Stongly disagree

89
?
?
Delivering Case Management Services – Case Study
Method: Qualitative Interview
Objective: To learn how one county launched the Case Management service benefit under the
DMC-ODS waiver.
Organization/County: Substance Abuse Prevention and Control – Los Angeles County
Interviewees: John M. Connolly, Ph.D.., M.S.Ed, Deputy Director -Policy, Strategic Planning,
and Communications
Background: UCLA-ISAP contacted Los Angeles (LA) County because it delivered and billed
the most DMC Case Management services per patient in 2018. Also, LA County determined
through their own analyses that compared to patients that did not receive case management,
recipients were more likely to have a successful discharge status (52.8% vs 42.7%), be abstinent
at discharge (85.0% vs 59.5%), report improvement in their PH from admission to discharge
(44.6% vs 30.1%), and have improvement in their MH from admission to discharge (43.9% vs
26.4%). All of this occurred in spite of case management recipients being more likely to be
homeless, recently physically or sexually abused.
Description: Under the DMC-ODS waiver, LA County promoted use of the new case
management benefits with its providers, and has seen increased delivery and billing for these
services. LA County worked on building awareness among providers of this increased capacity.
“We wanted providers to first be aware of the benefit since it was something that was newly
billable.” It required a culture shift in that there was not explicit bandwidth for case management
before the DMC-ODS waiver.
LA County communicated the breadth and scope of the new benefit in provider manuals,
technical assistance, training, and guidance. Clarifying the scope of these services gave providers
confidence that if they provided the service, they could also bill for it.
LA County’s strategy also included both clearly specifying which services are billable and which
are not. For example, they made clear that time spent sitting in court with a patient or riding with
them to and from an outside appointment were not reimbursable.
Although there are limitations, LA County promotes case management for all patients, as a
component of good SUD care, with an emphasis on delivering it to the most vulnerable patients.
They emphasize that everybody should be offered case management, “to prepare for a discharge
and to be connected to the services that humans need, whether it’s healthcare and MH, dental
appointments, vocational training, job training, parenting courses.”
Particular attention is paid to people with criminal justice involvement, women with children,
families who are involved with child protective services, and people who are homeless.
Finally, LA County has a clear framework for case management service priorities, “Connect,
Coordinate, and Communicate.” This framework is illustrated in the excerpt from the provider
manual in the following table.

90
Three Core Functions of Case Management (from “LA County Substance Use Disorder
Treatment Services Provider Manual v4.0”)
Challenges
Workforce limitations:
Not enough staff. The limited size of the qualified workforce is preventing some of
the CM benefits from being maximized because there are not enough staff to deliver
them.
Not enough specialized training for staff who provide case management. The
staff who are available do not have clear specific training in case management that is
explicitly endorsed by the state. “It would be great to have more training or
certification available…. We would be glad to see the state come up with some
frameworks.”
Insufficient guidance on billing for case management. In the absence of more
specific guidance from the state, the county feels there’s risk of misunderstanding,
and providers will be hesitant to provide services if there is a risk they will not get
reimbursed for them.
Keys to Success:

91
Plan ahead. Make a thoughtful plan for case management and spend time communicating
the plan to providers. “Do it with intentionality and forethought.”
Use case management services to advance bio-psycho-social treatment goals for the
whole person. The county recommends using CM as a core tool to involve a range of system
support services and allies in the effort to focus on the particular needs of the patient as
opposed to the offerings of the treatment program.
Communicate to providers, 1) in advance, 2) often and 3) in multiple ways.
Set limits. Don’t take on responsibilities of other agencies that have purview over specific,
non-SUD services like child protective services, courts, parole/probation, Department of MH,
etc.
Be flexible: Originally LA County had a billing cap of seven hours per month, per patient.
Since the DMC-ODS waiver was implemented, providers negotiated an increase to 10 hours
per month per patient due to the increased expectations for case management services,
thereby facilitating more successful implementation of these services.
Connect to other County service delivery systems in order to maximize patient access to
a range of care. The county recommended getting familiar with other county service-
delivery systems, e.g. Cal-Works and social services. One key was helping providers to really
understand there were these other entities that they may not have actively worked with
before, but emphasizing that they should work with them.
Supplemental Material (see Appendix I)
I1: LA County Substance Use Disorder Treatment Services Provider Manual v4.0
I2: LA County Report: Benefits of Case Management
Recommendations for DHCS’ Consideration Drawn from the Case Study
Consider providing specific guidance on billing and reimbursement for case management
through multiple avenues including; technical assistance, webinars, email instruction and in-
person meetings.
Explore options to develop a state-wide curriculum for certifying staff in case management
core competencies.
Technical Assistance
While case management is making a large impact for those utilizing the benefit, a majority of
surveyed First and Second Wave county administrators indicated they would like technical
assistance for delivering case management (50.0% and 54.6% respectively). Only 40.7% of
surveyed county administrators in the Other group reported wanting technical assistance for
delivering case management. Topics included:
Training to build skills or counselors to deliver the service.
Technical assistance for the providers who have not done it before, or technical assistance
around the requirements providers need to follow.
Billing technical assistance on how to claim the initial engagement when assessment is
not yet complete, when the person drops out prior to any planned service.
92
Billing technical assistance on how much case management a client should get...are there
general standards/expected utilization that we would see for case management based on
ASAM LOC.
Billing technical assistance for patients who have been assessed but not treated and/or
assessed but delayed treatment (e.g.: patients from justice partners).
Sharing of useful models from other counties or providers.
Across the systems -- how can the health care navigators, the homeless case managers,
and the MH case managers be utilized for SUD patients. Perhaps shared trainings to
discuss referral processes for SUD services, as well as system specifics like SUD LOCs
would be beneficial.
Guidance to avoid duplication of case management services for beneficiaries who work
with multiple parties across systems.

93
Conclusions
;

94
Overall, results to date show that the DMC-ODS waiver is improving access to treatment,
treatment quality, and coordination of care, but there are also many challenges to overcome as
the current waiver draws to an end in 2020 and discussions of next steps begin.
One of the strengths, and also a weakness of California’s approach is county variability. In
California, counties play the central role in the delivery of SUD treatment. Counties like Los
Angeles, Riverside, and Santa Clara are thriving and innovating within the DMC-ODS structure.
At the other extreme, many of the state’s smallest counties have not opted in at all. These small,
rural counties likely have trouble meeting the minimum requirements of the waiver, such as
having a nearly full continuum of care and a 24-hour beneficiary access line. Neither may be
sustainable in a very small county that may only get a few referrals for some levels of care, and
only a handful of calls to the beneficiary access line per year. Several paths are possible in the
future for these counties:
One promising solution is a regional care model like the one being led by Partnership
Health Plan. It is unclear, however, whether there is another entity that would take the
lead for non-Partnership counties.
Anecdotally, some small non-waiver counties would prefer not to join such a model and
would prefer to “control their own system” as one administrator put it. This administrator
also noted that they would need a large amount of technical assistance on how to monitor
and contract with providers (in- and out- of county), do rate-setting, and facilitate
provider certification in order to participate in the waiver.
Another option to consider, if allowed by CMS, would be to make adjustments to the
waiver minimum requirements for low-population counties in light of their practical
constraints.
Barring the options above, a backup alternative would be for California to elect the
SUPPORT Act state plan option created by H.R. 6, § § 5051-5052 in 2018. Small
counties could participate in this state plan, which would provide some new benefits,
including coverage of residential treatment, but with limitations (e.g. residential treatment
is limited to a maximum of 30 days during a 12-month period). This would not provide
all of the benefits of DMC-ODS (e.g. recovery support services, case management), and
electing this state plan option may undercut county participation in 1115 waiver efforts.
Other persistent challenges brought up by stakeholders in surveys and interviews since the
beginning of this evaluation include the two-stay maximum for residential treatment, the
requirement that the county of residence (rather than county of service) pay for treatment, and
challenges expanding medical detoxification/withdrawal management. Based on recently
approved 1115 waivers in other states, the two-stay residential maximum is likely to be removed
in favor of a 30-day average statewide residential length of stay. Challenges around county of
residence and medical detoxification/withdrawal management will still need to be addressed.
A recurring theme among interviewees this year was that counties wanted more guidance on
what was allowable or not, particularly for new benefits like recovery support services and case

95
management. The state initially took the well-intended approach of not being overly prescriptive
in an effort to promote innovation, and in some counties this has worked, but feedback from
counties suggests the uncertainty may inadvertently have the opposite effect and causing some
providers and counties to be more conservative than innovative
Another persistent challenge is transitions between levels of care. While Riverside County was
able to increase transitions from withdrawal management into treatment using a care
coordination team, a Riverside County effort to use similar methods to increase transitions from
residential treatment to lower levels of care did not result in the same success. It may be that
patients prefer not to transition to outpatient treatment after residential treatment, and other
approaches may be needed (e.g. providing recovery support services through the residential
provider) instead. This is a particularly important area for future research. Other states are being
limited to shorter (30-day) residential stays, on the assumption that people will step down to a
lower level of care following residential treatment.
Implementation of the DMC-ODS waiver is still unfolding, and by all accounts the DMC-ODS
waiver has required profound changes in practices and culture shifts that take time to develop.
UCLA will continue reporting evaluation results through December 2020.
Lessons Learned and Recommendations
Successful strategies were described in case studies on:
Recovery Support Services
Peer support specialists
Cross-system care coordination
Transitions of care from withdrawal management
Case management
Recommendations for DHCS and other states interested in
implementing a similar approach
Recommendation for other states:
Use patient perceptions of care/satisfaction surveys. One-page forms can be administered
successfully with good response rates, and counties and providers have found the survey
data to be helpful in informing their quality improvement efforts.
96
Provide technical assistance to counties early on in the demonstration regarding data to
be collected and submitted under the waiver (e.g., ASAM LOC, claims), monitor whether
the data are being submitted in a timely fashion, and give initial feedback to minimize
missing or inaccurate data.
Balance the minimum requirements for voluntary participation in the waiver against the
potential resulting exclusion of smaller, less populated areas.
Recommendations for DHCS
Re-institute the standard CalOMS-Tx reports that were available before the dataset
migrated to the BHIS system.
Re-initiate “CalOMS-Tx rewrite” efforts to better align CalOMS-Tx with the DMC-ODS
waiver (e.g. incorporation of ASAM LOCs to replace older treatment modalities).
Provide greater clarity on what activities are billable for recovery support services and
case management, and what documentation is needed.
o Providing lists of practices that have successfully been approved, as well as those
that have not, with the understanding that actual claim approval or denial depends
on the exact details of the implementation, would be a good start.
Explore legal and technical options (e.g. coordinating county and state website links to
boost the search rankings of valid county websites) to address non-county websites that
may be misleading beneficiaries into thinking they are county websites.
Promote screening for SUD in MH and PH settings and linkage to onsite or well-
coordinated SUD treatment for those who need it to increase treatment penetration rates.
Continue to address MAT stigma among providers.
Provide Technical Assistance on:
o Data collection and submission: Provide technical assistance to counties
regarding the data to be collected and submitted under the waiver (e.g., ASAM
LOC, claims), monitor whether the data are being submitted in a timely fashion,
and give initial feedback to minimize missing or inaccurate data.
o ASAM Criteria: Provide technical assistance to counties on how to implement
various aspects of the ASAM Criteria (e.g., brief screening, initial assessment,
follow-up assessment, treatment planning), including optional DHCS-approved
ASAM Criteria-based screening/assessment tools, and guidance for assessing
fidelity to the ASAM Criteria, while allowing room for flexibility to address each
county’s unique needs.
o How to assess fidelity to evidence-based practices.
o EHR systems (e.g., to incorporating ASAM Criteria-based assessments, ASAM
LOC data collection, billing, flag high utilizers).
o Development of memorandums of understanding (MOUs) to establish formal
collaborations for both BH and PH partners. Provide sample MOUs.

97
o Provide guidance and examples of 42 CFR-compliant Release of Information
forms to facilitate referrals and care coordination
o Examples from other counties that have systemized tracking referrals (that show
actual movement in EHRs) and other existing practices that have been helpful
o Provide clearer guidance and examples of case management and recovery support
service implementation from counties.
o A training curriculum for certifying staff in case management core competencies,
e.g. how much case management a patient should receive, how to approach
reimbursement for clients who have been assessed but not treated.
o ASAM criteria assessment for youth, and evidence-based practices for youth
treatment.
Interpretations, Policy Implications, and Interactions with Other State
Initiatives
There are a number of other efforts in California that might have an impact on specialty SUD
treatment. The endeavor most direct and likely to have an effect would be the extensive MAT
Expansion Project40 funded by SAMHSA’s State Targeted Response and State Opioid Response
grants. This enterprise would mainly have an impact on the treatment of opioid use disorder,
which may have played a role in the increased use of MAT, particularly the increase in
buprenorphine prescribing in Narcotic Treatment Program / Opioid Treatment Program settings,
in the state. Since the DMC-ODS waiver and the MAT Expansion Project share the goal of
making buprenorphine available, these complimentary efforts are difficult to disentangle. Still,
there is good evidence that the DMC-ODS waiver had an effect independent of other external
influences. This effect is demonstrated by the increase in DMC-ODS services delivered when
individual counties went live, even though counties went live in different months. Even if the
MAT Expansion Project or other efforts were having an overarching effect, there appeared to be
an independent effect of the DMC-ODS waiver. Likewise, when stakeholders were asked
directly about the effect of the DMC-ODS waiver on quality and care coordination, they
indicated that the DMC-ODS specifically had a positive impact. It is important that such data
continue to be collected in order to measure the effect of the waiver, both in California and in
other states that implement similar waivers.
40 http://www.californiamat.org/

98
Appendices