original article the conserved t cell receptor repertoire ... conserved t cell receptor repertoire...
TRANSCRIPT
Int J Clin Exp Med 2017;10(2):2053-2065www.ijcem.com /ISSN:1940-5901/IJCEM0041035
Original ArticleThe conserved T cell receptor repertoire observed in patients with systemic lupus erythematosus
Xianliang Hou1, Jianing Chen1, Chong Lu1, Lin Wang1, Wei Wu1, Yingfeng Wei1, Yulong Ding1, Ping Ye1, Yong Dai2, Hongyan Diao1
1State Key Laboratory for Diagnosis and Treatment of Infectious Diseases, Collaborative Innovation Center for Diagnosis and Treatment of Infectious Diseases, The First Affiliated Hospital, College of Medicine, Zhejiang Univer-sity, Hangzhou 310003, R. P. China; 2Clinical Medical Research Center, The Second Clinical Medical College of Jinan University (Shenzhen People’s Hospital), Shenzhen 518020, Guangdong, R. P. China
Received September 30, 2016; Accepted November 9, 2016; Epub February 15, 2017; Published February 28, 2017
Abstract: The T cell receptor (TCR) is critical for peptide/major histocompatibility (pMHC) recognition and sufficient diversity is required for recognition of the vast array of potential pathogens. Advances in next-generation sequenc-ing technology now permit interrogation of complex sequencing targets at unprecedented depth and reasonable cost. In this study, we used this high-throughput sequencing technology to study the repertoire of TCR beta chains in blood samples collected from a cohort of ten systemic lupus erythematosus (SLE) patients. SLE is a highly complex autoimmune disease, the various forms of which can affect people in different ways. We found that most individual T cell clones were present at very low frequencies, and there were only a small number of sequences that were highly shared among individual. However, the usage frequencies of individual nucleotides, amino acids and TCR beta (TRB)(V/J/D) gene segments within complementarity-determining region (CDR3) intervals were found to be remarkably consistent between individuals. Moreover, our data revealed similar insertion frequencies of individual nucleotides in the Vβ-Dβ and Dβ-Jβ junctions among the 10 patients, with terminal deoxynucleotidyl transferase (Tdt) bias towards the insertion of G and C bases over A and T. Overall, our findings indicate the existence of some conserved repertoire features associated with this complex disease. This information may useful in the design of future studies of human TCR gene recombination.
Keywords: Systemic lupus erythematosus, T cell receptor, high-throughput sequencing, repertoire feature
Introduction
Systemic lupus erythematosus (SLE) is an auto-immune disease that is characterized by mul- ti-organ involvement leading to significant mor-bidity and mortality, predominantly in young women [1]. The underlying pathogenesis invol- ves the emergence of autoreactive T and B ly- mphocytes, production of autoantibodies, and formation and deposition of immune complex-es in various tissues, leading to inflammation and organ damage [2]. The molecular basis of the impaired immune response in SLE is not clearly understood; however, abnormal T/B cell function and signaling appears to be pivotal to SLE pathogenesis. Several recent publica-tions support the hypothesis that disruption of the balance between positive and negative sig-naling molecules modifies T cell receptor/B-cell receptor (TCR/BCR) signaling thresholds. Such
alterations, together with other factors, may contribute to the breakdown of self-tolerance in this disease [3, 4]. TCR diversity is achieved centrally by rearrangement of Variable (V), Di- versity (D), and Joining (J) genes, deletion of germline-encoded bases and addition of non-template-encoded bases at complementari- ty-determining region 3 (CDR3) recombination junctions [5]. The unique characteristics of CDR3 in each different TCR gene rearrange-ment are crucial to the specificity of the anti- gen binding region. This structure varies in both length and sequence, allowing for the ability to recognize diverse antigens, although such variation must also be constrained to prevent the accumulation of poorly functional or autore-active TCRs [6].
The amino acid composition and sequences of the CDRs are hypervariable, with variation in
The conserved TCR repertoire observed in SLE patients
2054 Int J Clin Exp Med 2017;10(2):2053-2065
individual reaching 108-1011 [7]. This vast varia-tion in TCRs makes the repertoire particular- ly difficult to analyze. Recent developments in high-throughput immune receptor sequencing provide an opportunity for comprehensive eval-uation of T cell repertoires in an individual with an unprecedented degree of sensitivity and specificity [8]. Our previous studies have indi-cated remarkable consistency in the usage fre-quencies of individual nucleotides and amino acids within the CDR3 region among healthy individuals [9]. In this study, we used high-th- roughput immune receptor sequencing tech-nology to analyze the characteristics of the TCR repertoire in SLE patients and to deter-
mine the existence of a conserved repertoire in this complex disease.
Materials and methods
Patients and clinical samples
SLE was defined by the presence of four or more of the 1982 revised criteria [10]. The diagnosis of SLE was confirmed on the basis of pathological examinations and clinical evi-dence. This study was conducted in accordance with the tenets of the Declaration of Helsinki and was approved by the Ethics Committee of the First Affiliated Hospital, College of Me-
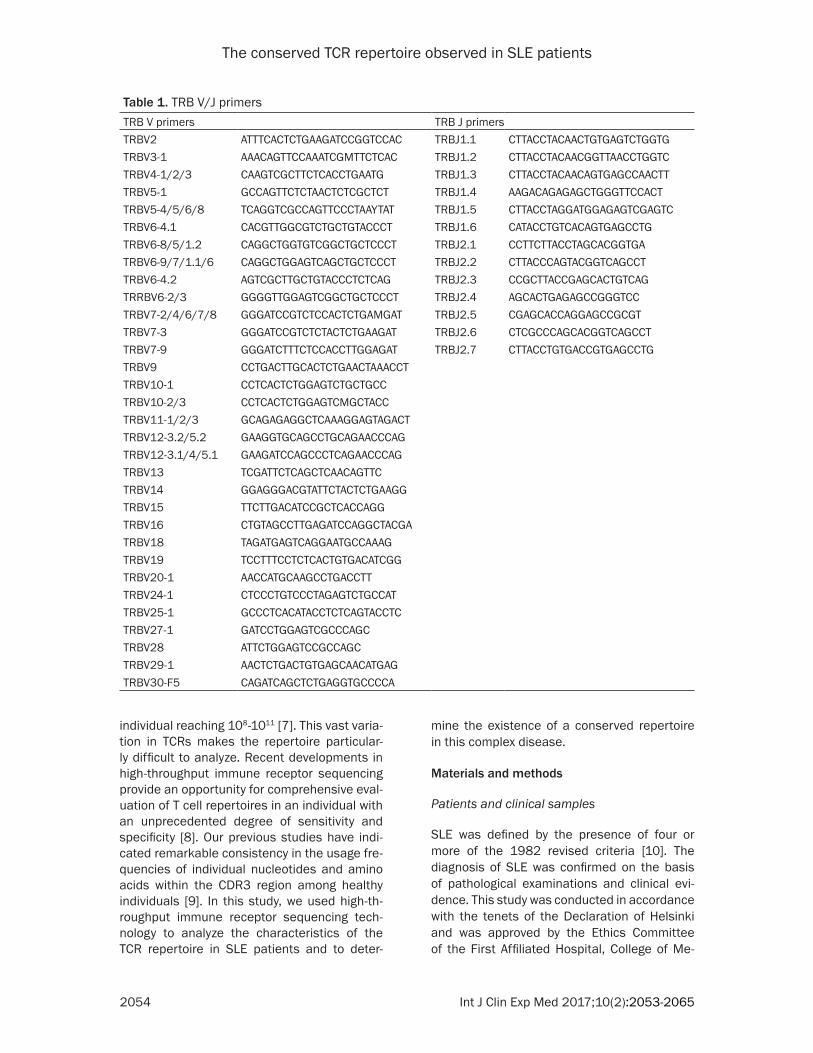
Table 1. TRB V/J primersTRB V primers TRB J primersTRBV2 ATTTCACTCTGAAGATCCGGTCCAC TRBJ1.1 CTTACCTACAACTGTGAGTCTGGTGTRBV3-1 AAACAGTTCCAAATCGMTTCTCAC TRBJ1.2 CTTACCTACAACGGTTAACCTGGTCTRBV4-1/2/3 CAAGTCGCTTCTCACCTGAATG TRBJ1.3 CTTACCTACAACAGTGAGCCAACTTTRBV5-1 GCCAGTTCTCTAACTCTCGCTCT TRBJ1.4 AAGACAGAGAGCTGGGTTCCACTTRBV5-4/5/6/8 TCAGGTCGCCAGTTCCCTAAYTAT TRBJ1.5 CTTACCTAGGATGGAGAGTCGAGTCTRBV6-4.1 CACGTTGGCGTCTGCTGTACCCT TRBJ1.6 CATACCTGTCACAGTGAGCCTGTRBV6-8/5/1.2 CAGGCTGGTGTCGGCTGCTCCCT TRBJ2.1 CCTTCTTACCTAGCACGGTGATRBV6-9/7/1.1/6 CAGGCTGGAGTCAGCTGCTCCCT TRBJ2.2 CTTACCCAGTACGGTCAGCCTTRBV6-4.2 AGTCGCTTGCTGTACCCTCTCAG TRBJ2.3 CCGCTTACCGAGCACTGTCAGTRRBV6-2/3 GGGGTTGGAGTCGGCTGCTCCCT TRBJ2.4 AGCACTGAGAGCCGGGTCCTRBV7-2/4/6/7/8 GGGATCCGTCTCCACTCTGAMGAT TRBJ2.5 CGAGCACCAGGAGCCGCGTTRBV7-3 GGGATCCGTCTCTACTCTGAAGAT TRBJ2.6 CTCGCCCAGCACGGTCAGCCTTRBV7-9 GGGATCTTTCTCCACCTTGGAGAT TRBJ2.7 CTTACCTGTGACCGTGAGCCTGTRBV9 CCTGACTTGCACTCTGAACTAAACCTTRBV10-1 CCTCACTCTGGAGTCTGCTGCCTRBV10-2/3 CCTCACTCTGGAGTCMGCTACCTRBV11-1/2/3 GCAGAGAGGCTCAAAGGAGTAGACTTRBV12-3.2/5.2 GAAGGTGCAGCCTGCAGAACCCAGTRBV12-3.1/4/5.1 GAAGATCCAGCCCTCAGAACCCAGTRBV13 TCGATTCTCAGCTCAACAGTTCTRBV14 GGAGGGACGTATTCTACTCTGAAGGTRBV15 TTCTTGACATCCGCTCACCAGGTRBV16 CTGTAGCCTTGAGATCCAGGCTACGATRBV18 TAGATGAGTCAGGAATGCCAAAGTRBV19 TCCTTTCCTCTCACTGTGACATCGGTRBV20-1 AACCATGCAAGCCTGACCTTTRBV24-1 CTCCCTGTCCCTAGAGTCTGCCATTRBV25-1 GCCCTCACATACCTCTCAGTACCTCTRBV27-1 GATCCTGGAGTCGCCCAGCTRBV28 ATTCTGGAGTCCGCCAGCTRBV29-1 AACTCTGACTGTGAGCAACATGAGTRBV30-F5 CAGATCAGCTCTGAGGTGCCCCA
The conserved TCR repertoire observed in SLE patients
2055 Int J Clin Exp Med 2017;10(2):2053-2065
dicine, Zhejiang University, China (Ref No 2015-313). All patients provided written in- formed consent to participation in this study. Peripheral blood samples were collected from 10 SLE patients (5 males and 5 females) with a mean age 34.12±11.33 years (range 20- 54 years). PBMCs were prepared from whole blood treated with 5 mL of fresh EDTA-K2 anti-coagulant by a Ficoll-Hypaque centrifugation method (Pharmacia Biotec, Roosendaal, The Netherlands) [11].
T cell isolation and DNA extraction
Peripheral blood T cells were isolated with anti-human CD3 magnetic beads (Miltenyi Biotec, Bergisch, Gladbach, Germany) according to the manufacturer’s protocol [12]. T cell purity was determined by flow cytometric analysis using phycoerythrin-labelled mouse anti-hu- man CD3- (BD Biosciences, San Jose, CA, USA) and was shown to be greater than 90% (data not shown). DNA was prepared from 0.5-2×10⁶ T cells from each sample, which was suffi- cient for analyzing TCR β-chain diversity. DNA was extracted from T cells using GenFIND DNA (Agencourt/Beckman Coulter, Brea, CA, USA) extraction kits following the manufacturer’s instructions.
Multiplex-PCR amplification of the TCR-β CDR3 region
The TCR-β CDR3 region was defined accord- ing to the criteria of the International Immu- nogenetics Collaboration [13]. According to this definition, the TCR-β CDR3 region starts at the second conserved cysteine encoded by the 3’ position of the Vβ gene segment and ends with the conserved phenylalanine encod-ed by the 5’ position of the Jβ gene segment. To generate a template library for analysis us- ing Genome Analyzer, a multiplex-PCR was de- signed to amplify rearranged TCR-β CDR3 re-
gions from genomic DNA using a set of 32 for-ward primers, each of which was specific to a functional TCR-Vβ segment, and 13 reverse primers, each specific to a TCR-Jβ segment (Table 1). The forward and reverse primers con-tained universal primer sequences at their 5’- ends, which were compatible with the Illumina GA2 cluster station solid-phase PCR. Each PCR mixture (50 μL) contained 1.0 μM VF pool (22 nM for each unique TCR Vβ F primer), 1.0 μM JR pool (77 nM for each unique TCRB JR primer), 1×QIAGEN Multiplex-PCR Master Mix, 10% Q solution (QIAGEN), and 16 ng/μL genomic DNA. Amplification was performed on a PCR Express thermal cycler (Hybaid) with the following ther-mal cycling conditions: 1 cycle at 95°C for 15 min, 30 cycles at 94°C for 30 s, 59°C for 30 s, and 72°C for 1 min, followed by 1 cycle at 72°C for 10 min [14]. To sample millions of rearranged TCR CDR3 loci, 12 to 20 replicates of PCR were performed for each library. After amplification and separation by agarose gel electrophoresis, PCR products were purified using a QIAquick PCR Purification Kit. The final library was quantified in two ways: by deter- mining the average molecule length using an Agilent 2100 Bioanalyzer (Agilent DNA 1000 Reagents) and by real-time quantitative PCR (qPCR; TaqMan Probe). Libraries were amplified using cBot to generate clusters on the flow cell, and an amplified flow cell was pair-end se- quenced using a HiSeq2000 instrument, gen-erally using a read length of 100 base pairs (bp).
High-throughput sequencing and data analysis
PCR products were sequenced using an Illu- mina Genome Analyzer. The quality of HiSeq sequencing scores ranged from 0 to 40 and was used in the criteria for filtering out low-quality reads. The relationship between sequ- encing error rate (E) and sequencing quality (sQ) was calculated by the following formula:
10
1
sQ
EYY
Y e
loglog10
10 log10sQ
1 EE
=-
=+
=
#
-
-
#
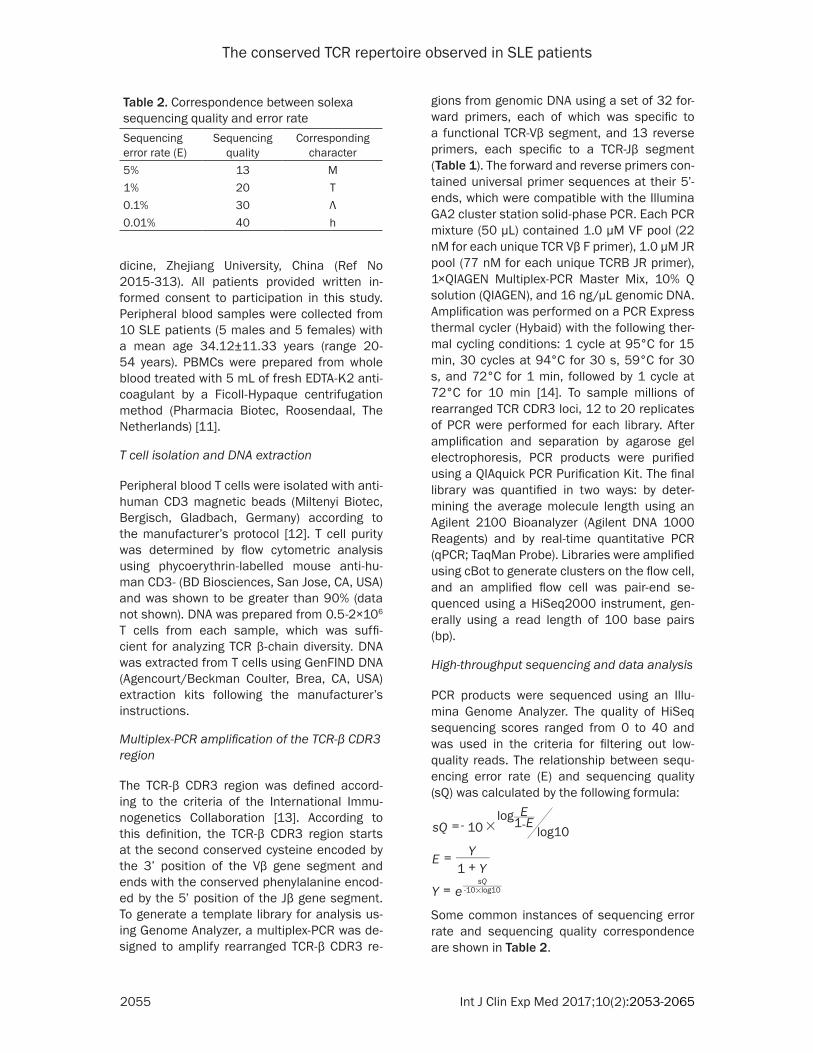
Some common instances of sequencing error rate and sequencing quality correspondence are shown in Table 2.
Table 2. Correspondence between solexa sequencing quality and error rateSequencing error rate (E)
Sequencing quality
Corresponding character
5% 13 M1% 20 T0.1% 30 Λ0.01% 40 h
The conserved TCR repertoire observed in SLE patients
2056 Int J Clin Exp Med 2017;10(2):2053-2065
First, we filtered the raw data to obtain high-quality reads and exclude adapter contamina-tion. Reads with an average quality score lower than 15 (this score corresponds to a sequenc-ing error rate of 3% based on the Illumina 0-41 quality system) were removed, and a threshold for the proportion of N bases was set as less than 5% (sequences with higher values were removed). Next, a few bases with low quality (lower than 10) were trimmed; the quality score was expected to be greater than 15 after trim-ming and the remaining sequence length was expected to be greater than 60 nt. After filter-ing, paired-end read pairs were merged into a single contig sequence in the following two steps: (1) by assessing the identity of align-ments of tail regions of two sequences or sequences with at least 10 bp overlap and at least 90% bp match in the overlapping section and assessing the identity (using software de- veloped by BGI, COPE v1.1.3); and (2) by analyz-ing sequences of different lengths (including
those consisting of less than 10 bp) amplified by the different primers and merging these se- quences by aligning the initial sequence (using software developed by BGI, FqMerger). In this manner, merged contig sequences and a leng- th distribution plot were obtained.
Alignments were generated using the MiTCR program (developed by MiLaboratory; http://mitcr.milaboratory.com/downloads/), which in- cludes an automated adjustment mechanism for errors that are introduced by sequencing and PCR and provides statistical data for the alignments, such as CDR3 expression and indel (insertion and deletion) mutations. After align-ment, the following method was used for struc-tural analysis of the sequence: (1) the number of each nucleotide and the proportion at each position was analyzed; (2) according to the final position of the V gene, the start and end posi-tions of the D gene and J genes after alignment were determined and indel mutations intro-duced during V(D)J recombination were identi-fied; and (3) nucleotides were translated into amino acids. The frequency of expression for each clone was determined based on the iden-tity of each sequence after alignment. The fre-quency of expression of each distinct DNA se- quence, amino acid sequence, and V-J combi-nation was also identified. The diversity of the TCR repertoire was calculated based on the Simpson index of diversity (Ds) [15] and the Shannon-Wiener index (H’) [16].
Statistical analysis
Statistical significance was calculated using the paired t tests using SPSS20. P values <0.05 were considered significant.
Table 3. TCRβ sequence statistics
Sample Total reads
Filter rate (%)
All reads number
Total input sequences
Total good sequences
Out of frame clones (%)
CDR3 nt sequences
CDR3 aa sequences
CDR3 V-J combination
SLE-1 15034759 6.24 14096902 12698851 2699974 26.64 15364 14946 664SLE-2 17086270 7.48 15807907 15192082 7653178 34.82 35853 34276 905SLE-3 22098712 5.21 20947794 20516588 8807590 34.82 44876 43279 954SLE-4 16157165 5.51 15266865 14783745 6977374 31.3 30983 29333 890SLE-5 20153955 4.15 19317370 18957254 8602909 38.11 57826 55335 1126SLE-6 24450455 5.46 23115862 22455249 19471160 41.14 146709 138743 1543SLE-7 20369506 7.17 18908501 18595467 15756186 37.33 36484 33725 824SLE-8 26990070 5.58 25482762 24992352 19154970 38.99 101560 96779 1366SLE-9 20325020 5.37 19233897 10833315 7426451 37.32 22678 21593 693SLE-10 26316047 5.62 24837260 24320205 18827755 37.62 79411 74246 1301
Table 4. TCR repertoire diversity was calcu-lated based on the Simpson index of diversity (Ds)Sample Shannon-Weiner indexSLE-1 7.68SLE-2 8.17SLE-3 8.79SLE-4 6.86SLE-5 8.83SLE-6 9.62SLE-7 7.31SLE-8 9.53SLE-9 8.29SLE-10 6.77
The conserved TCR repertoire observed in SLE patients
2057 Int J Clin Exp Med 2017;10(2):2053-2065
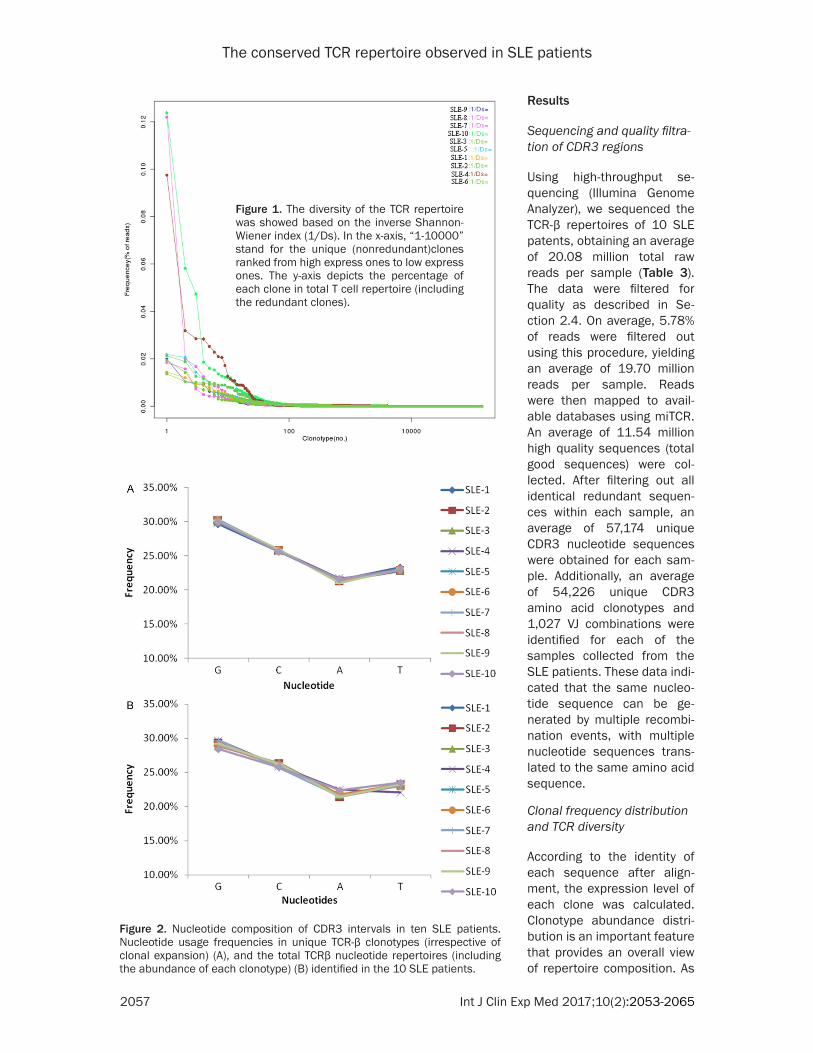
Figure 1. The diversity of the TCR repertoire was showed based on the inverse Shannon-Wiener index (1/Ds). In the x-axis, “1-10000” stand for the unique (nonredundant)clones ranked from high express ones to low express ones. The y-axis depicts the percentage of each clone in total T cell repertoire (including the redundant clones).
Results
Sequencing and quality filtra-tion of CDR3 regions
Using high-throughput se- quencing (Illumina Genome Analyzer), we sequenced the TCR-β repertoires of 10 SLE patents, obtaining an average of 20.08 million total raw reads per sample (Table 3). The data were filtered for quality as described in Se- ction 2.4. On average, 5.78% of reads were filtered out using this procedure, yielding an average of 19.70 million reads per sample. Reads were then mapped to avail-able databases using miTCR. An average of 11.54 million high quality sequences (total good sequences) were col-lected. After filtering out all identical redundant sequen- ces within each sample, an average of 57,174 unique CDR3 nucleotide sequences were obtained for each sam-ple. Additionally, an average of 54,226 unique CDR3 amino acid clonotypes and 1,027 VJ combinations were identified for each of the samples collected from the SLE patients. These data indi-cated that the same nucleo-tide sequence can be ge- nerated by multiple recombi-nation events, with multiple nucleotide sequences trans-lated to the same amino acid sequence.
Clonal frequency distribution and TCR diversity
According to the identity of each sequence after align-ment, the expression level of each clone was calculated. Clonotype abundance distri-bution is an important feature that provides an overall view of repertoire composition. As
Figure 2. Nucleotide composition of CDR3 intervals in ten SLE patients. Nucleotide usage frequencies in unique TCR-β clonotypes (irrespective of clonal expansion) (A), and the total TCRβ nucleotide repertoires (including the abundance of each clonotype) (B) identified in the 10 SLE patients.
The conserved TCR repertoire observed in SLE patients
2058 Int J Clin Exp Med 2017;10(2):2053-2065
we know, the high abundance clones may be the result of physiological responses to envi-ronmental antigens or pathogens. The expres-sion abundance of each individual clone was based on its unique CDR3 sequence frequency within a sample. Through statistical analysis, we found that clonotype abundance varied from one to a maximum of 2329265. In this study, we defined clones with a frequency of more than 0.1% of the analyzed TCR to be high abundance clones. Only 0.12% (range 0.02%-0.31%) of the clones was expanded beyond this value. To quantify the TCR diversity of the SLE patients, we used the Shannon-Wiener index (H’) to evaluate their total expression profile (Table 4), we ranked all clones from high ex- press ones to low express ones and plotted into one scatter plot (Figure 1). As we anticipat-ed, the expression of less-diverse cases fall rapidly while normal samples fall more gently.
found 3 CDR3 DNA (~1.77×10⁻³% of all nucleo-tide sequences) and 4 amino acid sequences (~3.86×10⁻³% of all amino acid sequences) that were shared by all 10 SLE patients [12].
Sequence composition of the CDR3 regions
The patterns of nucleotide composition, amino acid usage in CDR3 intervals, and T cell re- ceptor beta (TRB) locus (V/J/D) gene segment usage frequencies provide an overall view of repertoire composition. First, to avoid distor-tion of the dataset by dominant clones that had expanded as a consequence of an im- mune response, each unique CDR3 sequen- ce was counted as ‘1’, irrespective of the num-ber of copies detected on examination of re- pertoire composition patterns. The usage fre-quency of individual nucleotides and amino acids of CDR3 intervals were remarkably con-
Patterns of CDR3 sequence sharing among subjects
Moreover, public T-cell re- sponses, in which T cells bearing identical TCRs are observed to dominate the response to the same anti-genic epitope in multiple in- dividuals, have long been a focus of immune T-cell reper-toire studies. In this study, after data integration of ten samples, about 5.43× 10⁵ unique (nonredundant) nucleotide sequences were obtained, which correspond-ed to about 4.99×10⁵ unique (nonredundant) TCR amino acid sequences. We found that most of the CDR3 nucleo-tide sequences (~95.49% of all nucleotide sequences) and amino acid sequences (~93.15% of all amino acid sequences) were found in only one subject. There is only a small number of se- quences that were highly shared among individual; 11 DNA sequences and 30 amino acid sequences were shared by >80% (n>8) of the SLE patients. Notably, we
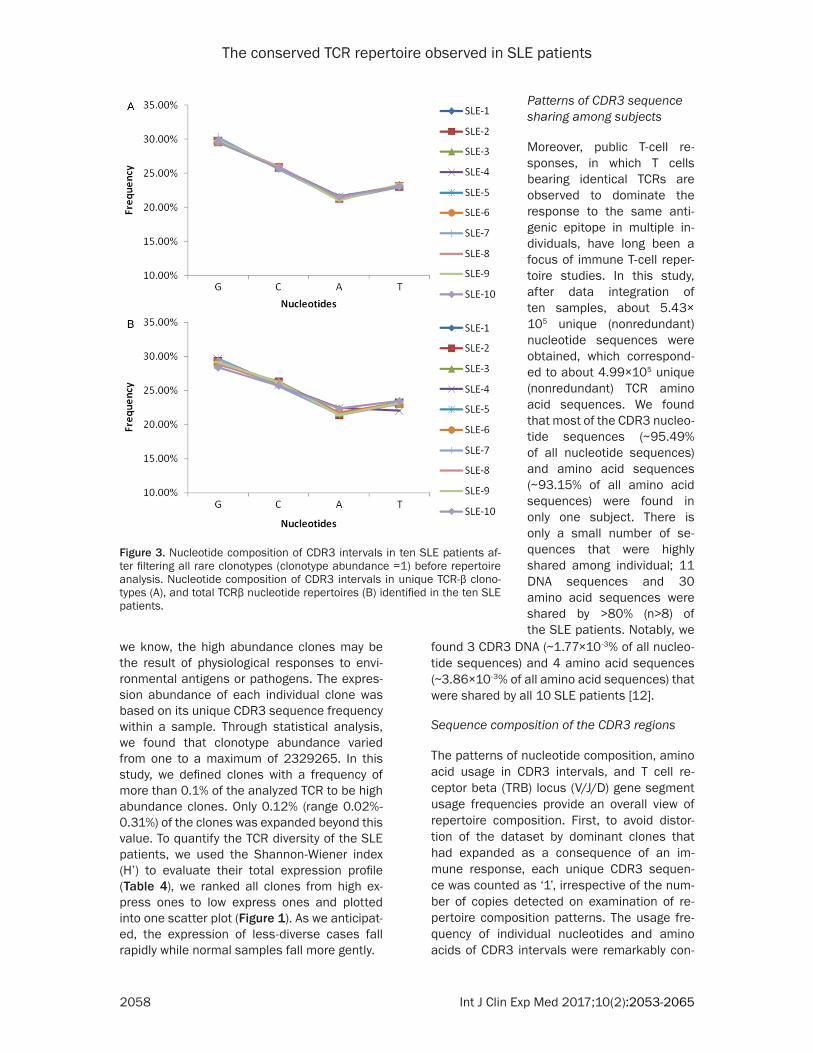
Figure 3. Nucleotide composition of CDR3 intervals in ten SLE patients af-ter filtering all rare clonotypes (clonotype abundance =1) before repertoire analysis. Nucleotide composition of CDR3 intervals in unique TCR-β clono-types (A), and total TCRβ nucleotide repertoires (B) identified in the ten SLE patients.
The conserved TCR repertoire observed in SLE patients
2059 Int J Clin Exp Med 2017;10(2):2053-2065
sistent between individuals (Figure 2A). The nucleotide frequencies of G (Guanine), C (cyto-sine), T (thymine) and A (adenine) accounted for 30.00%, 25.72%, 22.92%, and 21.35% of all nucleotides, respectively. Rare clonotypes, which were detected as single copies (clono-type abundance =1), are potentially artifactual
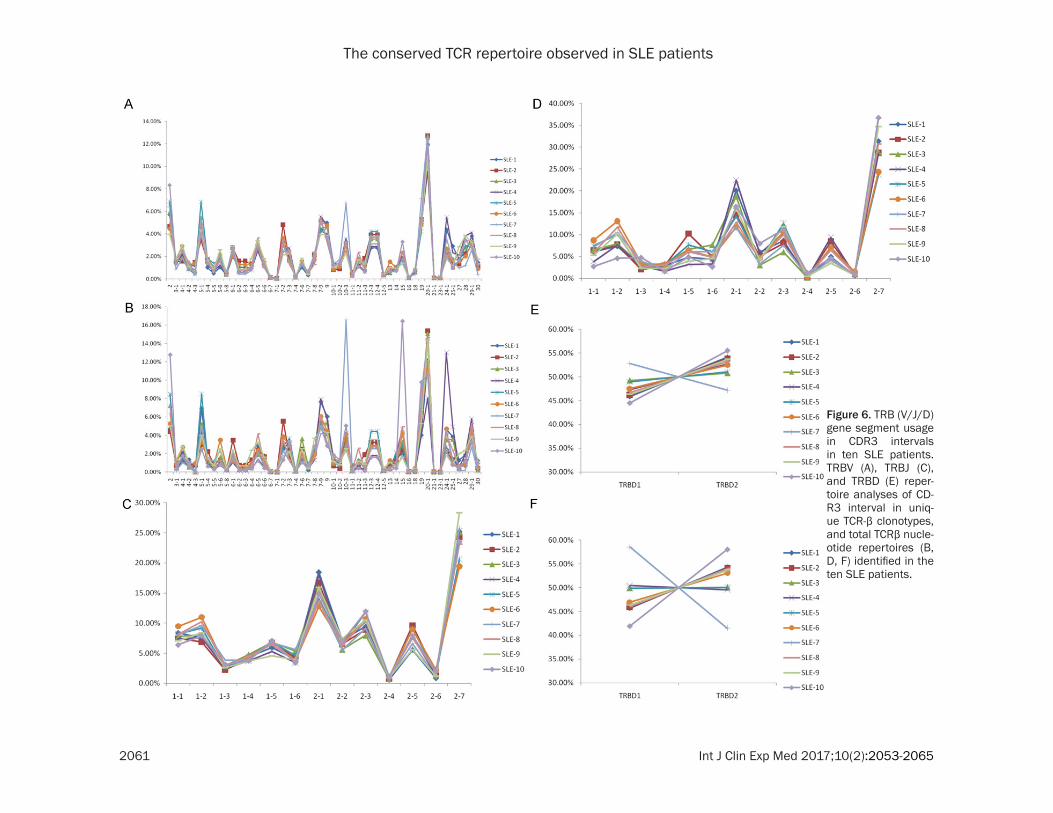
were also similar among individuals. In terms of the degree of TRBV usage (Figure 6A), TRBV20-1 (11.79%), TRBV2 (5.79%), TRBV19 (5.18%), TRBV5-1 (4.79%), and TRBV7-9 (4.77%) showed higher usage, while TRBV23-1 (0.14%), TRBV6-7 (0.13%), TRBV16 (0.10%), TRBV21-1 (0.09), and TRBV7-1 (0.03%) showed significantly lower
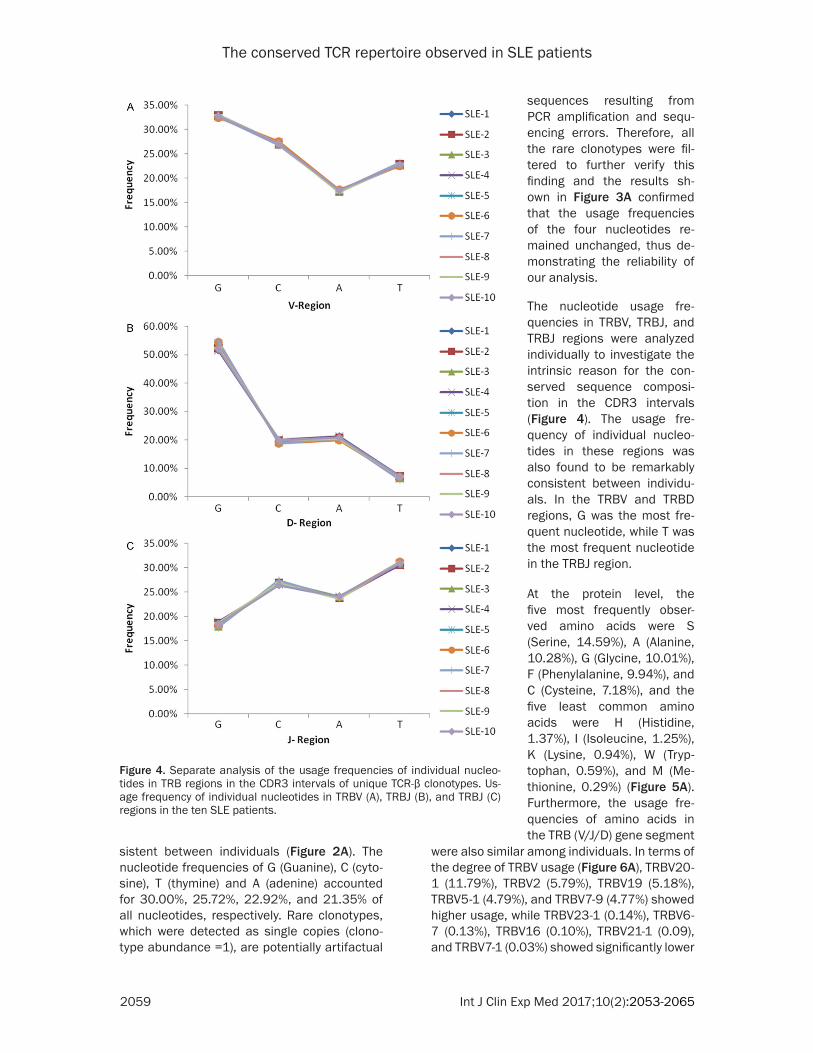
Figure 4. Separate analysis of the usage frequencies of individual nucleo-tides in TRB regions in the CDR3 intervals of unique TCR-β clonotypes. Us-age frequency of individual nucleotides in TRBV (A), TRBJ (B), and TRBJ (C) regions in the ten SLE patients.
sequences resulting from PCR amplification and sequ- encing errors. Therefore, all the rare clonotypes were fil-tered to further verify this finding and the results sh- own in Figure 3A confirmed that the usage frequencies of the four nucleotides re- mained unchanged, thus de- monstrating the reliability of our analysis.
The nucleotide usage fre-quencies in TRBV, TRBJ, and TRBJ regions were analyzed individually to investigate the intrinsic reason for the con-served sequence composi-tion in the CDR3 intervals (Figure 4). The usage fre- quency of individual nucleo-tides in these regions was also found to be remarkably consistent between individu-als. In the TRBV and TRBD regions, G was the most fre-quent nucleotide, while T was the most frequent nucleotide in the TRBJ region.
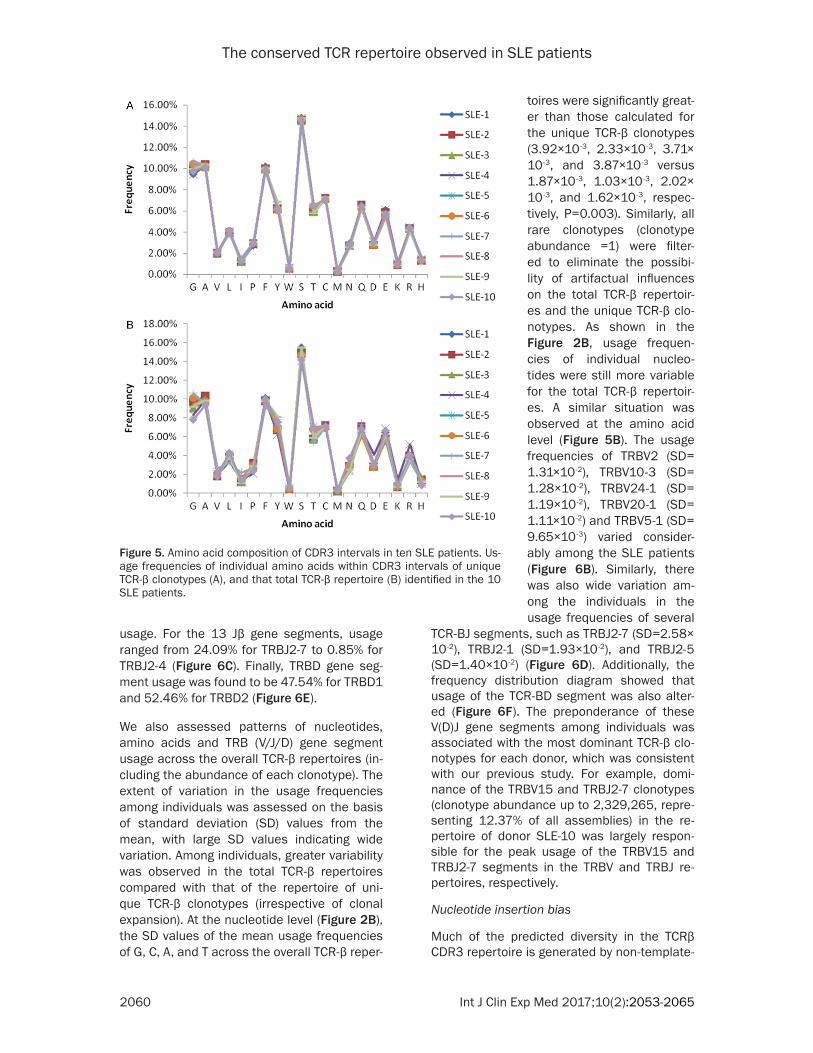
At the protein level, the five most frequently obser- ved amino acids were S (Serine, 14.59%), A (Alanine, 10.28%), G (Glycine, 10.01%), F (Phenylalanine, 9.94%), and C (Cysteine, 7.18%), and the five least common amino acids were H (Histidine, 1.37%), I (Isoleucine, 1.25%), K (Lysine, 0.94%), W (Tryp- tophan, 0.59%), and M (Me- thionine, 0.29%) (Figure 5A). Furthermore, the usage fre-quencies of amino acids in the TRB (V/J/D) gene segment
The conserved TCR repertoire observed in SLE patients
2060 Int J Clin Exp Med 2017;10(2):2053-2065
usage. For the 13 Jβ gene segments, usage ranged from 24.09% for TRBJ2-7 to 0.85% for TRBJ2-4 (Figure 6C). Finally, TRBD gene seg-ment usage was found to be 47.54% for TRBD1 and 52.46% for TRBD2 (Figure 6E).
We also assessed patterns of nucleotides, amino acids and TRB (V/J/D) gene segment usage across the overall TCR-β repertoires (in- cluding the abundance of each clonotype). The extent of variation in the usage frequencies among individuals was assessed on the basis of standard deviation (SD) values from the mean, with large SD values indicating wide variation. Among individuals, greater variability was observed in the total TCR-β repertoires compared with that of the repertoire of uni- que TCR-β clonotypes (irrespective of clonal expansion). At the nucleotide level (Figure 2B), the SD values of the mean usage frequencies of G, C, A, and T across the overall TCR-β reper-
TCR-BJ segments, such as TRBJ2-7 (SD=2.58× 10⁻²), TRBJ2-1 (SD=1.93×10 -2), and TRBJ2-5 (SD=1.40×10⁻²) (Figure 6D). Additionally, the frequency distribution diagram showed that usage of the TCR-BD segment was also alter- ed (Figure 6F). The preponderance of these V(D)J gene segments among individuals was associated with the most dominant TCR-β clo-notypes for each donor, which was consistent with our previous study. For example, domi-nance of the TRBV15 and TRBJ2-7 clonotypes (clonotype abundance up to 2,329,265, repre-senting 12.37% of all assemblies) in the re- pertoire of donor SLE-10 was largely respon- sible for the peak usage of the TRBV15 and TRBJ2-7 segments in the TRBV and TRBJ re- pertoires, respectively.
Nucleotide insertion bias
Much of the predicted diversity in the TCRβ CDR3 repertoire is generated by non-template-
Figure 5. Amino acid composition of CDR3 intervals in ten SLE patients. Us-age frequencies of individual amino acids within CDR3 intervals of unique TCR-β clonotypes (A), and that total TCR-β repertoire (B) identified in the 10 SLE patients.
toires were significantly great-er than those calculated for the unique TCR-β clonotypes (3.92×10⁻³, 2.33×10⁻³, 3.71× 10⁻³, and 3.87×10⁻³ versus 1.87×10⁻³, 1.03×10⁻³, 2.02× 10⁻³, and 1.62×10⁻³, respec-tively, P=0.003). Similarly, all rare clonotypes (clonotype abundance =1) were filter- ed to eliminate the possibi- lity of artifactual influences on the total TCR-β repertoir- es and the unique TCR-β clo-notypes. As shown in the Figure 2B, usage frequen- cies of individual nucleo- tides were still more variable for the total TCR-β repertoir- es. A similar situation was observed at the amino acid level (Figure 5B). The usage frequencies of TRBV2 (SD= 1.31×10⁻²), TRBV10-3 (SD= 1.28×10⁻²), TRBV24-1 (SD= 1.19×10⁻²), TRBV20-1 (SD= 1.11×10⁻²) and TRBV5-1 (SD= 9.65×10⁻³) varied consider-ably among the SLE patients (Figure 6B). Similarly, there was also wide variation am- ong the individuals in the usage frequencies of several
The conserved TCR repertoire observed in SLE patients
2061 Int J Clin Exp Med 2017;10(2):2053-2065
Figure 6. TRB (V/J/D) gene segment usage in CDR3 intervals in ten SLE patients. TRBV (A), TRBJ (C), and TRBD (E) reper-toire analyses of CD- R3 interval in uniq- ue TCR-β clonotypes, and total TCRβ nucle-otide repertoires (B, D, F) identified in the ten SLE patients.
The conserved TCR repertoire observed in SLE patients
2062 Int J Clin Exp Med 2017;10(2):2053-2065
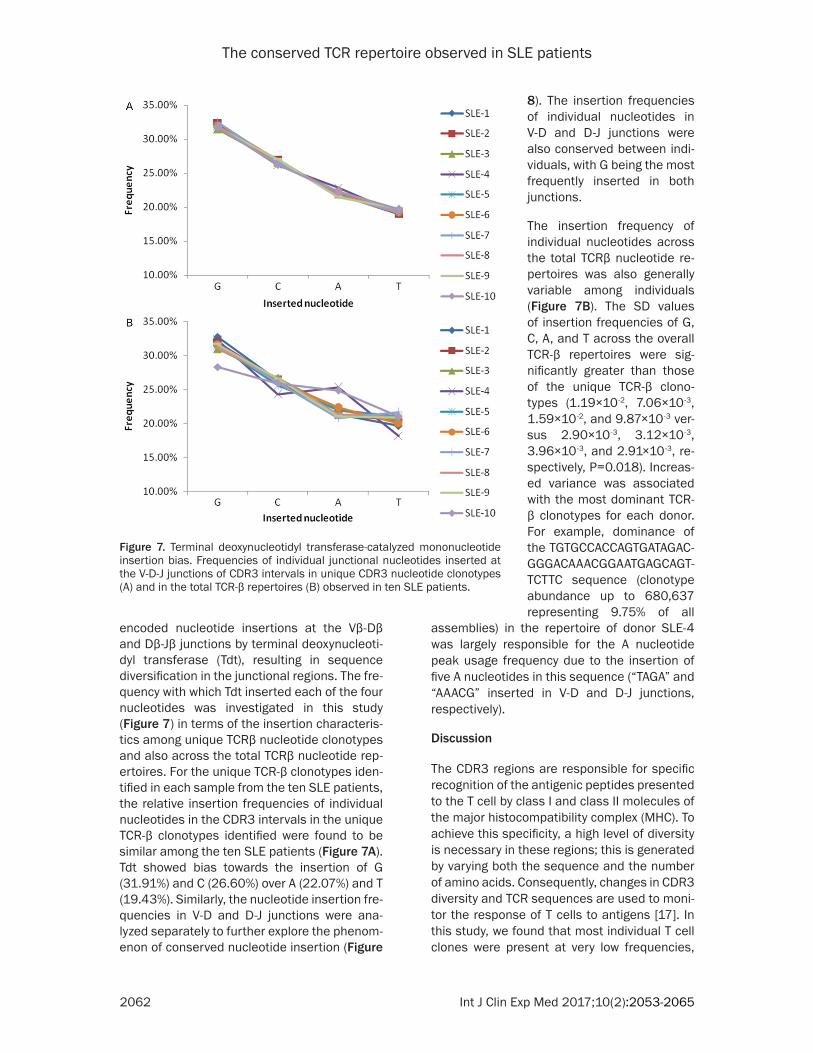
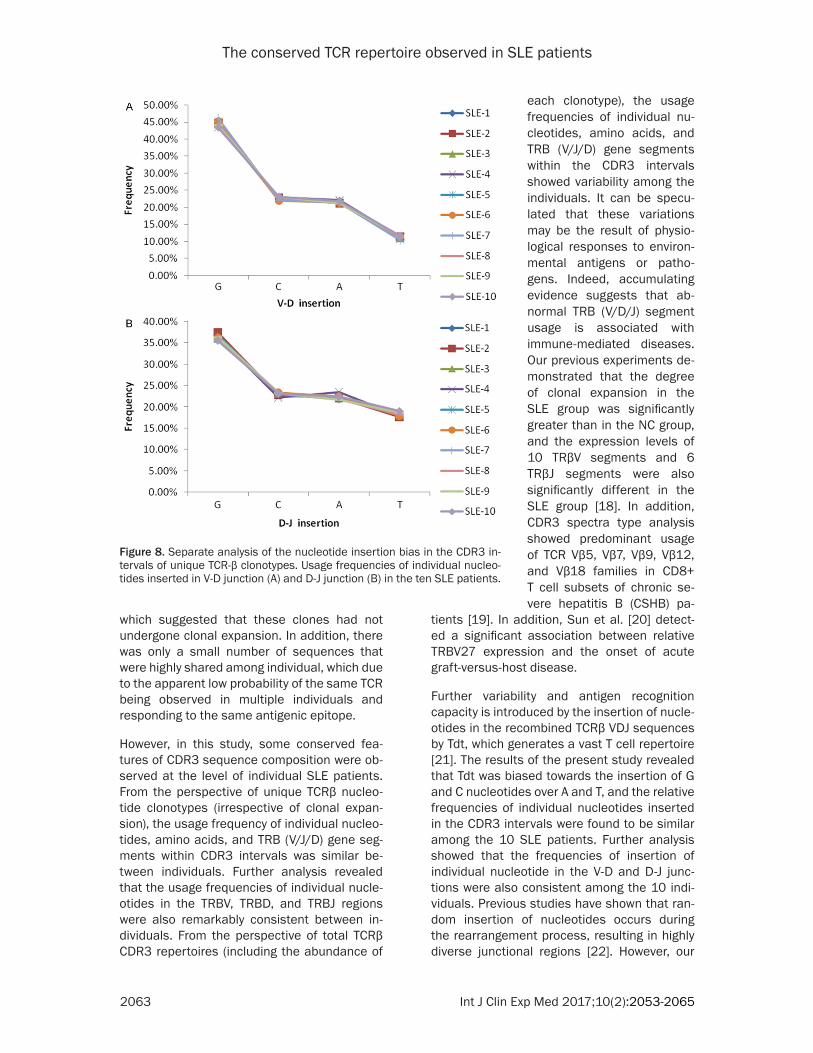
encoded nucleotide insertions at the Vβ-Dβ and Dβ-Jβ junctions by terminal deoxynucleoti-dyl transferase (Tdt), resulting in sequence diversification in the junctional regions. The fre-quency with which Tdt inserted each of the four nucleotides was investigated in this study (Figure 7) in terms of the insertion characteris-tics among unique TCRβ nucleotide clonotypes and also across the total TCRβ nucleotide rep-ertoires. For the unique TCR-β clonotypes iden-tified in each sample from the ten SLE patients, the relative insertion frequencies of individual nucleotides in the CDR3 intervals in the unique TCR-β clonotypes identified were found to be similar among the ten SLE patients (Figure 7A). Tdt showed bias towards the insertion of G (31.91%) and C (26.60%) over A (22.07%) and T (19.43%). Similarly, the nucleotide insertion fre-quencies in V-D and D-J junctions were ana-lyzed separately to further explore the phenom-enon of conserved nucleotide insertion (Figure
assemblies) in the repertoire of donor SLE-4 was largely responsible for the A nucleotide peak usage frequency due to the insertion of five A nucleotides in this sequence (“TAGA” and “AAACG” inserted in V-D and D-J junctions, respectively).
Discussion
The CDR3 regions are responsible for specific recognition of the antigenic peptides presented to the T cell by class I and class II molecules of the major histocompatibility complex (MHC). To achieve this specificity, a high level of diversity is necessary in these regions; this is generated by varying both the sequence and the number of amino acids. Consequently, changes in CDR3 diversity and TCR sequences are used to moni-tor the response of T cells to antigens [17]. In this study, we found that most individual T cell clones were present at very low frequencies,
Figure 7. Terminal deoxynucleotidyl transferase-catalyzed mononucleotide insertion bias. Frequencies of individual junctional nucleotides inserted at the V-D-J junctions of CDR3 intervals in unique CDR3 nucleotide clonotypes (A) and in the total TCR-β repertoires (B) observed in ten SLE patients.
8). The insertion frequencies of individual nucleotides in V-D and D-J junctions were also conserved between indi-viduals, with G being the most frequently inserted in both junctions.
The insertion frequency of individual nucleotides across the total TCRβ nucleotide re- pertoires was also generally variable among individuals (Figure 7B). The SD values of insertion frequencies of G, C, A, and T across the overall TCR-β repertoires were sig- nificantly greater than those of the unique TCR-β clono-types (1.19×10⁻², 7.06×10⁻³, 1.59×10⁻², and 9.87×10⁻³ ver-sus 2.90×10⁻³, 3.12×10⁻³, 3.96×10⁻³, and 2.91×10⁻³, re- spectively, P=0.018). Increas- ed variance was associated with the most dominant TCR- β clonotypes for each donor. For example, dominance of the TGTGCCACCAGTGATAGAC- GGGACAAACGGAATGAGCAGT- TCTTC sequence (clonotype abundance up to 680,637 representing 9.75% of all
The conserved TCR repertoire observed in SLE patients
2063 Int J Clin Exp Med 2017;10(2):2053-2065
which suggested that these clones had not undergone clonal expansion. In addition, there was only a small number of sequences that were highly shared among individual, which due to the apparent low probability of the same TCR being observed in multiple individuals and responding to the same antigenic epitope.
However, in this study, some conserved fea-tures of CDR3 sequence composition were ob- served at the level of individual SLE patients. From the perspective of unique TCRβ nucleo-tide clonotypes (irrespective of clonal expan-sion), the usage frequency of individual nucleo-tides, amino acids, and TRB (V/J/D) gene seg-ments within CDR3 intervals was similar be- tween individuals. Further analysis revealed that the usage frequencies of individual nucle- otides in the TRBV, TRBD, and TRBJ regions were also remarkably consistent between in- dividuals. From the perspective of total TCRβ CDR3 repertoires (including the abundance of
tients [19]. In addition, Sun et al. [20] detect- ed a significant association between relative TRBV27 expression and the onset of acute graft-versus-host disease.
Further variability and antigen recognition capacity is introduced by the insertion of nucle-otides in the recombined TCRβ VDJ sequences by Tdt, which generates a vast T cell repertoire [21]. The results of the present study revealed that Tdt was biased towards the insertion of G and C nucleotides over A and T, and the relative frequencies of individual nucleotides inserted in the CDR3 intervals were found to be similar among the 10 SLE patients. Further analysis showed that the frequencies of insertion of individual nucleotide in the V-D and D-J junc-tions were also consistent among the 10 indi-viduals. Previous studies have shown that ran-dom insertion of nucleotides occurs during the rearrangement process, resulting in highly diverse junctional regions [22]. However, our
Figure 8. Separate analysis of the nucleotide insertion bias in the CDR3 in-tervals of unique TCR-β clonotypes. Usage frequencies of individual nucleo-tides inserted in V-D junction (A) and D-J junction (B) in the ten SLE patients.
each clonotype), the usage frequencies of individual nu- cleotides, amino acids, and TRB (V/J/D) gene segments within the CDR3 intervals showed variability among the individuals. It can be specu-lated that these variations may be the result of physio-logical responses to environ-mental antigens or patho-gens. Indeed, accumulating evidence suggests that ab- normal TRB (V/D/J) segment usage is associated with immune-mediated diseases. Our previous experiments de- monstrated that the degree of clonal expansion in the SLE group was significantly greater than in the NC group, and the expression levels of 10 TRβV segments and 6 TRβJ segments were also significantly different in the SLE group [18]. In addition, CDR3 spectra type analysis showed predominant usage of TCR Vβ5, Vβ7, Vβ9, Vβ12, and Vβ18 families in CD8+ T cell subsets of chronic se- vere hepatitis B (CSHB) pa-
The conserved TCR repertoire observed in SLE patients
2064 Int J Clin Exp Med 2017;10(2):2053-2065
study shows conflicting results, but in accor-dance with the study of Robins et al. that also described a similar Tdt mononucleotide inser-tion bias [14]. Although biased insertion of nucleotides was not observed at the level of individual CDR3 sequences, this phenomenon was clearly observed at the level of the individ-ual man/women (or, more accurately, a sam-ple). Although the mechanism responsible for biased insertion remains to be established, we speculate that it is related to Tdt function, or biased selection in favor of the insertion of par-ticular nucleotides in the context of the inter- actions between the TCR and MHC-peptide complexes.
Our previous research demonstrated the exis-tence of conserved features in the TCR reper-toire of ten healthy individuals [9]. These con-served features were also identified in SLE patients in the present study. SLE is a complex autoimmune disorder characterized by multi-organ involvement. Based on our findings, it appears that the TCR repertoire may not be a vast and chaotic morass, but rather a pat-terned and perhaps predictable system, indi- cting the existence of novel rearrangement mechanisms that remain to be discovered. Although our understanding of the TCR reper-toire remains incomplete, next-generation se- quencing technologies provide data with an unprecedented level of specificity and sensi- tivity, which will revolutionize the study of im- mune repertoires.
Acknowledgements
This work was supported by funds received from the National Natural Science Found- ation of China (No. 81271810, 81571953), the National Basic Research Program (2013- CB531405), Zhejiang Provincial Natural Sci- ence Foundation of China (LY16H190002). Zhejiang medical science and technology pro- ject (2015118507).
Disclosure of conflict of interest
None.
Abbreviations
TCR, T cell receptors; TRBV, T cell receptor beta variable; TRBJ, T cell Receptor beta Joining; TRBD, T cell receptor beta diversity; MHC, major
histocompatibility complex; CDR, complemen-tarity-determining region; V, variable; D, diver-sity; J, joining; PBMC, peripheral blood mono-nuclear cell; Ds, Simpson index of diversity; H’, Shannon-Wiener index; HEC, highly expanded clone; Tdt, terminal deoxynucleotidyl transfer-ase; indel, insertion and deletion.
Address correspondence to: Hongyan Diao, State Key Laboratory for Diagnosis and Treatment of In- fectious Diseases, Collaborative Innovation Center for Diagnosis and Treatment of Infectious Diseas- es, The First Affiliated Hospital, College of Medi- cine, Zhejiang University, Hangzhou 310003, R. P. China. E-mail: [email protected]; Yong Dai, Clinical Medical Research Center, The Second Clinical Me- dical College of Jinan University (Shenzhen People’s Hospital), Shenzhen 518020, Guangdong, R. P. China. E-mail: [email protected]
References
[1] Sui W, Hou X, Che W, Yang M, Dai Y. The ap-plied basic research of systemic lupus erythe-matosus based on the biological omics. Genes Immun 2013; 14: 133-46.
[2] Sjowall C, Bengtsson T, Skogh T. CRP and anti-CRP autoantibodies in systemic lupus ery- thematosus. Current Rheumatology Reviews 2016; 1: 81-89.
[3] Huck S, Le Corre R, Youinou P, Zouali M. Expression of B cell receptor-associated sig-naling molecules in human lupus. Autoim- munity 2001; 33: 213-24.
[4] Choudhury A, Mukherjee P, Basu SK, George A, Rath S, Bal V. Disruption of T cell tolerance to self-Immunoglobulin causes polyclonal B cell stimulation followed by inactivation of responding autoreactive T cells. J Immunol 2000; 164: 1713-21.
[5] Freeman JD, Warren RL, Webb JR, Nelson BH, Holt RA. Profiling the T-cell receptor beta-chain repertoire by massively parallel sequencing. Genome Res 2009; 19: 1817-24.
[6] Larimore K, McCormick MW, Robins HS, Greenberg PD. Shaping of human germline IgH repertoires revealed by deep sequencing. J Immunol 2012; 189: 3221-30.
[7] Arstila TP, Casrouge A, Baron V, Even J, Kanellopoulos J, Kourilsky P. Diversity of hu-man alpha beta T cell receptors. Science 2000; 288: 1135.
[8] Hou XL, Wang L, Ding YL, Xie Q, Diao HY. Current status and recent advances of next generation sequencing techniques in immuno-logical repertoire. Genes Immun 2016; 17: 153-164.
The conserved TCR repertoire observed in SLE patients
2065 Int J Clin Exp Med 2017;10(2):2053-2065
[9] Hou X, Lu C, Chen S, Xie Q, Cui G, Chen J, Chen Z, Wu Z, Ding Y, Ye P, Dai Y, Diao H. High throughput sequencing of T cell antigen re- ceptors reveals a conserved TCR repertoire. Medicine (Baltimore) 2016; 95: e2839.
[10] Tan EM, Cohen AS, Fries JF, Masi AT, McShane DJ, Rothfield NF, Schaller JG, Talal N, Win- chester RJ. The 1982 revised criteria for the classification of systemic lupus erythemato-sus. Arthritis Rheum 1982; 25: 1271-1277.
[11] VanderBorght A, Geusens P, Vandevyver C, Raus J, Stinissen P. Skewed T-cell receptor variable gene usage in the synovium of early and chronic rheumatoid arthritis patients and persistence of clonally expanded T cells in a chronic patient. Rheumatology (Oxford) 2000; 39: 1189-1201.
[12] Dziubianau M, Hecht J, Kuchenbecker L, Sattler A, Stervbo U, Rödelsperger C, Nickel P, Neumann AU, Robinson PN, Mundlos S, Volk HD, Thiel A, Reinke P, Babel N. TCR repertoire analysis by next generation sequencing allows complex differential diagnosis of T cell-related pathology. Am J Transplant 2013; 13: 2842-2854.
[13] Yousfi Monod M, Giudicelli V, Chaume D, Lefranc MP. IMGT/Junction Analysis: the first tool for the analysis of the immunoglobulin and T cell receptor complex V-J and V-D-J JUNCTIONs. Bioinformatics 2004; 20: 379-385.
[14] Robins HS, Campregher PV, Srivastava SK, Wacher A, Turtle CJ, Kahsai O, Riddell SR, Warren EH, Carlson CS. Comprehensive as-sessment of T-cell receptor beta-chain diversi-ty in alphabeta T cells. Blood 2009; 114: 4099-4107.
[15] Venturi V, Kedzierska K, Turner SJ, Doherty PC, Davenport MP. Methods for comparing the diversity of samples of the T cell receptor rep-ertoire. J Immunol Methods 2007; 321:182-95.
[16] Keylock CJ. Simpson diversity and the Shan- non-Wiener index as special cases of a gener-alized entropy. Oikos 2005; 109: 203-207.
[17] Xu JL, Davis MM. Diversity in the CDR3 region of V(H) is sufficient for most antibody specifici-ties. Immunity 2000; 13: 37-45.
[18] Sui W, Hou X, Zou G, Che W, Yang M, Zheng C, Liu F, Chen P, Wei X, Lai L, Dai Y. Composi- tion and variation analysis of the TCR β-chain CDR3 repertoire in systemic lupus erythemato-sus using high-throughput sequencing. Mol Immunol 2015; 67: 455-464.
[19] Xiong Y, Tan Y, Song YG. Analysis of T cell re-ceptor Vβ diversity in peripheral CD4+ and CD8+ T lymphocytes obtained from patients with chronic severe hepatitis B. Hepat Mon 2014; 14: e15900.
[20] Sun L, Ren H, Liu W, Wang L, Yin Y, Li Y, Ma X, Qiu Z, Cen X, Shi Y. TRBV kinetics and its asso-ciation with HLA disparity and aGVHD following allogeneic hematopoietic stem cell transplan-tation. Int J Lab Hematol 2013; 35:119-127.
[21] Meier J, Roberts C, Avent K, Hazlett A, Berrie J, Payne K, Hamm D, Desmarais C, Sanders C, Hogan KT, Archer KJ, Manjili MH, Toor AA. Fractal organization of the human T cell reper-toire in health and after stem cell transplanta-tion. Biol Blood Marrow Transplant 2013; 19: 366-77.
[22] Cabaniols JP, Fazilleau N, Casrouge A, Kourilsky P, Kanellopoulos JM. Most alpha/beta T cell receptor diversity is due to terminal deoxynu-cleotidyl transferase. J Exp Med 2001; 194: 1385-90.