original igt published: 1991 - spib.org home · •test 2 grades, in each of 3 sizes...
TRANSCRIPT


• Original IGT Published: 1991
• Monitoring: 1994-2010
• Destructive Testing: 2011
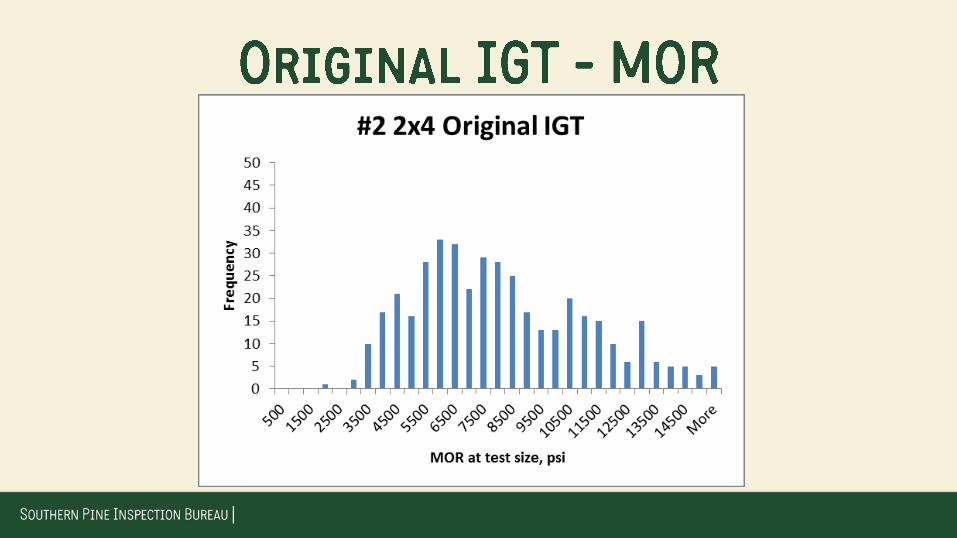
– #2 2x4
– MOE, MOR, UTS
• Significant decreases observed
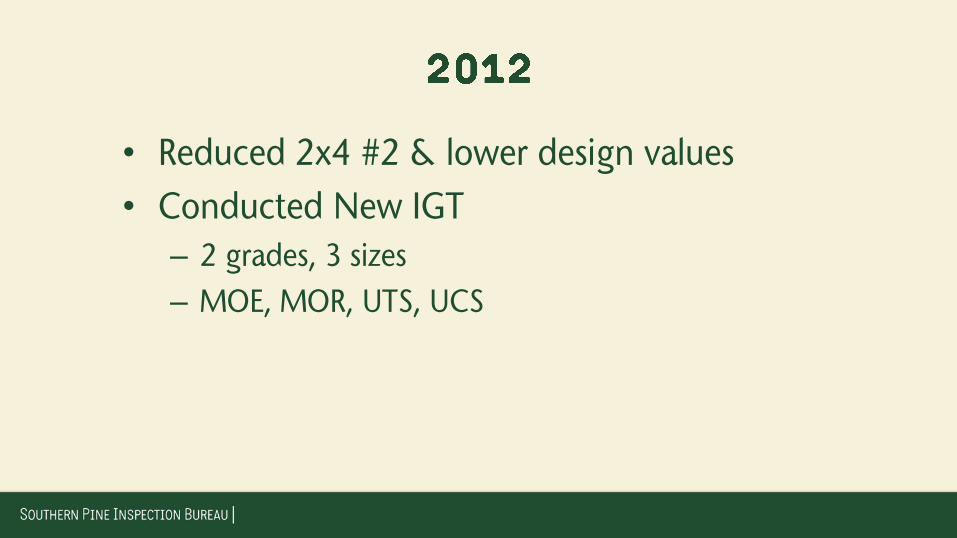
• Reduced 2x4 #2 & lower design values
• Conducted New IGT
– 2 grades, 3 sizes
– MOE, MOR, UTS, UCS

• New design values published
• Monitoring:
– #1 2x6 in 2013
– #2 2x4 in 2014

• Test 2 grades, in each of 3 sizes
• Nondestructively evaluate stiffness (MOE)
• Destructively test for:
– Bending Strength (MOR)
– Tension Strength (UTS)
– Compression Parallel to Grain (UCS)

• Mills assigned to one of 16 homogeneous Southern Pine growing regions
• Includes SPIB and TP mills
• Randomly select mills in proportion to regional production
• Target sample size: 360 pieces per “cell”
• Test 10-12 pieces from each selected mill

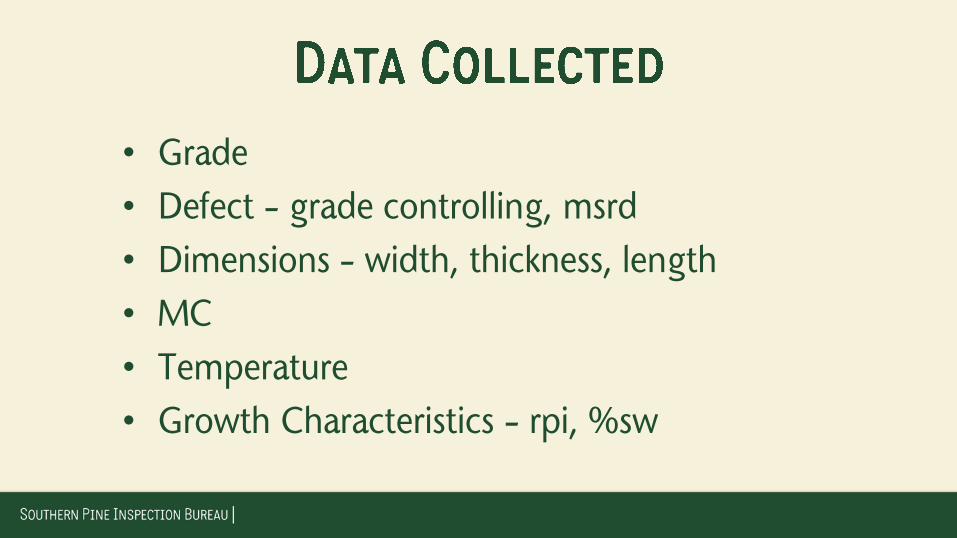
• Grade
• Defect – grade controlling, msrd
• Dimensions – width, thickness, length
• MC
• Temperature
• Growth Characteristics – rpi, %sw
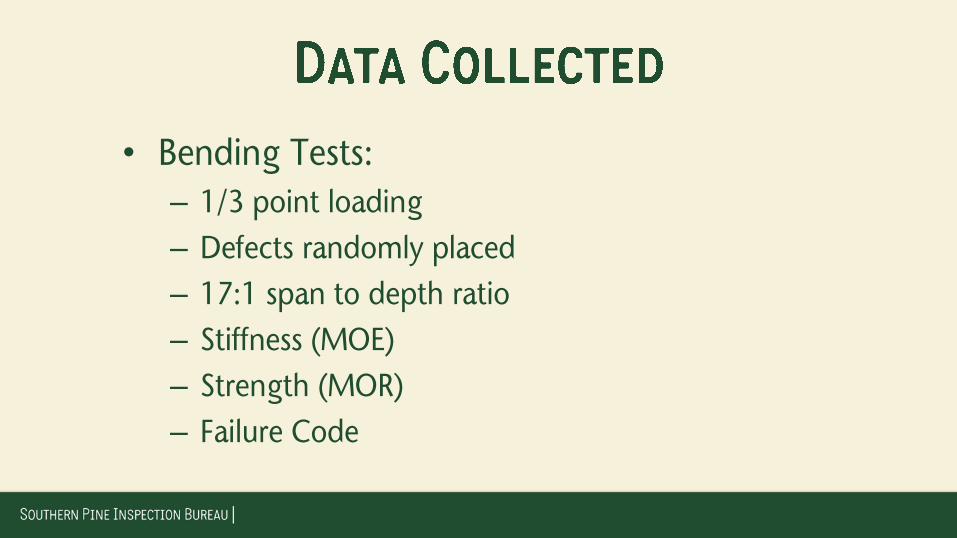
• Bending Tests:
– 1/3 point loading
– Defects randomly placed
– 17:1 span to depth ratio
– Stiffness (MOE)
– Strength (MOR)
– Failure Code

• Tension tests
– Tested for bending stiffness prior to UTS
– 8’ gauge length between grips
– Failure Code
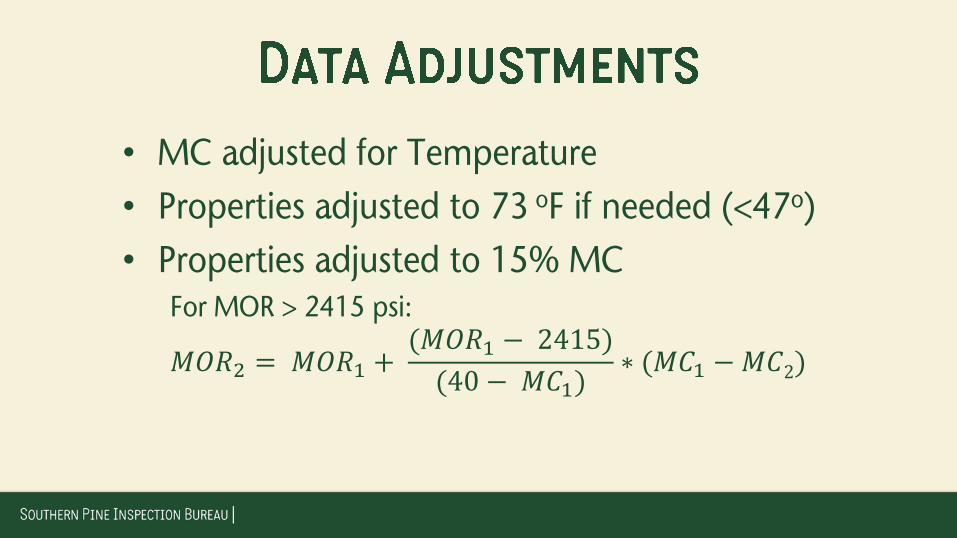
• MC adjusted for Temperature
• Properties adjusted to 73 oF if needed (<47o)
• Properties adjusted to 15% MC For MOR > 2415 psi:
𝑀𝑂𝑅2 = 𝑀𝑂𝑅1 + (𝑀𝑂𝑅1 − 2415)
(40 − 𝑀𝐶1)∗ (𝑀𝐶1 − 𝑀𝐶2)
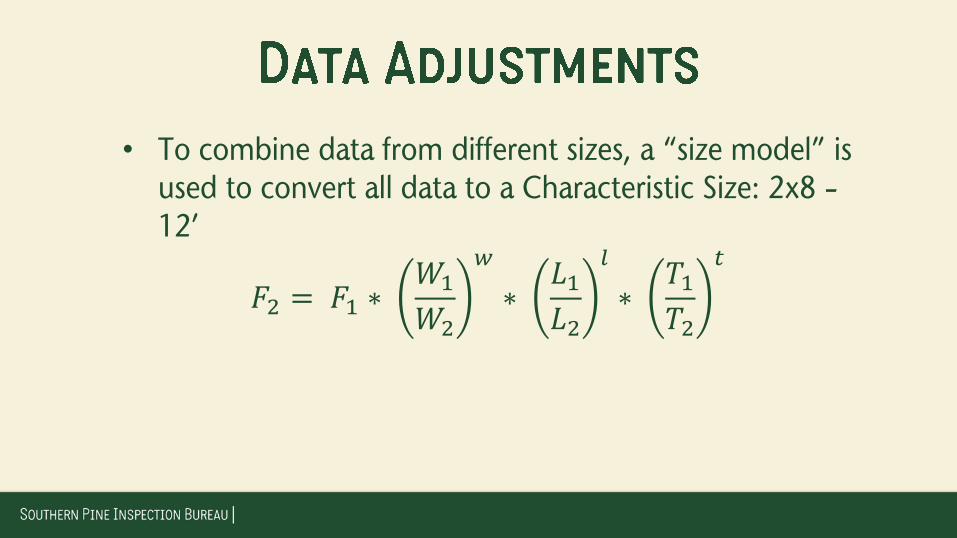
• To combine data from different sizes, a “size model” is used to convert all data to a Characteristic Size: 2x8 – 12’
𝐹2 = 𝐹1 ∗ 𝑊1
𝑊2
𝑤
∗ 𝐿1
𝐿2
𝑙
∗ 𝑇1
𝑇2
𝑡
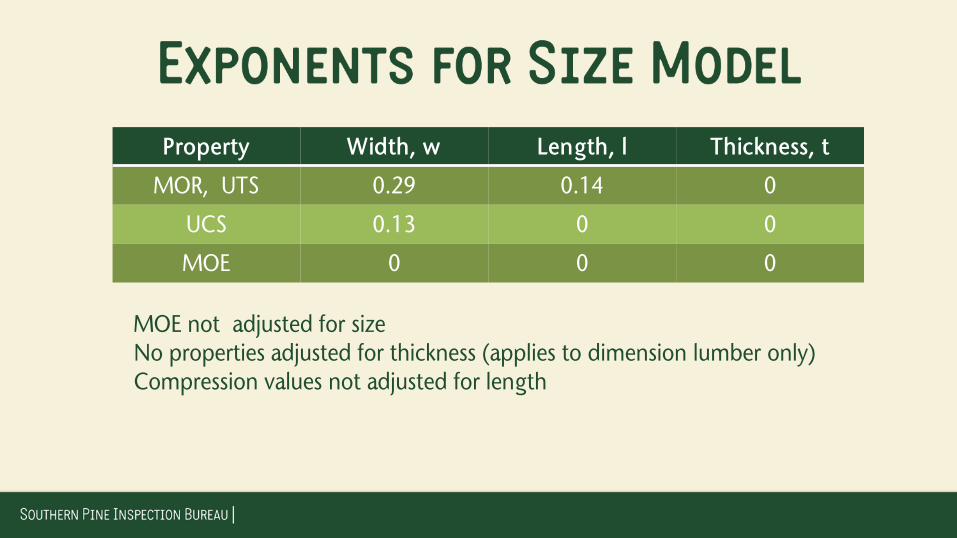
Property Width, w Length, l Thickness, t
MOR, UTS 0.29 0.14 0
UCS 0.13 0 0
MOE 0 0 0
MOE not adjusted for size No properties adjusted for thickness (applies to dimension lumber only) Compression values not adjusted for length
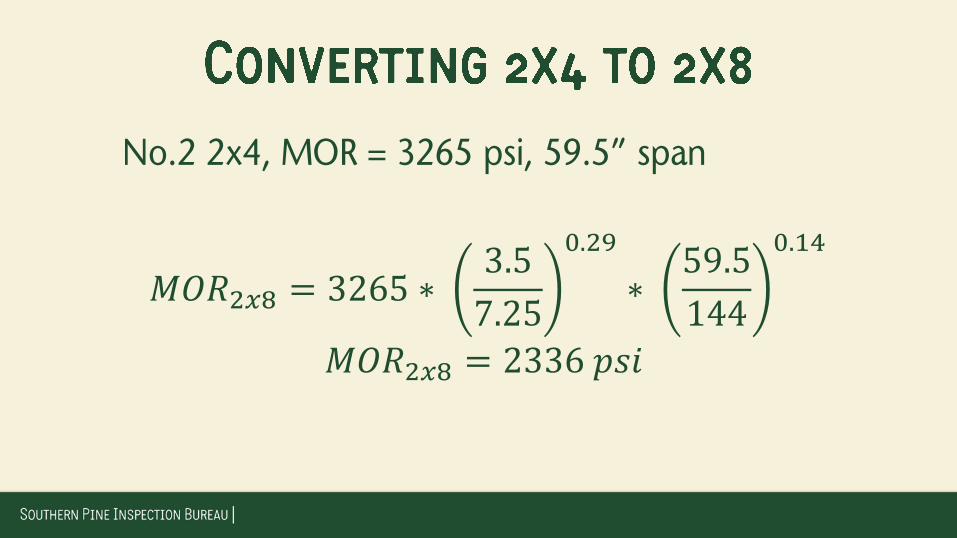
No.2 2x4, MOR = 3265 psi, 59.5” span
𝑀𝑂𝑅2𝑥8 = 3265 ∗ 3.5
7.25
0.29
∗ 59.5
144
0.14
𝑀𝑂𝑅2𝑥8 = 2336 𝑝𝑠𝑖
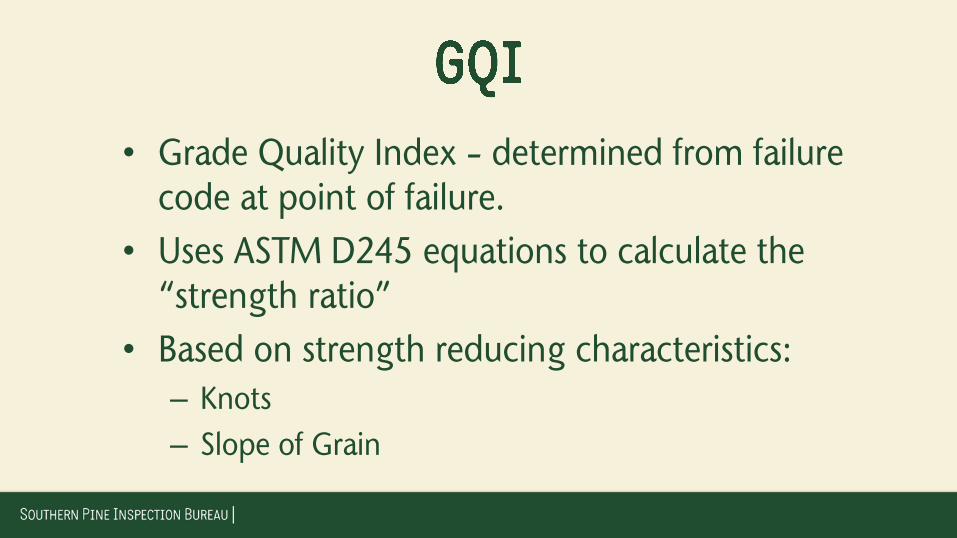
• Grade Quality Index – determined from failure code at point of failure.
• Uses ASTM D245 equations to calculate the “strength ratio”
• Based on strength reducing characteristics:
– Knots
– Slope of Grain
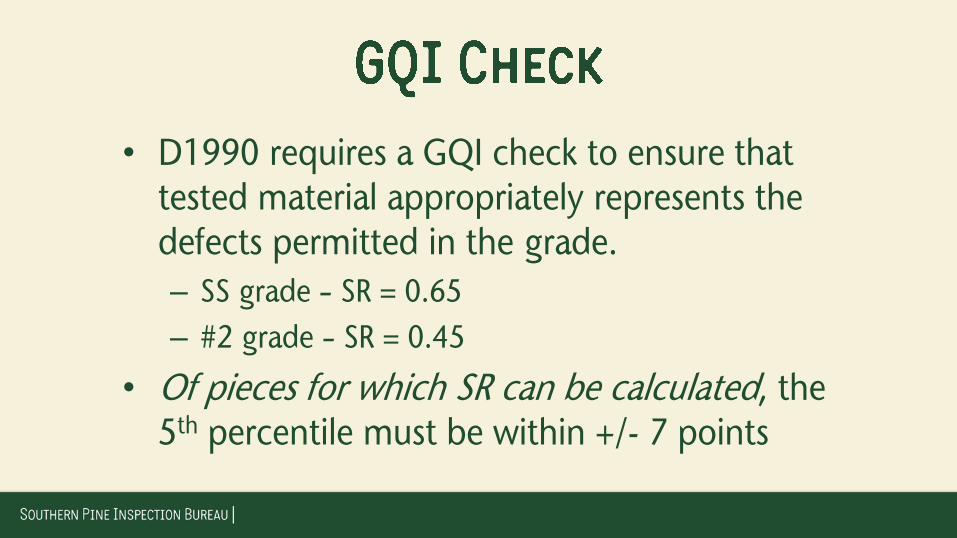
• D1990 requires a GQI check to ensure that tested material appropriately represents the defects permitted in the grade.
– SS grade – SR = 0.65
– #2 grade – SR = 0.45
• Of pieces for which SR can be calculated, the 5th percentile must be within +/- 7 points
• We do not assume a “normal” (or any other) statistical distribution.
• Use “order statistics” to estimate values of interest.
• Permits analysis without actually breaking every piece.

• Rank order all data from lowest to highest.
• (5% * sample size) is approximately the order statistic of the 5th percentile “point estimate”.
• Example: 100 pieces broken in bending. Use the 5th weakest piece to estimate the 5th percentile.
• ASTM D1990 uses the 75% confidence tolerance limit on the 5th percentile.
• Uses data from a piece weaker than actual 5th percentile “point estimate”.
• Provides increased confidence that true 5th percentile is equal to or greater than our estimate.

• Using strength ratios, values for untested grades may be estimated.
• Tested grades:
– SS with strength ratio of 0.65
– #2 with strength ratio of 0.45
• Untested Grades:
– #1 (SR = 0.55), #3 (SR = 0.26), etc.
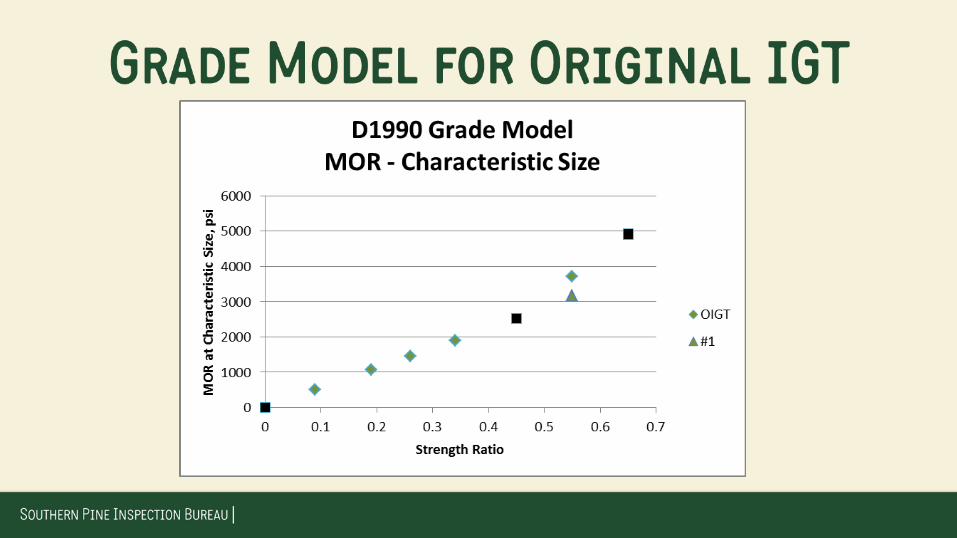
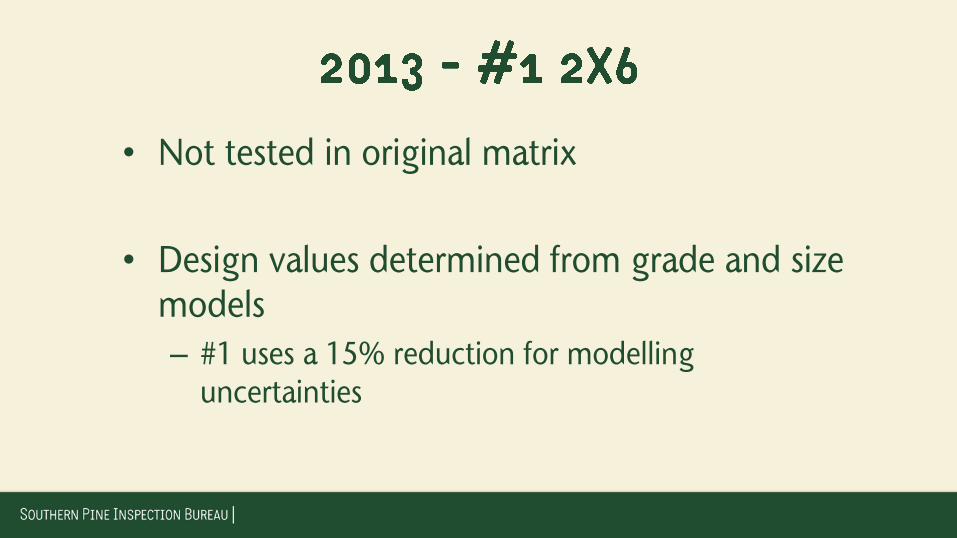
• Not tested in original matrix
• Design values determined from grade and size models
– #1 uses a 15% reduction for modelling uncertainties

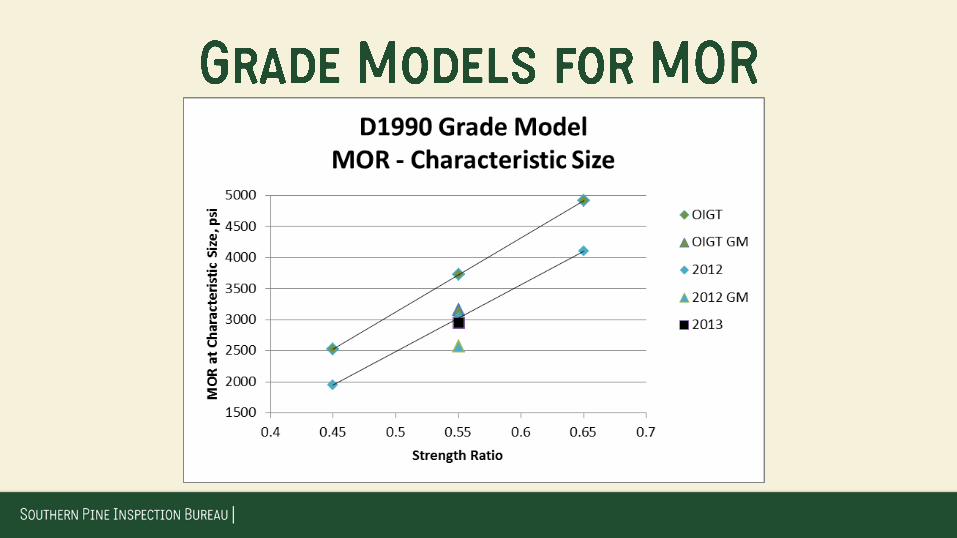
2012 Published Values:
Fb= 1350 psi, E = 1.6 million psi
Year n Avg. MC
Avg E (21:1)
MOR TL Corresp.
DV Avg SG
2013 361 14.0 1.61 3400 1432 0.54
“Corresponding Design Value” is based on cell data, converted to published length (12’) and includes 2.1 factor of safety.
• The #1 2x6 test data supports the D1990 grade and size models used to assign #1 2x6 bending design values.
• The #1 2x6 test results are in line with the design value reductions taken in 2012.


• SPIB Grading Rules 103.1
• On one end or the other:
– 6 rpi and 33% sw OR
– 4 rpi and 50% sw
• Historical IGT and RMP data only had growth info on GM end


Sample n Avg MC Avg E (21:1)
MOR TL (psi)
Corresp. DV
SPG
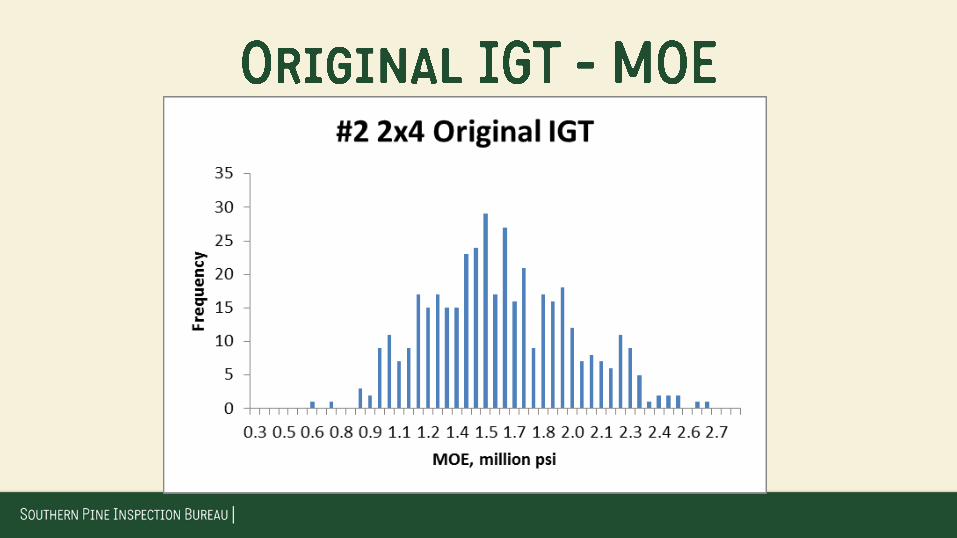
Original IGT
413 14.2 1.56 3621 1524
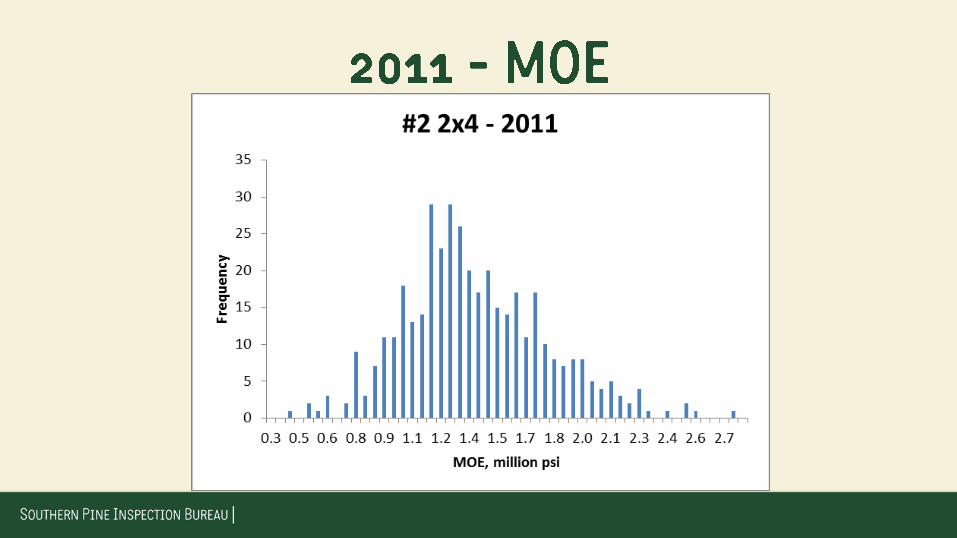
2011 409 11.2 1.33 2547 1071 0.51

• 2014 revisions to D1990 include a statistical test to compare samples
• Compares the entire distribution – not tails
• Wilcoxon test uses sum of ranks
• Data is combined from two sets and ranked
• Sum of ranks from each set is compared

Use the sum of the ranks to calculate a Z-value:
𝑍 =
𝑆𝑢𝑚𝑅𝑎𝑛𝑘 + 12
− 𝑚 ∗𝑁 + 1
2
𝑚 ∗ 𝑛 ∗ (𝑁 + 1)12
Where m = sample size corresponding to SumRank
n = sample size from other sample
N = total sample size (m + n)
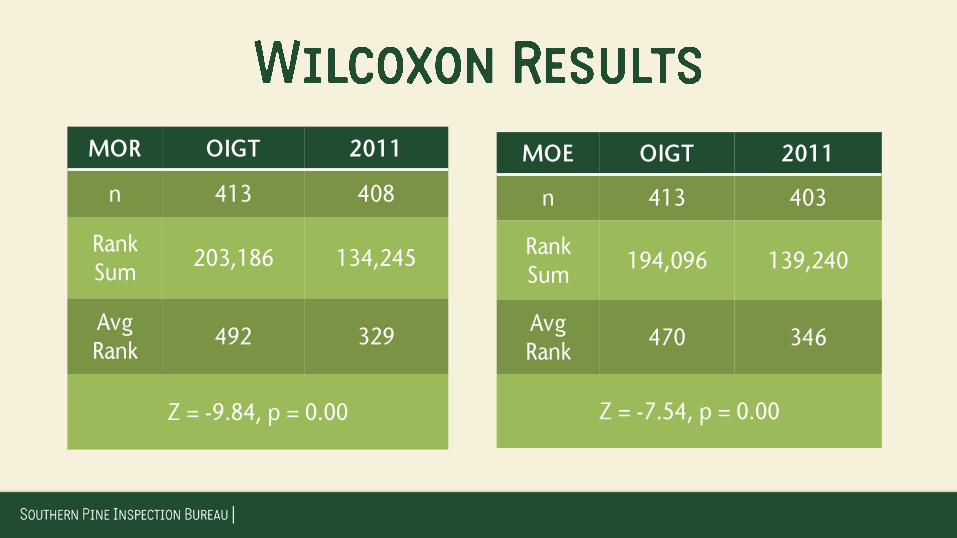
MOR OIGT 2011
n 413 408
Rank Sum
203,186 134,245
Avg Rank
492 329
Z = -9.84, p = 0.00
MOE OIGT 2011
n 413 403
Rank Sum
194,096 139,240
Avg Rank
470 346
Z = -7.54, p = 0.00
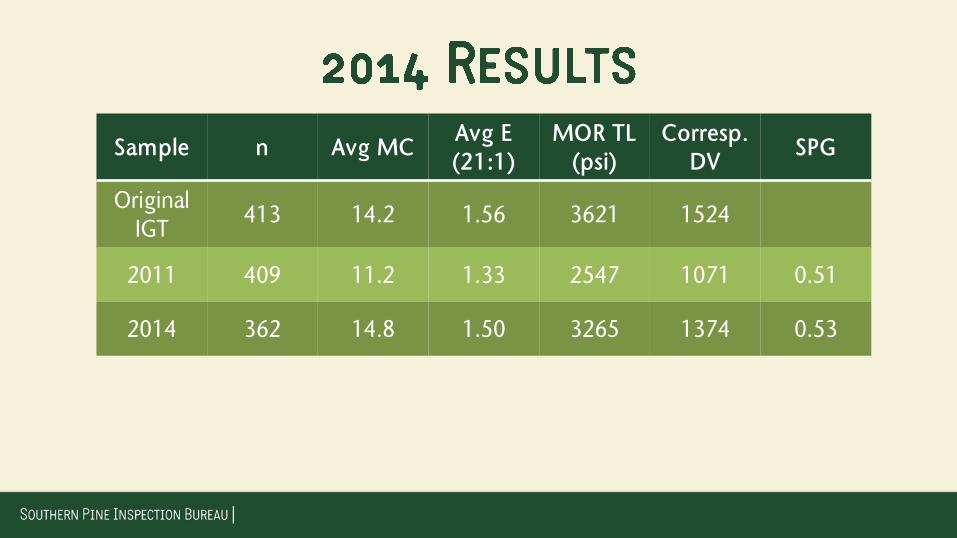
Sample n Avg MC Avg E (21:1)
MOR TL (psi)
Corresp. DV
SPG
Original IGT
413 14.2 1.56 3621 1524
2011 409 11.2 1.33 2547 1071 0.51
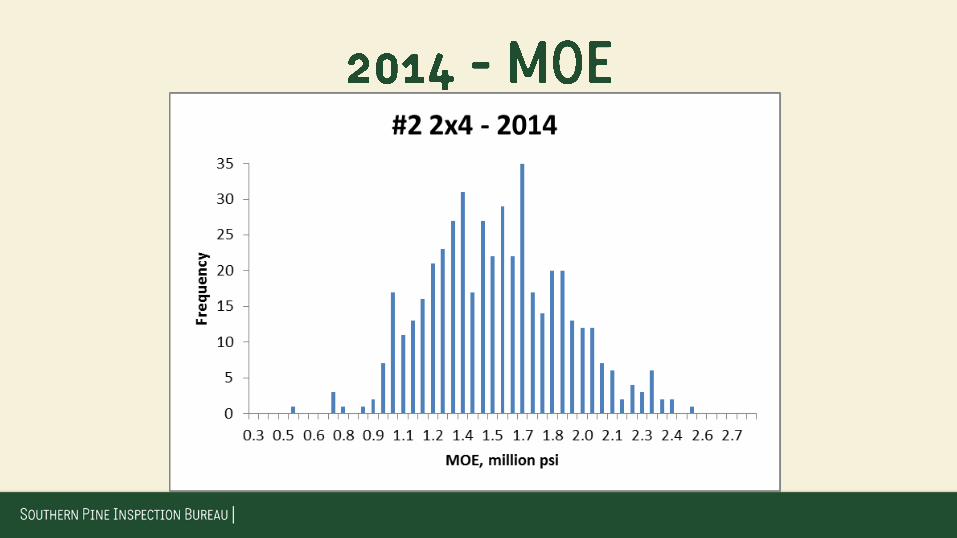
2014 362 14.8 1.50 3265 1374 0.53


OIGT 2011
n 413 408
Rank Sum
203,186 134,245
Avg Rank
492 329
Z = -9.84, p = 0.00
2011 2014
n 408 362
Rank Sum
129,899 166,936
Avg Rank
318 461
Z = -8.89, p = 0.00
OIGT 2014
n 413 362
Rank Sum
162,482 138,218
Avg Rank
393 382
Z = -0.72, p = 0.24

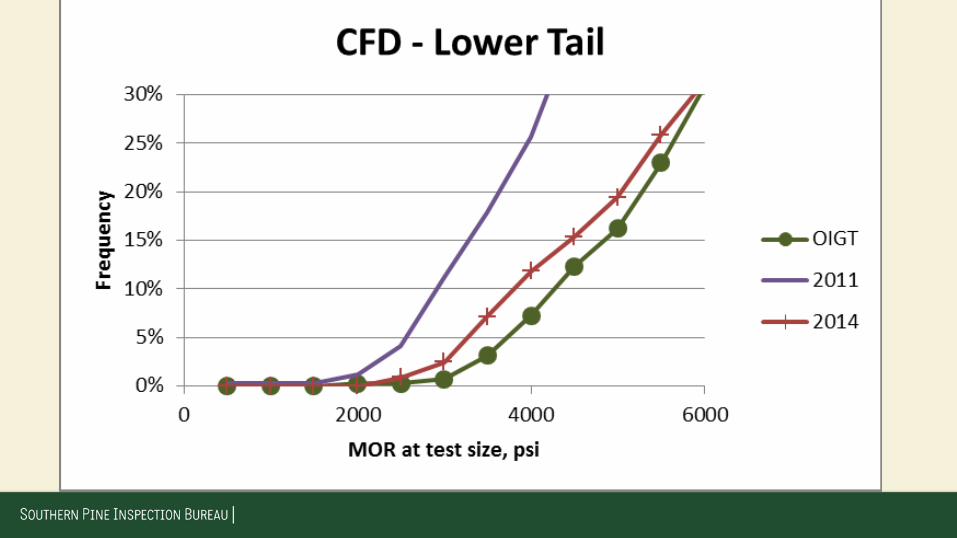
• The 2011 sample is significantly different than the original IGT and the 2014 sample.
• When considering the entire distribution, the 2014 sample is not significantly different from the original IGT sample.
• At 5th percentile, 2014 sample is lower than the original IGT sample (≈ 150 psi in Fb).
• Therefore, may need to consider alternate statistical tests to compare samples.
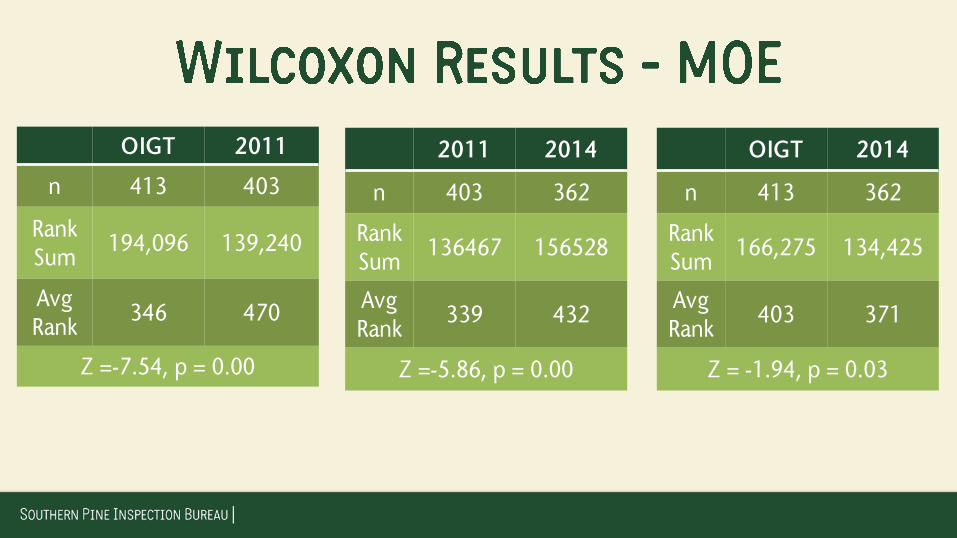
OIGT 2011
n 413 403
Rank Sum
194,096 139,240
Avg Rank
346 470
Z =-7.54, p = 0.00
2011 2014
n 403 362
Rank Sum
136467 156528
Avg Rank
339 432
Z =-5.86, p = 0.00
OIGT 2014
n 413 362
Rank Sum
166,275 134,425
Avg Rank
403 371
Z = -1.94, p = 0.03

• At the α = 0.05 level, all three samples are significantly different from each other.
• A test looking at the entire distribution may be more appropriate for MOE (average value published) than for MOR (5th percentile basis for design values)
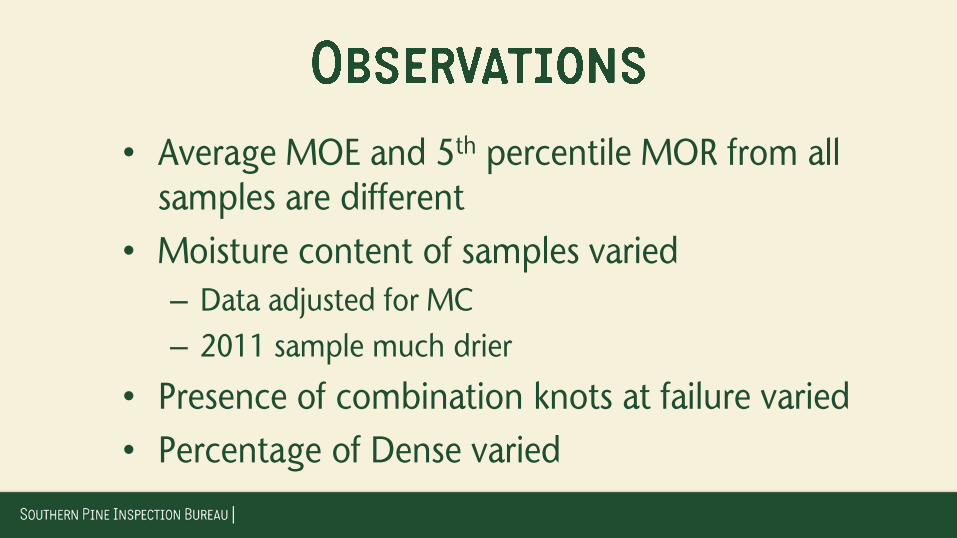
• Average MOE and 5th percentile MOR from all samples are different
• Moisture content of samples varied
– Data adjusted for MC
– 2011 sample much drier
• Presence of combination knots at failure varied
• Percentage of Dense varied

OIGT 2011 2014
MOR TL, psi 3621 2547 3265
# combination knots 0 90 19
Avg MC 14.2 11.8 14.8
% Dense 55% 39% 59%
* rpi and %sw at grademarked end

• While the 2014 #2 2x4 MOR and MOE values increased somewhat from 2011, they are still lower than the original IGT values
• Other grades and sizes tested in 2012 confirmed decreases from OIGT

• More variability between samples than expected.
• Appears that present design values represent lower end of what could be included in the grade.

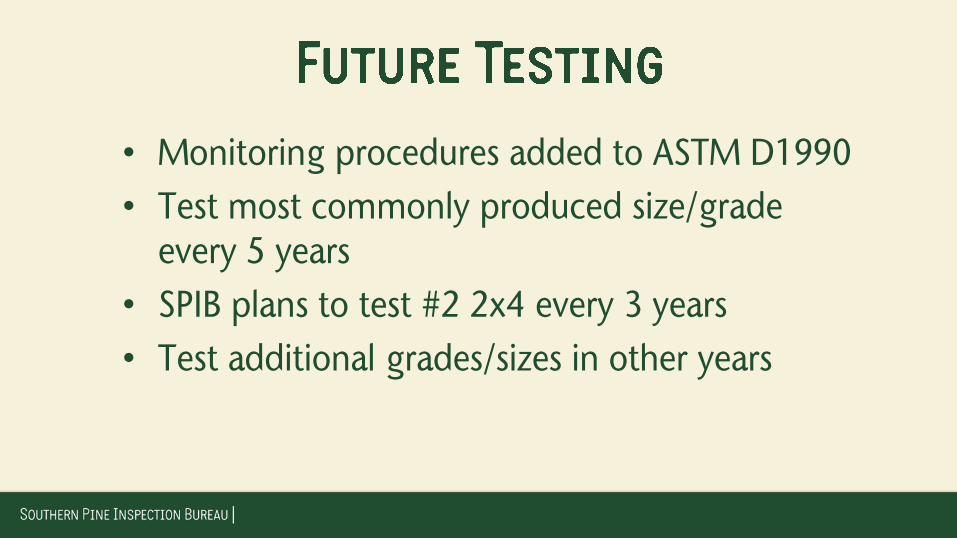
• Monitoring procedures added to ASTM D1990
• Test most commonly produced size/grade every 5 years
• SPIB plans to test #2 2x4 every 3 years
• Test additional grades/sizes in other years
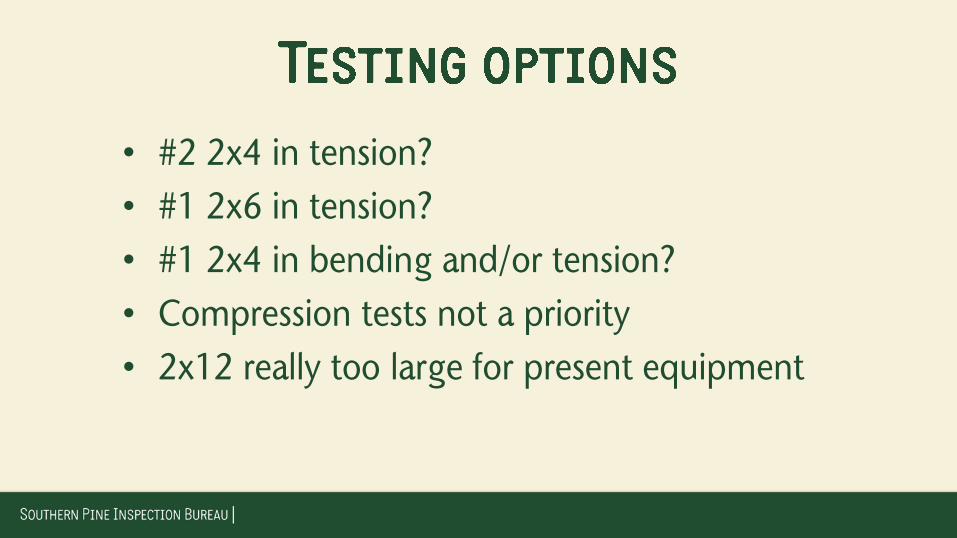
• #2 2x4 in tension?
• #1 2x6 in tension?
• #1 2x4 in bending and/or tension?
• Compression tests not a priority
• 2x12 really too large for present equipment
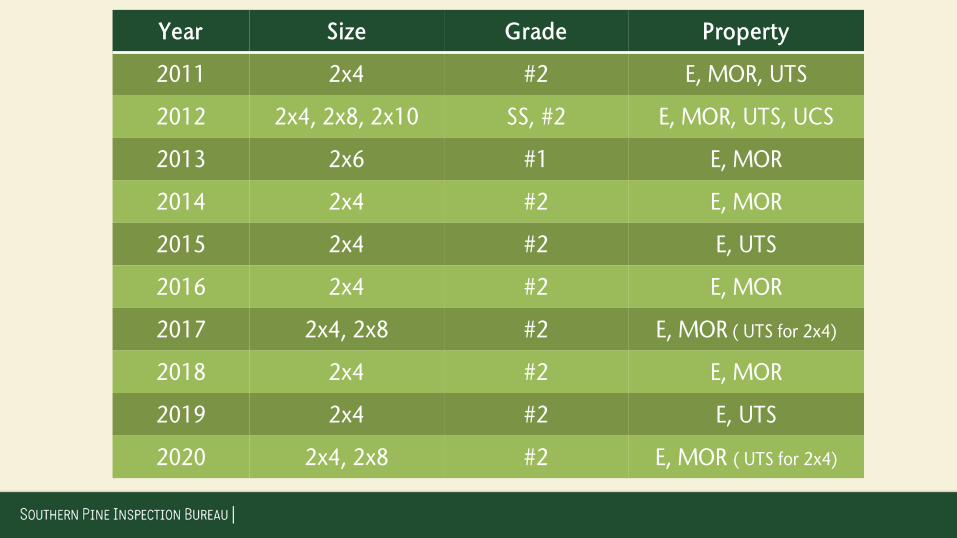
Year Size Grade Property
2011 2x4 #2 E, MOR, UTS
2012 2x4, 2x8, 2x10 SS, #2 E, MOR, UTS, UCS
2013 2x6 #1 E, MOR
2014 2x4 #2 E, MOR
2015 2x4 #2 E, UTS
2016 2x4 #2 E, MOR
2017 2x4, 2x8 #2 E, MOR ( UTS for 2x4)
2018 2x4 #2 E, MOR
2019 2x4 #2 E, UTS
2020 2x4, 2x8 #2 E, MOR ( UTS for 2x4)