originally published as - gfzpublic deutsches...
TRANSCRIPT

Originally published as:
Akilan, A., Azeez, K. K. A., Balaji, S., Schuh, H., Srinivas, Y. (2015): GPS derived Zenith Total Delay (ZTD) observed at tropical locations in South India during atmospheric storms and depressions. - Journal of Atmospheric and Solar-Terrestrial Physics, 125-126, p. 1-7.
DOI: http://doi.org/10.1016/j.jastp.2015.02.003

1
* Corresponding author Mobile: +919866683526
E-mail address: [email protected] (A. Akilan)
GPS derived Zenith Total Delay (ZTD) observed at tropical locations in South India 1
during atmospheric storms and depressions 2
3
A. Akilan1*
, K. K Abdul Azeez1#
, S. Balaji2, H. Schuh
3 and Y. Srinivas
4 4
5
1CSIR-National Geophysical Research Institute, Uppal Road, Hyderabad- 500 007, India 6
* Email: [email protected]; # Email: [email protected] 7
2Department of Disaster Management, Pondicherry University, Port Blair-744 112, India 8
Email: [email protected] 9
3GFZ, German Research Centre for Geosciences, Potsdam, Germany 10
Email: [email protected] 11
4Manonmaniam Sundaranar University, Tirunelveli-627 012, India 12
Email: [email protected] 13
14
Abstract 15
16
Global Positioning System (GPS) monitoring of Zenith Total Delay (ZTD) of the 17
troposphere which is related to water vapor is important as it may help us in weather 18
forecasting. The atmospheric water vapor varies according to the season and it also varies 19
quickly on short temporal and spatial scales during stormy periods. Thus it plays a crucial 20
role in meteorology. GPS is one of the relatively inexpensive tools available to monitor the 21
water vapor content in the atmosphere. In the present study, the efficacy of GPS data to 22
monitor perturbations in tropospheric water content (GPS meteorology) associated with 23
atmospheric storms and depressions is investigated utilizing the data from a tropical region of 24
India, recorded between 15th
October, 2010 and 27th
December, 2010 during which Southern 25
India was affected by a few significant atmospheric events. The ZTD was estimated for this 26
period at the NGRI operated GPS stations at Hyderabad (HYDE) and MS University, 27
Tirunelveli (MSUN). The accuracy of GPS derived ZTD was validated from the close match 28
2
seen with ZTD values estimated from numerical weather modeling data. During the stormy 29
periods there were strong variations of the ZTD. Corresponding changes in precipitable water 30
vapor were estimated for the International GNSS Service station HYDE. The average ZTD 31
was found to be higher near the coastal station at MSUN and less at the inland station HYDE. 32
Most of the observed peaks in the ZTD time series were well correlated to the atmospheric 33
events that influenced the region. The study extended to two more locations in the equatorial 34
Indian Ocean region showed spatial variations in the ZTD values, which suggest the 35
weakening of ZTD towards the coast. Our observations are yet another illustration for the 36
application of GPS observations to monitor tropospheric water content variations associated 37
with severe atmospheric events. 38
Key Words: GPS meteorology, Zenith Total Delay, precipitable water, atmospheric storms. 39
40
1. Introduction 41
42
The Global Positioning System (GPS) technology (Leick, 1990), which was originally 43
designed as a system for navigational and time transfer, has revamped the field of geodesy 44
and geodynamics by its ability to determine Earth rotation parameters and geodetic positions 45
precisely with little costs. Later, e.g. Bevis et al. (1992) realized the relation between the 46
Zenith Total Delay (ZTD) experienced by the GPS signal and the atmospheric water content, 47
and GPS monitoring found another useful application in meteorological studies that opened 48
the field of GPS meteorology (Businger et al., 1996). Today, remote sensing of the 49
atmospheric parameters, i.e. ZTD obtained from GPS signal records, is useful in 50
meteorological studies and successful in weather forecasting, thus making GPS meteorology 51
a frontier area of research (e.g. Rocken et al., 1993; Bevis et al., 1994; Duan et al., 1996; 52
Emardson et al., 1998; Foster et al., 2000; Baltink et al., 2002; Gradinarsky et al., 2002; 53
Hagemann et al., 2003; Champollion et al., 2005; Jade et al., 2005; Jin et al., 2007; Nilsson 54
and Elgered, 2008; Thomas et al., 2011; Joshi et al., 2013; Means and Cayan, 2013; Suparta 55
et al., 2013; Wang et al., 2013; Singh et al., 2014a,b; Li et al., 2014). In this paper, we 56

3
demonstrate the correlation between the ZTD values estimated from continuous GPS 57
monitoring, and atmospheric storm phenomena and rainfall associated with them to establish 58
the utility of GPS monitoring for weather and rainfall forecasting. 59
60
The atmospheric water vapor causes a delay in the propagation of GPS radio signals, while 61
passing through the atmosphere to the receivers on the Earth surface. This delay, known as 62
‘wet delay’, is approximately proportional to the quantity of water integrated along the ray 63
path (Hogg et al., 1981; Askine and Nordius, 1987). Therefore, dynamic perturbations in the 64
atmospheric water vapor content would get reflected in the ZTD values obtained from GPS 65
studies, which correspond to the total GPS signal delay caused by the atmospheric column 66
vertically above the GPS station. Knowledge of the spatial and temporal distribution of water 67
vapor in the atmosphere is an important factor for a better understanding of atmospheric 68
phenomena, climate and climate changes (Starr and Melfi, 1991). This atmospheric parameter 69
commonly shows rapid changes with space and time, and hence becomes a crucial 70
component of climate and weather modeling. 71
72
Storms on the Earth such as rainstorm, snowstorm, cyclonic storm, depression, etc. are severe 73
weather conditions that are associated with notable transient changes in atmospheric water 74
content. These sudden changes in precipitable water vapor (PWV) associated with the 75
atmospheric events can be well picked up by the GPS data (e.g. Rocken et al., 1993). For the 76
Indian sub-continent, weather forecasting is being successfully performed by the Indian 77
Meteorological Department (http://www.imd.gov.in) using latest technologies. The present 78
study utilizes GPS data to compute atmospheric parameters related to water content in the 79
troposphere (ZTD and PWV), and evaluates the variations seen in these values to observe the 80
signatures of storms and depressions. The GPS signals from two stations located in South 81
India were analyzed to study the ZTD and also the PWV variations related to tropical 82
cyclonic storms and deep depressions that were originated in the Indian Ocean and affected 83
the Southern part of the East coast of the Indian Peninsula between 25th
October, 2010, and 84
11th
December, 2010. 85

4
2. Basic concepts of GPS meteorology 86
87
The GPS radio waves travelling from satellites in space to the receiver on ground undergo 88
significant delay induced by the ionosphere and troposphere (the lower part of atmosphere, 89
Hogg et al., 1981). In geodetic studies, these ionospheric and tropospheric delays (together 90
known as the total delay) are removed by appropriate corrections applied to the GPS signals 91
(Davis et al., 1985). In the metereological application of GPS we make use of the 92
tropospheric delay information as this is directly related to the constituent components of the 93
troposphere. This total tropospheric delay, called ZTD, is further divided into Zenith Wet 94
Delay [ZWD] and Zenith Hydrostatic Delay [ZHD], which are respectively due to the wet 95
water vapor and dry gaseous components in the troposphere (e.g. Nilsson and Elgered, 2008). 96
The ZTD can be determined after removing the ionospheric delay part from the total delay 97
computed from two-frequency GPS observations. The ZWD is proportional to the 98
tropospheric integrated water vapor content 99
(𝐼𝑊𝑉 = ∫ 𝜌𝑤𝑑𝑍; ∞
0𝜌𝑤 − density of water vapor, 𝑑𝑍 − vertical coordinate) and is the minor 100
component (~10 %) of the ZTD. The water vapor content of the atmosphere in zenith 101
direction is also defined as the height of an equivalent liquid water column and referred to 102
Precipitable Water (𝑃𝑤), which can be computed from ZWD using the relation (Nilsson et al., 103
2013): 104
𝑃𝑤 = 𝑘∆𝐿𝑤𝑧 (1) 105
where, ∆𝐿𝑤𝑧 is the ZWD and 𝑘 =
106𝑀𝑤
[𝑘2′ +
𝑘3𝑇𝑚
]𝑅𝜌𝑤𝑙
, for which 𝑘′2 =16.52 K/mbar , and 𝑘3 = 106
(3.776 ± 0.004) x 105
K2/mbar are constants (Askne and Nordius, 1987). 107
𝑀𝑤 is the molar mass of water (18.0152 g/mol). 108
𝑇𝑚 is the mean temperature ≈ 70.2 + 0.72𝑇0, where 𝑇0 is Earth surface temperature 109
𝑅 is the universal gas constant, R = 8.314 J/mol, and 110
𝜌𝑤𝑙 is the density of liquid water in kg/m3 111
5
3. Data and analysis 112
113
As a part of its GPS-Geodesy program, the National Geophysical Research Institute 114
(NGRI), Hyderabad, India initiated GPS monitoring at Hyderabad (HYDE) in the year 1995 115
by establishing an IGS (International GNSS [Global Navigational Satellite Systems] Service 116
– http://www.igs.org) tracking station. In September 2010, we started recording GPS signals 117
at another GPS permanent station positioned at MS University campus, Tirunelveli, South 118
India (hereafter called MSUN; Figure 1). Both these stations are within the Southern part of 119
Indian Peninsula surrounded by the Indian Ocean. The geographic position and other details 120
of these GPS stations are given in Table 1. The stations were equipped with multichannel 121
dual frequency GPS receivers. A Leica System 1200 GRX GPS receiver was operative at 122
HYDE and a Topcon GB 1000 GPS receiver was functioning at MSUN station. At both sites, 123
the data were recorded with a uniform sampling rate of 30 seconds. The elevation cutoff 124
angle of the GPS antenna was set to 5° to avoid the tracking of satellites at too low elevation. 125
Multipath signals were mainly eliminated using choke ring antennas. The data in binary 126
format were converted into Receiver Independent Exchange Format (RINEX) (Galas and 127
Kohler, 2001). 128
129
The equatorial Indian Ocean region frequently is the origin zone of several severe 130
weather conditions that affect the Indian subcontinent. The year 2010 has seen a few of such 131
weather events and most of them were concentrated in the Bay of Bengal 132
(http://www.imd.gov.in/section/nhac/dynamic/RSMC-2010.pdf). Among these, the very 133
severe cyclonic storm ‘GIRI’ and the severe cyclonic storm ‘JAL’ were experienced during 134
20-23 October and 4-8 November, 2010, respectively, and influenced the Indian weather 135
conditions considerably. The cyclonic storm ‘JAL’ crossed the coasts of North Tamilnadu 136
and South Andhra Pradesh on 7th
November, 2010, while ‘GIRI’ did not hit the Indian coast 137
and moved to the Myanmar coast. During 7-8 December, 2010, another depression was 138
formed over the Bay of Bengal, which crossed the Southern Andhra Pradesh coast on 7th
139
December, 2010. These events produced stormy weather and torrential rains in South India, 140

6
particularly on the East coast. We used about two and half months (15th
October till 27th
141
December, 2010, a period equivalent to the GPS day period 288-358) of GPS data recorded at 142
the Hyderabad (HYDE) and Tirunelveli (MSUN) stations to estimate the ZTD perturbations 143
over these locations. The ZTD data were further analysed to study their correlation with the 144
atmospheric events and to identify typical signals corresponding to these meteorological 145
events. 146
147
The raw GPS data in RINEX format were processed using the Bernese 5.0 software 148
(Dach et al., 2007, 2009). Station MSUN was used as the fixed station for data processing. In 149
the processing, the station position was fixed to the result of a preceding Precise Point 150
Positioning (Melbourne, 1985). The Bernese software (Dach et al., 2007) was used for 151
analyzing the GPS data. It assumes an azimuthally homogeneous atmosphere. Receiver clock 152
errors, satellite clock errors and cycle slips were eliminated during processing and the 153
ambiguities in the carrier phase were estimated and corrected. We applied the Niell mapping 154
function (Niell, 1996), included in Bernese 5.0, to compute the ZTD values over Hyderabad 155
and Tirunelveli stations. The temporal resolution was set to two hours; however, hourly 156
estimations were made for the GPS period from day 326 to 329, which has seen heavy 157
rainfall in and around Tirunelveli station. 158
159
4. Results and discussions 160
161
The ZTD values computed for the period from 15th
October to 27th
December, 2010 at 162
Hyderabad and Tirunelveli stations are presented in Figures 2 and 3. The variation in the 163
hydrostatic delay that contributes 90% to the total ZTD value is a slow process and hence is 164
negligible (e.g. Luo et al., 2013). Thus the observed variations in ZTD that contribute about 165
10% to the absolute ZTD value mainly represent the changes in water vapor content in the 166
troposphere. Our GPS derived ZTD time series show peaks and lows corresponding to the 167
atmospheric water vapor changes associated with the severe weather periods experienced in 168

7
the region. To verify the reliability of GPS derived ZTD in establishing its relation with 169
atmospheric weather changes, we compared our results with numerical weather model 170
(NWM) data (e.g. Böhm et al., 2006; Bock et al., 2013). Numerical weather models are 171
prepared continuously e.g. by the European Centre for Medium Weather Forecasting 172
(ECMWF) [http://www.ecmwf.int/]. We used the ZTD data generated by numerical weather 173
modeling studies from http://ggosatm.hg.tuwien.ac.at/, and compared them with our GPS 174
derived observations. The comparison carried out for Hyderabad station data showed a 175
remarkably good agreement of ZTD between the GPS derived and the numerical prediction 176
values (Figure 2). In this case, the standard deviation between GPS and NWM estimations is 177
0.004 m. Similar observation were also reported previously by Teke et al. (2013). The good 178
match between GPS and NWM derived ZTD estimates was also confirmed from a t-test that 179
showed more than 95% confidence level. We could not extend this to the MSUN site as this 180
is not an IGS station and NWM data are not available for this location. As can be noticed 181
from Figures 2 and 3, our GPS data suffer from a major data gap (~9 days between GPS days 182
308 and 316) due to power failures at the MSUN site and hence the correlation was not 183
possible for those few days without data recording. In addition to this, occasional data losses 184
(GPS days 294-299, 332-336, and 341-343) were also evident in the time series. However, 185
significant weather changes or rainfalls were not reported during those periods. The NWM 186
data complement the GPS data and exhibit the ZTD behavior whenever GPS data are not 187
available. We tested the good consensus shown between the GPS and NWM data using two 188
other IGS GPS stations located in the equatorial Indian Ocean region. The GPS data from 189
Cocos Island (COCO) and Diego Garcia (DGAR) were processed and the ZTD values were 190
compared with the NWM ZTD values (Figure 4). The standard deviations obtained are 0.028 191
m and 0.017 m at sites COCO and DGAR, respectively. Figure 4 again illustrates the good 192
agreement between GPS derived and NWM calculated ZTD values, and thus allows us to use 193
the information from numerical weather data whenever GPS could not record. 194
195
The rainfall data for the Hyderabad and Tirunelveli stations were also compared with the 196
respective ZTD estimates to understand the correlation between the two (i.e. rainfall and ZTD 197

8
changes). The quantity of water in the atmosphere, i.e. precipitable water (Pw), can be 198
determined from ZTD using equation (1). The ZWD values (i.e. ∆𝐿𝑤𝑧 term) needed in the 199
equation were obtained by subtracting the ZHD (retrieved from the NWM) from the GPS 200
estimated ZTD values. We estimated the precipitable water at the Hyderabad station (Figure 201
2, lower panel), assuming the values of Mw (0.0180152 Kg/mol) and Md (0.028964 Kg/mol). 202
Pw values were computed using value of constants given in Askne and Nordius (1987) and 203
also following Rüeger (2002). The comparison of the results does not show any significant 204
difference in Pw values (Figure 2, lower panel). The required mean temperature (Tm) value 205
was obtained from the Vienna University of Technology database 206
(http://ggosatm.hg.tuwien.ac.at/DELAY/ETC/TMEAN/). The standard deviation of the Tm 207
values used in this study is 2.07 K. Accuracy of the results was tested by studying the 208
sensitivity of Pw value to the possible error in Tm measurements. Pw values were computed 209
for a change in Tm by 4K, 8K and 12K, and compared with the actual estimations in figure 5. 210
Figure 5 illustrate negligible variation in Pw estimates for the above error (change) in Tm. The 211
average difference seen for a change of 4K, 8K and 12K is 0.94 mm, 1.26 mm and 1.58 mm 212
respectively. These differences are negligible compared to the peak Pw values approximately 213
falling between 30 and 41 mm. 214
215
During the period between 16th
October and 27th
December, 2010, the ZTD values estimated 216
at the Hyderabad GPS station vary between 2.21 and 2.53 m (Figure 2). Four major ZTD 217
peaks, marked as HP1, HP2, HP3, and HP4 in Figure 2, with values between 2.45 m and 2.53 218
m are visible in the ZTD time series. The ZTD is expected to be higher than the average 219
value of 2.37 m during stormy weather conditions (Hogg et al., 1981), which however vary 220
with altitude. Except the peak HP3, all others are observed just before or coincident with the 221
noted atmospheric events reported from the South Indian region during the period of our 222
study. The peak HP3 does not correspond to any abnormal atmospheric event and hence 223
might be related to the normal water vapor accumulation process. Higher ZTD values 224
indicate higher water vapor content in the atmosphere, which is quite clear from the PWV 225
derived from ZTD for the same period (Figure 2). It can be seen from Figure 2 that the ZTD 226

9
values were high during the 18-22 October period. During this period the formation of a deep 227
depression in the Bay of Bengal region was noticed on 19th
October, which further intensified 228
into a severe cyclonic storm (GIRI) by 22nd
of October and moved towards the coast of 229
central Myanmar and the system weakened by the end of 23rd
October. Though this 230
atmospheric system did not move towards the Indian coast, the ZTD variations observed at 231
Hyderabad can be associated to these atmospheric events. 232
233
Under normal circumstances the accumulated water vapor gets discharged as rain at the same 234
location. However, it is possible in the case of significant atmospheric wind conditions that 235
the accumulated water vapor may travel to distant locations and get discharged under suitable 236
atmospheric conditions. Such a situation could be the reason for no rainfall at Hyderabad 237
corresponding to the higher ZTD observed during the ‘GIRI’ period. Significant rainfall was 238
recorded, however, during the ‘JAL’ period. Similarly, the GPS derived ZTD and the derived 239
PWV match with the rainfall that occurred at Hyderabad during the deep depression event 240
affecting South India. 241
242
For the Tirunelveli station, the GPS derived ZTD data (Figure 3) show a comparable pattern 243
as observed at the Hyderabad station. However, the ZTD peak values are relatively higher (> 244
2.6 m) and show correlation with the atmospheric events noted in the South India region. No 245
rainfall events were reported from this location during the major events GIRI and JAL. But, 246
higher ZTD values were observed in the atmosphere during the GPS days 327 to 330 and 247
significant amount of rain was reported from this location. The cumulative rainfall data show 248
the slow onset of rain during 310-325 GPS days (6-21 Nov., 2010), followed by consistent 249
and frequent rainfall during the GPS days 326-340 (22 Nov. - 06 Dec., 2010), as indicated by 250
steep slope and the final phase of withdrawal of rain from GPS day 341 (Dec. 7) onwards 251
depicting the decreasing trend of the monsoon pattern (e.g. Cook and Buckley, 2009). The 252
absence of rain at this place during the GIRI and JAL period can be attributed to the possible 253
wind pattern associated with the atmospheric events. 254

10
In the present study we also analyzed the ZTD variations at the IGS stations COCO and 255
DGAR located deep inside the Indian Ocean. Table 2 gives the peak and minimum ZTD 256
values obtained over each GPS station and help to assess the variability of the peak and 257
minimum values of ZTD (i.e. difference in the peak ZTD values between the stations, and 258
difference in the minimum ZTD values) between the locations. The comparison of the ZTD 259
values of the Indian Ocean stations (COCO and DGAR) with the two inland GPS sites 260
(HYDE and MSUN) shows the spatial variations in ZTD values. The values indicate the 261
weakening of ZTD towards the land side. No significant changes are seen in the minimum 262
and maximum ZTD values between the Indian Ocean locations and near the coast (Table 2). 263
This would suggest that the effect of the events on atmospheric ZTD/PW was almost same at 264
the interior of the ocean and on the coast. The ZTD peaks (2.75 m) and lows (2.44 to 2.46 m) 265
observed at stations COCO and DGAR located inside the Indian Ocean are quite high when 266
compared to an inland site, namely HYDE station, located approximately 400 km away from 267
the East coast of India. Also, the ZTD maxima (2.53 m) and minima (2.21 m) values at 268
HYDE are lower than the one observed for the coastal station MSUN. However, a part of the 269
observed difference might be due to the variations in elevation between the observation 270
points. There is a good agreement between ZTD and PWV at HYDE (Figure 2) suggesting 271
that the increase in ZTD is due to the increase in water vapor content. This notable decrease 272
in amplitudes of ZTD maxima and minima at the interior location indicates that stations close 273
to the ocean or inside the ocean are more affected by the storms than stations located inland. 274
The coastal as well as stations within the Indian Ocean islands show more peaks in the ZTD 275
time series (Figure 3 & 4). This would probably indicate that these locations were strongly 276
affected by the storms and depression than Hyderabad, which is located ~ 400 km inside from 277
the East coast. The increase in ZTD may be an indication for a precursor of rain. The overall 278
analysis shows that during the onset of a rainy day, the ZTD is significantly higher at stations 279
MSUN, HYDE, COCO, and DGAR (Figures 2, 3, and 4). Sometimes, during rainfall, ZTD 280
may come down if the atmosphere is not dynamic. It is difficult to predict the place of rain 281
since atmospheric dynamics depends on various other factors, which are beyond the scope of 282
this paper. 283
284

11
5. Conclusion 285
286
The application of GPS meteorology in identifying rapid atmospheric variations such as 287
storms and deep depression events are evaluated in this study. The ZTD estimated from 288
numerical weather modeling data and the ZTD computed from GPS data show quite good 289
correspondence. The PWV derived from ZTD values and the rainfall data show a reasonable 290
correlation at Hyderabad GPS station located well inside the Indian sub-continent. Similarly, 291
good correlation exists between ZTD and rainfall data for the MSUN site located near the 292
Southern coastal region of India. The calculated ZTD time series showed peaks and drops 293
that overlap with severe atmospheric activities such as storms and deep depressions. 294
Comparison of the ZTD values observed at different GPS stations studied indicate that the 295
amplitudes of the ZTD values are less over the interior location as compared to the values 296
observed at the coast and inside the Indian Ocean. GPS monitoring is an efficient and 297
economic procedure to continuously monitor the changes in tropospheric water content and 298
could help in identifying severe weather conditions by virtue of continuous weather data. 299
300
Acknowledgement 301
302
Prof. Johannes Böhm of Vienna University of Technology, Austria is thanked for his 303
help to obtain numerical weather modeling data of the ECMWF. Vineeth K. Gahalaut 304
extended the necessary support to carry out this study and Y. J. Bhasker Rao, Acting 305
Director, CSIR-NGRI, given permission to publish this work. We thank N. Chandrasekar for 306
his cooperation in obtaining GPS data at M.S. University (Tirunelveli) campus. The work 307
was carried under ILP-0301-28 (VKG). 308
309
310

12
References 311
312
Agnew D. C., 1992. The time domain behavior of power law noise. Geophysical Research 313
Letters 19, 333-336. 314
Askine, J., Nordius, H., 1987. Estimation of tropospheric delay for microwaves from surface 315
weather data. Radio Science 22, 379-386. 316
Baltink, H. K, van der Marel, H., van der Hoeven, A. G. A., 2002. Integrated atmospheric 317
water vapor estimates from a regional GPS network. Journal of Geophysical Research 318
107, doi: 10.1029/2000JD000094. 319
Bevis, M., Businger, S., Herring, T. A., Rocken, C., Anthes, R. A., Ware, R. H., 1992. GPS 320
meteorology: Remote sensing of Atmospheric water vapor using the Global 321
Positioning System. Journal of Geophysical Research 97, 15787-15801. 322
Bevis, M., Businger, S., Chiswell, S., Herring, T. A., Anthes, R. A., Rocken, C., Ware, R. H., 323
1994. GPS meteorology: Mapping Zenith Wet Delays onto Precipitable Water. 324
Journal of Applied Meteorology 33, 379-386. 325
Bock, O., Willis, P., Wang, J., Mears, C., 2013. A high-quality, homogenized, global, long-326
term (1993-2008) DORIS precipitable water data set for climate monitoring and 327
model verification. Journal of Geophysical Research-Atmospheres, 119, 7209-7230, 328
doi:10.1002/2013JD021124. 329
Böhm, J., Werl, B., Schuh, H., 2006. Troposphere mapping functions for GPS and VLBI 330
from ECMWF operational analysis data. Journal of Geophysical Research 111, 331
B02406, doi:10.1029/2005JB003629. 332
Businger, S., Chiswell, S. R., Bevis, M., Duan, J., Anthes, R. A., Rocken, C., Ware, R. H., 333
Exner, M., Van Hove, T., Solheim, F. S., 1996. The promise of GPS in Atmospheric 334
Monitoring. Bulletin of the American Meteorological Society 77, 5-17. 335
Champollion, C, Mason, F., Bouin, M. N., Walpersdorf, A., Doerflinger, E., Bock, O., van 336
Baelen, J., 2005. GPS water vapour tomography: preliminary results from the 337
ESCOMPTE field experiment. Atmospheric Research 74, 253–274. 338

13
Cook, B. I., Buckley, B. M., 2009. Objective determination of monsoon season onset, 339
withdrawal and length. Journal of Geophysical Research 114, D23109, doi: 340
10.1029/2009JD012795. 341
Dach, R., Brockmann, E., Schaer, S., Beutler, G., Meindl, M., Prange, L., Bock, H., Jaggi, A., 342
Ostini, L., 2009. GNSS processing at CODE: status report. Journal of Geodesy, 83, 343
353-365. Doi: 10.1007/s00190-008-0281-2. 344
Dach, R., Hugentobler, U., Fridez, P., Meindl, M., 2007. User manual of the Bernese GPS 345
software version 5.0, Astronomical Institute, University of Bern. 346
Davis, J. L., Herring, T. A., Shapiro, I. I., Rogers, A. E. E., Elgered, G., 1985. Geodesy by 347
radio interferometry: Effects of atmospheric modeling errors on estimates of baseline 348
length. Radio Science 20, 1593-1607. 349
Duan, J., Bevis, M., Fang, P., Bock, Y., Chiswell, S., Businger, S., Rocken, C., Solheim, F., 350
van Hove, T., Ware, R., McCeuskey, S., Herring, T. A., King, R. W., 1996. GPS 351
Meteorology: Direct estimation of absolute value of precipitable water. Journal of 352
Applied Meteorology 35, 830-838. 353
Emardson T. R., Elgered, G., Johansson, J. M., 1998. Three months of continuous monitoring 354
of atmosphere water vapor with a network of Global Positioning System receivers. 355
Journal of Geophysical Research 103, 1807-1820. 356
Foster, J., Bevis, M., Schroeder, T., Merrifield, M., Businger, S., Dom, S., Marcus, S., 357
Dickey, J., Bar-Sever, Y., 2000. El Nino, water vapor, and the Global Positioning 358
System. Geophysical Research Letters 27, 2697-2700. 359
Galas, R., Kohler, W., 2001. A binary exchange format for GPS data. Phys. Chem. Earth (A) 360
26, 645-648. 361
Gradinarsky, L.P, Johansson, J. M., Bouona, H. R., Scherneck, H. G., Elgered, G., 2002. 362
Climate monitoring using GPS. Physics and Chemistry of the Earth 27, 335-340. 363
Hagemann, S., Bengtsson, L., Gendt, G., 2003. On the determination of atmospheric water 364
vapor from GPS measurements. Journal of Geophysical Research 108, 365
doi:10.1029/2002JD003235. 366
Hogg, D. C., Guiraud, F. O., Decker, M. T., 1981. Measurement of excess transmission 367
length on earth-space paths. Astronomy and Astrophysics 95, 304-307. 368
14
Jade, S., Vijayan, M. S. M., Gaur, V. K., Prabhu, T. P., Sahu, S. C.,2005. Estimates of 369
precipitable water vapour from GPS data over the Indian subcontinent. Journal of 370
Atmospheric and Solar-Terrestrial Physics 67, 623–635. 371
Jin, S., Park, J. U., Cho, J. H., Park, P. H., 2007. Seasonal variability of GPS-derived zenith 372
tropospheric delay (1994–2006) and climate implications. Journal of Geophysical 373
Research 112, doi:10.1029/2006JD007772. 374
Joshi, S., Kumar, K., Pande, B., Pant, M. C., 2013. GPS-derived precipitable water vapour 375
and its comparison with MODIS data for Almora, Central Himalaya, India. 376
Meteorology and Atmospheric Physics 120, 177-187. 377
Leick, A., 1990. GPS satellite surveying. John Wiley and Sons, 352pp. 378
Li, X., Dick, G., Ge, M., Heise, S., Wickert, J., Bender, M., 2014. Real-time GPS sensing of 379
atmospheric water vapor: precise point positioning with orbit, clock and phase delay 380
corrections. Geophysical Research Letters 41, 3615-3621, doi: 381
10.1002/2013GL058721. 382
Luo, X., Heck, B., Awange, J. L., 2013. Improving the estimation of zenith dry tropospheric 383
delays using regional surface meteorological data. Advances in Space Research 52, 384
2204-2214. 385
Means, J. D., Cayan, D., 2013. Precipitable Water from GPS Zenith Delays Using North 386
American Regional Reanalysis Meteorology. Journal of Atmospheric and Oceanic 387
Technology 30, 485–495. 388
Melbourne, W. G., 1985. The case for ranging in GPS based geodetic systems. In 389
Proceedings 1st International Symposium on Precise Positioning with Global 390
Positioning System, edited by ClydeGoad, pp.373-386, US Department of Commerce, 391
Rockville, Maryland. 392
Niell, A. E., 1996. Global mapping functions for the atmosphere delay at radio wavelengths. 393
Journal of Geophysical Research 101, 3227-3246. 394
Nilsson, T., Böhm, J., Wijaya, D. D., Tresch, A., Nafisi, V., Schuh, H., 2013. Path delays in 395
the neutral atmosphere, in: J. Böhm, H. Schuh (Eds.), Atmospheric Effects in Space 396
Geodesy. Springer-Verlag Berlin Heidelberg, doi: 10.1007/978-3-642-36932-2_3. 397

15
Nilsson, T., Elgered, G., 2008. Long-term trends in the atmospheric water vapor content 398
estimated from ground-based GPS data. Journal Geophysical Research 113, D19101, 399
doi: 10.1029/2008JD010110. 400
Rocken, C, Ware, R., Hove, T. V., Solheim, F., Alber, C. Johnson, J., Bevis, M., Businger, 401
S., 1993. Sensing atmospheric water vapor with the Global Positioning System. 402
Geophysical Research Letters 20, 2631-2634. 403
Rüeger, J. M., 2002. Refractive index formulae for radio waves. In Proceedings of FIG 22nd
404
International Congress, International Federation of Surveyors (FIG), Washington DC, 405
pp. 1-12. 406
Singh, D., Ghosh, J. K., Kashyap, D., 2014a. Precipitable water vapor estimation in India 407
from GPS-derived zenith delays using radiosonde data. Meteorology and Atmospheric 408
Physics 123, 209-220. 409
Singh, D., Ghosh, J. K. and Kashyap, D., 2014b. Weighted mean temperature model for extra 410
tropical region of India. Journal of Atmospheric and Solar-Terrestrial Physics, 107, 411
48–53. 412
Starr, D. O’C., Melfi, S. H., 1991. The role of water vapor in climate: A strategic research 413
plan for the GEWEX Water Vapor Porject (GVaP). NASA Conf. Pub. CP-3120, 414
50pp. 415
Suparta, W., Noor, F., Abu Bakar, Abdullah, M., 2013. Remote sensing of Antarctic ozone 416
depletion using GPS meteorology. International Journal of Remote Sensing 34, 2519–417
2530. 418
Teke, K., Nilsson, T., Böhm, J., Hobiger, T., Steigenberger, P., Garcial-Espada, S., Haas, R., 419
Willis, P., 2013. Troposphere delays from space geodetic techniques, water vapor 420
radiometers, and numerical weather models over a series of continuous VLBI 421
campaigns. Journal of Geodesy, 87, 981-1001, doi:10.1007/s00190-013-0662-z. 422
Thomas I. D., King, M. A., Clarke, P. J., Penna, N. T., 2011. Precipitable water vapor 423
estimates from homogeneously reprocessed GPS data: An intertechnique comparison 424
in Antarctica. Journal of Geophysical Research 116, D04107, doi: 425
10.1029/2010JD013889. 426

16
Wang, H., Wei, M., Li, G., Zhou, S., Zeng, Q., 2013. Analysis of precipitable water vapor 427
from GPS measurements in Chengdu region: Distribution and evolution 428
characteristics in autumn. Advances in Space Research 52, 656-667. 429
430
431
432
433
434
435
436
437
438
439
440
441
442
443
444
445
446
447
17
TABLES 448
449
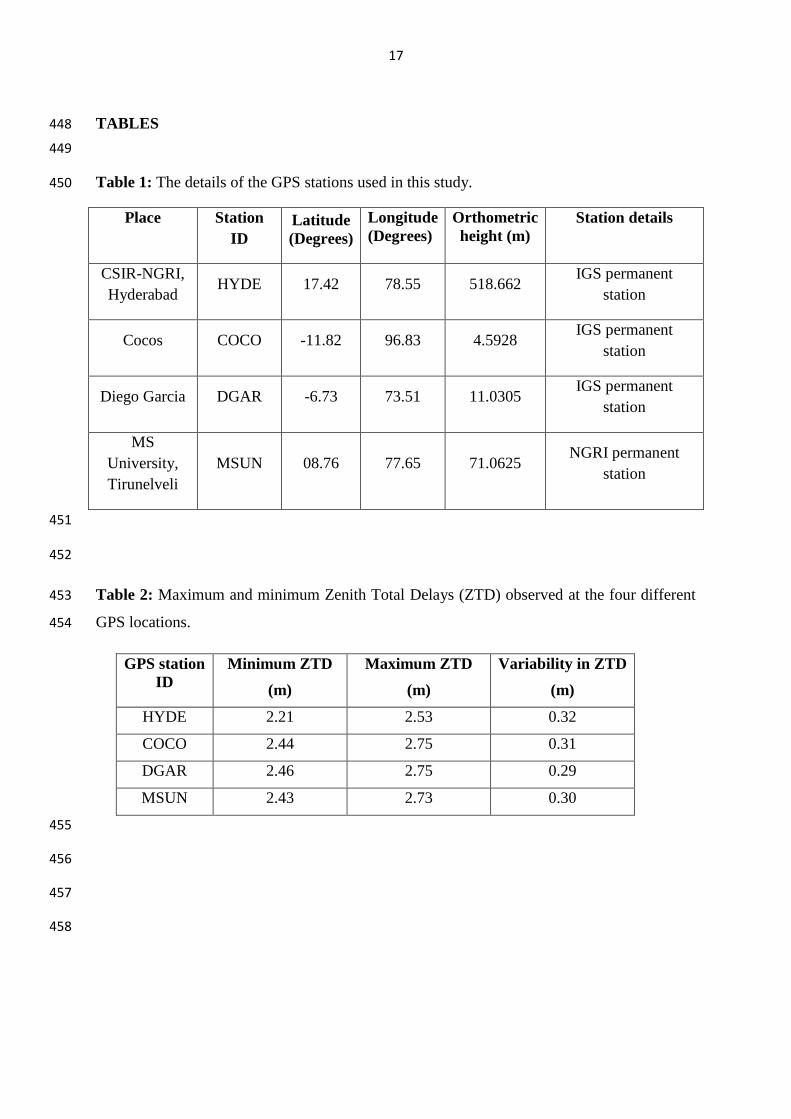
Table 1: The details of the GPS stations used in this study. 450
Place Station
ID
Latitude
(Degrees)
Longitude
(Degrees)
Orthometric
height (m)
Station details
CSIR-NGRI,
Hyderabad HYDE 17.42 78.55 518.662
IGS permanent
station
Cocos COCO -11.82 96.83 4.5928 IGS permanent
station
Diego Garcia DGAR -6.73 73.51 11.0305 IGS permanent
station
MS
University,
Tirunelveli
MSUN 08.76 77.65 71.0625 NGRI permanent
station
451
452
Table 2: Maximum and minimum Zenith Total Delays (ZTD) observed at the four different 453
GPS locations. 454
GPS station
ID
Minimum ZTD
(m)
Maximum ZTD
(m)
Variability in ZTD
(m)
HYDE 2.21 2.53 0.32
COCO 2.44 2.75 0.31
DGAR 2.46 2.75 0.29
MSUN 2.43 2.73 0.30
455
456
457
458

18
Figure captions 459
460
Figure 1: Location of the GPS stations marked over the topographic map of South India and 461
Northern Indian Ocean. 462
Figure 2: ZTD values computed from GPS data and numerical weather models for the for the 463
Hyderabad (HYDE) station (upper panel). The lower panel shows the precipitable water 464
vapor (PWV) estimated at the same location. PWV values were computed using value of 465
constants given in Askne and Nordius (1987) and also following Rüeger (2002). The rainfall 466
data are also presented and compared. The peaks in the ZTD are highlighted using ellipses 467
and labeled as HP1 to HP4. The active periods of storms and depression are also marked. 468
Figure 3: ZTD values computed from GPS data for the Tirunelveli station (MSUN) (lower 469
panel). The rainfalls reported at this location during our observation period are given using 470
bar chart plot. Upper panel shows the cumulative rainfall data at this location. 471
Figure 4: ZTD values computed from GPS data and using numerical weather models are 472
presented for two Indian Ocean GPS stations, i.e. COCO (upper panel) and DGAR (lower 473
panel). 474
Figure 5: Comparison of the original PWV estimates with the values computed for possible 475
changes/error in the determination of Tm data. 476
477