oriolakd€corporation - nomura · wholesalers€goes€directly€to...
TRANSCRIPT
OriolaKD Corporation
Eero HautaniemiPresident & CEOOriolaKD Corporation
Nomura Healthcare ConferenceLondon, 28 June 2012

2 28 June 2012
4 854 employees end of 2011
64% 25%
10%1%Finland
SwedenRussia
Baltics
Net sales 2011 EUR 2.1 €billion
Finland
Sweden
Russia
Baltics
18%
49%
32%
2%
Russia12 €billion
Finland2 €billion
Sweden3 €billion
Baltics1 €billion
Size of pharma market 2011, 18 €billion
RUSSIA Pharmaceutical Wholesale, 590 Me Pharmaceutical Retail, 130 Me 249 pharmacies
SWEDEN Pharmaceutical Wholesale, 617 Me Pharmaceutical Retail, 483 Me 209 pharmacies
BALTICS Pharmaceutical Wholesale, 34 Me
FINLAND Pharmaceutical Wholesale, 336 Me Consumer Health 45 Me
Country Market Position Market Share
Finland No. 2 ~47 %
Sweden No. 2 ~36 %
Russia No. 7 ~5 %
Baltics ~510 %
Country Market Position Market Share
Sweden No. 3 ~13 %
Russia No. 3 ~68 % Moscow
No. 8 ~1 % Russia
Wholesale Q1/2012 *
Retail Q1/2012 *
* Source: IMS Health & Pharmexpert 04/12

3 28 June 2012
2006
13771581
1713
1335
2146
1929
Inv.Div.
430 M€150 M€
20
30
125
25
200150
30
Demerger of Orion andpreparation of OriolaKD’sstock listing
Stock listing
Common Oriola brand forwholesale
Entering Russianpharmaceutical retailand wholesale market
New vision, mission and values
Preparationof Pharmacybusiness inSweden
Acquisition of 03 Aptekapharmacy chain in Moscow
Dental Tradejoint venturewith Lifco
Sale of HealthcareTrade business to Mediq
Sale of remaining 30 per cent holdingof Dental Trade business to Lifco
Completion ofRussian acquisitionEntering Swedish
Pharmaceuticalretail market
2007 2008 2009 2010 2011
NetSalesMe
0
500
1000
1500
2000
2500
Transformation
4 28 June 2012
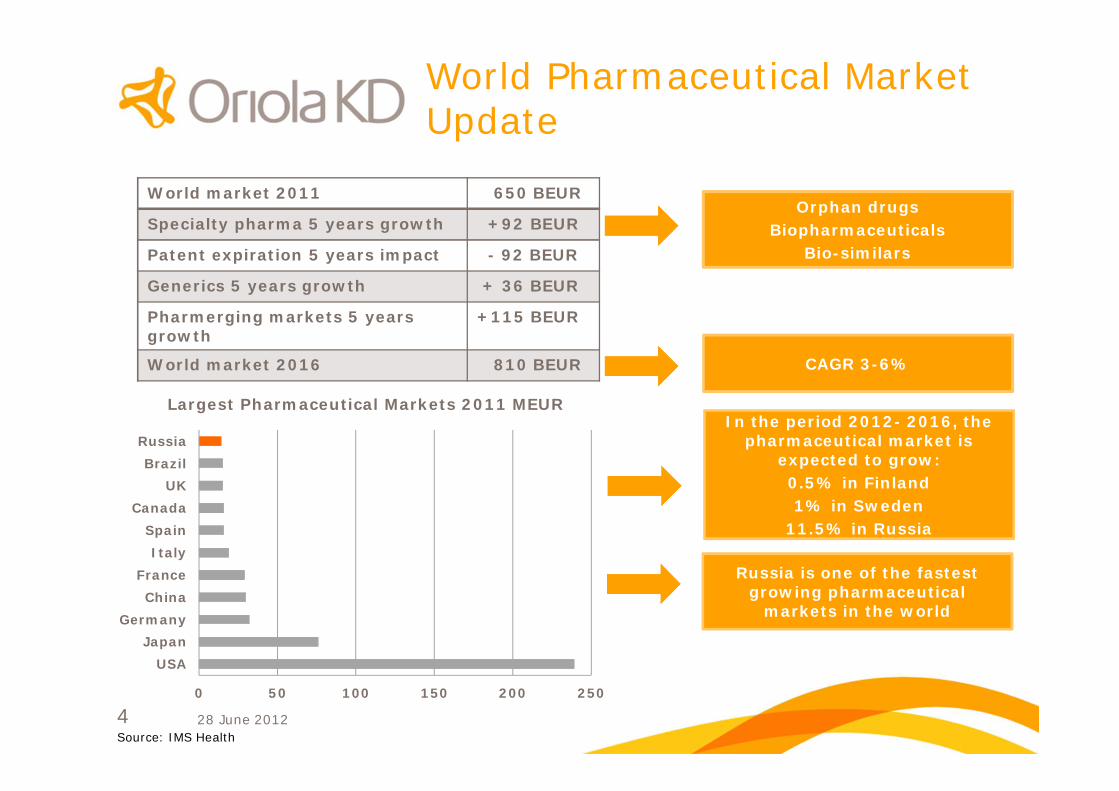
World Pharmaceutical MarketUpdate
Source: IMS Health
World market 2011 650 BEUR
Specialty pharma 5 years growth +92 BEUR
Patent expiration 5 years impact 92 BEUR
Generics 5 years growth + 36 BEUR
Pharmerging markets 5 yearsgrowth
+115 BEUR
World market 2016 810 BEUR
0 50 100 150 200 250
USA
Japan
Germany
China
France
Italy
Spain
Canada
UK
Brazil
Russia
Largest Pharmaceutical Markets 2011 MEUR
Orphan drugsBiopharmaceuticals
Biosimilars
CAGR 36%
Russia is one of the fastestgrowing pharmaceutical
markets in the world
In the period 2012 2016, thepharmaceutical market is
expected to grow:0.5% in Finland1% in Sweden
11.5% in Russia

5 28 June 2012
Pharmacy Sales Split
80
60
80
77
52
10
15
14
11
35
10
25
6
12
12
0 % 10 % 20 % 30 % 40 % 50 % 60 % 70 % 80 % 90 % 100 %
Germany
Norway
Finland
Sweden
Russia
Rx OTC Traded Goods
Source: Apteekkariliitto, KPMG & Pharmexpert based on 20102011 sales

6 28 June 2012
PharmaceuticalTrade Finlandand Baltics

7 28 June 2012
Pharmaceutical Wholesale Finland
OuluDistributioncentrefor NorthernFinland
EspooMaindistributioncentre
OuluDistributioncentrefor NorthernFinland
EspooMaindistributioncentre
Retail market
• Only private personscan own and runpharmacies
– Exception:University Pharmacy
• ~ 800 pharmaciesnationwide
Wholesale market
• Single channel model• Two wholesalers
– OriolaKD– Tamro (Phoenix)
OriolaKD’s wholesale operations
• Over 60 years of experience• Wide assortment of
trade goods forpharmacies
– Second largest provider of trade goodsproducts for pharmacies in Finland
• Strong cashflow• 47,1% market share (Q1/2012) in
pharmaceutical distribution• New picking automation line
to improve efficiency from Q2/2012

8 28 June 2012
PharmaceuticalTrade Sweden

9 28 June 2012
Pharmaceutical Wholesale SwedenWholesale market• Several wholesalers
– Wide pharmacy chains creating ownlogistics operations, started in OTCproducts and traded goodsdistribution
• Apoteket AB• Apotek Hjärtat• Four pharmacy chain collaboration
– Apoteksgruppen– DocMorris– Medstop– Vårdapoteket
– Two main companies inpharmaceutical wholesale
• OriolaKD• Tamro (Phoenix)
• Big pharmaceutical companiesprefer DTP (single channel)model
Mölnlycke Warehousing Pharma company
cooperation
Enköping Nationwide pharmacy
distribution
OriolaKD’s wholesale operations• Pharmacy distribution centralised
at the Enköping distribution centre• Pharmaceutical storage and
cooperation with pharmaceuticalmanufacturers centralised atMölnlycke
• 36,9% market share Q1/2012 inpharmaceutical distribution
• New transportation setup withSchenker started May 2012

10 28 June 2012
• Oriola AB has signed a letter of intent on purchasing, warehousingand pharmacy distribution of OTC products and traded goods forfour pharmacy chains in Sweden
– Apoteksgruppen, DocMorris, Medstop and Vårdapoteket– Combined market share of some 25 percent– Estimated purchases ~1 200 MSEK in twelve months– Full assortment distribution of OTC products and traded goods to all ~320
pharmacies within the collaboration
• Timetable– Letter of intent signed 9 May 2012– Signing of the cooperation agreement during Q2/2012– Cooperation estimated to start gradually in the autumn of 2012
• Oriola AB will continue to provide and develop high quality servicesfor pharmaceutical companies and pharmacies in Sweden
New Pharmacy Supply Chain Structurefor OTC Products and Traded Goods in Sweden

11 28 June 2012
New Pharmacy Supply Chain Structurefor OTC Products and TradedGoods in Sweden
Pharmacy chainsPharmaceutical distributors
Prewholesale
DTP
3PL
Wholesale
Pharmacy chains Approximatemarket shares
Pharmaceutical distributors
Prewholesale
DTP
3PL ~14%
~35%
~22%
~4%
Current structure Future structure *)
Prewholesale
DTP
3PL
3PL
3PLPrewholesale
Prewholesale
3PL
WholesaleDTP
3PL
Total marketshare ~25 %of collaborationbetween4 pharmacy chains
*) Including purchasing, warehousingand pharmacy distributionof OTC products and traded goods

12 28 June 2012
Pharmaceutical Retail Sweden
• Kronans Droghandel is the thirdlargest pharmacy chain inSweden
• 212 pharmacies nationwide with13,5 per cent market share
• 3 pharmacies opened in Q1/2012
• Cooperations with KF (COOP)providing excellent newpharmacy locations and accessto MedMera loyalty program *) Retail starting from 19 February 2010
*)

13 28 June 2012
Development of Pharmacy Market in Sweden
Number of pharmacies0 100 200 300 400
12
170 = 21220
(4.4%)
3
9.8%
4.4%
62
24 = 25
= 64(7.7%)
2
1
1(2.6%)
(0.6%)
(0.2%)
(2.4%)= 7531 650
30 = 42
= 24
11
12
18 = 7
14.4%(13.6%)
12.4%
150 = 154(10.8%)
4
2010 established 198
2010 acquired
1142011 established
Pharmacies +34% 1240
Q1 2012 established *
7Q1 2012 closed *
6
929
Others
30
50
19
35.8%
23.1%
315
208
= 364
= 273
(35.6%)
(22.4%)
19
14 1
Source: KPMG report 01/12, * OriolaKD 04/12
(Celesio)
(ICA)
(state)
(Altor)
(OriolaKD)
(private/state)
(Segulah)
(Priveq & Investor)
(Alliance Boots)

14 28 June 2012
Profitability by Pharmacy Chains in Sweden
*) 2010 based on proforma sales
Source: Annual reports and press releases
15 28 June 2012
PharmaceuticalTrade Russia

16 28 June 2012
Pharmaceutical Market in Russia
• Russia will become one of the largest pharmaceutical markets in Europe– Pharmaceutical market is expected to grow in average 11.5% per year during the next four
years– Pharmaceutical market has been growing in average 15% per year during the past four
years– Growth driven by the increased access to pharmaceuticals by the consumers
• Consumption of pharmaceuticals per capita is significantly lower than inEurope in average
– Western pharmaceuticals represent some 70% of value– Russian and East European pharmaceuticals represent some 70% of volume
• Commercial market is some 75% of total pharmaceutical market invalue term
• Government has announced pharmaceutical strategy for 2020– Increase the share of local manufacturing from the current 20% to 50%– Improve local research and development premises– Increase the share of manufactures who fulfil the Good Manufacturing Practices– Budget of some RUB 177 billion
• Currently price regulated pharmaceuticals represent some 42% of allpharmaceuticals
– List of regulated pharmaceuticals unchanged in 2013
Source: Pharmexpert, IMS & DSM

17 28 June 2012
Wholesale and Retail Market in Russia
Wholesale market
• Fast consolidation of wholesalemarket and fierce price competition
• Wholesalers are widening theiroperations to retail and production
• Top 10 wholesalers covering some98% of pharmaceutical purchasesfrom manufacturers
• Some 85% of sales from top 10wholesalers goes directly topharmacies and 15% to regionalwholesalers
• Macro economical factors like GDPand oil price will effect marketgrowth in Russia
Retail market
• Retail market is still very fragmented
• 30 000 –60 000 pharmacies inRussia
• Top 10 pharmacy chains coveringless than 20% of the market
– Provides longterm consolidation andgrowth opportunity
• New tax legislation scheme for theregions outside of Moscow started in2011
– Increased tax rates in the regions
• New business models evolvingfranchise and discounter pharmacies
• OTC & Traded Goods categoriesdriving the growth
Source: Pharmexpert, IMS & DSM 01/12

18 28 June 2012
Major Pharmaceutical Wholesale and RetailCompanies in Russia
Source: Pharmexpert & DSM 03/12 * Share of Direct Sales ** Out of the pocket market
Rank Pharmacychain
Share2011 **
1 Rigla 2.6%
2 36.6 2.3%
3 A5 2,0%
4 Pharmacor 1.6%
5 Implozia 1.3%
6 Pharmimpex 1.2%
7 Raduga 1.0%
8 OriolaKD 0.9%
9 Samson Pharma 0.8%
10 Doctor Stoletov 0.8%
Rank Wholesalers Share2011 *
1 SIA International 17.0%
2 Protek 15.7%
3 Katren 13.2%
4 Rosta 10.5%
5 AllianceHealthcare 7.6%
6 RPharm ~5,0%
7 OriolaKD ~5,0%
8 Pulse ~2,5%
9 Biotec ~2,5%
10 Imperia Pharma ~2,0%

19 28 June 2012
Pharmaceutical Wholesale Russia
Regional branches established by OriolaKD
Key figures for 2011:• The 7th largest wholesaler in Russia• All operations under Oriola brand• 13 logistics centres• Net sales EUR 591 million• Personnel 1,675

20 28 June 2012
Pharmaceutical Market Growth and Oriola WholesaleRussia´s Net Sales Growth in Russian Roubles
*) Oriola Wholesale Russia’s net sales growth in AprilDecember 2008
%
%
21 28 June 2012
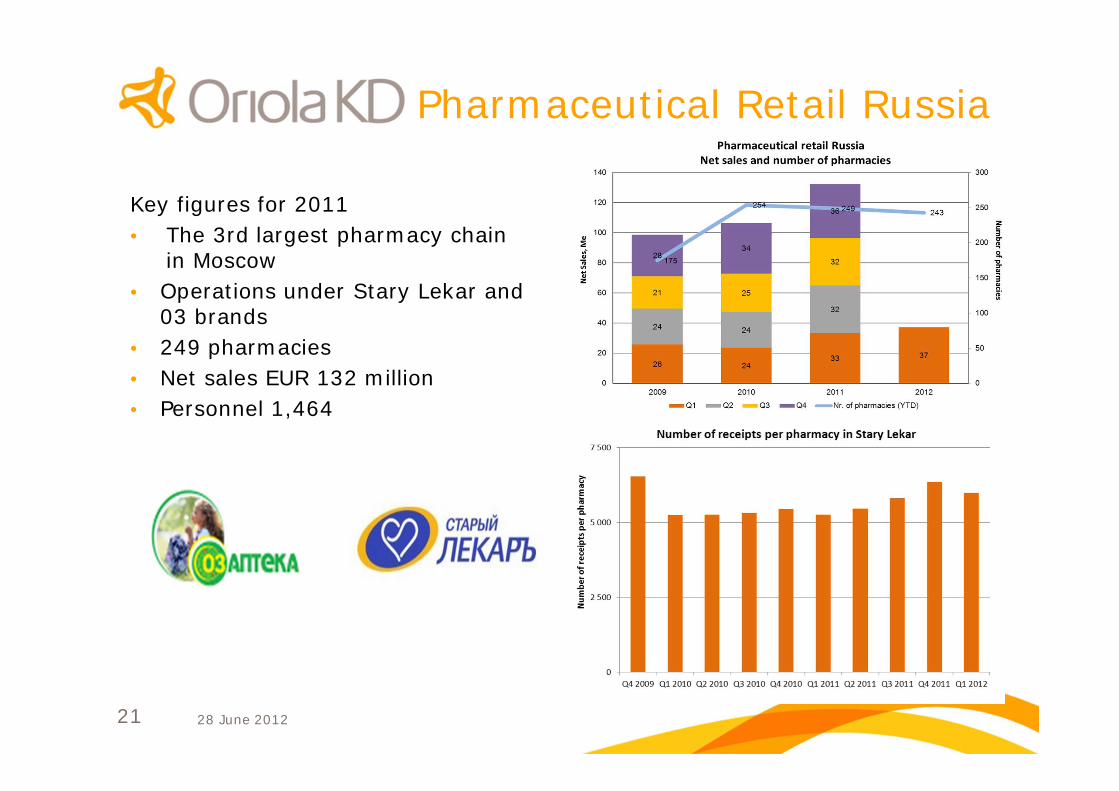
Pharmaceutical Retail Russia
Key figures for 2011• The 3rd largest pharmacy chain
in Moscow• Operations under Stary Lekar and
03 brands• 249 pharmacies• Net sales EUR 132 million• Personnel 1,464

22 28 June 2012
FinancialsQ1 2012

23 28 June 2012
Q1 2012
• Net sales grew by 11.5% to 591 Me– Net sales in Russia grew by 31% in Russian Rubles
• Operating profit was 5.4 Me (5.0)– Operating profit of Pharmaceutical Trade Sweden
increased from previous year– Operating loss of Pharmaceutical Trade Russia
decreased from previous year
• OriolaKD systematically continues to work onprojects in order to improve profitability in 2012

24 28 June 2012
Key Figures Q1 2012
*) Sisältää 26,7 M€Stary Lekar brändin aineettoman hyödykkeen arvonalennuksen tulosvaikutuksen
Income Statement Q1 2012 Q1 2011 2011
Net sales, Me 591 530 2146
Operating result excluding oneoffcosts and impairment charges, Me 5.4 5.0 13.2
Net result, Me 1.5 2.1 24.1
Earnings/share, Euro 0.01 0.01 0.16
Balance Sheet 31.3.2012 31.3.2011 31.12.2011
Equity, Me 303 362 299
Operative working capital, Me 35 34 83
Interestbearing net debt, Me 52 17 19
Balance sheet, total, Me 1218 1228 1273
Equity ratio, % 25% 30% 24%
Net gearing, % 17% 5% 6%
ROE 2.0% 2.4% 7.4%

25 28 June 2012
• In February 2012, OriolaKD renewed alllongterm external loan agreements
– 100.0 Me multicurrency revolving creditagreement
– Maturity April 2014– Financial covenants are based on ratio of net
debt to EBITDA and on the gearing ratio– The terms of the financial covenants were met
with a wide margin at the end of March 2012
• New committed longterm revolvingcredit facility of 100 Me and shorttermcredit account facilities of 43 Me stoodunused at the end of March 2012
• Of the 150 Me commercial paperprogramme 86 Me (0 Me) was used atthe end of March 2012
Finance and Cash FlowMe
Q1 2011 Q1 2012
• Changes in working capital33.1 Me (26.2 Me)
• Depreciations 4.4 Me (3.5 Me)• Gross investments 4.3 Me (5.6 Me)
– Pharmacy establishment– Information systems– Improvements in logistics efficiency

26 28 June 2012
Personnel 31 March 2012
Operating segment 31.3.2012 31.3.2011 Change, %
Pharmaceutical WholesaleFinland and Baltics
503 486 +3%
Pharmaceutical RetailSweden
991 1022 3%
Pharmaceutical WholesaleSweden
241 282 15%
Pharmaceutical RetailRussia
1381 1582 13%
Pharmaceutical WholesaleRussia
1666 1549 +8%
Total 4783 4921 3%
(11 %)
(26 %)(63 %)

27 28 June 2012
Risks• OriolaKD has identified the following principal strategic and operational risks
in its business– Growth in number of pharmacies outperforms growth in the market, leading to intense competition– Competition for market share in pharmaceutical wholesale in a consolidating market– Ensuring cost efficiency, flexibility and quality– Development of processes and infrastructure required by strategic expansion– Requirements and restrictions on pharmaceutical retail and wholesale imposed by the authorities,
especially price regulation– Commitment of key employees
• The major financial risks for OriolaKD involve currency rate, liquidity, interest rateand credit risks
– Expansion of operations into new business areas and new markets has increased the financial risks– Currency risks are the most significant financial risks in Russia and Sweden
• Changes in the value of the Russian Ruble or the Swedish Krona will have an impact on OriolaKD’sfinancial performance and equity
• Goodwill and intangible rights are subject to impairment testing made at leastonce a year
– Changes in cash flow forecasts based on strategic plans, or in the discount rate or perpetuity growth rate,can cause a goodwill writedown, which would weaken OriolaKD’s profit
– Especially the impairment test of the goodwill of the Russian cashgenerating unit is more sensitive thanbefore to changes in the discount rate or cashflow forecasts
• Nearterm risks and uncertainty factors– Intense competition and the number of new pharmacies to be established will have an impact on the
profitability of OriolaKD’s pharmacy business in Sweden and Russia– Changes in the exchange rate of the Russian Ruble, a potential increase in credit risks concerning customers
and changes in the competitive environment may have an impact on the profitability of the wholesale businessin Russia

28 28 June 2012
Outlook 2012Market Development
• OriolaKD's outlook for 2012 is based on external market forecasts,supplier and customer agreements and management assessments
• In the period 20122016, the pharmaceutical market is expected togrow annually in average by 0.5 per cent in Finland, 1 per cent inSweden, and 11.5 per cent in Russia, measured in local currencies(source: IMS Health 04/2012)
• Competition is expected to remain very tough in the Russianpharmaceutical retail and wholesale business and the Swedishpharmaceutical retail business
29 28 June 2012
Outlook 2012
• Outlook for 2012 unchanged– OriolaKD’s net sales are expected to increase 10–15
per cent and operating profit excluding oneoff itemsis expected to be EUR 23–33 million in 2012

30 28 June 2012
Sweden– Opening some 15 new pharmacies– Improving the competitiveness of individual
pharmacies– Purchasing– Increase of traded goods and OTC
assortment
Russia– Development of pharmacy portfolio– Improving the competitiveness of individual
pharmacies– Strengthening the product assortment
Focus Areas in 2012
Finland– New picking automation line taken in use
increases efficiency of logistics
Sweden– Development of new logistics services for
pharmacy chains
Russia– Increase of regional and hospital sales– Implementation of new warehouse
management system at the start of 2013– Investigate opportunities to establish a new
automated main logistics centre in Moscow
Wholesale Retail

31 28 June 2012
Long Term Targets and Dividend Policy
Growth
• To grow faster than therelevant markets
Profitability
• ROE (Return on Equity)target is over 15 per cent
Balance sheet
• Longterm average gearingratio target is between40 60 per cent
Dividend Policy
• OriolaKD will seek to payout annually as dividendsapproximately 50 per centof earnings per share
• The Company’s strategyand financial position shallbe taken into considerationwhen determining the annualdividend payout ratio


Disclosure Aspects
• The assumptions, opinions, estimates and views expressed in thispresentation are solely the opinions and views of the company unlessa reference to the source of the information is stated
• They reflect the current view of the company with regard to thediscussed issues
• Several factors can however cause changes to these opinions andviews
• Neither the company nor its management can answer for any futureaccuracy of the opinions or views expressed in this presentation or theactual occurrence of any forecasts