orsi report formatting using styles
TRANSCRIPT
STRATEGIC PLAN REPORT: STUDENT SUCCESS
We commit to reach, challenge, and prepare every student for success in school and life.
November 2020
Narrative Summary for Fiscal Year 2020
i
FAIRFAX COUNTY PUBLIC SCHOOLS Scott Brabrand, Ed.D.
Division Superintendent
Marty K. Smith Chief Operating Officer
GOAL CHAMPION
Sloan Presidio Ed.D, J.D. Assistant Superintendent, Instructional Services
OFFICE OF RESEARCH AND STRATEGIC IMPROVEMENT
Ludmila Z. Hruda, M.S. Ed. Director
ii
Strategic Plan Report: Student Success Executive Report
November 2020
Overview
• The Student Success Strategic Plan Report is one of four reports developed by Fairfax County Public Schools (FCPS) to provide a public accounting of performance on its strategic aims. It provides division leadership and the School Board with information to judge progress, guide improvement, and account for the use of public funds.
• The Student Success Strategic Plan Report reviews the progress FCPS has made toward attaining the performance targets laid out in the Strategic Focus SYs 2018-20. It expands upon previous goal reports by taking a deeper dive into performance on those metrics most associated with achieving the Division’s strategic aims.
• This report contains three Desired Outcome (the “What”) intended to drive the priority work and funding in the Division. Within each Desired Outcome, one or more Aspirations describe what we hope to see when the Desired Outcome is fully realized. The metrics in the report measure progress toward the target. The annual reports presented to the School Board provide division leadership and the School Board with information to judge progress, guide improvement, and account for the use of public funds.
Desired Outcome: Elimination of Gaps
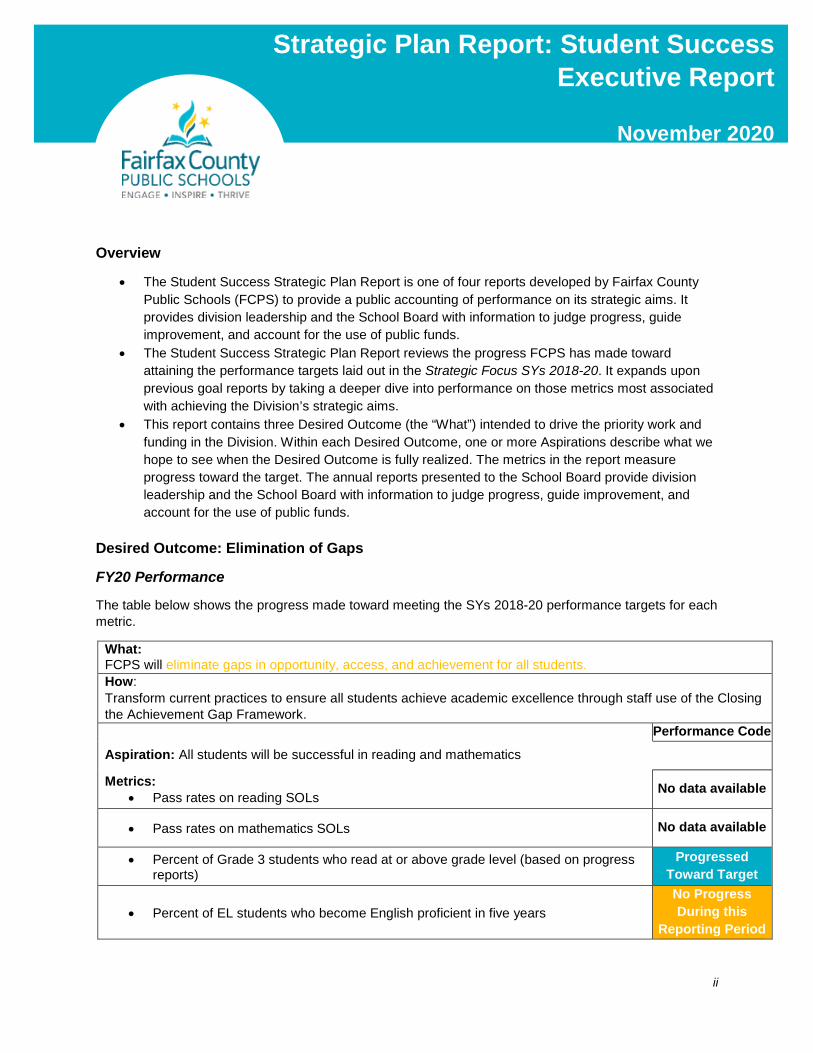
FY20 Performance
The table below shows the progress made toward meeting the SYs 2018-20 performance targets for each metric.
What: FCPS will eliminate gaps in opportunity, access, and achievement for all students. How: Transform current practices to ensure all students achieve academic excellence through staff use of the Closing the Achievement Gap Framework. Performance Code
Aspiration: All students will be successful in reading and mathematics
Metrics: • Pass rates on reading SOLs
No data available
• Pass rates on mathematics SOLs No data available
• Percent of Grade 3 students who read at or above grade level (based on progress reports)
Progressed Toward Target
• Percent of EL students who become English proficient in five years No Progress During this
Reporting Period
iii
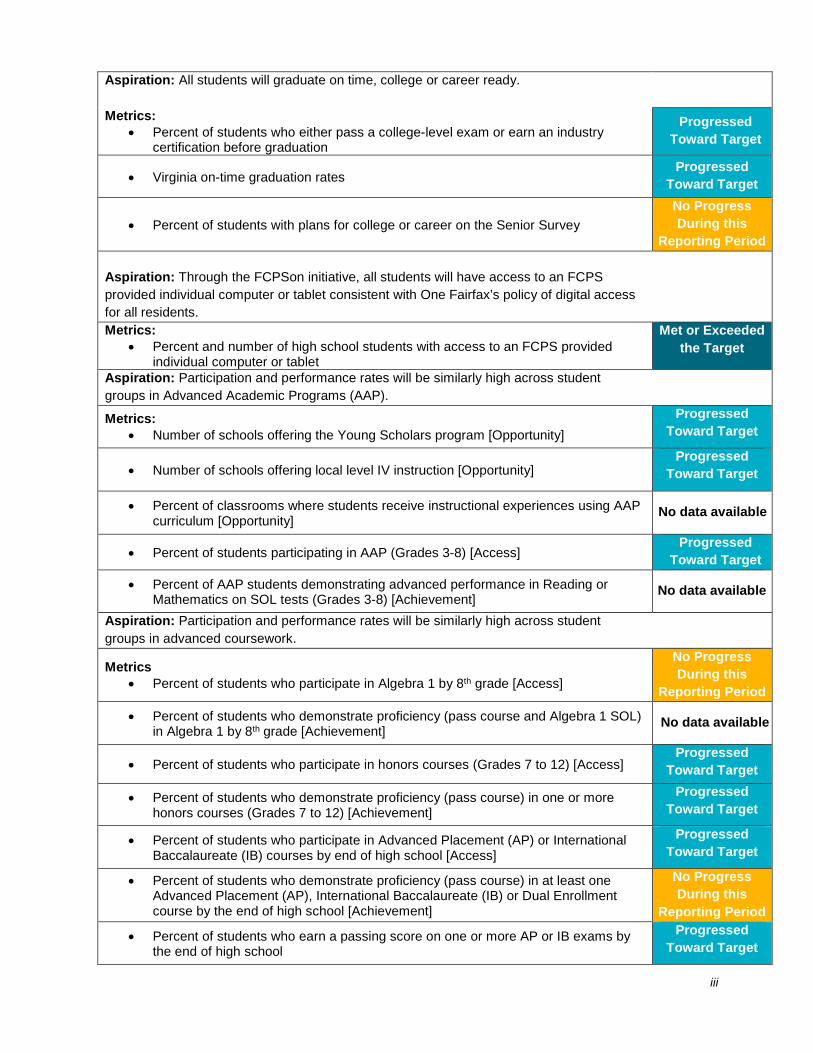
Aspiration: All students will graduate on time, college or career ready.
Metrics: • Percent of students who either pass a college-level exam or earn an industry
certification before graduation
Progressed Toward Target
• Virginia on-time graduation rates Progressed
Toward Target
• Percent of students with plans for college or career on the Senior Survey No Progress During this
Reporting Period Aspiration: Through the FCPSon initiative, all students will have access to an FCPS provided individual computer or tablet consistent with One Fairfax’s policy of digital access for all residents.
Metrics: • Percent and number of high school students with access to an FCPS provided
individual computer or tablet
Met or Exceeded the Target
Aspiration: Participation and performance rates will be similarly high across student groups in Advanced Academic Programs (AAP).
Metrics: • Number of schools offering the Young Scholars program [Opportunity]
Progressed Toward Target
• Number of schools offering local level IV instruction [Opportunity] Progressed
Toward Target
• Percent of classrooms where students receive instructional experiences using AAP curriculum [Opportunity]
No data available
• Percent of students participating in AAP (Grades 3-8) [Access] Progressed
Toward Target
• Percent of AAP students demonstrating advanced performance in Reading or Mathematics on SOL tests (Grades 3-8) [Achievement]
No data available
Aspiration: Participation and performance rates will be similarly high across student groups in advanced coursework.
Metrics • Percent of students who participate in Algebra 1 by 8th grade [Access]
No Progress During this
Reporting Period
• Percent of students who demonstrate proficiency (pass course and Algebra 1 SOL) in Algebra 1 by 8th grade [Achievement] No data available
• Percent of students who participate in honors courses (Grades 7 to 12) [Access] Progressed
Toward Target
• Percent of students who demonstrate proficiency (pass course) in one or more honors courses (Grades 7 to 12) [Achievement]
Progressed Toward Target
• Percent of students who participate in Advanced Placement (AP) or International Baccalaureate (IB) courses by end of high school [Access]
Progressed Toward Target
• Percent of students who demonstrate proficiency (pass course) in at least one Advanced Placement (AP), International Baccalaureate (IB) or Dual Enrollment course by the end of high school [Achievement]
No Progress During this
Reporting Period
• Percent of students who earn a passing score on one or more AP or IB exams by the end of high school
Progressed Toward Target
iv
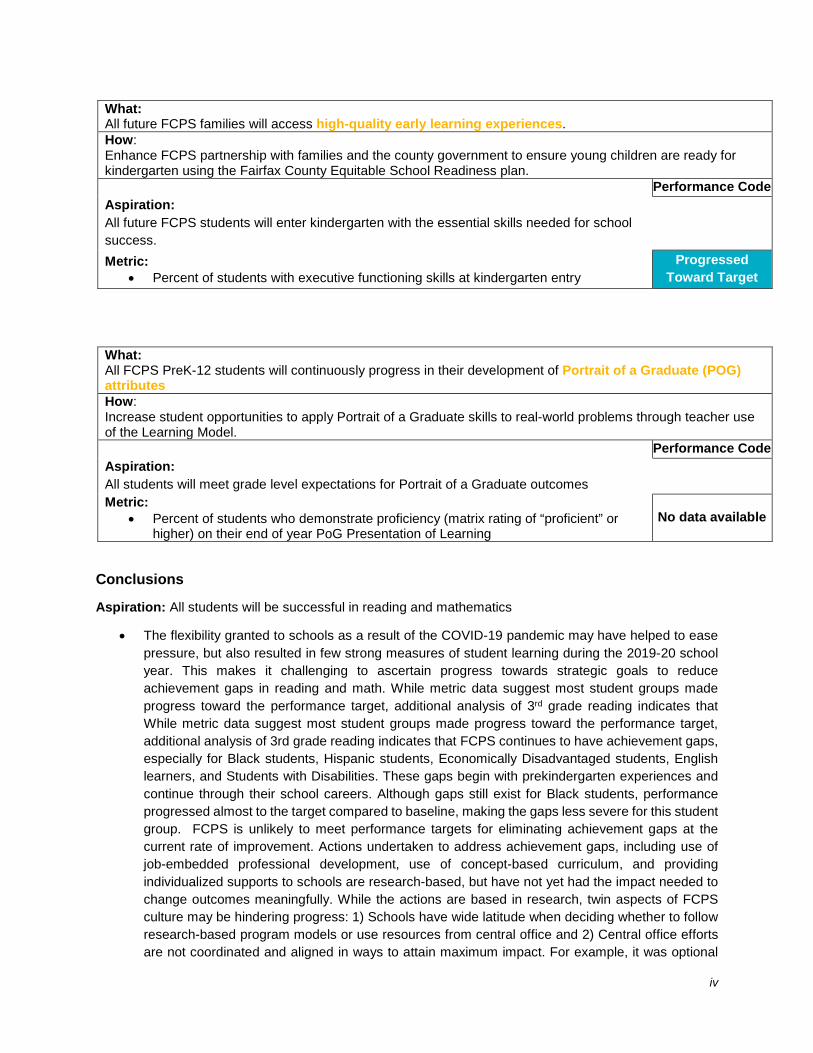
What: All future FCPS families will access high-quality early learning experiences. How: Enhance FCPS partnership with families and the county government to ensure young children are ready for kindergarten using the Fairfax County Equitable School Readiness plan. Performance Code Aspiration: All future FCPS students will enter kindergarten with the essential skills needed for school success.
Metric: • Percent of students with executive functioning skills at kindergarten entry
Progressed Toward Target
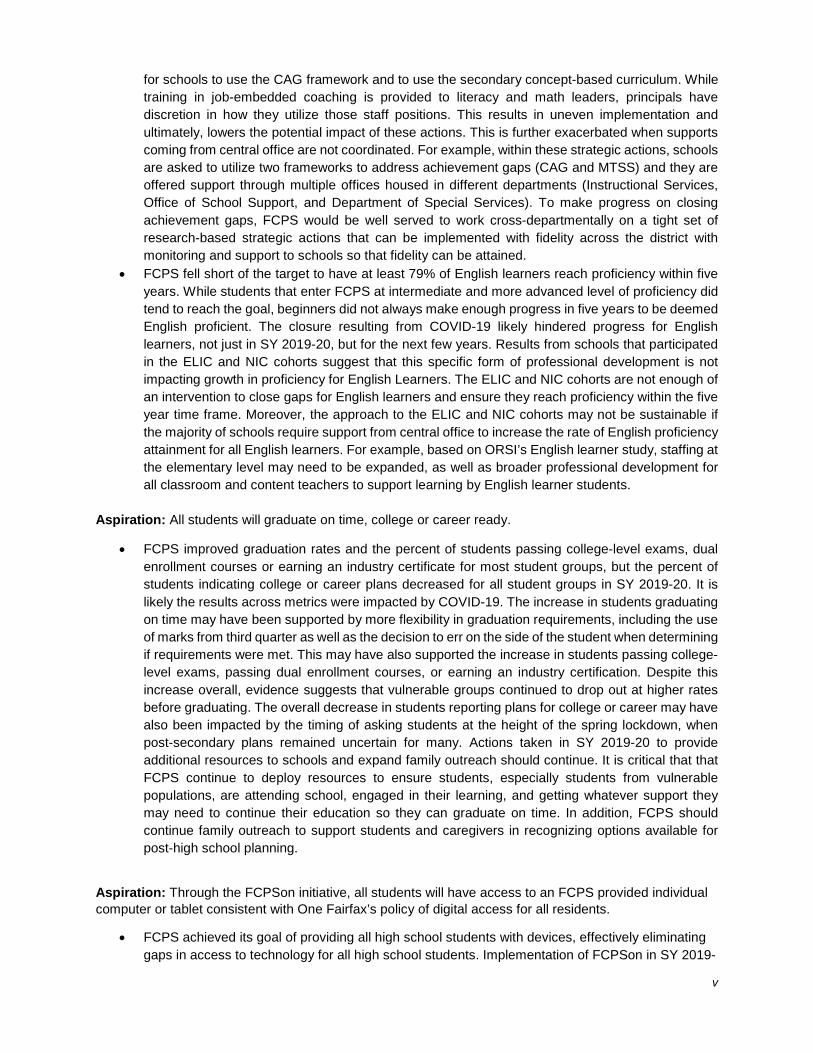
What: All FCPS PreK-12 students will continuously progress in their development of Portrait of a Graduate (POG) attributes How: Increase student opportunities to apply Portrait of a Graduate skills to real-world problems through teacher use of the Learning Model. Performance Code Aspiration: All students will meet grade level expectations for Portrait of a Graduate outcomes
Metric: • Percent of students who demonstrate proficiency (matrix rating of “proficient” or
higher) on their end of year PoG Presentation of Learning No data available
Conclusions
Aspiration: All students will be successful in reading and mathematics
• The flexibility granted to schools as a result of the COVID-19 pandemic may have helped to ease pressure, but also resulted in few strong measures of student learning during the 2019-20 school year. This makes it challenging to ascertain progress towards strategic goals to reduce achievement gaps in reading and math. While metric data suggest most student groups made progress toward the performance target, additional analysis of 3rd grade reading indicates that While metric data suggest most student groups made progress toward the performance target, additional analysis of 3rd grade reading indicates that FCPS continues to have achievement gaps, especially for Black students, Hispanic students, Economically Disadvantaged students, English learners, and Students with Disabilities. These gaps begin with prekindergarten experiences and continue through their school careers. Although gaps still exist for Black students, performance progressed almost to the target compared to baseline, making the gaps less severe for this student group. FCPS is unlikely to meet performance targets for eliminating achievement gaps at the current rate of improvement. Actions undertaken to address achievement gaps, including use of job-embedded professional development, use of concept-based curriculum, and providing individualized supports to schools are research-based, but have not yet had the impact needed to change outcomes meaningfully. While the actions are based in research, twin aspects of FCPS culture may be hindering progress: 1) Schools have wide latitude when deciding whether to follow research-based program models or use resources from central office and 2) Central office efforts are not coordinated and aligned in ways to attain maximum impact. For example, it was optional
v
for schools to use the CAG framework and to use the secondary concept-based curriculum. While training in job-embedded coaching is provided to literacy and math leaders, principals have discretion in how they utilize those staff positions. This results in uneven implementation and ultimately, lowers the potential impact of these actions. This is further exacerbated when supports coming from central office are not coordinated. For example, within these strategic actions, schools are asked to utilize two frameworks to address achievement gaps (CAG and MTSS) and they are offered support through multiple offices housed in different departments (Instructional Services, Office of School Support, and Department of Special Services). To make progress on closing achievement gaps, FCPS would be well served to work cross-departmentally on a tight set of research-based strategic actions that can be implemented with fidelity across the district with monitoring and support to schools so that fidelity can be attained.
• FCPS fell short of the target to have at least 79% of English learners reach proficiency within five years. While students that enter FCPS at intermediate and more advanced level of proficiency did tend to reach the goal, beginners did not always make enough progress in five years to be deemed English proficient. The closure resulting from COVID-19 likely hindered progress for English learners, not just in SY 2019-20, but for the next few years. Results from schools that participated in the ELIC and NIC cohorts suggest that this specific form of professional development is not impacting growth in proficiency for English Learners. The ELIC and NIC cohorts are not enough of an intervention to close gaps for English learners and ensure they reach proficiency within the five year time frame. Moreover, the approach to the ELIC and NIC cohorts may not be sustainable if the majority of schools require support from central office to increase the rate of English proficiency attainment for all English learners. For example, based on ORSI’s English learner study, staffing at the elementary level may need to be expanded, as well as broader professional development for all classroom and content teachers to support learning by English learner students.
Aspiration: All students will graduate on time, college or career ready.
• FCPS improved graduation rates and the percent of students passing college-level exams, dual enrollment courses or earning an industry certificate for most student groups, but the percent of students indicating college or career plans decreased for all student groups in SY 2019-20. It is likely the results across metrics were impacted by COVID-19. The increase in students graduating on time may have been supported by more flexibility in graduation requirements, including the use of marks from third quarter as well as the decision to err on the side of the student when determining if requirements were met. This may have also supported the increase in students passing college-level exams, passing dual enrollment courses, or earning an industry certification. Despite this increase overall, evidence suggests that vulnerable groups continued to drop out at higher rates before graduating. The overall decrease in students reporting plans for college or career may have also been impacted by the timing of asking students at the height of the spring lockdown, when post-secondary plans remained uncertain for many. Actions taken in SY 2019-20 to provide additional resources to schools and expand family outreach should continue. It is critical that that FCPS continue to deploy resources to ensure students, especially students from vulnerable populations, are attending school, engaged in their learning, and getting whatever support they may need to continue their education so they can graduate on time. In addition, FCPS should continue family outreach to support students and caregivers in recognizing options available for post-high school planning.
Aspiration: Through the FCPSon initiative, all students will have access to an FCPS provided individual computer or tablet consistent with One Fairfax’s policy of digital access for all residents.
• FCPS achieved its goal of providing all high school students with devices, effectively eliminating gaps in access to technology for all high school students. Implementation of FCPSon in SY 2019-

vi
20 not only involved providing students with devices, but also with providing school-based personnel in high schools and middle schools with the professional development they need to provide meaningful instruction using technology. The FCPSOn program implementation also involved an annual evaluation to ensure that access to technology promotes better educational experiences for students and is used appropriately to promote digital citizenship skills for students. FCPS is well-positioned to continue implementation of FCPSon to middle school students and should continue to follow the multi-year comprehensive plan, which will increase equity in access to technology.
Aspiration: Participation and performance rates will be similarly high across student groups in Advanced Academic Programs (AAP).
• FCPS efforts have led to greater participation in Advanced Academic Programs across student groups, however gaps still exist, meaning that FCPS did not achieve its Aspiration in closing gaps in AAP participation. Additionally, FCPS did not meet its goal that all elementary schools would offer the Young Scholars Program and Local Level IV AAP services. The number of classrooms that offer AAP curriculum were also unable to be calculated. As such, FCPS did not achieve its implementation goals for the AAP Aspiration, which could have contributed to gaps in participation. Specifically, only two student groups (White and Asian) met or exceed the performance target in SY 2019-20. These are the same student groups that the AAP study found were more advantaged because of parent involvement and potential implicit biases from teachers. One particular group that showed concerning performance were English Learner students. That is, only 2 percent of English Learner students participated in AAP in SY 2019-20. FCPS should consider examining why English Learner student participation is so low in AAP. The AAP study showed that the Gifted Behaviors Rating Scale (GBRS), or teacher assessment of students, had greater weight in determining eligibility for AAP services, which could explain some of the lower participation for English learners if teachers have difficulty observing their ability to engage in gifted education while simultaneously focusing on helping them navigate standard curriculum taught in a language that is not their home language.
• FCPS did increase participation for all student groups from the baseline, indicating that efforts taken have made a difference in participation rates. Specifically, offering Young Scholars and Local Level IV increased the number of students who were not eligible for Level IV services, but still received those services. Additionally, with increased training for Advanced Academics Resource Teachers (AARTs) to facilitate embedding AAP curriculum into Tier 1 instruction, FCPS should continue to see increases in students who have experienced more rigorous curriculum. Finally, FCPS should see greater equity in AAP participation once implementation of recommendations from the AAP study occur in SY2021-22. Equity in AAP has been an interest of FCPS for many years, and a focus needs to be on providing all students with curriculum that is appropriate based on their aptitude. If FCPS continues to prioritize equity in AAP participation and performance, additional efforts beyond what is currently offered need to take place around increasing participation from non-White and non-Asian student groups, and especially around increasing participation from English Learner students.
Aspiration: Participation and performance rates will be similarly high across student groups in advanced coursework.
• FCPS has not closed participation gaps in advanced coursework, with the same groups underrepresented in Algebra I by 8th grade, honors courses, and college-level courses. In SY 2019-20, the two student groups who met or exceeded the target were the same across the three participation metrics, White and Asian students. Gaps for the other student groups remained

vii
consistent across the three participation metrics, with English Learner students consistently having the lowest rate of participation in advanced coursework. Unfortunately, the gaps have remained a trend from the baseline, despite progress that has been made for many student groups. Additionally, when examining the different types of coursework students took prior to secondary advanced coursework, results showed that earlier participation in AAP and honors courses led to greater participation in Algebra I, Honors, and AP/IB/DE courses. If equity in participation in advanced coursework remains a priority for FCPS, additional efforts are needed to reduce the gaps in participation in advanced coursework. The efforts that FCPS made in SY 2019-20 to increase participation of underrepresented student groups in advanced coursework resulted in increases in participation from some student groups, especially for Black students and Students with Disabilities, however, these efforts did not lead to underrepresented groups meeting the target. This means that current efforts should either have tighter implementation to achieve their goals, or new, alternative actions should be taken. Overall, these strategic actions are similar to those taken in previous reporting years, and have had limited impact.
• Given that analyses show that a large majority of students participate in advanced coursework prior to when the metric is measured, and that participation gaps exist in earlier advanced opportunities (see AAP Aspiration), it may be best to promote earlier advanced opportunities for underrepresented students, with continued support in the secondary years. The Young Scholars model does focus on providing these opportunities to underserved students, but school fidelity of implementation of this program varies, and eligibility for participation in Young Scholars is determined at the school level, which could limit its reach. As such, FCPS should focus on stronger implementation of Young Scholars at both the elementary and secondary level, and seek out additional actions that have a larger reach to improve participation of underrepresented groups, especially English Learner students. The impact of actions targeted at providing opportunities in elementary school on secondary advanced coursework would take multiple years to be observed and would likely impact the budget.
Aspiration: All future FCPS students will enter kindergarten with the essential skills needed for school success.
• FCPS’ progress on the early education Aspiration is difficult to determine, given that SY 2019-20 was the first year metric data was available. However, the data show that 24 percent of all students entering FCPS do not have the executive functioning skills they need to be ready for kindergarten. Additionally, the data show that gaps between student groups already exist at kindergarten entry. Further evaluation of the gaps showed that prekindergarten experience was beneficial to most students entering kindergarten with executive functioning skills, except for English Learner students. For English Learner students, prekindergarten experiences did not make a difference in performance. Additionally, for Black students, prekindergarten experience was helpful, but performance across the board for Black students was lower, regardless of experiences prior to kindergarten entry. Furthermore, additional analyses show how important executive functioning skills are, as these skills at kindergarten entry were associated with life, work, and citizenship skills from end of year progress reports.
• In SY 2019-20, FCPS provided low income students with prekindergarten experiences through FECEP, which did make a difference in their executive functioning skills in kindergarten. Bridge to Kindergarten also provides future FCPS students with classroom experience, but it is unclear whether the short time that students are exposed to the classroom environment with no prekindergarten experience is sufficient to increase executive functioning skills. At the very least, Bridge to Kindergarten familiarizes parents and students with the new environment and prepares them for what to expect during the school year. Additionally, it is unclear whether the professional development and outreach that FCPS conducted through the partnership with Fairfax County yielded increases in executive functioning, as the metric is measured at the beginning of the year,
viii
and the activities associated with the partnership were taken throughout the year or were cancelled because of COVID-19. FCPS has limited resources and influence to ensure the skills of future students. Therefore, partnerships and early education programming are the two approaches that will likely yield the best outcomes, both of which were part of FCPS efforts in SY 2019-20. However, these approaches have not been implemented to their fullest possibility for many reasons that include time and money.
• Looking forward, the data show that FCPS should consider how to build executive functioning skills of young students beyond providing slots for prekindergarten. Specifically, FCPS should enhance the outreach that they provide to families about the importance of these skills, including increasing partnerships with those who interact with families on a regular basis (e.g. pediatricians), and expanding workshops to parents to provide tools at home or other settings to facilitate executive functioning skills. More resources may need to be invested to expand these opportunities within FCPS so that partnerships can continue to be meaningful, and so that FCPS has a more hands-on influence on preparing young children for kindergarten. Additionally, given that the data show that FCPS students enter kindergarten already experiencing gaps, which means that some students are below the curve before they even arrive, FCPS should take additional efforts to address these gaps. While FCPS has limited control in closing gaps prior to kindergarten entry, FCPS should advocate with partners to assess these skills early on to determine early intervention needs. One way that FCPS can address this is to encourage local prekindergarten providers to assess students early and provide resources to improve deficits in those skills.
Aspiration: All students will meet grade level expectations for Portrait of a Graduate outcomes
• Portrait of a Graduate (PoG) has been a focus for FCPS since it was adopted in 2014, but formal data has yet to be collected on progress toward this metric. There has been no metric data available as part of strategic plan reporting, and only 21 schools were expected to have presentations of learning available for analysis, even before the COVID-19 interruption. This goal will not be achieved at the current rate of implementation and the lack of formal data complicates the ability to determine a return on investment thus far. At this time, actions designed to integrate Portrait of a Graduate into classrooms, including Presentations of Learning (POL) and Problem-based Learning (PBL) cohorts, Compass courses, Global Classroom Project (GCP) groups, and
• Science, Engineering, Art, and Mathematics (STEAM) cohorts, rely on a relatively small number of teachers and schools to spread the work to others. While the professional development for these cohorts supports the ultimate goal, there has yet to be a critical mass of educators in FCPS invested in these actions to make significant progress toward this goal. With PoG listed a priority and resources allocated toward increasing these attributes for all students, it is unclear why implementation has not been scaled to include all FCPS schools. FCPS must either commit to following through on this goal for all schools or revise it.
ix
School Board Considerations Elimination of Gaps Strategic Concerns FCPS should provide additional supports to all schools where reading and mathematics gaps exist to ensure students are provided with every opportunity to succeed. The new Department of School Improvement and Support will expand its supports to all schools, partnering with school administrative teams to identify gaps that exist and provide specific recommendations that can be incorporated in their School Improvement and Innovation Plans. Budget Considerations The gaps for English learner students across the metric data, coupled with the findings from a strategic review on English learners that showed underfunding for English learner resources in elementary schools, indicate a need for changes to the staffing formula for ESOL staffing at the elementary level. FCPS should fund additional AARTs as a resource to schools who want to provide more students with advanced curriculum, especially at the elementary level. Moreover, implementation of the recommendations associated with the AAP study may have budget implications. FCPS should establish long term funding for digital curriculum tools (ST Math, Gizmos, Imagine Learning, Pioneer Valley, Jason Learning) FCPS should establish long term funding for on-demand translations to support written and oral communication with families Policy FCPS should revise its policies on open enrollment and student participation in advanced coursework in order to provide equitable opportunities for all students. Specifically, FCPS should prioritize aptitude and performance in courses over parent and teacher voice, as both indicators could show bias.
Early Education Strategic Concerns FCPS should continue to work with the County and the community to enhance partnerships, which may require support or facilitation from the School Board. Budget Considerations FCPS could reach more families if there was a full-time position in the Early Education Office designed to make outreach efforts.
FCPS should expand Bridge to Kindergarten to reach all students without prekindergarten experience to ensure that students enter Kindergarten with some familiarity of the rules and expectations of a classroom setting.
FCPS should continue to fund Bridge to Kindergarten and advocate for additional Fairfax County funding of Early Childhood Programs
FCPS should establish permanent funding for Waterford Early Learning: Reading and Professional Services: Virtual Training
Policy

x
None
Portrait of a Graduate Strategic Concerns Given the FCPS commitment to equity, structures and expectations should be established to ensure that all students receive equitable learning opportunities, including the opportunity to participate in presentations of learning, that focus on development of POG skills. All levels of leadership are needed to clearly communicate POG as a priority goal/outcome for students. Budget Considerations To fully implement POL as originally intended, more resources are needed to scale the current work to the division level. Resources may include additional positions to lead the work, large scale professional development for teachers, and systems in place to manage the data collection.
If FCPS integrates PoG skills into curriculum, money would be needed for curriculum development and professional development for central office staff as well as teachers.
Policy None

xi
Table of Contents
Introduction .............................................................................................................................. 1 Enhanced Reporting Features ........................................................................................ 1 Report Organization ....................................................................................................... 2 Desired Outcomes and Aspirations for Student Success ................................................ 3 Metrics and Performance Judgments ............................................................................. 3 Return on Investment (ROI) ........................................................................................... 4
Elimination of Gaps ................................................................................................................. 6 Aspiration: Reading and Math. ................................................................................................... 6
SY 2019-20 Outcomes and Analysis .............................................................................. 6 SY 2019-20 Actions, Costs, and Return on Investment .................................................10 Conclusions ...................................................................................................................17 Goal Champion Response to Conclusions ....................................................................18
Aspiration: College and Career Readiness ................................................................................20 SY 2019-20 Outcomes and Analysis .............................................................................20 SY 2019-20 Actions, Costs, and Return on Investment .................................................23 Conclusions ...................................................................................................................25 Goal Champion Response to Conclusions ....................................................................26
Aspiration: Digital Access ..........................................................................................................27 SY 2019-20 Outcomes and Analysis .............................................................................27 SY 2019-20 Actions, Costs, and Return on Investment .................................................27 Conclusions ...................................................................................................................31 Goal Champion Response to Conclusions ....................................................................31
Aspiration: Advanced Academic Programs (AAP) .....................................................................32 SY 2019-20 Outcomes and Analysis .............................................................................32 SY 2019-20 Actions, Costs, and Return on Investment .................................................35 Conclusions ...................................................................................................................41 Goal Champion Response to Conclusions ....................................................................41
Aspiration: Advanced Coursework ............................................................................................41 SY 2019-20 Outcomes and Analysis .............................................................................41 SY 2019-20 Actions, Costs, and Return on Investment .................................................46 Conclusions ...................................................................................................................48 Goal Champion Response to Conclusions ....................................................................50
School Board Considerations ....................................................................................................51 Early Education .......................................................................................................................51
SY19-20 Outcomes and Analysis ..................................................................................51 SY 2019-20 Actions, Costs, and Return on Investment .................................................53 Conclusions ...................................................................................................................57
xii
Goal Champion Response to Conclusions ....................................................................58 School Board Considerations ....................................................................................................61 Portrait of a Graduate .............................................................................................................61
SY19-20 Outcomes and Analysis ..................................................................................51 SY 2019-20 Actions, Costs, and Return on Investment .................................................63 Conclusions ...................................................................................................................66 Goal Champion Response to Conclusions ....................................................................66
School Board Considerations ....................................................................................................68 Appendix A ...............................................................................................................................70 Appendix B ...............................................................................................................................78 Appendix C ...............................................................................................................................82
1
Introduction FCPS’ Strategic Plan contains four goal areas, each with a set of Desired Outcomes (the “What”) intended to drive the priority work and funding in the Division. Within each Desired Outcome, one or more Aspirations describe what we hope to see when the Desired Outcome is fully realized. This report reflects the status of FCPS’ progress toward its Strategic Focus for school years (SY) 2018-20 for the Student Success goal area. The report reflects data about FCPS’ functioning and performance during SY 2019-20 / fiscal year (FY) 20.
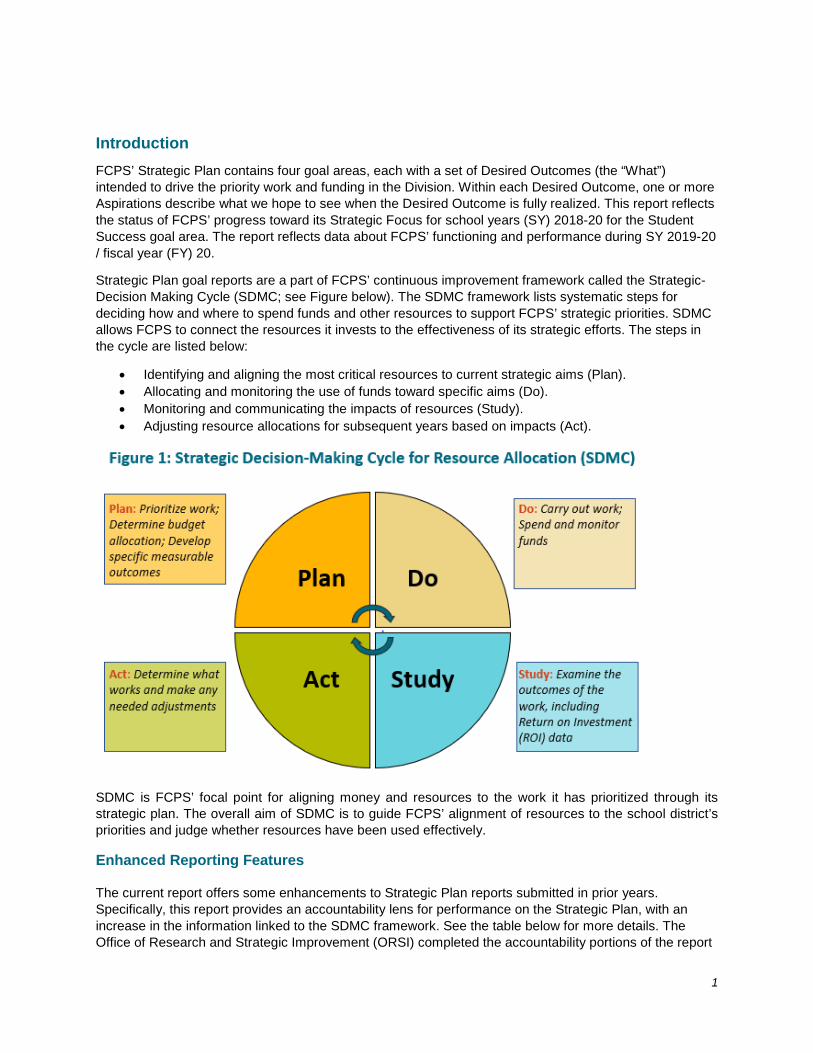
Strategic Plan goal reports are a part of FCPS’ continuous improvement framework called the Strategic-Decision Making Cycle (SDMC; see Figure below). The SDMC framework lists systematic steps for deciding how and where to spend funds and other resources to support FCPS’ strategic priorities. SDMC allows FCPS to connect the resources it invests to the effectiveness of its strategic efforts. The steps in the cycle are listed below:
• Identifying and aligning the most critical resources to current strategic aims (Plan). • Allocating and monitoring the use of funds toward specific aims (Do). • Monitoring and communicating the impacts of resources (Study). • Adjusting resource allocations for subsequent years based on impacts (Act).
SDMC is FCPS’ focal point for aligning money and resources to the work it has prioritized through its strategic plan. The overall aim of SDMC is to guide FCPS’ alignment of resources to the school district’s priorities and judge whether resources have been used effectively.
Enhanced Reporting Features The current report offers some enhancements to Strategic Plan reports submitted in prior years. Specifically, this report provides an accountability lens for performance on the Strategic Plan, with an increase in the information linked to the SDMC framework. See the table below for more details. The Office of Research and Strategic Improvement (ORSI) completed the accountability portions of the report
2
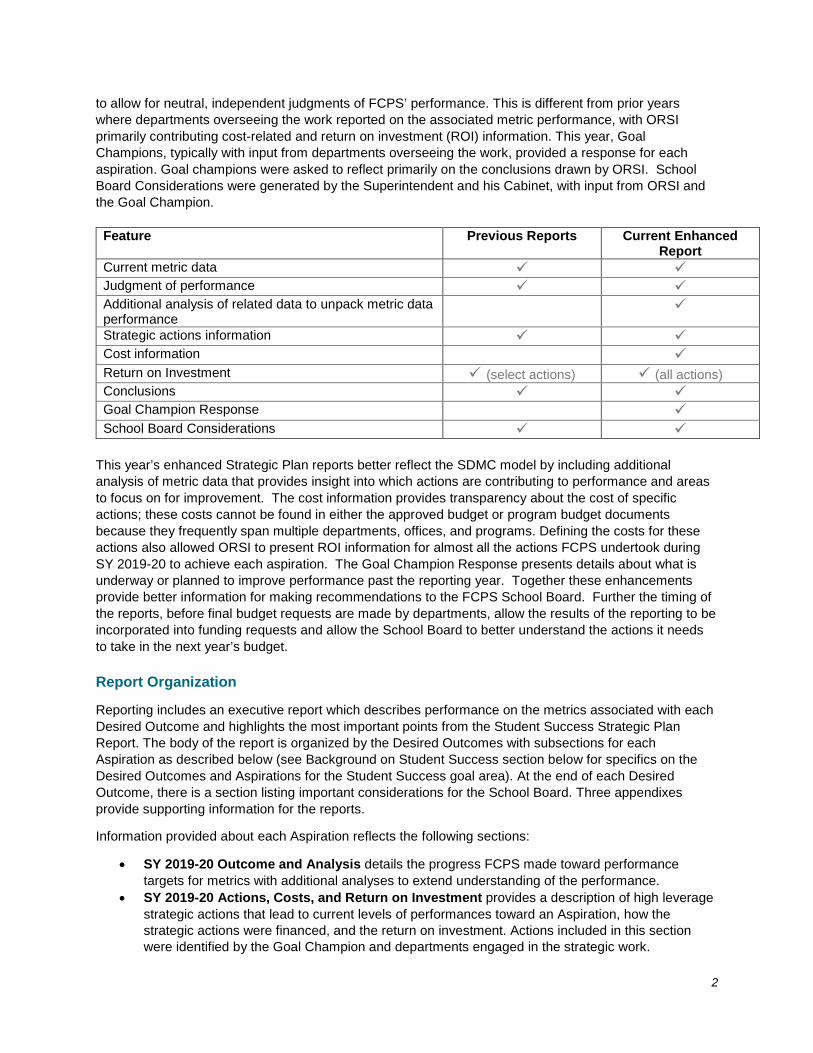
to allow for neutral, independent judgments of FCPS’ performance. This is different from prior years where departments overseeing the work reported on the associated metric performance, with ORSI primarily contributing cost-related and return on investment (ROI) information. This year, Goal Champions, typically with input from departments overseeing the work, provided a response for each aspiration. Goal champions were asked to reflect primarily on the conclusions drawn by ORSI. School Board Considerations were generated by the Superintendent and his Cabinet, with input from ORSI and the Goal Champion.
Feature Previous Reports Current Enhanced Report
Current metric data Judgment of performance Additional analysis of related data to unpack metric data performance
Strategic actions information Cost information Return on Investment (select actions) (all actions) Conclusions Goal Champion Response School Board Considerations
This year’s enhanced Strategic Plan reports better reflect the SDMC model by including additional analysis of metric data that provides insight into which actions are contributing to performance and areas to focus on for improvement. The cost information provides transparency about the cost of specific actions; these costs cannot be found in either the approved budget or program budget documents because they frequently span multiple departments, offices, and programs. Defining the costs for these actions also allowed ORSI to present ROI information for almost all the actions FCPS undertook during SY 2019-20 to achieve each aspiration. The Goal Champion Response presents details about what is underway or planned to improve performance past the reporting year. Together these enhancements provide better information for making recommendations to the FCPS School Board. Further the timing of the reports, before final budget requests are made by departments, allow the results of the reporting to be incorporated into funding requests and allow the School Board to better understand the actions it needs to take in the next year’s budget. Report Organization
Reporting includes an executive report which describes performance on the metrics associated with each Desired Outcome and highlights the most important points from the Student Success Strategic Plan Report. The body of the report is organized by the Desired Outcomes with subsections for each Aspiration as described below (see Background on Student Success section below for specifics on the Desired Outcomes and Aspirations for the Student Success goal area). At the end of each Desired Outcome, there is a section listing important considerations for the School Board. Three appendixes provide supporting information for the reports.
Information provided about each Aspiration reflects the following sections:
• SY 2019-20 Outcome and Analysis details the progress FCPS made toward performance targets for metrics with additional analyses to extend understanding of the performance.
• SY 2019-20 Actions, Costs, and Return on Investment provides a description of high leverage strategic actions that lead to current levels of performances toward an Aspiration, how the strategic actions were financed, and the return on investment. Actions included in this section were identified by the Goal Champion and departments engaged in the strategic work.
3
• Conclusions synthesize across sections to describe the effectiveness of the actions for making progress toward the Aspirations and what changes, if any, are needed to maintain or meet the target for the Aspiration.
• Goal Champion Response provides the department’s perspective on performance and includes next steps (either currently underway or to be planned/implemented).
School Board Considerations are provided for each Desired Outcome to highlight what the Superintendent and Cabinet believe the School Board should consider for the future, including policy, budget, and strategic considerations.
Appendixes include trend data for metrics over time (Appendix A), strategic costs associated with each goal area (Appendix B), and performance data tables, and charts for metrics not highlighted in the Outcomes Narrative (Appendix C).
Desired Outcomes and Aspirations for Student Success The Student Success goal includes the following Desired Outcomes and Aspirations:
Elimination of Gaps
• What: FCPS will eliminate gaps in opportunity, access, and achievement for all students. • How: Transform current practices to ensure all students achieve academic excellence through
staff use of the Closing the Achievement Gap Framework. • Aspirations
o All students will be successful in reading and mathematics o All students will graduate on time, college or career ready. o Through the FCPSon initiative, all students will have access to an FCPS provided
individual computer or tablet consistent with One Fairfax’s policy of digital access for all residents.
o Participation and performance rates will be similarly high across student groups in Advanced Academic Programs (AAP).
o Participation and performance rates will be similarly high across student groups in advanced coursework.
Early Education
• What: All future FCPS families will access high-quality early learning experiences. • How: Enhance FCPS partnership with families and the county government to ensure young
children are ready for kindergarten using the Fairfax County Equitable School Readiness plan. • Aspiration: All future FCPS students will enter kindergarten with the essential skills needed for
school success. Portrait of a Graduate
• What: All FCPS PreK-12 students will continuously progress in their development of Portrait of a Graduate (POG) attributes
• How: Increase student opportunities to apply Portrait of a Graduate skills to real-world problems through teacher use of the Learning Model.
• Aspiration: All students will meet grade level expectations for Portrait of a Graduate outcomes
Metrics and Performance Judgments Strategic Plan report metrics are used to measure progress toward performance targets. These metrics,
4
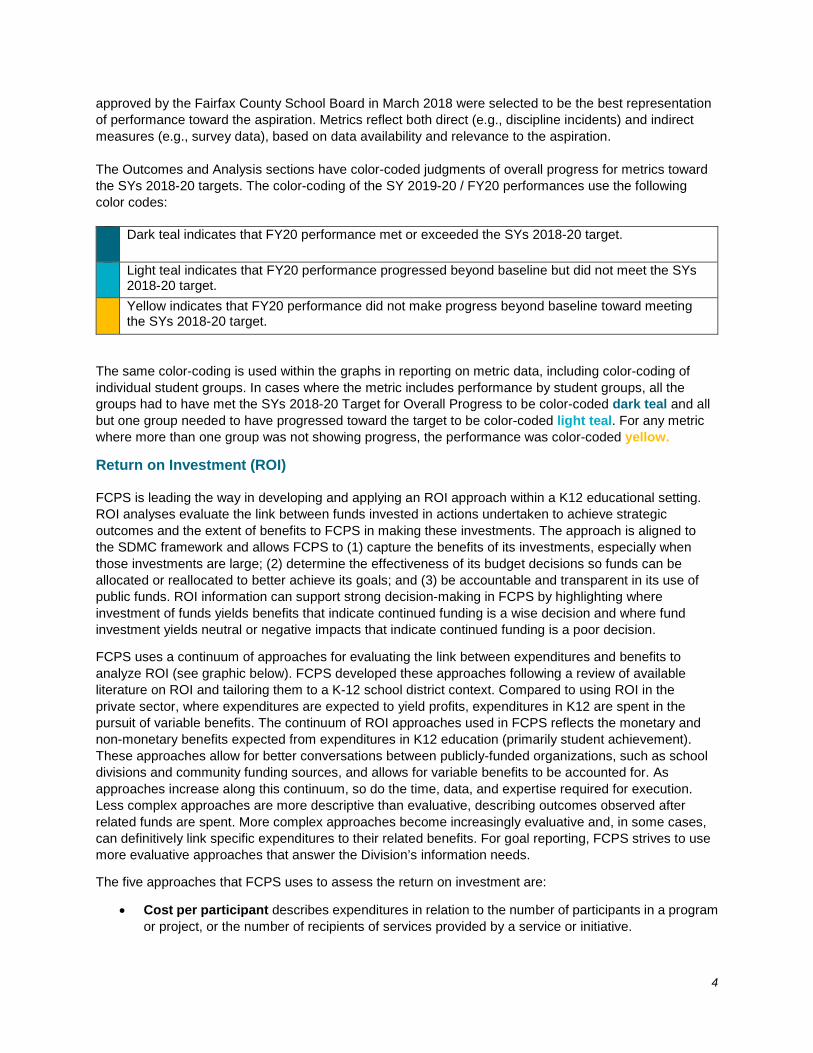
approved by the Fairfax County School Board in March 2018 were selected to be the best representation of performance toward the aspiration. Metrics reflect both direct (e.g., discipline incidents) and indirect measures (e.g., survey data), based on data availability and relevance to the aspiration. The Outcomes and Analysis sections have color-coded judgments of overall progress for metrics toward the SYs 2018-20 targets. The color-coding of the SY 2019-20 / FY20 performances use the following color codes:
The same color-coding is used within the graphs in reporting on metric data, including color-coding of individual student groups. In cases where the metric includes performance by student groups, all the groups had to have met the SYs 2018-20 Target for Overall Progress to be color-coded dark teal and all but one group needed to have progressed toward the target to be color-coded light teal. For any metric where more than one group was not showing progress, the performance was color-coded yellow.
Return on Investment (ROI) FCPS is leading the way in developing and applying an ROI approach within a K12 educational setting. ROI analyses evaluate the link between funds invested in actions undertaken to achieve strategic outcomes and the extent of benefits to FCPS in making these investments. The approach is aligned to the SDMC framework and allows FCPS to (1) capture the benefits of its investments, especially when those investments are large; (2) determine the effectiveness of its budget decisions so funds can be allocated or reallocated to better achieve its goals; and (3) be accountable and transparent in its use of public funds. ROI information can support strong decision-making in FCPS by highlighting where investment of funds yields benefits that indicate continued funding is a wise decision and where fund investment yields neutral or negative impacts that indicate continued funding is a poor decision.
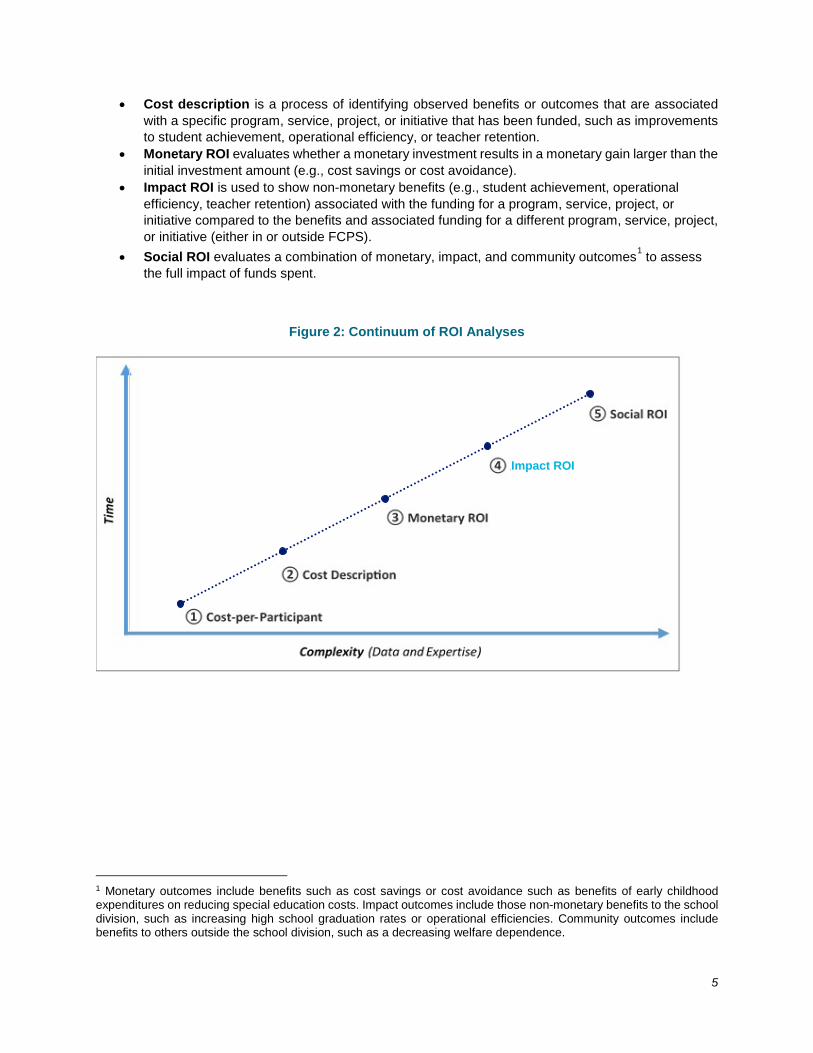
FCPS uses a continuum of approaches for evaluating the link between expenditures and benefits to analyze ROI (see graphic below). FCPS developed these approaches following a review of available literature on ROI and tailoring them to a K-12 school district context. Compared to using ROI in the private sector, where expenditures are expected to yield profits, expenditures in K12 are spent in the pursuit of variable benefits. The continuum of ROI approaches used in FCPS reflects the monetary and non-monetary benefits expected from expenditures in K12 education (primarily student achievement). These approaches allow for better conversations between publicly-funded organizations, such as school divisions and community funding sources, and allows for variable benefits to be accounted for. As approaches increase along this continuum, so do the time, data, and expertise required for execution. Less complex approaches are more descriptive than evaluative, describing outcomes observed after related funds are spent. More complex approaches become increasingly evaluative and, in some cases, can definitively link specific expenditures to their related benefits. For goal reporting, FCPS strives to use more evaluative approaches that answer the Division’s information needs.
The five approaches that FCPS uses to assess the return on investment are:
• Cost per participant describes expenditures in relation to the number of participants in a program or project, or the number of recipients of services provided by a service or initiative.
Dark teal indicates that FY20 performance met or exceeded the SYs 2018-20 target.
Light teal indicates that FY20 performance progressed beyond baseline but did not meet the SYs 2018-20 target.
Yellow indicates that FY20 performance did not make progress beyond baseline toward meeting the SYs 2018-20 target.
5
• Cost description is a process of identifying observed benefits or outcomes that are associated with a specific program, service, project, or initiative that has been funded, such as improvements to student achievement, operational efficiency, or teacher retention.
• Monetary ROI evaluates whether a monetary investment results in a monetary gain larger than the initial investment amount (e.g., cost savings or cost avoidance).
• Impact ROI is used to show non-monetary benefits (e.g., student achievement, operational efficiency, teacher retention) associated with the funding for a program, service, project, or initiative compared to the benefits and associated funding for a different program, service, project, or initiative (either in or outside FCPS).
• Social ROI evaluates a combination of monetary, impact, and community outcomes1 to assess the full impact of funds spent.
Figure 2: Continuum of ROI Analyses
1 Monetary outcomes include benefits such as cost savings or cost avoidance such as benefits of early childhood expenditures on reducing special education costs. Impact outcomes include those non-monetary benefits to the school division, such as increasing high school graduation rates or operational efficiencies. Community outcomes include benefits to others outside the school division, such as a decreasing welfare dependence.
Impact ROI
ELIMINATION OF GAPS
6
Aspiration: All students will be successful in reading and math. SY 2019-20 Outcomes and Analysis There are four metrics measuring the Aspiration “All students will be successful in reading and math.” Key metrics, which provide data central to determining progress toward the Desired Outcome, are included below. Additional metrics are presented in Appendix C. The following key metrics are presented below:
• Percent of grade 3 students who read at or above grade level (based on progress reports) • Percent of EL students who become English proficient in five years
The following additional metrics are presented in Appendix C because updated SY 2019-20 data were unavailable due to the cancellation of end-of-year / end-of-course SOLs related to the COVID-19 closure of schools:
• Pass rates on reading SOLs • Pass rates on math SOLs
Metric Data
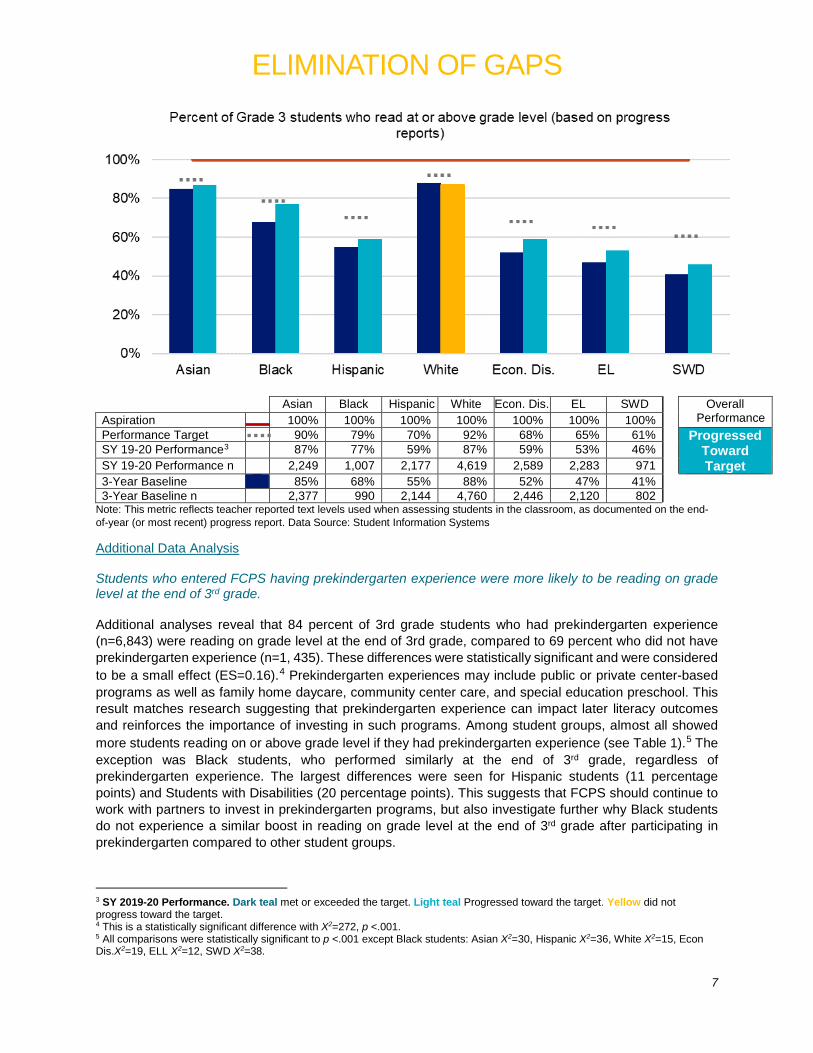
In SY 2019-20, the percent of Grade 3 students reading at or above grade level increased for most student groups, though no student groups reached the intended 2020 target levels. All student groups, except one, had an increase in the percentage of Grade 3 students reading at or above grade level compared to baseline data. Black students increased by nine percentage points to 77 percent, Hispanic students increased by four percentage points to 59 percent, and Asian students increased two percentage points to 87 percent. White students declined slightly (one percentage point) compared to baseline with performance of 87 percent in SY 2019-20. Additionally, Economically Disadvantaged (Econ. Dis) students increased by seven percentage points to 59 percent, English language learners (EL) increased six percentage points to 53 percent, and Students with Disabilities (SWD) increase five percentage points to 46 percent. Even with these increases since baseline, no group met its 2020 performance target and there continues to be gaps among student groups. Black students came closest to meeting the target falling only two percentage points below the intended 79 percent level, with Asian students coming within three percentages points of the intended 90 percent level. All other student groups were at least five percentage points away from the target level, with the Students with Disabilities, English Lerners and Hispanic student groups, farthest from the intended performance levels with a 15, 12, and 11 percentage point difference, respectively, between the SY 2019-20 performance and the 2020 target. This indicates there should be continued work to ensure all students are reading at grade level by the end of 3rd grade and that special efforts are likely needed for Students with Disabilities, English learners, and Hispanic students2.
2 While many English learners are Hispanic, the two categories represent different students. Approximately 57% of English learners are Hispanic at grade 3 and 66% of Hispanic students are English learners. In total, 16% of all grade 3 students are both English learners and Hispanic.
ELIMINATION OF GAPS
7
Asian Black Hispanic White Econ. Dis. EL SWD Overall Performance Aspiration 100% 100% 100% 100% 100% 100% 100%
Performance Target 90% 79% 70% 92% 68% 65% 61% Progressed Toward Target
SY 19-20 Performance3 87% 77% 59% 87% 59% 53% 46% SY 19-20 Performance n 2,249 1,007 2,177 4,619 2,589 2,283 971 3-Year Baseline 85% 68% 55% 88% 52% 47% 41% 3-Year Baseline n 2,377 990 2,144 4,760 2,446 2,120 802
Note: This metric reflects teacher reported text levels used when assessing students in the classroom, as documented on the end-of-year (or most recent) progress report. Data Source: Student Information Systems
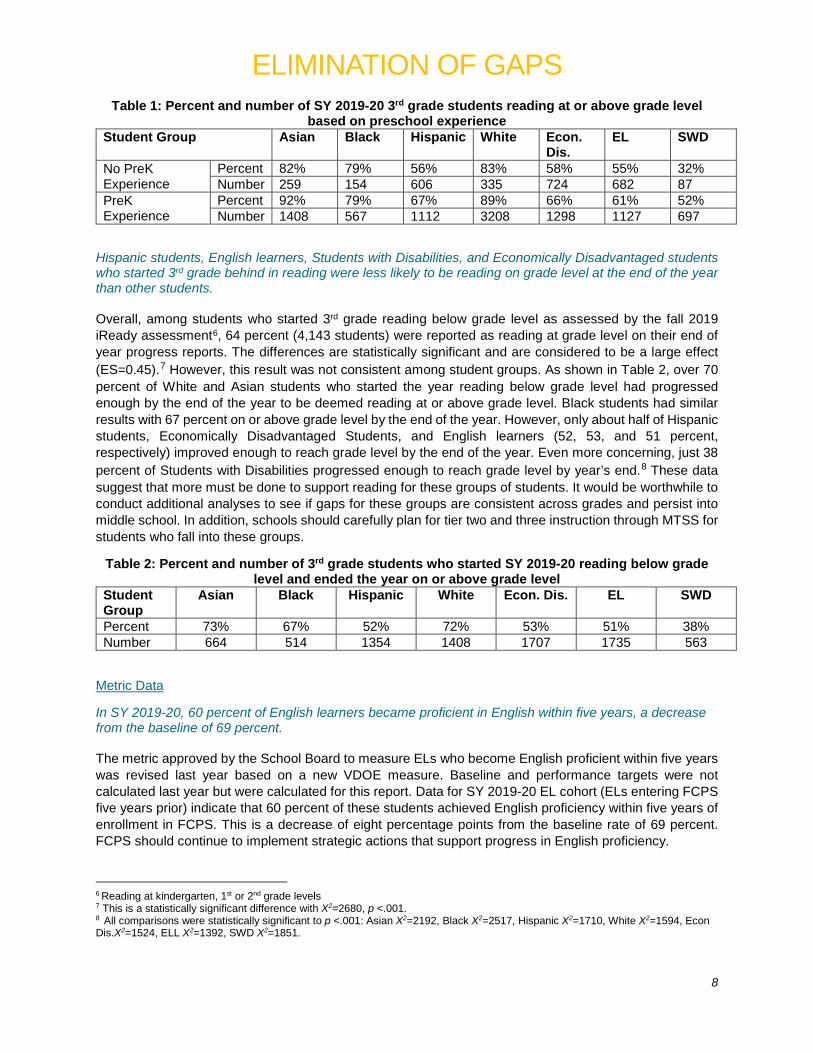
Additional Data Analysis Students who entered FCPS having prekindergarten experience were more likely to be reading on grade level at the end of 3rd grade. Additional analyses reveal that 84 percent of 3rd grade students who had prekindergarten experience (n=6,843) were reading on grade level at the end of 3rd grade, compared to 69 percent who did not have prekindergarten experience (n=1, 435). These differences were statistically significant and were considered to be a small effect (ES=0.16).4 Prekindergarten experiences may include public or private center-based programs as well as family home daycare, community center care, and special education preschool. This result matches research suggesting that prekindergarten experience can impact later literacy outcomes and reinforces the importance of investing in such programs. Among student groups, almost all showed more students reading on or above grade level if they had prekindergarten experience (see Table 1).5 The exception was Black students, who performed similarly at the end of 3rd grade, regardless of prekindergarten experience. The largest differences were seen for Hispanic students (11 percentage points) and Students with Disabilities (20 percentage points). This suggests that FCPS should continue to work with partners to invest in prekindergarten programs, but also investigate further why Black students do not experience a similar boost in reading on grade level at the end of 3rd grade after participating in prekindergarten compared to other student groups.
3 SY 2019-20 Performance. Dark teal met or exceeded the target. Light teal Progressed toward the target. Yellow did not progress toward the target. 4 This is a statistically significant difference with X2=272, p <.001. 5 All comparisons were statistically significant to p <.001 except Black students: Asian X2=30, Hispanic X2=36, White X2=15, Econ Dis.X2=19, ELL X2=12, SWD X2=38.
ELIMINATION OF GAPS
8
Table 1: Percent and number of SY 2019-20 3rd grade students reading at or above grade level based on preschool experience
Student Group Asian Black Hispanic White Econ. Dis.
EL SWD
No PreK Experience
Percent 82% 79% 56% 83% 58% 55% 32% Number 259 154 606 335 724 682 87
PreK Experience
Percent 92% 79% 67% 89% 66% 61% 52% Number 1408 567 1112 3208 1298 1127 697
Hispanic students, English learners, Students with Disabilities, and Economically Disadvantaged students who started 3rd grade behind in reading were less likely to be reading on grade level at the end of the year than other students. Overall, among students who started 3rd grade reading below grade level as assessed by the fall 2019 iReady assessment6, 64 percent (4,143 students) were reported as reading at grade level on their end of year progress reports. The differences are statistically significant and are considered to be a large effect (ES=0.45).7 However, this result was not consistent among student groups. As shown in Table 2, over 70 percent of White and Asian students who started the year reading below grade level had progressed enough by the end of the year to be deemed reading at or above grade level. Black students had similar results with 67 percent on or above grade level by the end of the year. However, only about half of Hispanic students, Economically Disadvantaged Students, and English learners (52, 53, and 51 percent, respectively) improved enough to reach grade level by the end of the year. Even more concerning, just 38 percent of Students with Disabilities progressed enough to reach grade level by year’s end.8 These data suggest that more must be done to support reading for these groups of students. It would be worthwhile to conduct additional analyses to see if gaps for these groups are consistent across grades and persist into middle school. In addition, schools should carefully plan for tier two and three instruction through MTSS for students who fall into these groups.
Table 2: Percent and number of 3rd grade students who started SY 2019-20 reading below grade level and ended the year on or above grade level
Student Group
Asian Black Hispanic White Econ. Dis. EL SWD
Percent 73% 67% 52% 72% 53% 51% 38% Number 664 514 1354 1408 1707 1735 563
Metric Data
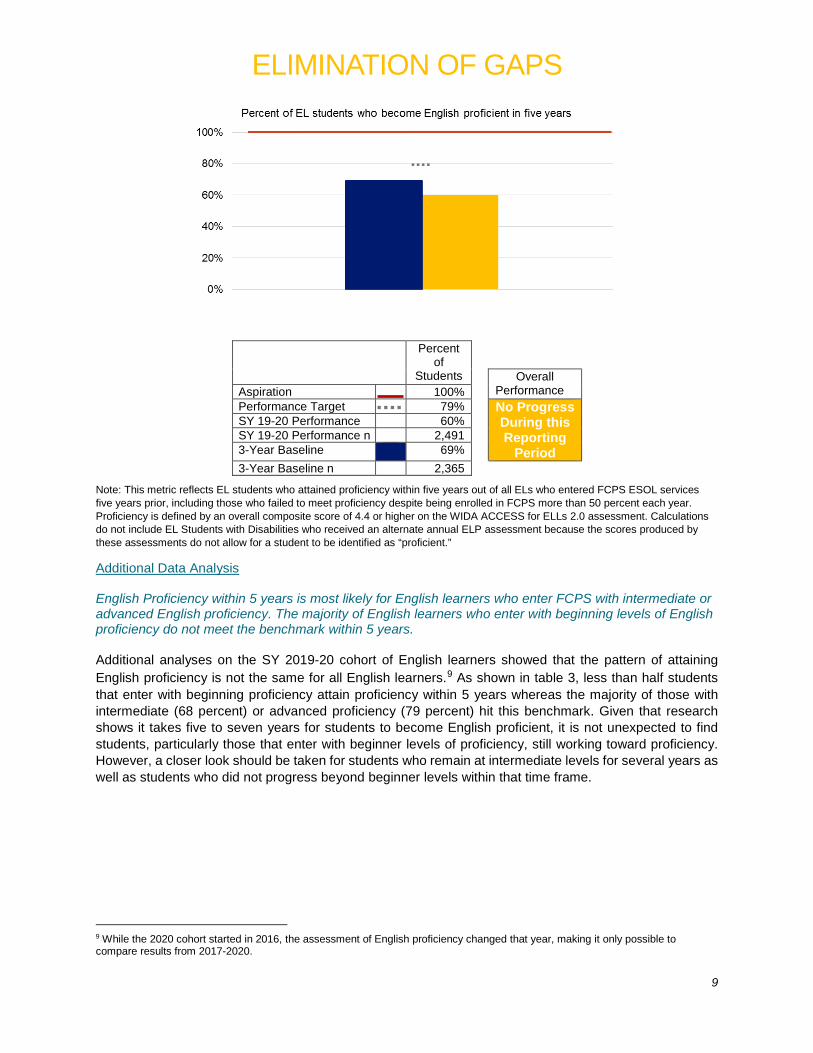
In SY 2019-20, 60 percent of English learners became proficient in English within five years, a decrease from the baseline of 69 percent. The metric approved by the School Board to measure ELs who become English proficient within five years was revised last year based on a new VDOE measure. Baseline and performance targets were not calculated last year but were calculated for this report. Data for SY 2019-20 EL cohort (ELs entering FCPS five years prior) indicate that 60 percent of these students achieved English proficiency within five years of enrollment in FCPS. This is a decrease of eight percentage points from the baseline rate of 69 percent. FCPS should continue to implement strategic actions that support progress in English proficiency.
6 Reading at kindergarten, 1st or 2nd grade levels 7 This is a statistically significant difference with X2=2680, p <.001. 8 All comparisons were statistically significant to p <.001: Asian X2=2192, Black X2=2517, Hispanic X2=1710, White X2=1594, Econ Dis.X2=1524, ELL X2=1392, SWD X2=1851.
ELIMINATION OF GAPS
9
Percent of
Students
Overall Performance Aspiration 100%
Performance Target 79% No Progress During this Reporting
Period
SY 19-20 Performance 60% SY 19-20 Performance n 2,491 3-Year Baseline 69% 3-Year Baseline n 2,365
Note: This metric reflects EL students who attained proficiency within five years out of all ELs who entered FCPS ESOL services five years prior, including those who failed to meet proficiency despite being enrolled in FCPS more than 50 percent each year. Proficiency is defined by an overall composite score of 4.4 or higher on the WIDA ACCESS for ELLs 2.0 assessment. Calculations do not include EL Students with Disabilities who received an alternate annual ELP assessment because the scores produced by these assessments do not allow for a student to be identified as “proficient.”
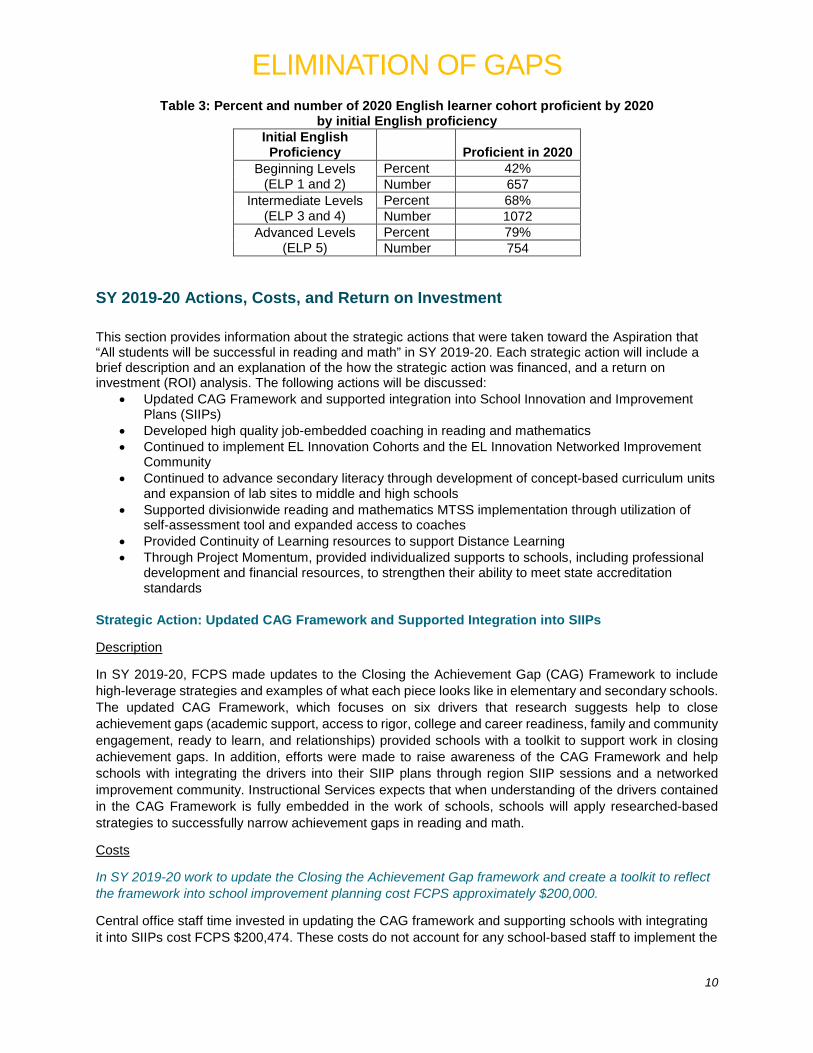
Additional Data Analysis English Proficiency within 5 years is most likely for English learners who enter FCPS with intermediate or advanced English proficiency. The majority of English learners who enter with beginning levels of English proficiency do not meet the benchmark within 5 years. Additional analyses on the SY 2019-20 cohort of English learners showed that the pattern of attaining English proficiency is not the same for all English learners.9 As shown in table 3, less than half students that enter with beginning proficiency attain proficiency within 5 years whereas the majority of those with intermediate (68 percent) or advanced proficiency (79 percent) hit this benchmark. Given that research shows it takes five to seven years for students to become English proficient, it is not unexpected to find students, particularly those that enter with beginner levels of proficiency, still working toward proficiency. However, a closer look should be taken for students who remain at intermediate levels for several years as well as students who did not progress beyond beginner levels within that time frame.
9 While the 2020 cohort started in 2016, the assessment of English proficiency changed that year, making it only possible to compare results from 2017-2020.
ELIMINATION OF GAPS
10
Table 3: Percent and number of 2020 English learner cohort proficient by 2020 by initial English proficiency
Initial English Proficiency Proficient in 2020
Beginning Levels (ELP 1 and 2)
Percent 42% Number 657
Intermediate Levels (ELP 3 and 4)
Percent 68% Number 1072
Advanced Levels (ELP 5)
Percent 79% Number 754
SY 2019-20 Actions, Costs, and Return on Investment This section provides information about the strategic actions that were taken toward the Aspiration that “All students will be successful in reading and math” in SY 2019-20. Each strategic action will include a brief description and an explanation of the how the strategic action was financed, and a return on investment (ROI) analysis. The following actions will be discussed:
• Updated CAG Framework and supported integration into School Innovation and Improvement Plans (SIIPs)
• Developed high quality job-embedded coaching in reading and mathematics • Continued to implement EL Innovation Cohorts and the EL Innovation Networked Improvement
Community • Continued to advance secondary literacy through development of concept-based curriculum units
and expansion of lab sites to middle and high schools • Supported divisionwide reading and mathematics MTSS implementation through utilization of
self-assessment tool and expanded access to coaches • Provided Continuity of Learning resources to support Distance Learning • Through Project Momentum, provided individualized supports to schools, including professional
development and financial resources, to strengthen their ability to meet state accreditation standards
Strategic Action: Updated CAG Framework and Supported Integration into SIIPs
Description
In SY 2019-20, FCPS made updates to the Closing the Achievement Gap (CAG) Framework to include high-leverage strategies and examples of what each piece looks like in elementary and secondary schools. The updated CAG Framework, which focuses on six drivers that research suggests help to close achievement gaps (academic support, access to rigor, college and career readiness, family and community engagement, ready to learn, and relationships) provided schools with a toolkit to support work in closing achievement gaps. In addition, efforts were made to raise awareness of the CAG Framework and help schools with integrating the drivers into their SIIP plans through region SIIP sessions and a networked improvement community. Instructional Services expects that when understanding of the drivers contained in the CAG Framework is fully embedded in the work of schools, schools will apply researched-based strategies to successfully narrow achievement gaps in reading and math.
Costs
In SY 2019-20 work to update the Closing the Achievement Gap framework and create a toolkit to reflect the framework into school improvement planning cost FCPS approximately $200,000.
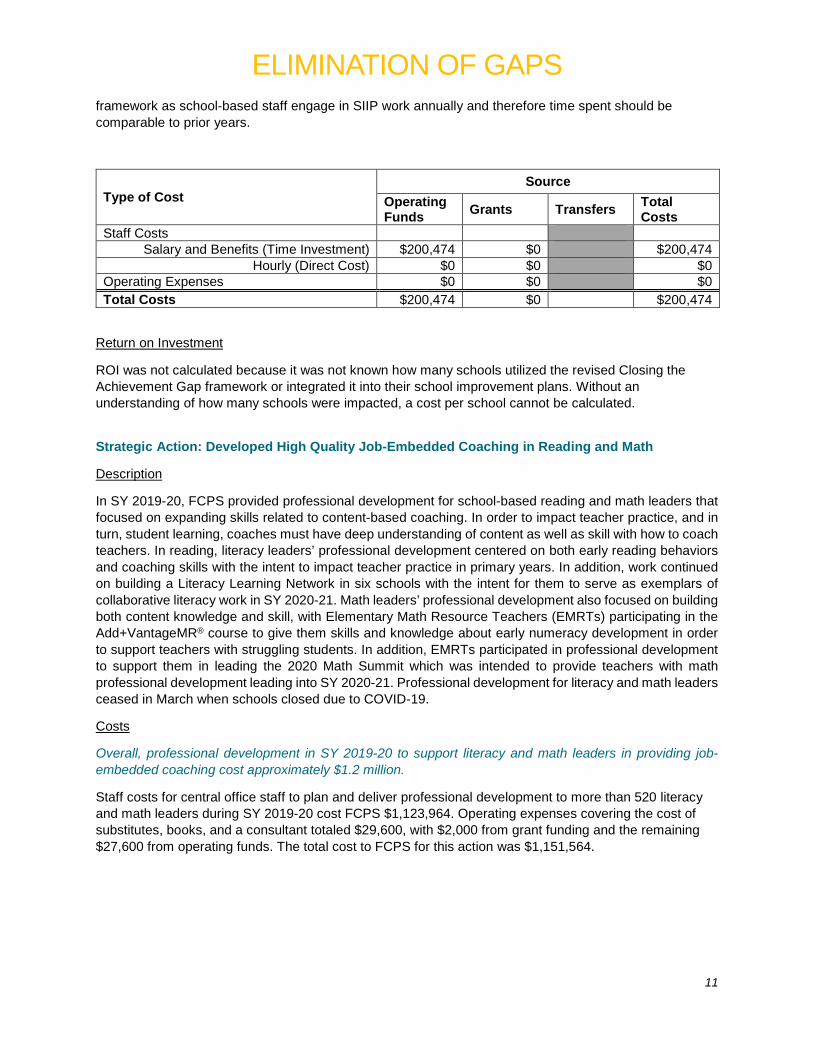
Central office staff time invested in updating the CAG framework and supporting schools with integrating it into SIIPs cost FCPS $200,474. These costs do not account for any school-based staff to implement the
ELIMINATION OF GAPS
11
framework as school-based staff engage in SIIP work annually and therefore time spent should be comparable to prior years.
Type of Cost Source
Operating Funds Grants Transfers Total
Costs Staff Costs
Salary and Benefits (Time Investment) $200,474 $0 $200,474 Hourly (Direct Cost) $0 $0 $0
Operating Expenses $0 $0 $0 Total Costs $200,474 $0 $200,474
Return on Investment
ROI was not calculated because it was not known how many schools utilized the revised Closing the Achievement Gap framework or integrated it into their school improvement plans. Without an understanding of how many schools were impacted, a cost per school cannot be calculated.
Strategic Action: Developed High Quality Job-Embedded Coaching in Reading and Math
Description
In SY 2019-20, FCPS provided professional development for school-based reading and math leaders that focused on expanding skills related to content-based coaching. In order to impact teacher practice, and in turn, student learning, coaches must have deep understanding of content as well as skill with how to coach teachers. In reading, literacy leaders’ professional development centered on both early reading behaviors and coaching skills with the intent to impact teacher practice in primary years. In addition, work continued on building a Literacy Learning Network in six schools with the intent for them to serve as exemplars of collaborative literacy work in SY 2020-21. Math leaders’ professional development also focused on building both content knowledge and skill, with Elementary Math Resource Teachers (EMRTs) participating in the Add+VantageMR® course to give them skills and knowledge about early numeracy development in order to support teachers with struggling students. In addition, EMRTs participated in professional development to support them in leading the 2020 Math Summit which was intended to provide teachers with math professional development leading into SY 2020-21. Professional development for literacy and math leaders ceased in March when schools closed due to COVID-19.
Costs
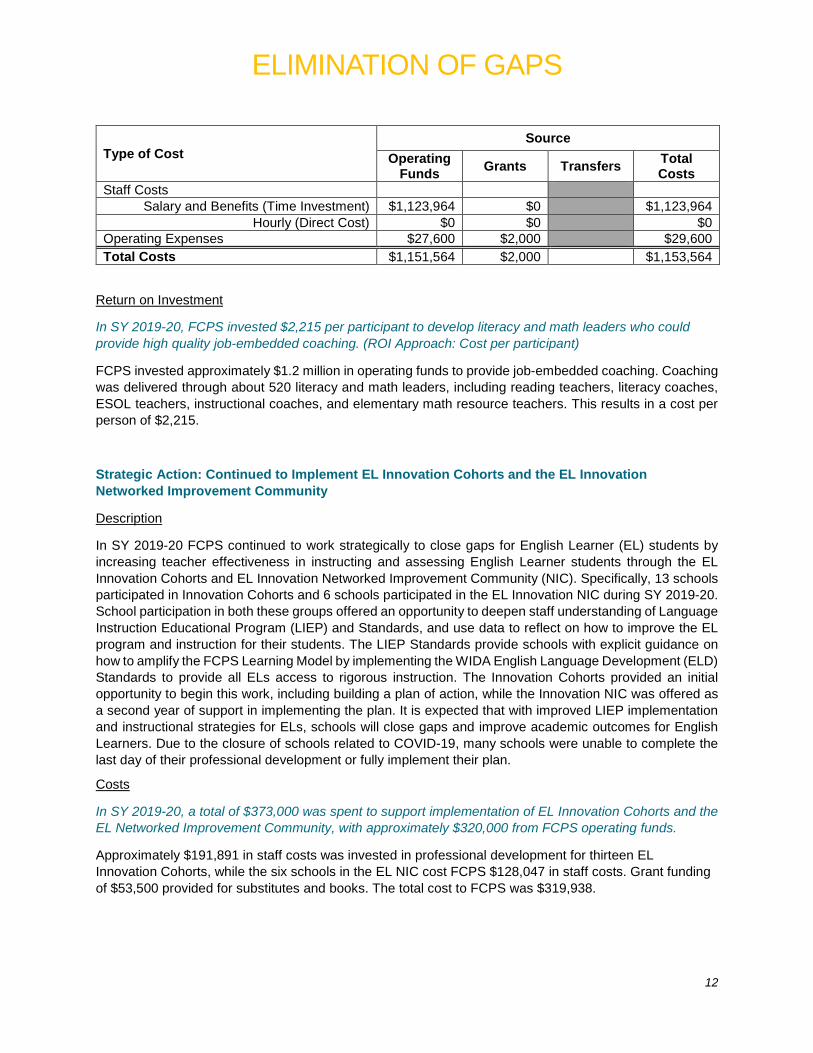
Overall, professional development in SY 2019-20 to support literacy and math leaders in providing job-embedded coaching cost approximately $1.2 million.
Staff costs for central office staff to plan and deliver professional development to more than 520 literacy and math leaders during SY 2019-20 cost FCPS $1,123,964. Operating expenses covering the cost of substitutes, books, and a consultant totaled $29,600, with $2,000 from grant funding and the remaining $27,600 from operating funds. The total cost to FCPS for this action was $1,151,564.
ELIMINATION OF GAPS
12
Type of Cost Source
Operating Funds Grants Transfers Total
Costs Staff Costs
Salary and Benefits (Time Investment) $1,123,964 $0 $1,123,964 Hourly (Direct Cost) $0 $0 $0
Operating Expenses $27,600 $2,000 $29,600 Total Costs $1,151,564 $2,000 $1,153,564
Return on Investment
In SY 2019-20, FCPS invested $2,215 per participant to develop literacy and math leaders who could provide high quality job-embedded coaching. (ROI Approach: Cost per participant)
FCPS invested approximately $1.2 million in operating funds to provide job-embedded coaching. Coaching was delivered through about 520 literacy and math leaders, including reading teachers, literacy coaches, ESOL teachers, instructional coaches, and elementary math resource teachers. This results in a cost per person of $2,215.
Strategic Action: Continued to Implement EL Innovation Cohorts and the EL Innovation Networked Improvement Community
Description
In SY 2019-20 FCPS continued to work strategically to close gaps for English Learner (EL) students by increasing teacher effectiveness in instructing and assessing English Learner students through the EL Innovation Cohorts and EL Innovation Networked Improvement Community (NIC). Specifically, 13 schools participated in Innovation Cohorts and 6 schools participated in the EL Innovation NIC during SY 2019-20. School participation in both these groups offered an opportunity to deepen staff understanding of Language Instruction Educational Program (LIEP) and Standards, and use data to reflect on how to improve the EL program and instruction for their students. The LIEP Standards provide schools with explicit guidance on how to amplify the FCPS Learning Model by implementing the WIDA English Language Development (ELD) Standards to provide all ELs access to rigorous instruction. The Innovation Cohorts provided an initial opportunity to begin this work, including building a plan of action, while the Innovation NIC was offered as a second year of support in implementing the plan. It is expected that with improved LIEP implementation and instructional strategies for ELs, schools will close gaps and improve academic outcomes for English Learners. Due to the closure of schools related to COVID-19, many schools were unable to complete the last day of their professional development or fully implement their plan.
Costs
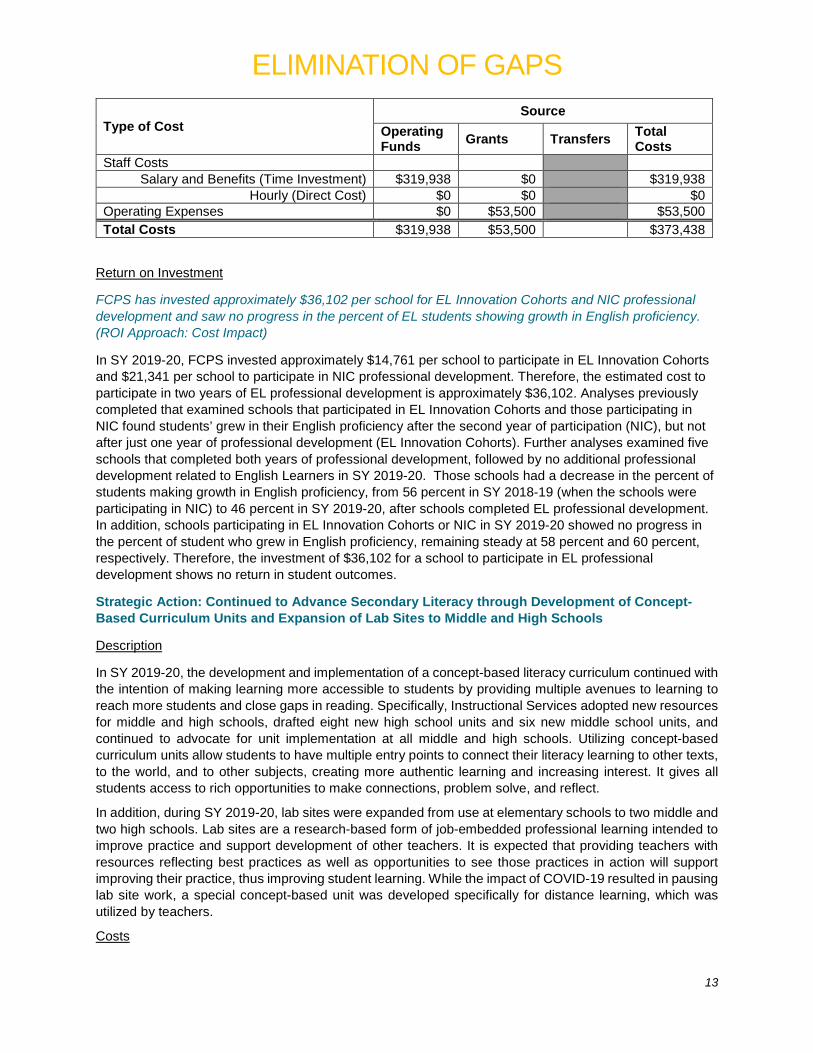
In SY 2019-20, a total of $373,000 was spent to support implementation of EL Innovation Cohorts and the EL Networked Improvement Community, with approximately $320,000 from FCPS operating funds.
Approximately $191,891 in staff costs was invested in professional development for thirteen EL Innovation Cohorts, while the six schools in the EL NIC cost FCPS $128,047 in staff costs. Grant funding of $53,500 provided for substitutes and books. The total cost to FCPS was $319,938.
ELIMINATION OF GAPS
13
Type of Cost Source
Operating Funds Grants Transfers Total
Costs Staff Costs
Salary and Benefits (Time Investment) $319,938 $0 $319,938 Hourly (Direct Cost) $0 $0 $0
Operating Expenses $0 $53,500 $53,500 Total Costs $319,938 $53,500 $373,438
Return on Investment
FCPS has invested approximately $36,102 per school for EL Innovation Cohorts and NIC professional development and saw no progress in the percent of EL students showing growth in English proficiency. (ROI Approach: Cost Impact)
In SY 2019-20, FCPS invested approximately $14,761 per school to participate in EL Innovation Cohorts and $21,341 per school to participate in NIC professional development. Therefore, the estimated cost to participate in two years of EL professional development is approximately $36,102. Analyses previously completed that examined schools that participated in EL Innovation Cohorts and those participating in NIC found students’ grew in their English proficiency after the second year of participation (NIC), but not after just one year of professional development (EL Innovation Cohorts). Further analyses examined five schools that completed both years of professional development, followed by no additional professional development related to English Learners in SY 2019-20. Those schools had a decrease in the percent of students making growth in English proficiency, from 56 percent in SY 2018-19 (when the schools were participating in NIC) to 46 percent in SY 2019-20, after schools completed EL professional development. In addition, schools participating in EL Innovation Cohorts or NIC in SY 2019-20 showed no progress in the percent of student who grew in English proficiency, remaining steady at 58 percent and 60 percent, respectively. Therefore, the investment of $36,102 for a school to participate in EL professional development shows no return in student outcomes.
Strategic Action: Continued to Advance Secondary Literacy through Development of Concept-Based Curriculum Units and Expansion of Lab Sites to Middle and High Schools
Description
In SY 2019-20, the development and implementation of a concept-based literacy curriculum continued with the intention of making learning more accessible to students by providing multiple avenues to learning to reach more students and close gaps in reading. Specifically, Instructional Services adopted new resources for middle and high schools, drafted eight new high school units and six new middle school units, and continued to advocate for unit implementation at all middle and high schools. Utilizing concept-based curriculum units allow students to have multiple entry points to connect their literacy learning to other texts, to the world, and to other subjects, creating more authentic learning and increasing interest. It gives all students access to rich opportunities to make connections, problem solve, and reflect.
In addition, during SY 2019-20, lab sites were expanded from use at elementary schools to two middle and two high schools. Lab sites are a research-based form of job-embedded professional learning intended to improve practice and support development of other teachers. It is expected that providing teachers with resources reflecting best practices as well as opportunities to see those practices in action will support improving their practice, thus improving student learning. While the impact of COVID-19 resulted in pausing lab site work, a special concept-based unit was developed specifically for distance learning, which was utilized by teachers.
Costs

ELIMINATION OF GAPS
14
A total of approximately $1.4 million was spent in SY 2019-20 towards advancing secondary literacy through concept-based curriculum units and the expansion of lab sites.
The majority of costs in SY 2019-20 came from the one year portion of cost of high school basal resources for literacy, including $264,489 for NoRedInk, a writing and grammar resource, and $871,017 for myPerspectives and Advanced Placement books. The total one year cost of $1,135,506 represents one-seventh of the cost of these resources. In addition, $8,800 in grant funding paid for substitutes for middle school teachers to participate in professional development. The FCPS staff cost of $194,306 included time for teacher professional development and central office efforts to support this action. Hourly work on curriculum development constituted an additional $45,355. In total, this action cost FCPS $1,375,167.
Type of Cost Source
Operating Funds Grants Transfers Total
Costs Staff Costs
Salary and Benefits (Time Investment) $194,306 $0 $194,306 Hourly (Direct Cost) $45,355 $0 $45,355
Operating Expenses $1,135,506 $8,800 $1,144,306 Total Costs $1,375,167 $8,800 $1,383,967
Return on Investment
In SY 2019-20, it cost $14 per student to expand secondary literacy resources. (ROI Approach: Cost per participant)
The total cost to FCPS to expand secondary literacy resources was approximately $1.4 million. These resources reached over 95,000 middle and high school students, resulting in cost of $14 per student. Providing literacy resources ensures schools have the tools they need to provide instruction that is consistent for all students.
Strategic Action: Supported Divisionwide Reading and Math MTSS Implementation through Utilization of Self-Assessment Tool and Expanded Access to Coaches
Description
To support schools in meeting the needs of all students, in SY 2019-20, a new self-assessment tool was presented to schools to support them in examining their implementation of MTSS at tiers one, two and three. The MTSS framework uses students’ data to make sure they get the academic, behavioral, and wellness support they need. In tier one, all students get evidence-based, high quality core instruction and differentiated instruction as needed. Some students get tier two support in the form of small group targeted intervention. A few students receive intensive intervention in their area(s) of need as part of tier three. Together, intervention through the tiers helps to close learning gaps for struggling students. The new self-assessment provides schools a way to reflect on their systems of support and plan actions to ensure all students receive the support they need to be successful academically, behaviorally, and social-emotionally. In addition, the MTSS team adapted their coaching approach to a regional model and partnered with data specialists to provide additional schools with access to central office support. This support continued during
ELIMINATION OF GAPS
15
the COVID-19 closure, though the focus shifted to helping schools rethink their systems, data, and student supports in a virtual environment.
Costs
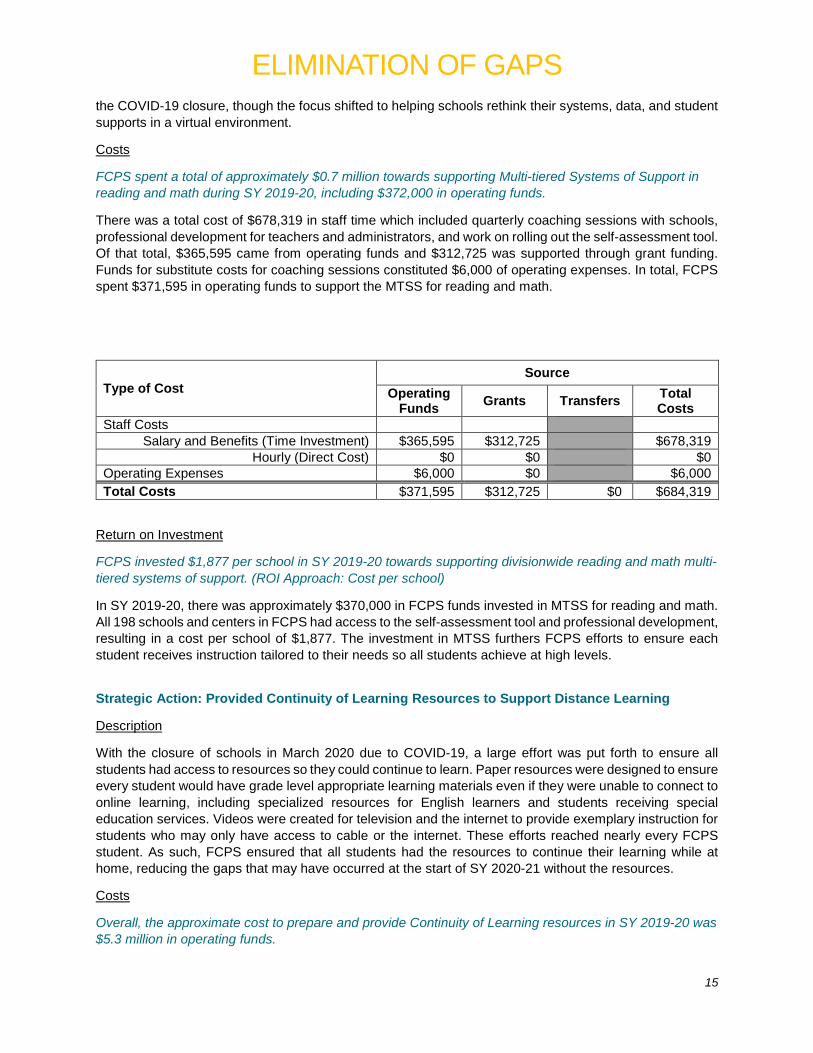
FCPS spent a total of approximately $0.7 million towards supporting Multi-tiered Systems of Support in reading and math during SY 2019-20, including $372,000 in operating funds.
There was a total cost of $678,319 in staff time which included quarterly coaching sessions with schools, professional development for teachers and administrators, and work on rolling out the self-assessment tool. Of that total, $365,595 came from operating funds and $312,725 was supported through grant funding. Funds for substitute costs for coaching sessions constituted $6,000 of operating expenses. In total, FCPS spent $371,595 in operating funds to support the MTSS for reading and math.
Type of Cost Source
Operating Funds Grants Transfers Total
Costs Staff Costs
Salary and Benefits (Time Investment) $365,595 $312,725 $678,319 Hourly (Direct Cost) $0 $0 $0
Operating Expenses $6,000 $0 $6,000 Total Costs $371,595 $312,725 $0 $684,319
Return on Investment
FCPS invested $1,877 per school in SY 2019-20 towards supporting divisionwide reading and math multi-tiered systems of support. (ROI Approach: Cost per school)
In SY 2019-20, there was approximately $370,000 in FCPS funds invested in MTSS for reading and math. All 198 schools and centers in FCPS had access to the self-assessment tool and professional development, resulting in a cost per school of $1,877. The investment in MTSS furthers FCPS efforts to ensure each student receives instruction tailored to their needs so all students achieve at high levels.
Strategic Action: Provided Continuity of Learning Resources to Support Distance Learning
Description
With the closure of schools in March 2020 due to COVID-19, a large effort was put forth to ensure all students had access to resources so they could continue to learn. Paper resources were designed to ensure every student would have grade level appropriate learning materials even if they were unable to connect to online learning, including specialized resources for English learners and students receiving special education services. Videos were created for television and the internet to provide exemplary instruction for students who may only have access to cable or the internet. These efforts reached nearly every FCPS student. As such, FCPS ensured that all students had the resources to continue their learning while at home, reducing the gaps that may have occurred at the start of SY 2020-21 without the resources.
Costs
Overall, the approximate cost to prepare and provide Continuity of Learning resources in SY 2019-20 was $5.3 million in operating funds.
ELIMINATION OF GAPS
16
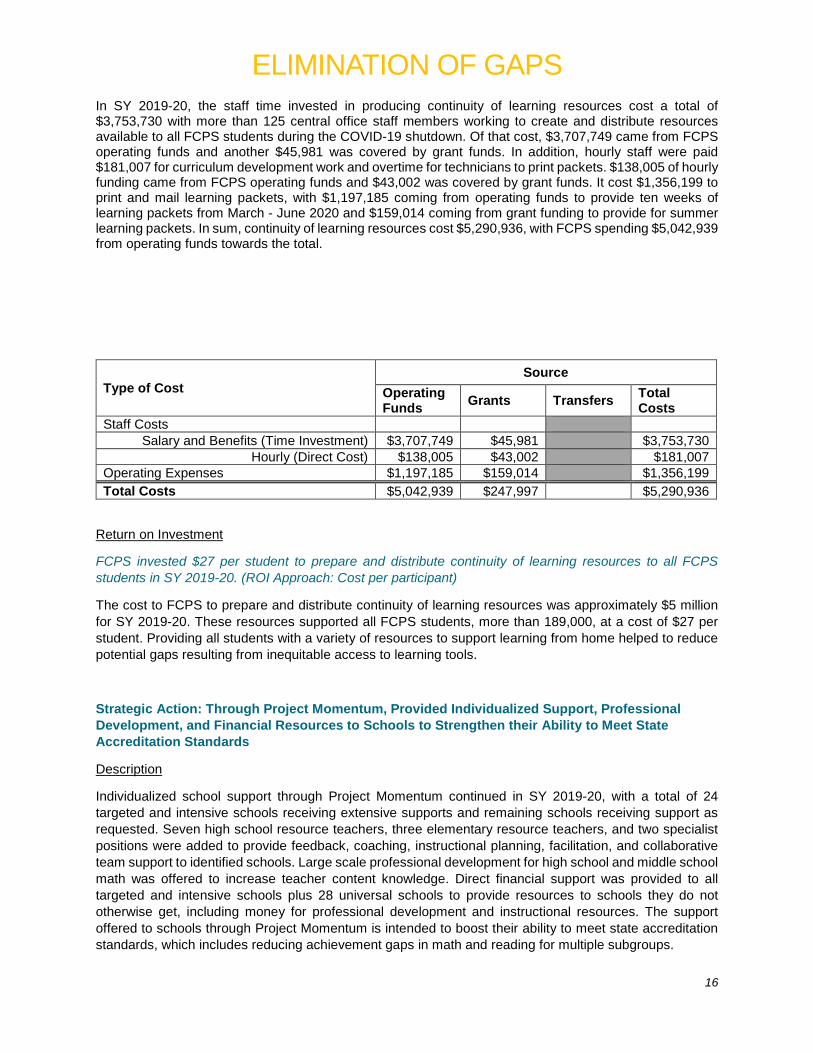
In SY 2019-20, the staff time invested in producing continuity of learning resources cost a total of $3,753,730 with more than 125 central office staff members working to create and distribute resources available to all FCPS students during the COVID-19 shutdown. Of that cost, $3,707,749 came from FCPS operating funds and another $45,981 was covered by grant funds. In addition, hourly staff were paid $181,007 for curriculum development work and overtime for technicians to print packets. $138,005 of hourly funding came from FCPS operating funds and $43,002 was covered by grant funds. It cost $1,356,199 to print and mail learning packets, with $1,197,185 coming from operating funds to provide ten weeks of learning packets from March - June 2020 and $159,014 coming from grant funding to provide for summer learning packets. In sum, continuity of learning resources cost $5,290,936, with FCPS spending $5,042,939 from operating funds towards the total.
Type of Cost Source
Operating Funds Grants Transfers Total
Costs Staff Costs
Salary and Benefits (Time Investment) $3,707,749 $45,981 $3,753,730 Hourly (Direct Cost) $138,005 $43,002 $181,007
Operating Expenses $1,197,185 $159,014 $1,356,199 Total Costs $5,042,939 $247,997 $5,290,936
Return on Investment
FCPS invested $27 per student to prepare and distribute continuity of learning resources to all FCPS students in SY 2019-20. (ROI Approach: Cost per participant)
The cost to FCPS to prepare and distribute continuity of learning resources was approximately $5 million for SY 2019-20. These resources supported all FCPS students, more than 189,000, at a cost of $27 per student. Providing all students with a variety of resources to support learning from home helped to reduce potential gaps resulting from inequitable access to learning tools.
Strategic Action: Through Project Momentum, Provided Individualized Support, Professional Development, and Financial Resources to Schools to Strengthen their Ability to Meet State Accreditation Standards
Description
Individualized school support through Project Momentum continued in SY 2019-20, with a total of 24 targeted and intensive schools receiving extensive supports and remaining schools receiving support as requested. Seven high school resource teachers, three elementary resource teachers, and two specialist positions were added to provide feedback, coaching, instructional planning, facilitation, and collaborative team support to identified schools. Large scale professional development for high school and middle school math was offered to increase teacher content knowledge. Direct financial support was provided to all targeted and intensive schools plus 28 universal schools to provide resources to schools they do not otherwise get, including money for professional development and instructional resources. The support offered to schools through Project Momentum is intended to boost their ability to meet state accreditation standards, which includes reducing achievement gaps in math and reading for multiple subgroups.
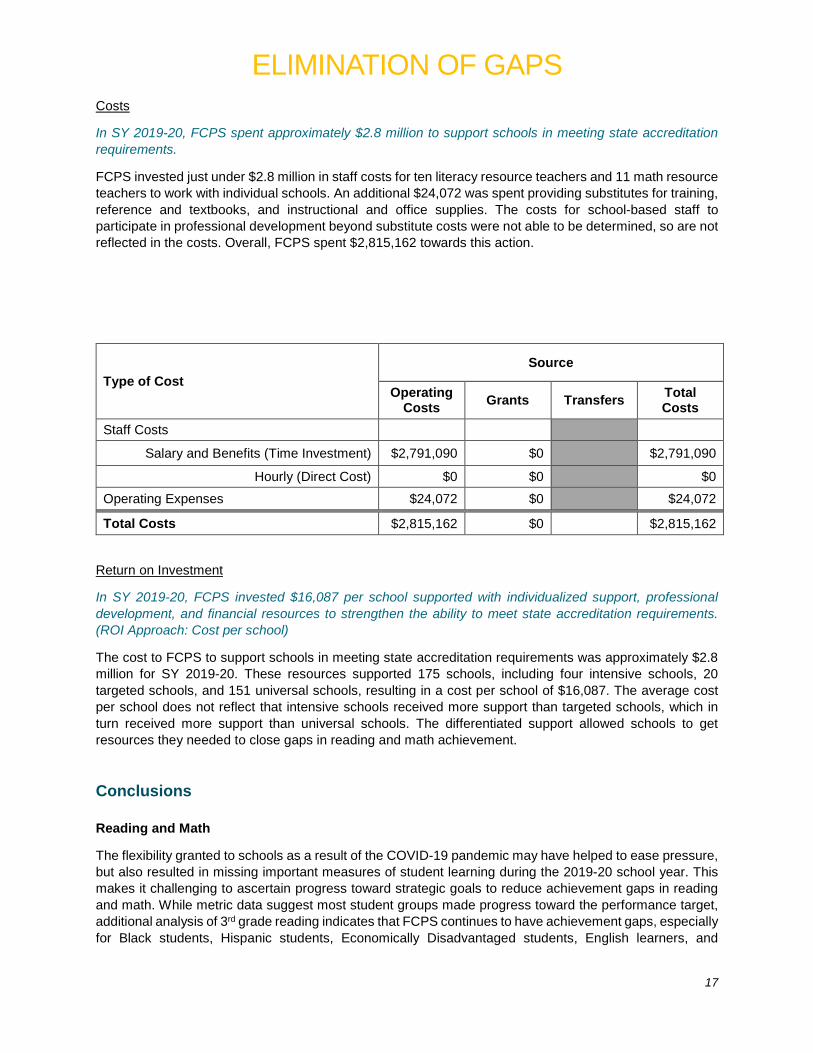
ELIMINATION OF GAPS
17
Costs
In SY 2019-20, FCPS spent approximately $2.8 million to support schools in meeting state accreditation requirements.
FCPS invested just under $2.8 million in staff costs for ten literacy resource teachers and 11 math resource teachers to work with individual schools. An additional $24,072 was spent providing substitutes for training, reference and textbooks, and instructional and office supplies. The costs for school-based staff to participate in professional development beyond substitute costs were not able to be determined, so are not reflected in the costs. Overall, FCPS spent $2,815,162 towards this action.
Type of Cost Source
Operating Costs Grants Transfers Total
Costs Staff Costs
Salary and Benefits (Time Investment) $2,791,090 $0 $2,791,090
Hourly (Direct Cost) $0 $0 $0
Operating Expenses $24,072 $0 $24,072
Total Costs $2,815,162 $0 $2,815,162
Return on Investment
In SY 2019-20, FCPS invested $16,087 per school supported with individualized support, professional development, and financial resources to strengthen the ability to meet state accreditation requirements. (ROI Approach: Cost per school)
The cost to FCPS to support schools in meeting state accreditation requirements was approximately $2.8 million for SY 2019-20. These resources supported 175 schools, including four intensive schools, 20 targeted schools, and 151 universal schools, resulting in a cost per school of $16,087. The average cost per school does not reflect that intensive schools received more support than targeted schools, which in turn received more support than universal schools. The differentiated support allowed schools to get resources they needed to close gaps in reading and math achievement.
Conclusions Reading and Math
The flexibility granted to schools as a result of the COVID-19 pandemic may have helped to ease pressure, but also resulted in missing important measures of student learning during the 2019-20 school year. This makes it challenging to ascertain progress toward strategic goals to reduce achievement gaps in reading and math. While metric data suggest most student groups made progress toward the performance target, additional analysis of 3rd grade reading indicates that FCPS continues to have achievement gaps, especially for Black students, Hispanic students, Economically Disadvantaged students, English learners, and
ELIMINATION OF GAPS
18
Students with Disabilities. These gaps begin with prekindergarten experiences and continue through their school careers. Although gaps still exist for Black students, performance progressed almost to the target compared to baseline, making the gaps less severe for this student group. FCPS is unlikely to meet performance targets for eliminating achievement gaps at the current rate of improvement. Actions undertaken to address achievement gaps, including use of job-embedded professional development, use of concept-based curriculum, and providing individualized supports to schools are research-based, but have not yet had the impact needed to change outcomes meaningfully. While the actions are based in research, twin aspects of FCPS culture may be hindering progress: 1) Schools have wide latitude when deciding whether to follow research-based program models or use resources from central office and 2) Central office efforts are not coordinated and aligned in ways to attain maximum impact. For example, it was optional for schools to use the Closing the Achievement Gap (CAG) framework and to use the secondary concept-based curriculum. While training in job-embedded coaching is provided to literacy and math leaders, principals have discretion in how they utilize those staff positions. This results in uneven implementation and ultimately, lowers the potential impact of these actions. This is further exacerbated when supports coming from central office are not coordinated. For example, within these strategic actions, schools are asked to utilize two frameworks to address achievement gaps (CAG and multi-tiered systems of support (MTSS)) and they are offered support through multiple offices housed in different departments (Instructional Services, Office of School Support, and Department of Special Services). To make progress on closing achievement gaps, FCPS would be well served to work cross-departmentally on a tight set of research-based strategic actions that can be implemented with fidelity across the district with monitoring and support to schools so that fidelity can be attained.
English Learner Proficiency
FCPS fell short of the target to have at least 79% of English learners reach proficiency within five years. While students that enter FCPS at intermediate and more advanced level of proficiency did tend to reach the goal, beginners did not always make enough progress in five years to be deemed English proficient. The closure resulting from COVID-19 likely hindered progress for English learners, not just in SY 2019-20, but for the next few years. Results from schools that participated in the ELIC and NIC cohorts suggest that this specific form of professional development is not impacting growth in proficiency for English Learners. The ELIC and NIC cohorts are not enough of an intervention to close gaps for English learners and ensure they reach proficiency within the five year time frame. Moreover, the approach to the ELIC and NIC cohorts may not be sustainable if the majority of schools require support from central office to increase the rate of English proficiency attainment for all English learners. For example, based on ORSI’s English learner study, staffing at the elementary level may need to be expanded, as well as broader professional development for all classroom and content teachers to support learning by English learner students.
Goal Champion Response to Conclusions Somewhat agree. With two major outcome data metrics missing in reading and mathematics, due to COVID, it is not possible to draw an overall conclusion regarding success as well as understanding our progress for all students. Though gaps still exist, there are positive outcomes in various areas where subgroups are making progress. Data evidence is elaborated below.
For example, for grade 3 reading, the gap between Black and White students decreased by 3% from 2018-19 to 2019-20. This is particularly notable as students received less than a full academic year with interrupted instruction due to COVID-19. A particular highlight in secondary literacy is the significant increases in SOL EOC (grade 11) writing pass rates in all subgroups including Black (9% increase), Hispanic (12% increase), English Learners(5% increase), Free/Reduced Meals students (11% increase) and Students with Disabilities (12% increase) from SY2018-19. These data evidence together with some
ELIMINATION OF GAPS
19
anecdotal stories indicate that there is real progress being made in supporting the most vulnerable student groups with research-based programs and ongoing implementation monitoring.
Contributing to this success is the existence of a formal structure for central office teams to collaborate across offices and departments since SY 2018-19. During the SY 2019-20, ICT (Interdepartmental Collaboration Teams) met formally to work on division problems of practice in reading, math and MTSS. Cross departmental teams continue to collaborate to provide schools with research-based best practices, updated curriculum, and resources aligned with state expectation through professional development opportunities. For example, a new Closing the Achievement Gap toolkit was developed by multiple driver champions including MTSS, for school teams to hone in on high leverage strategies in each of the six CAG drivers to support school teams with strategies and actions for their SIIPs. EL initiatives (ELIC and NIC) also provide support to schools in helping beginning level students make substantial progress in English proficiency. For the EL proficiency metric, though division wide numbers dropped, it is worth investigating what data looked like for the schools that participated in EL Innovation Cohorts and EL Innovation NIC as a subgroup to inform future planning. In addition, for the SY 2020-21 mandatory training for all FCPS teachers on the use of English learner data and best practices for teaching ELs began.
Additionally, the curriculum, MTSS and, school improvement teams are working closely with schools to support the implementation of new initiatives and to ensure successful transformation of knowledge into daily practices. In 2019-20 staff began developing implementation metrics to measure the impact of professional development on student outcomes. Cross departmental teams analyzed school level data focusing on traditionally vulnerable groups such as Hispanic students, English learners and students with disabilities. Initial analysis looking at school variations indicated that there are “bright spots” for these groups which tells a more hopeful story than just looking at division aggregated performance. Structured interviews will be conducted in schools that are demonstrating progress to understand possible scalable best practices at division level.
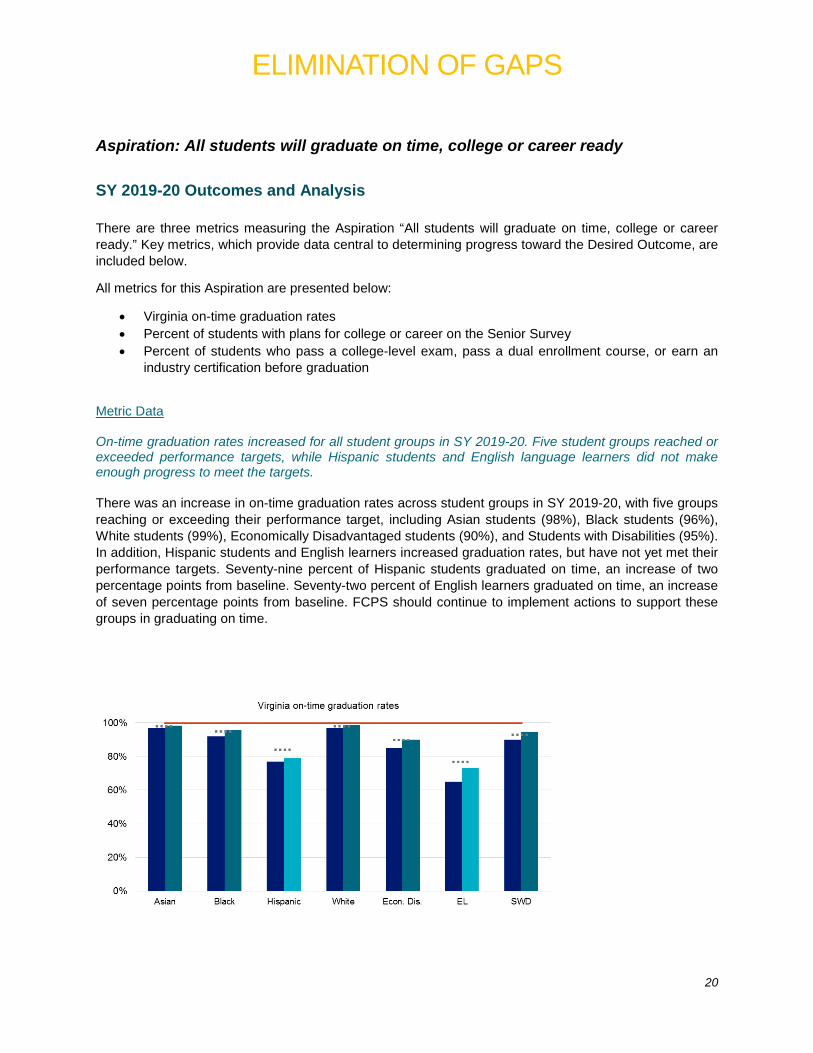
ELIMINATION OF GAPS
20
Aspiration: All students will graduate on time, college or career ready SY 2019-20 Outcomes and Analysis There are three metrics measuring the Aspiration “All students will graduate on time, college or career ready.” Key metrics, which provide data central to determining progress toward the Desired Outcome, are included below.
All metrics for this Aspiration are presented below:
• Virginia on-time graduation rates • Percent of students with plans for college or career on the Senior Survey • Percent of students who pass a college-level exam, pass a dual enrollment course, or earn an
industry certification before graduation
Metric Data On-time graduation rates increased for all student groups in SY 2019-20. Five student groups reached or exceeded performance targets, while Hispanic students and English language learners did not make enough progress to meet the targets. There was an increase in on-time graduation rates across student groups in SY 2019-20, with five groups reaching or exceeding their performance target, including Asian students (98%), Black students (96%), White students (99%), Economically Disadvantaged students (90%), and Students with Disabilities (95%). In addition, Hispanic students and English learners increased graduation rates, but have not yet met their performance targets. Seventy-nine percent of Hispanic students graduated on time, an increase of two percentage points from baseline. Seventy-two percent of English learners graduated on time, an increase of seven percentage points from baseline. FCPS should continue to implement actions to support these groups in graduating on time.
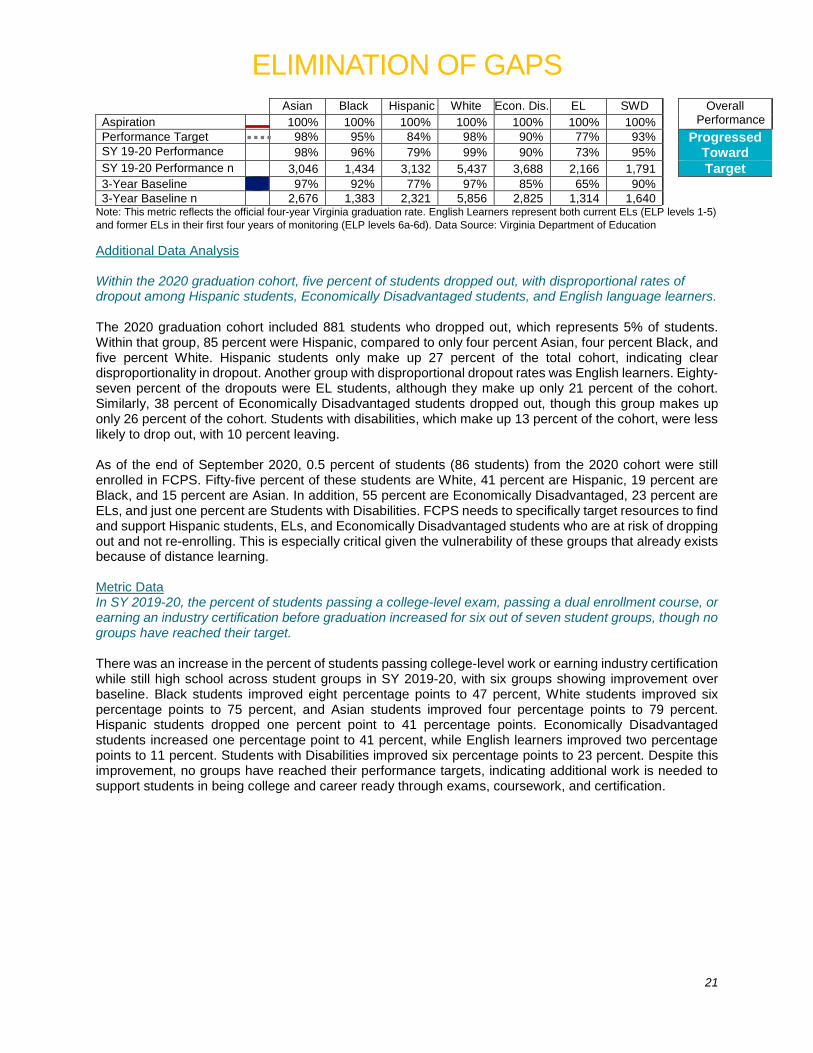
ELIMINATION OF GAPS
21
Asian Black Hispanic White Econ. Dis. EL SWD Overall Performance Aspiration 100% 100% 100% 100% 100% 100% 100%
Performance Target 98% 95% 84% 98% 90% 77% 93% Progressed Toward SY 19-20 Performance 98% 96% 79% 99% 90% 73% 95%
SY 19-20 Performance n 3,046 1,434 3,132 5,437 3,688 2,166 1,791 Target 3-Year Baseline 97% 92% 77% 97% 85% 65% 90% 3-Year Baseline n 2,676 1,383 2,321 5,856 2,825 1,314 1,640
Note: This metric reflects the official four-year Virginia graduation rate. English Learners represent both current ELs (ELP levels 1-5) and former ELs in their first four years of monitoring (ELP levels 6a-6d). Data Source: Virginia Department of Education
Additional Data Analysis Within the 2020 graduation cohort, five percent of students dropped out, with disproportional rates of dropout among Hispanic students, Economically Disadvantaged students, and English language learners. The 2020 graduation cohort included 881 students who dropped out, which represents 5% of students. Within that group, 85 percent were Hispanic, compared to only four percent Asian, four percent Black, and five percent White. Hispanic students only make up 27 percent of the total cohort, indicating clear disproportionality in dropout. Another group with disproportional dropout rates was English learners. Eighty-seven percent of the dropouts were EL students, although they make up only 21 percent of the cohort. Similarly, 38 percent of Economically Disadvantaged students dropped out, though this group makes up only 26 percent of the cohort. Students with disabilities, which make up 13 percent of the cohort, were less likely to drop out, with 10 percent leaving. As of the end of September 2020, 0.5 percent of students (86 students) from the 2020 cohort were still enrolled in FCPS. Fifty-five percent of these students are White, 41 percent are Hispanic, 19 percent are Black, and 15 percent are Asian. In addition, 55 percent are Economically Disadvantaged, 23 percent are ELs, and just one percent are Students with Disabilities. FCPS needs to specifically target resources to find and support Hispanic students, ELs, and Economically Disadvantaged students who are at risk of dropping out and not re-enrolling. This is especially critical given the vulnerability of these groups that already exists because of distance learning. Metric Data In SY 2019-20, the percent of students passing a college-level exam, passing a dual enrollment course, or earning an industry certification before graduation increased for six out of seven student groups, though no groups have reached their target. There was an increase in the percent of students passing college-level work or earning industry certification while still high school across student groups in SY 2019-20, with six groups showing improvement over baseline. Black students improved eight percentage points to 47 percent, White students improved six percentage points to 75 percent, and Asian students improved four percentage points to 79 percent. Hispanic students dropped one percent point to 41 percentage points. Economically Disadvantaged students increased one percentage point to 41 percent, while English learners improved two percentage points to 11 percent. Students with Disabilities improved six percentage points to 23 percent. Despite this improvement, no groups have reached their performance targets, indicating additional work is needed to support students in being college and career ready through exams, coursework, and certification.
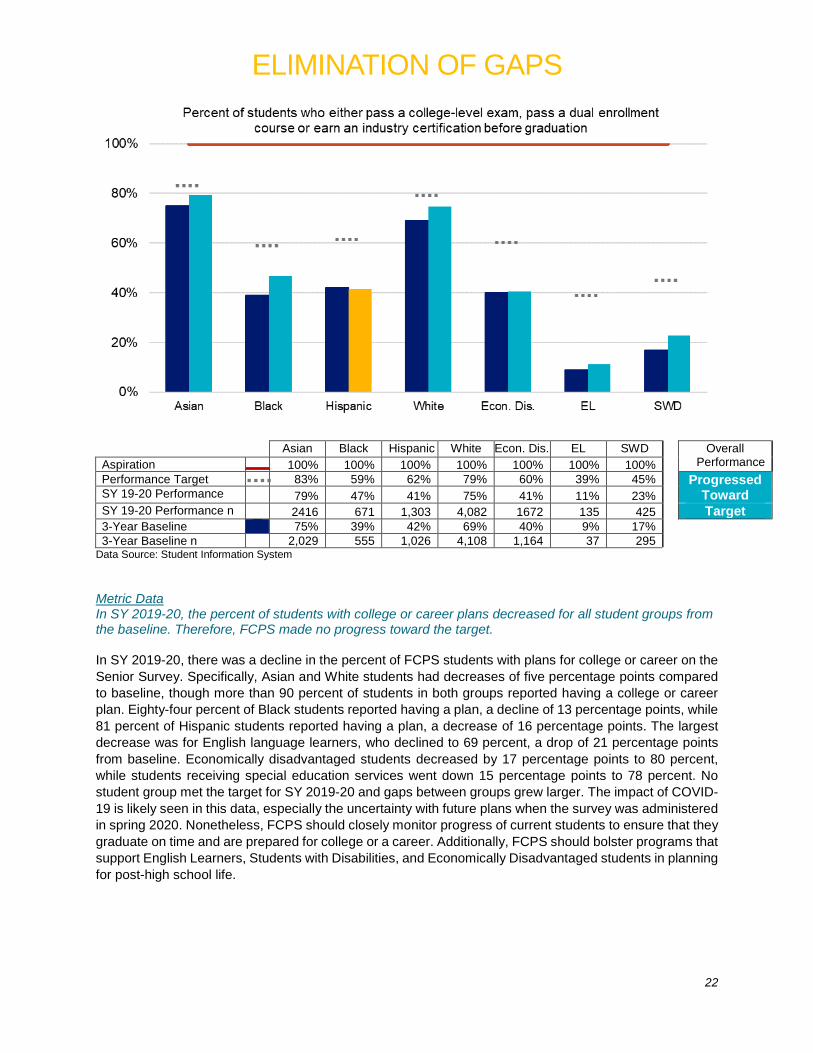
ELIMINATION OF GAPS
22
Asian Black Hispanic White Econ. Dis. EL SWD Overall Performance Aspiration 100% 100% 100% 100% 100% 100% 100%
Performance Target 83% 59% 62% 79% 60% 39% 45% Progressed Toward SY 19-20 Performance 79% 47% 41% 75% 41% 11% 23%
SY 19-20 Performance n 2416 671 1,303 4,082 1672 135 425 Target 3-Year Baseline 75% 39% 42% 69% 40% 9% 17% 3-Year Baseline n 2,029 555 1,026 4,108 1,164 37 295
Data Source: Student Information System Metric Data In SY 2019-20, the percent of students with college or career plans decreased for all student groups from the baseline. Therefore, FCPS made no progress toward the target. In SY 2019-20, there was a decline in the percent of FCPS students with plans for college or career on the Senior Survey. Specifically, Asian and White students had decreases of five percentage points compared to baseline, though more than 90 percent of students in both groups reported having a college or career plan. Eighty-four percent of Black students reported having a plan, a decline of 13 percentage points, while 81 percent of Hispanic students reported having a plan, a decrease of 16 percentage points. The largest decrease was for English language learners, who declined to 69 percent, a drop of 21 percentage points from baseline. Economically disadvantaged students decreased by 17 percentage points to 80 percent, while students receiving special education services went down 15 percentage points to 78 percent. No student group met the target for SY 2019-20 and gaps between groups grew larger. The impact of COVID-19 is likely seen in this data, especially the uncertainty with future plans when the survey was administered in spring 2020. Nonetheless, FCPS should closely monitor progress of current students to ensure that they graduate on time and are prepared for college or a career. Additionally, FCPS should bolster programs that support English Learners, Students with Disabilities, and Economically Disadvantaged students in planning for post-high school life.
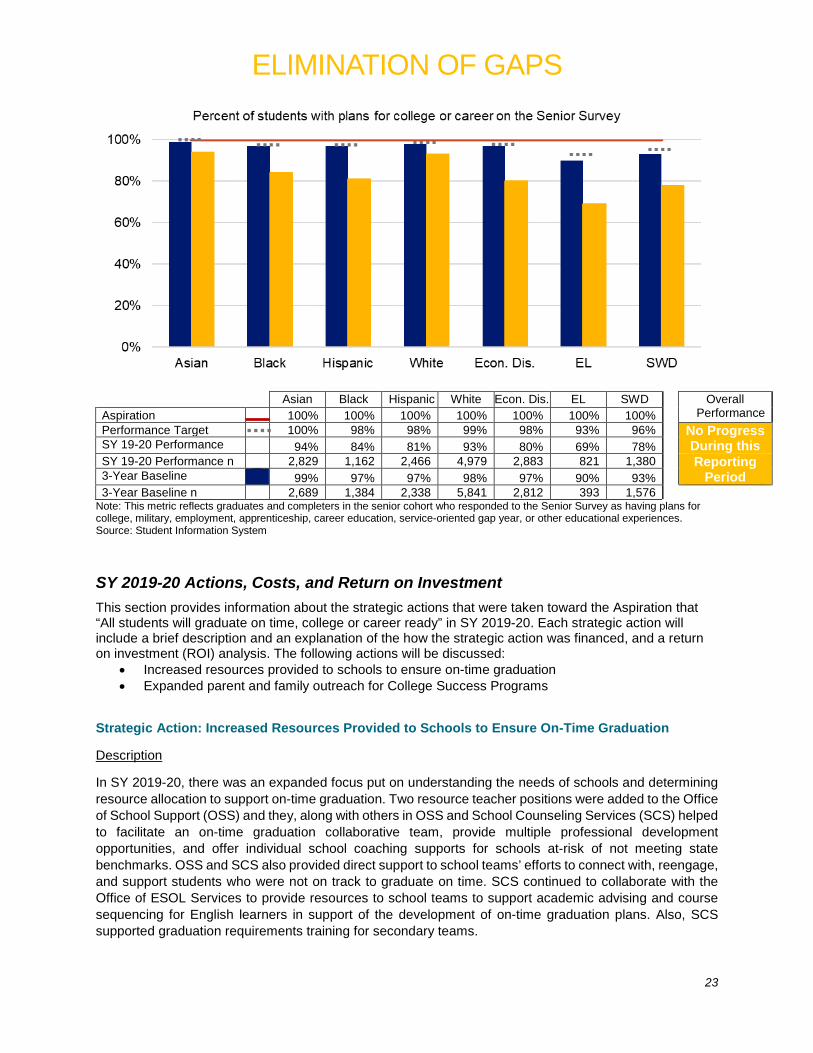
ELIMINATION OF GAPS
23
Asian Black Hispanic White Econ. Dis. EL SWD Overall
Performance Aspiration 100% 100% 100% 100% 100% 100% 100% Performance Target 100% 98% 98% 99% 98% 93% 96% No Progress
During this SY 19-20 Performance 94% 84% 81% 93% 80% 69% 78% SY 19-20 Performance n 2,829 1,162 2,466 4,979 2,883 821 1,380 Reporting
Period 3-Year Baseline 99% 97% 97% 98% 97% 90% 93% 3-Year Baseline n 2,689 1,384 2,338 5,841 2,812 393 1,576
Note: This metric reflects graduates and completers in the senior cohort who responded to the Senior Survey as having plans for college, military, employment, apprenticeship, career education, service-oriented gap year, or other educational experiences. Source: Student Information System
SY 2019-20 Actions, Costs, and Return on Investment This section provides information about the strategic actions that were taken toward the Aspiration that “All students will graduate on time, college or career ready” in SY 2019-20. Each strategic action will include a brief description and an explanation of the how the strategic action was financed, and a return on investment (ROI) analysis. The following actions will be discussed:
• Increased resources provided to schools to ensure on-time graduation • Expanded parent and family outreach for College Success Programs
Strategic Action: Increased Resources Provided to Schools to Ensure On-Time Graduation
Description
In SY 2019-20, there was an expanded focus put on understanding the needs of schools and determining resource allocation to support on-time graduation. Two resource teacher positions were added to the Office of School Support (OSS) and they, along with others in OSS and School Counseling Services (SCS) helped to facilitate an on-time graduation collaborative team, provide multiple professional development opportunities, and offer individual school coaching supports for schools at-risk of not meeting state benchmarks. OSS and SCS also provided direct support to school teams’ efforts to connect with, reengage, and support students who were not on track to graduate on time. SCS continued to collaborate with the Office of ESOL Services to provide resources to school teams to support academic advising and course sequencing for English learners in support of the development of on-time graduation plans. Also, SCS supported graduation requirements training for secondary teams.
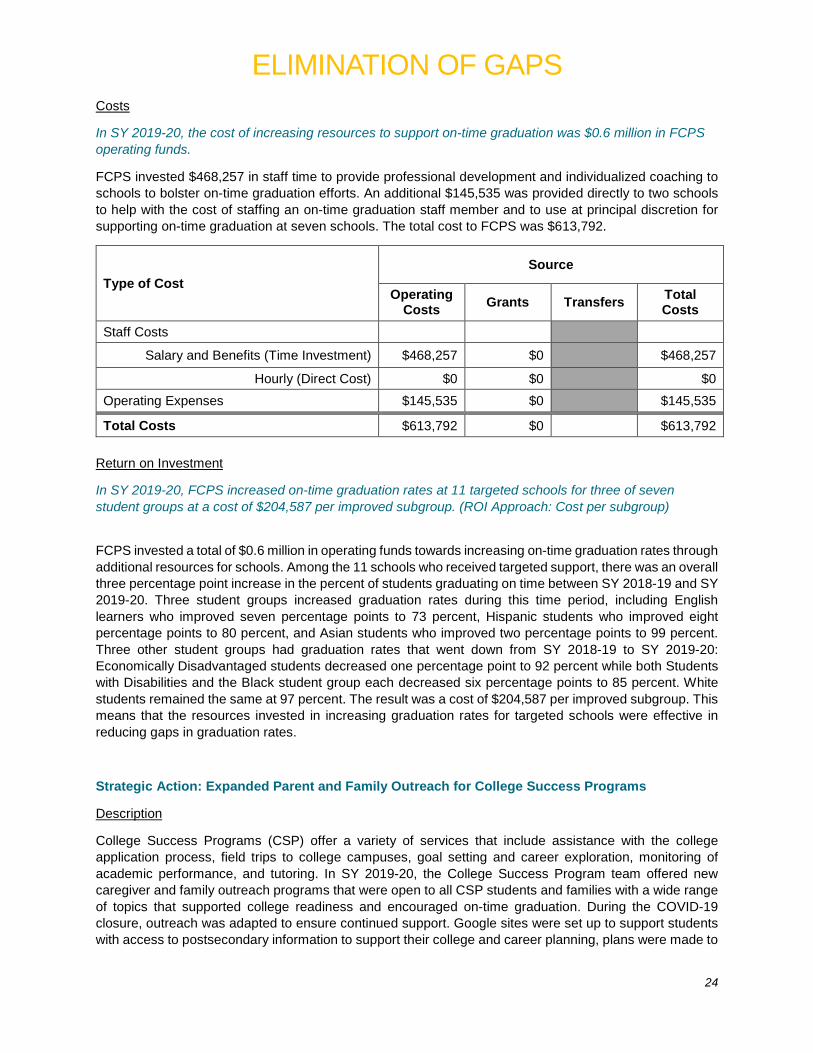
ELIMINATION OF GAPS
24
Costs
In SY 2019-20, the cost of increasing resources to support on-time graduation was $0.6 million in FCPS operating funds.
FCPS invested $468,257 in staff time to provide professional development and individualized coaching to schools to bolster on-time graduation efforts. An additional $145,535 was provided directly to two schools to help with the cost of staffing an on-time graduation staff member and to use at principal discretion for supporting on-time graduation at seven schools. The total cost to FCPS was $613,792.
Type of Cost Source
Operating Costs Grants Transfers Total
Costs Staff Costs
Salary and Benefits (Time Investment) $468,257 $0 $468,257
Hourly (Direct Cost) $0 $0 $0 Operating Expenses $145,535 $0 $145,535
Total Costs $613,792 $0 $613,792 Return on Investment
In SY 2019-20, FCPS increased on-time graduation rates at 11 targeted schools for three of seven student groups at a cost of $204,587 per improved subgroup. (ROI Approach: Cost per subgroup)
FCPS invested a total of $0.6 million in operating funds towards increasing on-time graduation rates through additional resources for schools. Among the 11 schools who received targeted support, there was an overall three percentage point increase in the percent of students graduating on time between SY 2018-19 and SY 2019-20. Three student groups increased graduation rates during this time period, including English learners who improved seven percentage points to 73 percent, Hispanic students who improved eight percentage points to 80 percent, and Asian students who improved two percentage points to 99 percent. Three other student groups had graduation rates that went down from SY 2018-19 to SY 2019-20: Economically Disadvantaged students decreased one percentage point to 92 percent while both Students with Disabilities and the Black student group each decreased six percentage points to 85 percent. White students remained the same at 97 percent. The result was a cost of $204,587 per improved subgroup. This means that the resources invested in increasing graduation rates for targeted schools were effective in reducing gaps in graduation rates.
Strategic Action: Expanded Parent and Family Outreach for College Success Programs
Description
College Success Programs (CSP) offer a variety of services that include assistance with the college application process, field trips to college campuses, goal setting and career exploration, monitoring of academic performance, and tutoring. In SY 2019-20, the College Success Program team offered new caregiver and family outreach programs that were open to all CSP students and families with a wide range of topics that supported college readiness and encouraged on-time graduation. During the COVID-19 closure, outreach was adapted to ensure continued support. Google sites were set up to support students with access to postsecondary information to support their college and career planning, plans were made to
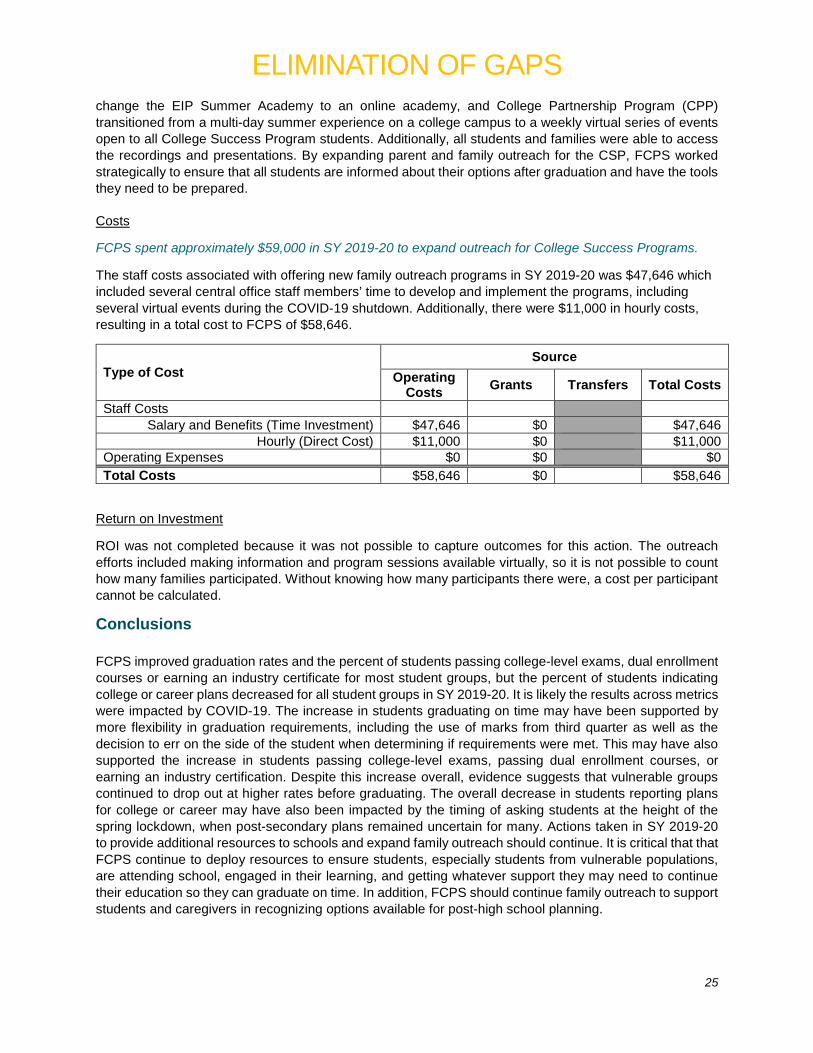
ELIMINATION OF GAPS
25
change the EIP Summer Academy to an online academy, and College Partnership Program (CPP) transitioned from a multi-day summer experience on a college campus to a weekly virtual series of events open to all College Success Program students. Additionally, all students and families were able to access the recordings and presentations. By expanding parent and family outreach for the CSP, FCPS worked strategically to ensure that all students are informed about their options after graduation and have the tools they need to be prepared.
Costs
FCPS spent approximately $59,000 in SY 2019-20 to expand outreach for College Success Programs.
The staff costs associated with offering new family outreach programs in SY 2019-20 was $47,646 which included several central office staff members’ time to develop and implement the programs, including several virtual events during the COVID-19 shutdown. Additionally, there were $11,000 in hourly costs, resulting in a total cost to FCPS of $58,646.
Type of Cost Source
Operating Costs Grants Transfers Total Costs
Staff Costs Salary and Benefits (Time Investment) $47,646 $0 $47,646
Hourly (Direct Cost) $11,000 $0 $11,000 Operating Expenses $0 $0 $0 Total Costs $58,646 $0 $58,646
Return on Investment
ROI was not completed because it was not possible to capture outcomes for this action. The outreach efforts included making information and program sessions available virtually, so it is not possible to count how many families participated. Without knowing how many participants there were, a cost per participant cannot be calculated.
Conclusions FCPS improved graduation rates and the percent of students passing college-level exams, dual enrollment courses or earning an industry certificate for most student groups, but the percent of students indicating college or career plans decreased for all student groups in SY 2019-20. It is likely the results across metrics were impacted by COVID-19. The increase in students graduating on time may have been supported by more flexibility in graduation requirements, including the use of marks from third quarter as well as the decision to err on the side of the student when determining if requirements were met. This may have also supported the increase in students passing college-level exams, passing dual enrollment courses, or earning an industry certification. Despite this increase overall, evidence suggests that vulnerable groups continued to drop out at higher rates before graduating. The overall decrease in students reporting plans for college or career may have also been impacted by the timing of asking students at the height of the spring lockdown, when post-secondary plans remained uncertain for many. Actions taken in SY 2019-20 to provide additional resources to schools and expand family outreach should continue. It is critical that that FCPS continue to deploy resources to ensure students, especially students from vulnerable populations, are attending school, engaged in their learning, and getting whatever support they may need to continue their education so they can graduate on time. In addition, FCPS should continue family outreach to support students and caregivers in recognizing options available for post-high school planning.
ELIMINATION OF GAPS
26
Goal Champion Response to Conclusions Agree. During the SY 2019-20, an expanded focus with increased resources to support on-time graduation for targeted schools with ongoing progress monitoring contributed to the increase in on-time graduation rates. Additional state flexibility to meet graduation requirements also played a role in graduation outcomes. In addition, SY 2019-20 was the fourth year of the new high school English learner programming which provided all ELs, regardless of the ELP level they entered high school, with a 4-year pathway to graduation.
The collaborative cross-departmental efforts provided a model for how data knowledge and research-based practices together with customized implementation support may effectively impact outcomes. With the help of additional on-time graduation monitors and cross-departmental collaboration, more support was given to specific vulnerable student groups in specific schools. Research indicates that drop-out prevention needs to start earlier especially for Hispanic students, economically disadvantaged students and English learners with both data monitoring and responsive actions in place throughout the year. Considerations of expanding analysis capacity and making data monitoring tools available to various stakeholders is underway with the help of the Department of Information Technology.
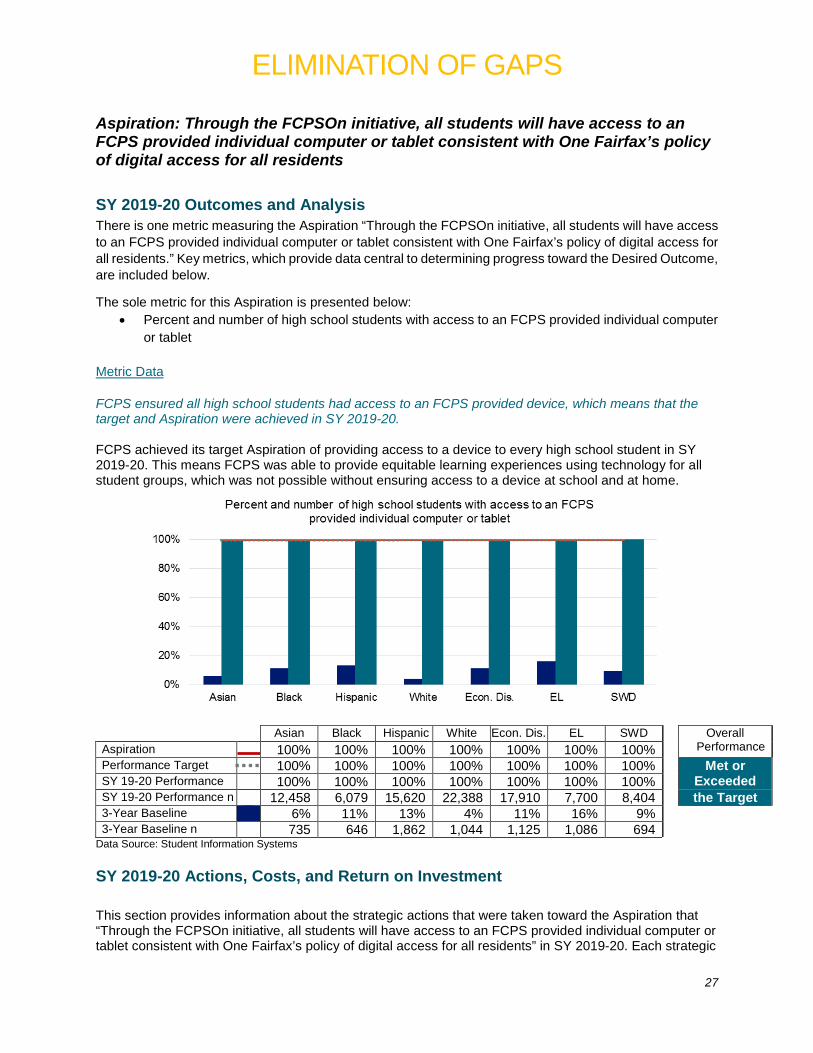
ELIMINATION OF GAPS
27
Aspiration: Through the FCPSOn initiative, all students will have access to an FCPS provided individual computer or tablet consistent with One Fairfax’s policy of digital access for all residents SY 2019-20 Outcomes and Analysis There is one metric measuring the Aspiration “Through the FCPSOn initiative, all students will have access to an FCPS provided individual computer or tablet consistent with One Fairfax’s policy of digital access for all residents.” Key metrics, which provide data central to determining progress toward the Desired Outcome, are included below.
The sole metric for this Aspiration is presented below: • Percent and number of high school students with access to an FCPS provided individual computer
or tablet Metric Data FCPS ensured all high school students had access to an FCPS provided device, which means that the target and Aspiration were achieved in SY 2019-20. FCPS achieved its target Aspiration of providing access to a device to every high school student in SY 2019-20. This means FCPS was able to provide equitable learning experiences using technology for all student groups, which was not possible without ensuring access to a device at school and at home.
Asian Black Hispanic White Econ. Dis. EL SWD Overall
Performance Aspiration 100% 100% 100% 100% 100% 100% 100% Performance Target 100% 100% 100% 100% 100% 100% 100% Met or
Exceeded SY 19-20 Performance 100% 100% 100% 100% 100% 100% 100% SY 19-20 Performance n 12,458 6,079 15,620 22,388 17,910 7,700 8,404 the Target 3-Year Baseline 6% 11% 13% 4% 11% 16% 9% 3-Year Baseline n 735 646 1,862 1,044 1,125 1,086 694
Data Source: Student Information Systems SY 2019-20 Actions, Costs, and Return on Investment This section provides information about the strategic actions that were taken toward the Aspiration that “Through the FCPSOn initiative, all students will have access to an FCPS provided individual computer or tablet consistent with One Fairfax’s policy of digital access for all residents” in SY 2019-20. Each strategic
ELIMINATION OF GAPS
28
action will include a brief description, an explanation of the how the strategic action was financed, and a Return on Investment (ROI) analysis. The following actions will be discussed:
• Contracted Johns Hopkins University to Conduct a Program Evaluation on FCPSon • Expanded implementation of FCPSon in high schools and began implementation in middle
schools. • Increased student access to MiFi devices during the COVID-19 pandemic (Not part of FCPSon) • Expanded distribution of loaner laptops during the COVID-19 pandemic (Not part of FCPSon)
Strategic Action: Contracted Johns Hopkins University to Conduct a Program Evaluation on FCPSon Description In SY 2019-20, FCPS continued to contract Johns Hopkins University to conduct a program evaluation on FCPSon, centered on progress toward five goals including:
• Providing students equitable access to technology and resources at school and at home • Supporting students development of Portrait of a Graduate attributes • Preparing students in how to use technology after graduation • Preparing educators on effective technology use through professional development • Reinforcing digital citizenship
The original program evaluation used three years of data to draw conclusions and make recommendations about the FCPSon implementation and was presented to FCPS in SY 2019-20. The intention of the program evaluation was to ensure that FCPS fully implements the FCPSon program as planned, which means expanding access to devices and ensuring that these devices are used according to best practices for using technology in education. The program evaluation was conducted on the entire Chantilly Pyramid as well as the following high schools that participated in the eLearning Backpack program: Annandale HS, Falls Church HS, Justice HS, Lee HS, Mount Vernon HS. Ultimately, the evaluation resulted in a three-year comprehensive plan for FCPSon implementation, with a contract renewal for Johns Hopkins University to continue to review FCPSon implementation data for the next three years. The first year of the contract was in SY 2019-20, but all activities related to the program evaluation were halted because of the COVID-19 pandemic. The comprehensive plan includes phasing in middle and elementary school device distribution and professional development throughout SY 2023-24.
Costs
In SY 2019-20, it cost approximately $109,000 operating funds to initiate a program evaluation on the implementation of FCPSon.
The contract with Johns Hopkins University specified a cost of $108,625 to conduct the program evaluation, which came from operating funds. This constitutes all of the costs for this action.
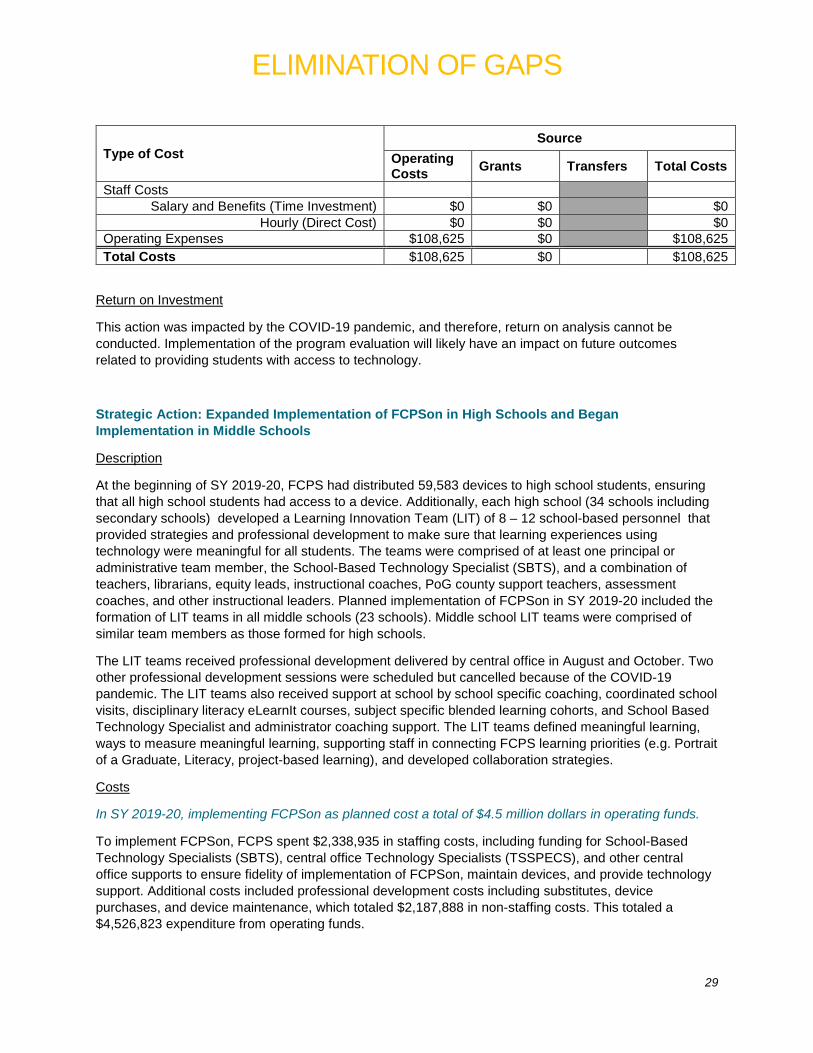
ELIMINATION OF GAPS
29
Type of Cost Source
Operating Costs Grants Transfers Total Costs
Staff Costs Salary and Benefits (Time Investment) $0 $0 $0
Hourly (Direct Cost) $0 $0 $0 Operating Expenses $108,625 $0 $108,625 Total Costs $108,625 $0 $108,625
Return on Investment
This action was impacted by the COVID-19 pandemic, and therefore, return on analysis cannot be conducted. Implementation of the program evaluation will likely have an impact on future outcomes related to providing students with access to technology.
Strategic Action: Expanded Implementation of FCPSon in High Schools and Began Implementation in Middle Schools
Description
At the beginning of SY 2019-20, FCPS had distributed 59,583 devices to high school students, ensuring that all high school students had access to a device. Additionally, each high school (34 schools including secondary schools) developed a Learning Innovation Team (LIT) of 8 – 12 school-based personnel that provided strategies and professional development to make sure that learning experiences using technology were meaningful for all students. The teams were comprised of at least one principal or administrative team member, the School-Based Technology Specialist (SBTS), and a combination of teachers, librarians, equity leads, instructional coaches, PoG county support teachers, assessment coaches, and other instructional leaders. Planned implementation of FCPSon in SY 2019-20 included the formation of LIT teams in all middle schools (23 schools). Middle school LIT teams were comprised of similar team members as those formed for high schools.
The LIT teams received professional development delivered by central office in August and October. Two other professional development sessions were scheduled but cancelled because of the COVID-19 pandemic. The LIT teams also received support at school by school specific coaching, coordinated school visits, disciplinary literacy eLearnIt courses, subject specific blended learning cohorts, and School Based Technology Specialist and administrator coaching support. The LIT teams defined meaningful learning, ways to measure meaningful learning, supporting staff in connecting FCPS learning priorities (e.g. Portrait of a Graduate, Literacy, project-based learning), and developed collaboration strategies.
Costs
In SY 2019-20, implementing FCPSon as planned cost a total of $4.5 million dollars in operating funds.
To implement FCPSon, FCPS spent $2,338,935 in staffing costs, including funding for School-Based Technology Specialists (SBTS), central office Technology Specialists (TSSPECS), and other central office supports to ensure fidelity of implementation of FCPSon, maintain devices, and provide technology support. Additional costs included professional development costs including substitutes, device purchases, and device maintenance, which totaled $2,187,888 in non-staffing costs. This totaled a $4,526,823 expenditure from operating funds.

ELIMINATION OF GAPS
30
Type of Cost Source
Operating Funds Grants Transfers Total
Costs Staff Costs
Salary and Benefits (Time Investment) $2,338,935 $0 $2,338,935 Hourly (Direct Cost) $0 $0 $0
Operating Expenses $2,187,888 $0 $2,187,888 Total Costs $4,526,823 $0 $4,526,823
Return on Investment
Providing students with access to a device and associated meaningful learning experiences using technology required an investment of $76 per student directly impacted by FCPSon in SY 2019-20. (ROI Approach: Cost per participant)
The implementation of FCPSon resulted in 59,583 students having access to an FCPS-provided device, which required a total investment of $4,526,823 from FCPS, or $76 per student with access to a device. Providing all students access to technology ensures that all students have equitable access to resources that are necessary to engage in meaningful learning experiences. Additionally, the fact that all high school students had access to an FCPS provided device in the fall, meant that fewer students required FCPS provided devices to engage in distance learning when the COVID-19 pandemic began.
Strategic Action: Increased Student Access to MiFi Devices During the COVID-19 Pandemic (Not Part of FCPSon) Description FCPS has provided access to MiFi devices for students who do not have internet access for many years, even prior to the beginning of FCPSon. The intent behind providing students with these devices is to ensure students have reliable access to the internet to complete homework assignments and fulfill other academic needs at home, rather than having to get access to the internet at a library or community center, or not have access at all. When the COVID-19 pandemic caused an emergency school closure for an entire quarter in SY 2019-20, access to internet was even more important as FCPS transitioned to providing instruction virtually. As such, FCPS loaned 1,433 MiFi devices to middle and elementary schools. TSSpecs and other school-based staff found a safe way to distribute these devices to families who needed it.
Strategic Action: Expanded Distribution of Loaner Laptops during the COVID-19 Pandemic (Not Part of FCPSon) Description In addition to providing students with reliable access to the internet during the COVID-19 pandemic, FCPS distributed 19,821 laptops to loan to middle and elementary students. The laptops that were loaned out already existed in FCPS, so there were no additional devices purchased. TSSpecs and other school-based staff safely distributed these devices during the spring of 2020. The intent behind this action was to ensure that all students had access to resources to engage meaningfully in distance learning after the emergency shut down.
ELIMINATION OF GAPS
31
Conclusions FCPS achieved its goal of providing all high school students with devices, effectively eliminating gaps in access to technology for all high school students. Implementation of FCPSon in SY 2019-20 not only involved providing students with devices, but also with providing school-based personnel in high schools and middle schools with the professional development they need to provide meaningful instruction using technology. The FCPSOn program implementation also involved an annual evaluation to ensure that access to technology promotes better educational experiences for students and is used appropriately to promote digital citizenship skills for students. FCPS is well-positioned to continue implementation of FCPSon to middle school students and should continue to follow the multi-year comprehensive plan, which will increase equity in access to technology.
Goal Champion Response to Conclusions Agree. In the SY 2019-20, FCPS has successfully closed the gap in access to technology by providing all high school students with individual laptops. Mifi connections and expansion of loaner laptops during closure helped to ensure distance learning access for all students. Professional development opportunities with adapted curriculum and pedagogy play an important role in the effectiveness of integrating technology into instruction. Learning Innovation Teams (LIT) at schools are supporting the implementation of these initiatives. Johns Hopkins University evaluation team continues to monitor implementation through program evaluation which supports the initiative's continuous improvement. The FCPSOn high school model is well established and will continue to be supported as it serves as a model to expand the current middle school implementation. Family and community outreach together with effective communication will support a smooth expansion effort as well.

ELIMINATION OF GAPS
32
Aspiration: Participation and performance rates will be similarly high across student groups in Advanced Academic Programs (AAP) There are five metrics measuring the Aspiration “Participation and performance rates will be similarly high across student groups in Advanced Academic Programs (AAP).” Key metrics, which provide data central to determining progress toward the Desired Outcome, are included below. Additional metrics are available in Appendix C. The following key metrics are presented below:
• Percent of students participating in AAP (Grades 3-8) • Number of schools offering the Young Scholars program • Number of schools offering local level IV instruction • Percent of classrooms where students receive instructional experiences using AAP curriculum
The following additional metrics can be found in Appendix C:
• Percent of AAP students demonstrating advanced performance in Reading or Mathematics on SOL tests (Grades 3-8)
SY 2019-20 Outcomes and Analysis Metric Data
In SY 2019-20, FCPS made progress toward equitable participation in Advanced Academic Programs (AAP) across all student groups. Specifically, White and Asian student groups continued to meet or exceed the target in participation in AAP. All other student groups made progress from the baseline. Black student participation was only 1 percentage point away from meeting the target and made meaningful progress from the baseline with a 5-percentage point increase. Hispanic and Economically Disadvantaged student groups increased by 2 percentage points from the baseline, whereas English Learner and Students with Disabilities student groups only increased by 1 percentage point. FCPS should evaluate why participation rates stalled for these four student groups from the baseline.
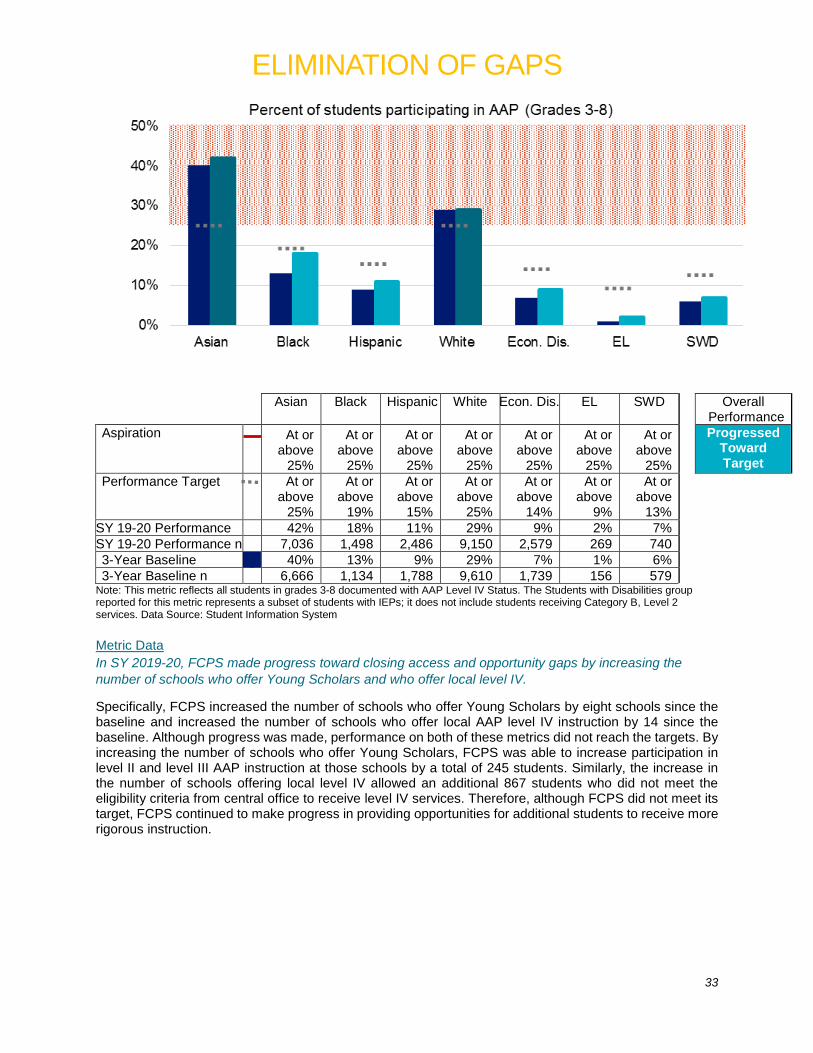
ELIMINATION OF GAPS
33
Asian Black Hispanic White Econ. Dis. EL SWD Overall
Performance Aspiration At or
above 25%
At or above
25%
At or above
25%
At or above
25%
At or above
25%
At or above
25%
At or above
25%
Progressed Toward Target
Performance Target At or above
25%
At or above
19%
At or above
15%
At or above
25%
At or above
14%
At or above
9%
At or above
13%
SY 19-20 Performance 42% 18% 11% 29% 9% 2% 7% SY 19-20 Performance n 7,036 1,498 2,486 9,150 2,579 269 740 3-Year Baseline 40% 13% 9% 29% 7% 1% 6% 3-Year Baseline n 6,666 1,134 1,788 9,610 1,739 156 579
Note: This metric reflects all students in grades 3-8 documented with AAP Level IV Status. The Students with Disabilities group reported for this metric represents a subset of students with IEPs; it does not include students receiving Category B, Level 2 services. Data Source: Student Information System Metric Data In SY 2019-20, FCPS made progress toward closing access and opportunity gaps by increasing the number of schools who offer Young Scholars and who offer local level IV.
Specifically, FCPS increased the number of schools who offer Young Scholars by eight schools since the baseline and increased the number of schools who offer local AAP level IV instruction by 14 since the baseline. Although progress was made, performance on both of these metrics did not reach the targets. By increasing the number of schools who offer Young Scholars, FCPS was able to increase participation in level II and level III AAP instruction at those schools by a total of 245 students. Similarly, the increase in the number of schools offering local level IV allowed an additional 867 students who did not meet the eligibility criteria from central office to receive level IV services. Therefore, although FCPS did not meet its target, FCPS continued to make progress in providing opportunities for additional students to receive more rigorous instruction.
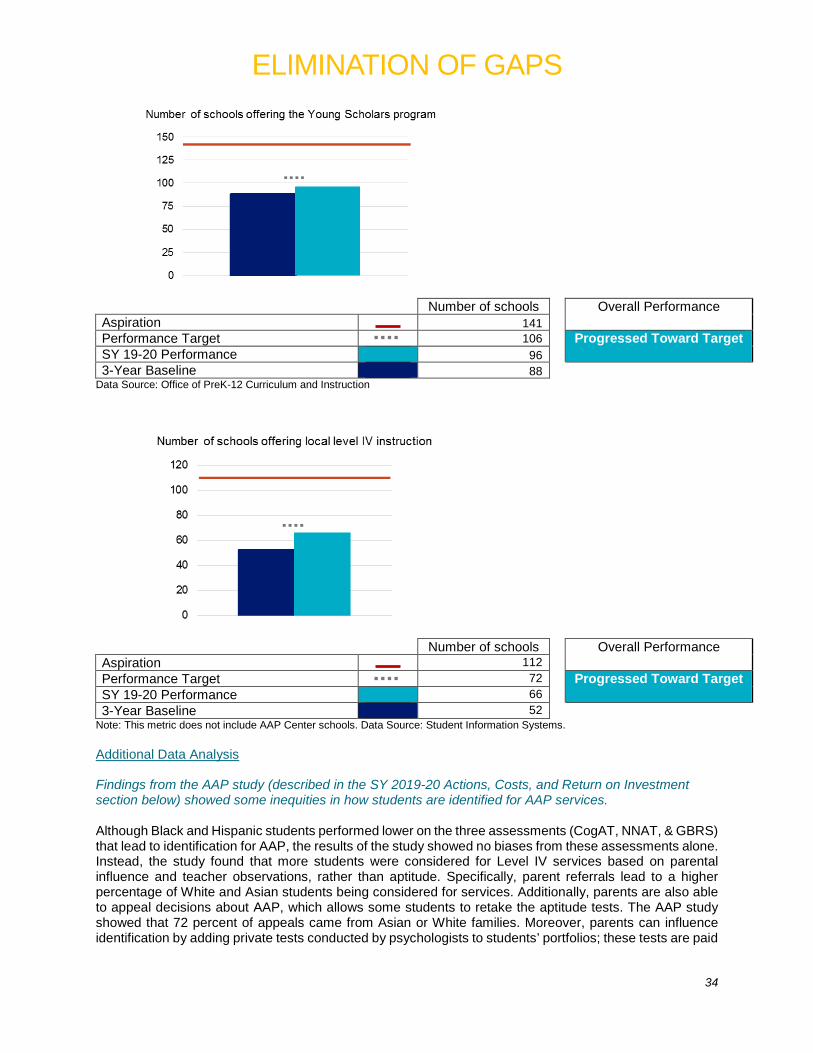
ELIMINATION OF GAPS
34
Number of schools Overall Performance Aspiration 141 Performance Target 106 Progressed Toward Target SY 19-20 Performance 96 3-Year Baseline 88
Data Source: Office of PreK-12 Curriculum and Instruction
Number of schools Overall Performance Aspiration 112 Performance Target 72 Progressed Toward Target SY 19-20 Performance 66 3-Year Baseline 52
Note: This metric does not include AAP Center schools. Data Source: Student Information Systems. Additional Data Analysis Findings from the AAP study (described in the SY 2019-20 Actions, Costs, and Return on Investment section below) showed some inequities in how students are identified for AAP services. Although Black and Hispanic students performed lower on the three assessments (CogAT, NNAT, & GBRS) that lead to identification for AAP, the results of the study showed no biases from these assessments alone. Instead, the study found that more students were considered for Level IV services based on parental influence and teacher observations, rather than aptitude. Specifically, parent referrals lead to a higher percentage of White and Asian students being considered for services. Additionally, parents are also able to appeal decisions about AAP, which allows some students to retake the aptitude tests. The AAP study showed that 72 percent of appeals came from Asian or White families. Moreover, parents can influence identification by adding private tests conducted by psychologists to students’ portfolios; these tests are paid

ELIMINATION OF GAPS
35
for by the parents. The AAP study also showed that the Gifted Behaviors Rating Scale (GBRS), which is an assessment developed by FCPS for teachers to rate students on the frequency of exceptional behaviors held more weight compared to the Cognitive Abilities Test (CogAT) and the Naglieri Nonverbal Abilities Test (NNAT), which are both aptitude tests. This means that teacher opinions about students were given more consideration, even if some students outperformed others on the aptitude tests. Furthermore, the AAP study showed that some parents would advocate to teachers to reassess students on the GBRS. Together, these results from the AAP study show that Black, Hispanic, and other non-Asian / non-White students continue to be at a disadvantage, despite performance on aptitude tests. As such, if FCPS wants to increase equity in providing AAP opportunities, tighter identification policies should be in place so that parent advocacy and the potential biases from teachers have less influence on the process. Metric Data In SY 2019-20, data collection to identify the percent of classrooms where students received AAP curriculum did not take place due to the COVID-19 closure, so data are not available for this metric.
Asian Black Hispanic White Econ. Dis. EL SWD Overall
Performance Aspiration 100% 100% 100% 100% 100% 100% 100% Performance Target Data Not
Available SY 19-20 Performance SY 19-20 Performance n 3-Year Baseline 3-Year Baseline n
SY 2019-20 Actions, Costs, and Return on Investment This section provides information about the strategic actions that were taken toward the Aspiration that “Participation and performance rates will be similarly high across student groups in Advanced Academic Programs (AAP)” in SY 2019-20. Each strategic action will include a brief description, an explanation of the how the strategic action was financed, and a Return on Investment (ROI) analysis. The following actions will be discussed:
• Increased the amount of full time AARTs in Title I schools • Incorporated AAP curriculum into Tier 1 instruction • Expanded Young Scholars • Expanded Local AAP Level IV • Contracted an external research study on equity in AAP
Data not available for SY 2019-20
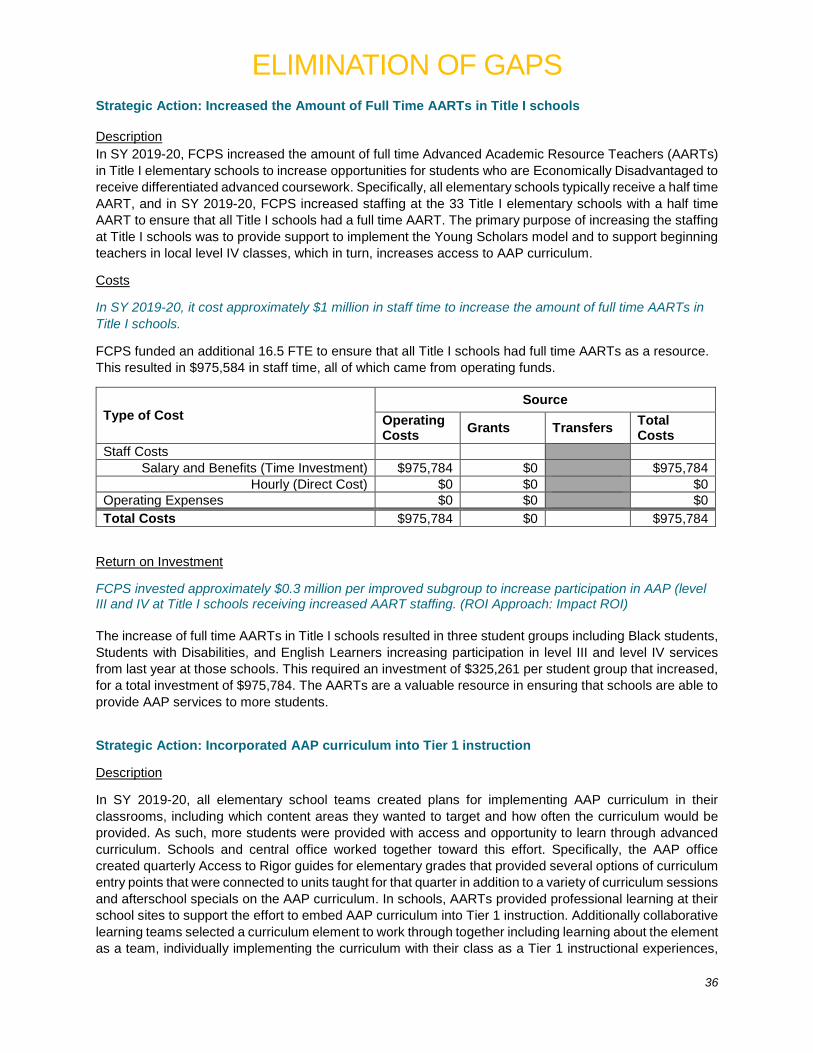
ELIMINATION OF GAPS
36
Strategic Action: Increased the Amount of Full Time AARTs in Title I schools Description In SY 2019-20, FCPS increased the amount of full time Advanced Academic Resource Teachers (AARTs) in Title I elementary schools to increase opportunities for students who are Economically Disadvantaged to receive differentiated advanced coursework. Specifically, all elementary schools typically receive a half time AART, and in SY 2019-20, FCPS increased staffing at the 33 Title I elementary schools with a half time AART to ensure that all Title I schools had a full time AART. The primary purpose of increasing the staffing at Title I schools was to provide support to implement the Young Scholars model and to support beginning teachers in local level IV classes, which in turn, increases access to AAP curriculum.
Costs
In SY 2019-20, it cost approximately $1 million in staff time to increase the amount of full time AARTs in Title I schools.
FCPS funded an additional 16.5 FTE to ensure that all Title I schools had full time AARTs as a resource. This resulted in $975,584 in staff time, all of which came from operating funds.
Type of Cost Source
Operating Costs Grants Transfers Total
Costs Staff Costs
Salary and Benefits (Time Investment) $975,784 $0 $975,784 Hourly (Direct Cost) $0 $0 $0
Operating Expenses $0 $0 $0 Total Costs $975,784 $0 $975,784
Return on Investment
FCPS invested approximately $0.3 million per improved subgroup to increase participation in AAP (level III and IV at Title I schools receiving increased AART staffing. (ROI Approach: Impact ROI) The increase of full time AARTs in Title I schools resulted in three student groups including Black students, Students with Disabilities, and English Learners increasing participation in level III and level IV services from last year at those schools. This required an investment of $325,261 per student group that increased, for a total investment of $975,784. The AARTs are a valuable resource in ensuring that schools are able to provide AAP services to more students.
Strategic Action: Incorporated AAP curriculum into Tier 1 instruction
Description
In SY 2019-20, all elementary school teams created plans for implementing AAP curriculum in their classrooms, including which content areas they wanted to target and how often the curriculum would be provided. As such, more students were provided with access and opportunity to learn through advanced curriculum. Schools and central office worked together toward this effort. Specifically, the AAP office created quarterly Access to Rigor guides for elementary grades that provided several options of curriculum entry points that were connected to units taught for that quarter in addition to a variety of curriculum sessions and afterschool specials on the AAP curriculum. In schools, AARTs provided professional learning at their school sites to support the effort to embed AAP curriculum into Tier 1 instruction. Additionally collaborative learning teams selected a curriculum element to work through together including learning about the element as a team, individually implementing the curriculum with their class as a Tier 1 instructional experiences,
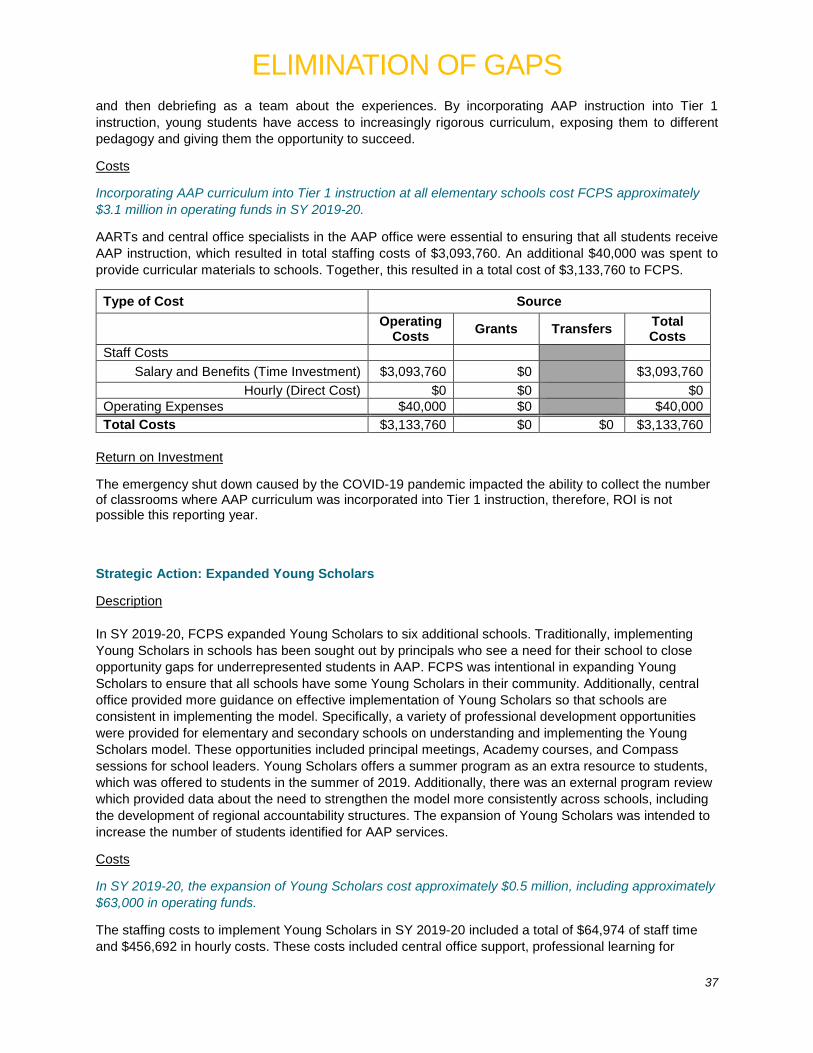
ELIMINATION OF GAPS
37
and then debriefing as a team about the experiences. By incorporating AAP instruction into Tier 1 instruction, young students have access to increasingly rigorous curriculum, exposing them to different pedagogy and giving them the opportunity to succeed.
Costs
Incorporating AAP curriculum into Tier 1 instruction at all elementary schools cost FCPS approximately $3.1 million in operating funds in SY 2019-20.
AARTs and central office specialists in the AAP office were essential to ensuring that all students receive AAP instruction, which resulted in total staffing costs of $3,093,760. An additional $40,000 was spent to provide curricular materials to schools. Together, this resulted in a total cost of $3,133,760 to FCPS.
Type of Cost Source
Operating Costs Grants Transfers Total
Costs Staff Costs
Salary and Benefits (Time Investment) $3,093,760 $0 $3,093,760 Hourly (Direct Cost) $0 $0 $0
Operating Expenses $40,000 $0 $40,000 Total Costs $3,133,760 $0 $0 $3,133,760
Return on Investment
The emergency shut down caused by the COVID-19 pandemic impacted the ability to collect the number of classrooms where AAP curriculum was incorporated into Tier 1 instruction, therefore, ROI is not possible this reporting year.
Strategic Action: Expanded Young Scholars
Description In SY 2019-20, FCPS expanded Young Scholars to six additional schools. Traditionally, implementing Young Scholars in schools has been sought out by principals who see a need for their school to close opportunity gaps for underrepresented students in AAP. FCPS was intentional in expanding Young Scholars to ensure that all schools have some Young Scholars in their community. Additionally, central office provided more guidance on effective implementation of Young Scholars so that schools are consistent in implementing the model. Specifically, a variety of professional development opportunities were provided for elementary and secondary schools on understanding and implementing the Young Scholars model. These opportunities included principal meetings, Academy courses, and Compass sessions for school leaders. Young Scholars offers a summer program as an extra resource to students, which was offered to students in the summer of 2019. Additionally, there was an external program review which provided data about the need to strengthen the model more consistently across schools, including the development of regional accountability structures. The expansion of Young Scholars was intended to increase the number of students identified for AAP services.
Costs
In SY 2019-20, the expansion of Young Scholars cost approximately $0.5 million, including approximately $63,000 in operating funds.
The staffing costs to implement Young Scholars in SY 2019-20 included a total of $64,974 of staff time and $456,692 in hourly costs. These costs included central office support, professional learning for
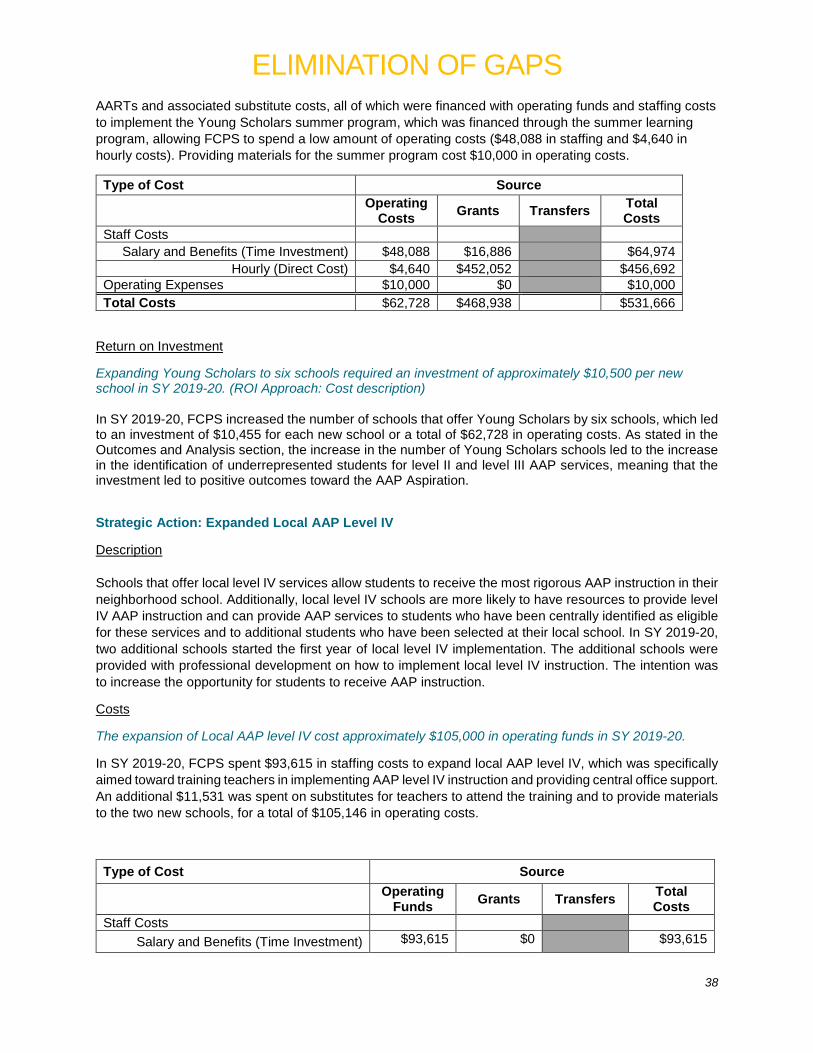
ELIMINATION OF GAPS
38
AARTs and associated substitute costs, all of which were financed with operating funds and staffing costs to implement the Young Scholars summer program, which was financed through the summer learning program, allowing FCPS to spend a low amount of operating costs ($48,088 in staffing and $4,640 in hourly costs). Providing materials for the summer program cost $10,000 in operating costs.
Type of Cost Source
Operating Costs Grants Transfers Total
Costs Staff Costs
Salary and Benefits (Time Investment) $48,088 $16,886 $64,974 Hourly (Direct Cost) $4,640 $452,052 $456,692
Operating Expenses $10,000 $0 $10,000 Total Costs $62,728 $468,938 $531,666
Return on Investment
Expanding Young Scholars to six schools required an investment of approximately $10,500 per new school in SY 2019-20. (ROI Approach: Cost description) In SY 2019-20, FCPS increased the number of schools that offer Young Scholars by six schools, which led to an investment of $10,455 for each new school or a total of $62,728 in operating costs. As stated in the Outcomes and Analysis section, the increase in the number of Young Scholars schools led to the increase in the identification of underrepresented students for level II and level III AAP services, meaning that the investment led to positive outcomes toward the AAP Aspiration.
Strategic Action: Expanded Local AAP Level IV
Description Schools that offer local level IV services allow students to receive the most rigorous AAP instruction in their neighborhood school. Additionally, local level IV schools are more likely to have resources to provide level IV AAP instruction and can provide AAP services to students who have been centrally identified as eligible for these services and to additional students who have been selected at their local school. In SY 2019-20, two additional schools started the first year of local level IV implementation. The additional schools were provided with professional development on how to implement local level IV instruction. The intention was to increase the opportunity for students to receive AAP instruction.
Costs
The expansion of Local AAP level IV cost approximately $105,000 in operating funds in SY 2019-20.
In SY 2019-20, FCPS spent $93,615 in staffing costs to expand local AAP level IV, which was specifically aimed toward training teachers in implementing AAP level IV instruction and providing central office support. An additional $11,531 was spent on substitutes for teachers to attend the training and to provide materials to the two new schools, for a total of $105,146 in operating costs.
Type of Cost Source
Operating Funds Grants Transfers Total
Costs Staff Costs
Salary and Benefits (Time Investment) $93,615 $0
$93,615
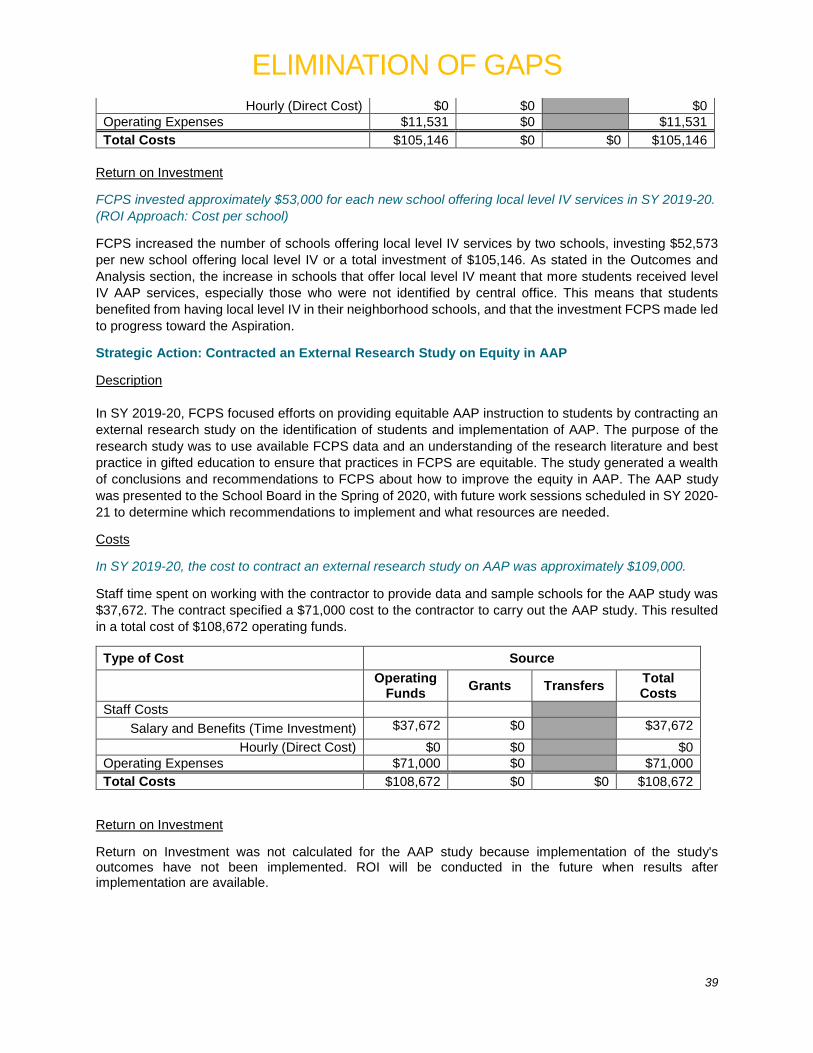
ELIMINATION OF GAPS
39
Hourly (Direct Cost) $0 $0
$0 Operating Expenses $11,531 $0
$11,531
Total Costs $105,146 $0 $0 $105,146 Return on Investment
FCPS invested approximately $53,000 for each new school offering local level IV services in SY 2019-20. (ROI Approach: Cost per school)
FCPS increased the number of schools offering local level IV services by two schools, investing $52,573 per new school offering local level IV or a total investment of $105,146. As stated in the Outcomes and Analysis section, the increase in schools that offer local level IV meant that more students received level IV AAP services, especially those who were not identified by central office. This means that students benefited from having local level IV in their neighborhood schools, and that the investment FCPS made led to progress toward the Aspiration.
Strategic Action: Contracted an External Research Study on Equity in AAP
Description In SY 2019-20, FCPS focused efforts on providing equitable AAP instruction to students by contracting an external research study on the identification of students and implementation of AAP. The purpose of the research study was to use available FCPS data and an understanding of the research literature and best practice in gifted education to ensure that practices in FCPS are equitable. The study generated a wealth of conclusions and recommendations to FCPS about how to improve the equity in AAP. The AAP study was presented to the School Board in the Spring of 2020, with future work sessions scheduled in SY 2020-21 to determine which recommendations to implement and what resources are needed.
Costs
In SY 2019-20, the cost to contract an external research study on AAP was approximately $109,000.
Staff time spent on working with the contractor to provide data and sample schools for the AAP study was $37,672. The contract specified a $71,000 cost to the contractor to carry out the AAP study. This resulted in a total cost of $108,672 operating funds.
Type of Cost Source
Operating Funds Grants Transfers Total
Costs Staff Costs
Salary and Benefits (Time Investment) $37,672 $0
$37,672 Hourly (Direct Cost) $0 $0
$0
Operating Expenses $71,000 $0
$71,000 Total Costs $108,672 $0 $0 $108,672
Return on Investment
Return on Investment was not calculated for the AAP study because implementation of the study's outcomes have not been implemented. ROI will be conducted in the future when results after implementation are available.
ELIMINATION OF GAPS
40
Conclusions FCPS efforts have led to greater participation in Advanced Academic Programs (AAP) across student groups, however gaps still exist, meaning that FCPS did not achieve its Aspiration in closing gaps in AAP participation. Additionally, FCPS did not meet its goal that all elementary schools would offer the Young Scholars Program and Local Level IV AAP services. The number of classrooms that offer AAP curriculum were also unable to be calculated. As such, FCPS did not achieve its implementation goals for the AAP Aspiration, which could have contributed to gaps in participation. Specifically, only two student groups (White and Asian) met or exceed the performance target in SY 2019-20. These are the same student groups that the AAP study found were more advantaged because of parent involvement and potential implicit biases from teachers. One particular group that showed concerning performance were English Learner students. That is, only 2 percent of English Learner students participated in AAP in SY 2019-20. FCPS should consider examining why English Learner student participation is so low in AAP. The AAP study showed that the GBRS, or teacher assessment of students, had greater weight in determining eligibility for AAP services, which could explain some of the lower participation for English Learners if teachers have difficulty observing their ability to engage in gifted education while simultaneously focusing on helping them navigate standard curriculum taught in a language that is not their home language.
FCPS did increase participation for all student groups from the baseline, indicating that efforts taken have made a difference in participation rates. Specifically, offering Young Scholars and Local Level IV increased the number of students who were not eligible for level IV services, but still received those services. Additionally, with increased training for AARTs to facilitate embedding AAP curriculum into Tier 1 instruction, FCPS should continue to see increases in students who have experienced more rigorous curriculum. Finally, FCPS should see greater equity in AAP participation once implementation of recommendations from the AAP study occur in SY 2021-22. Equity in AAP has been an interest of FCPS for many years, and a focus needs to be on providing all students with curriculum that is appropriate based on their aptitude. If FCPS continues to prioritize equity in AAP participation and performance, additional efforts beyond what is currently offered need to take place around increasing participation from non-White and non-Asian student groups, and especially around increasing participation from English Learner students.
Goal Champion Response to Conclusions Somewhat agree. With dedicated resources and efforts in expanding the number of schools offering Young Scholars and local level IV instruction in SY 2019-20, FCPS has successfully increased opportunities for more students to receive rigorous instruction. While targets were not met, progress has occurred. Though student achievement results for many of our subgroups including English Learners, Hispanic, Economically Disadvantaged, and Students with Disabilities, are below the target, there are “bright spots” at the school level. School level results reveal several schools that are making growth with these subgroups and these numbers provide insights in scalable best practices at the division level. Increasing students from traditionally underrepresented groups in AAP participation stays as the center of our work in addressing equitable participation. In October 2020, staff presented the Board with specific strategies for increasing equity of access and opportunity to AAP.
ELIMINATION OF GAPS
41
Aspiration: Participation and performance rates will be similarly high across student groups in advanced coursework SY 2019-20 Outcomes and Analysis There are six metrics measuring the Aspiration “Participation and performance rates will be similarly high across student groups in advanced coursework.” Key metrics, which provide data central to determining progress toward the Desired Outcome, are included below. Additional metrics are available in Appendix C.
The following key metrics are presented below: • Percent of students who participate in Algebra I by 8th grade • Percent of students who participate in honors courses (7th to 12th grade) • Percent of students who participate in Advanced Placement (AP), International Baccalaureate (IB),
or Dual Enrollment (DE) courses by end of high school
The following additional metrics can be found in Appendix C: • Percent of students who demonstrate proficiency (pass course and Algebra 1 SOL) in Algebra 1
by eighth grade • Percent of students who demonstrate proficiency (pass course) in one or more honors courses
(Grades 7 to 12) • Percent of students who demonstrate proficiency (pass course) in at least one Advanced
Placement (AP), International Baccalaureate (IB), or Dual Enrollment course by the end of high school
• Percent of students who earn a passing score on one or more AP or IB exams by the end of high school
Metric Data In SY 2019-20, meaningful progress was not made toward equity of Algebra I participation by 8th grade, with many student groups’ participation falling below the baseline. FCPS is not closer to making progress toward the Aspiration that participation in Algebra I by 8th grade would be comparable across student groups. In fact, only two student groups increased participation in Algebra I including Asian and Economically Disadvantaged student groups, but these increases were minimal. All other student groups either stayed the same or performed worse than the baseline. This means that overall, the percent of students taking Algebra I by 8th grade was lower in SY 2019-20 compared to previous years. If equitable participation in Algebra I remains a priority for FCPS, efforts to increase participation for those student groups who are not already meeting the target will be necessary (i.e. Black, Hispanic, Economically Disadvantaged, English Learner, and Students with Disabilities student groups).
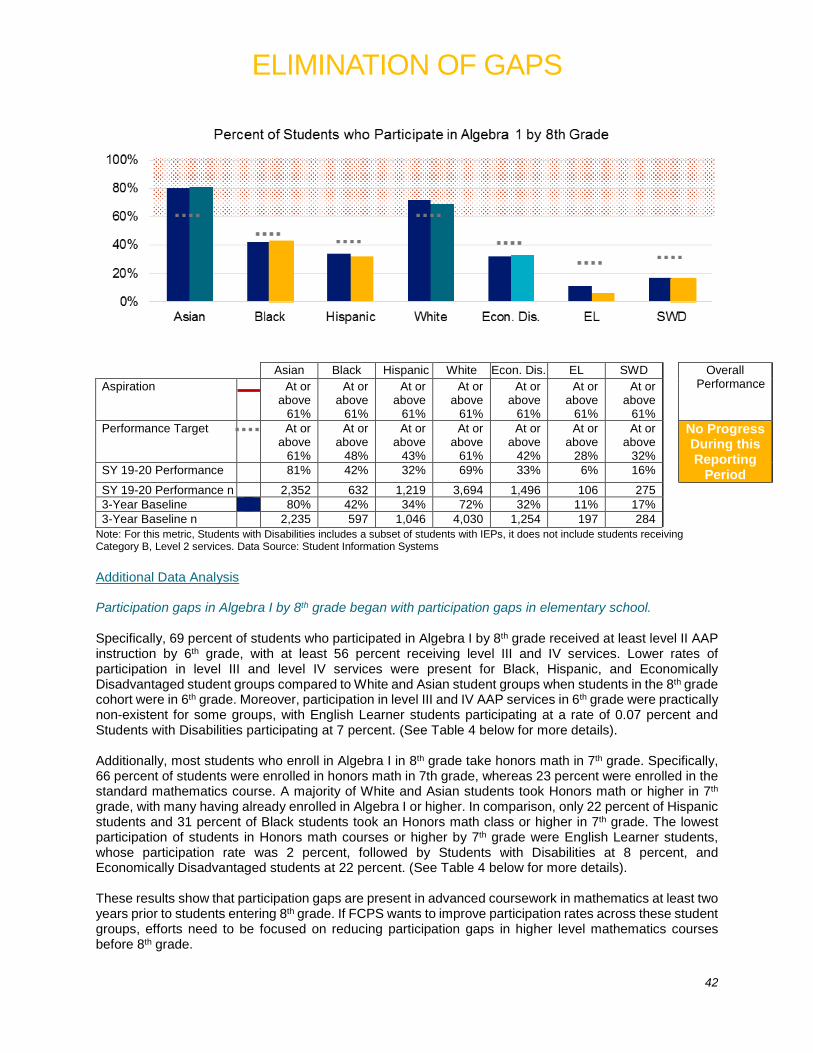
ELIMINATION OF GAPS
42
Asian Black Hispanic White Econ. Dis. EL SWD Overall
Performance Aspiration At or above
61%
At or above
61%
At or above
61%
At or above
61%
At or above
61%
At or above
61%
At or above
61% Performance Target At or
above 61%
At or above
48%
At or above
43%
At or above
61%
At or above
42%
At or above
28%
At or above
32%
No Progress During this Reporting
Period SY 19-20 Performance 81% 42% 32% 69% 33% 6% 16%
SY 19-20 Performance n 2,352 632 1,219 3,694 1,496 106 275 3-Year Baseline 80% 42% 34% 72% 32% 11% 17% 3-Year Baseline n 2,235 597 1,046 4,030 1,254 197 284
Note: For this metric, Students with Disabilities includes a subset of students with IEPs, it does not include students receiving Category B, Level 2 services. Data Source: Student Information Systems Additional Data Analysis Participation gaps in Algebra I by 8th grade began with participation gaps in elementary school. Specifically, 69 percent of students who participated in Algebra I by 8th grade received at least level II AAP instruction by 6th grade, with at least 56 percent receiving level III and IV services. Lower rates of participation in level III and level IV services were present for Black, Hispanic, and Economically Disadvantaged student groups compared to White and Asian student groups when students in the 8th grade cohort were in 6th grade. Moreover, participation in level III and IV AAP services in 6th grade were practically non-existent for some groups, with English Learner students participating at a rate of 0.07 percent and Students with Disabilities participating at 7 percent. (See Table 4 below for more details). Additionally, most students who enroll in Algebra I in 8th grade take honors math in 7th grade. Specifically, 66 percent of students were enrolled in honors math in 7th grade, whereas 23 percent were enrolled in the standard mathematics course. A majority of White and Asian students took Honors math or higher in 7th grade, with many having already enrolled in Algebra I or higher. In comparison, only 22 percent of Hispanic students and 31 percent of Black students took an Honors math class or higher in 7th grade. The lowest participation of students in Honors math courses or higher by 7th grade were English Learner students, whose participation rate was 2 percent, followed by Students with Disabilities at 8 percent, and Economically Disadvantaged students at 22 percent. (See Table 4 below for more details). These results show that participation gaps are present in advanced coursework in mathematics at least two years prior to students entering 8th grade. If FCPS wants to improve participation rates across these student groups, efforts need to be focused on reducing participation gaps in higher level mathematics courses before 8th grade.
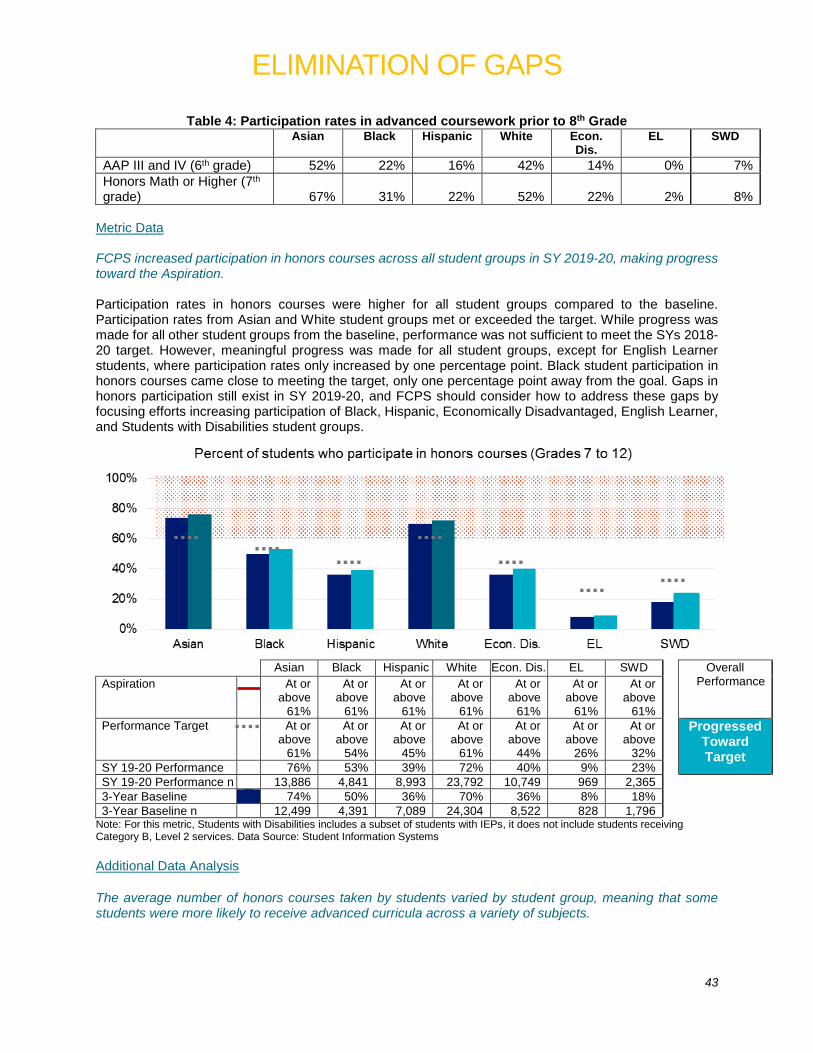
ELIMINATION OF GAPS
43
Table 4: Participation rates in advanced coursework prior to 8th Grade Asian Black Hispanic White Econ.
Dis. EL SWD
AAP III and IV (6th grade) 52% 22% 16% 42% 14% 0% 7% Honors Math or Higher (7th grade) 67% 31% 22% 52% 22% 2% 8%
Metric Data FCPS increased participation in honors courses across all student groups in SY 2019-20, making progress toward the Aspiration. Participation rates in honors courses were higher for all student groups compared to the baseline. Participation rates from Asian and White student groups met or exceeded the target. While progress was made for all other student groups from the baseline, performance was not sufficient to meet the SYs 2018-20 target. However, meaningful progress was made for all student groups, except for English Learner students, where participation rates only increased by one percentage point. Black student participation in honors courses came close to meeting the target, only one percentage point away from the goal. Gaps in honors participation still exist in SY 2019-20, and FCPS should consider how to address these gaps by focusing efforts increasing participation of Black, Hispanic, Economically Disadvantaged, English Learner, and Students with Disabilities student groups.
Asian Black Hispanic White Econ. Dis. EL SWD Overall
Performance Aspiration At or above
61%
At or above
61%
At or above
61%
At or above
61%
At or above
61%
At or above
61%
At or above
61% Performance Target At or
above 61%
At or above
54%
At or above
45%
At or above
61%
At or above
44%
At or above
26%
At or above
32%
Progressed Toward Target
SY 19-20 Performance 76% 53% 39% 72% 40% 9% 23% SY 19-20 Performance n 13,886 4,841 8,993 23,792 10,749 969 2,365 3-Year Baseline 74% 50% 36% 70% 36% 8% 18% 3-Year Baseline n 12,499 4,391 7,089 24,304 8,522 828 1,796
Note: For this metric, Students with Disabilities includes a subset of students with IEPs, it does not include students receiving Category B, Level 2 services. Data Source: Student Information Systems Additional Data Analysis The average number of honors courses taken by students varied by student group, meaning that some students were more likely to receive advanced curricula across a variety of subjects.
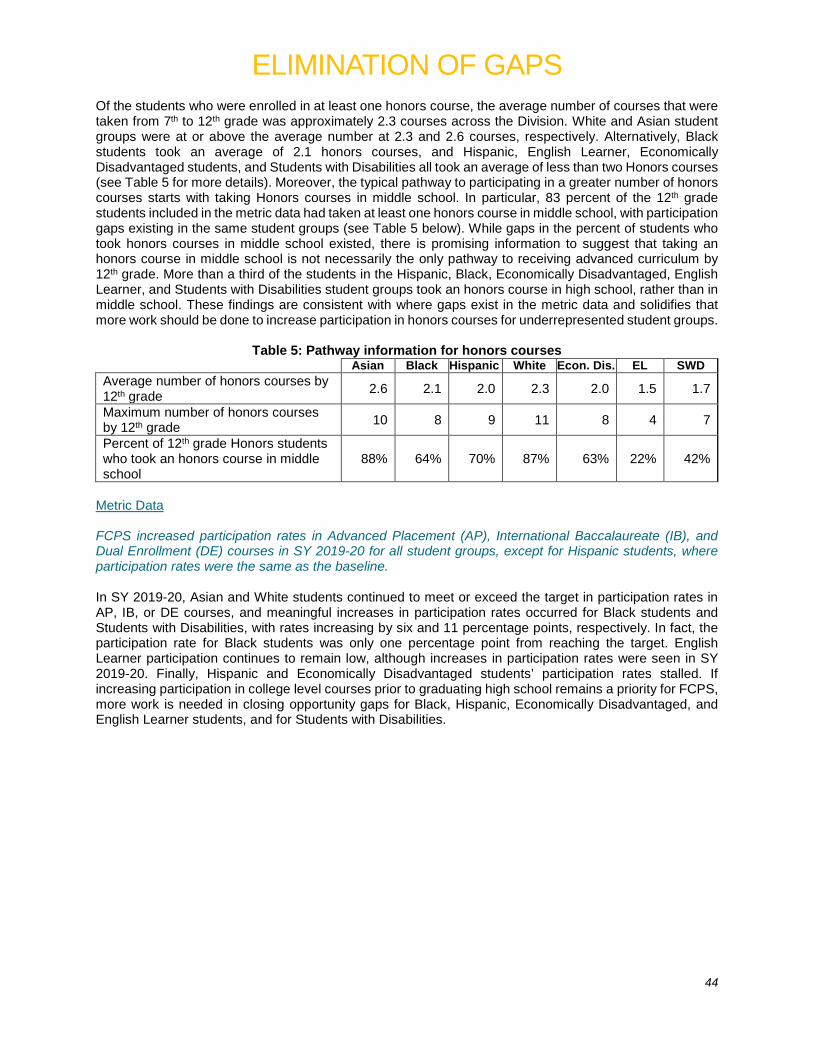
ELIMINATION OF GAPS
44
Of the students who were enrolled in at least one honors course, the average number of courses that were taken from 7th to 12th grade was approximately 2.3 courses across the Division. White and Asian student groups were at or above the average number at 2.3 and 2.6 courses, respectively. Alternatively, Black students took an average of 2.1 honors courses, and Hispanic, English Learner, Economically Disadvantaged students, and Students with Disabilities all took an average of less than two Honors courses (see Table 5 for more details). Moreover, the typical pathway to participating in a greater number of honors courses starts with taking Honors courses in middle school. In particular, 83 percent of the 12th grade students included in the metric data had taken at least one honors course in middle school, with participation gaps existing in the same student groups (see Table 5 below). While gaps in the percent of students who took honors courses in middle school existed, there is promising information to suggest that taking an honors course in middle school is not necessarily the only pathway to receiving advanced curriculum by 12th grade. More than a third of the students in the Hispanic, Black, Economically Disadvantaged, English Learner, and Students with Disabilities student groups took an honors course in high school, rather than in middle school. These findings are consistent with where gaps exist in the metric data and solidifies that more work should be done to increase participation in honors courses for underrepresented student groups.
Table 5: Pathway information for honors courses Asian Black Hispanic White Econ. Dis. EL SWD Average number of honors courses by 12th grade 2.6 2.1 2.0 2.3 2.0 1.5 1.7
Maximum number of honors courses by 12th grade 10 8 9 11 8 4 7
Percent of 12th grade Honors students who took an honors course in middle school
88% 64% 70% 87% 63% 22% 42%
Metric Data FCPS increased participation rates in Advanced Placement (AP), International Baccalaureate (IB), and Dual Enrollment (DE) courses in SY 2019-20 for all student groups, except for Hispanic students, where participation rates were the same as the baseline. In SY 2019-20, Asian and White students continued to meet or exceed the target in participation rates in AP, IB, or DE courses, and meaningful increases in participation rates occurred for Black students and Students with Disabilities, with rates increasing by six and 11 percentage points, respectively. In fact, the participation rate for Black students was only one percentage point from reaching the target. English Learner participation continues to remain low, although increases in participation rates were seen in SY 2019-20. Finally, Hispanic and Economically Disadvantaged students’ participation rates stalled. If increasing participation in college level courses prior to graduating high school remains a priority for FCPS, more work is needed in closing opportunity gaps for Black, Hispanic, Economically Disadvantaged, and English Learner students, and for Students with Disabilities.
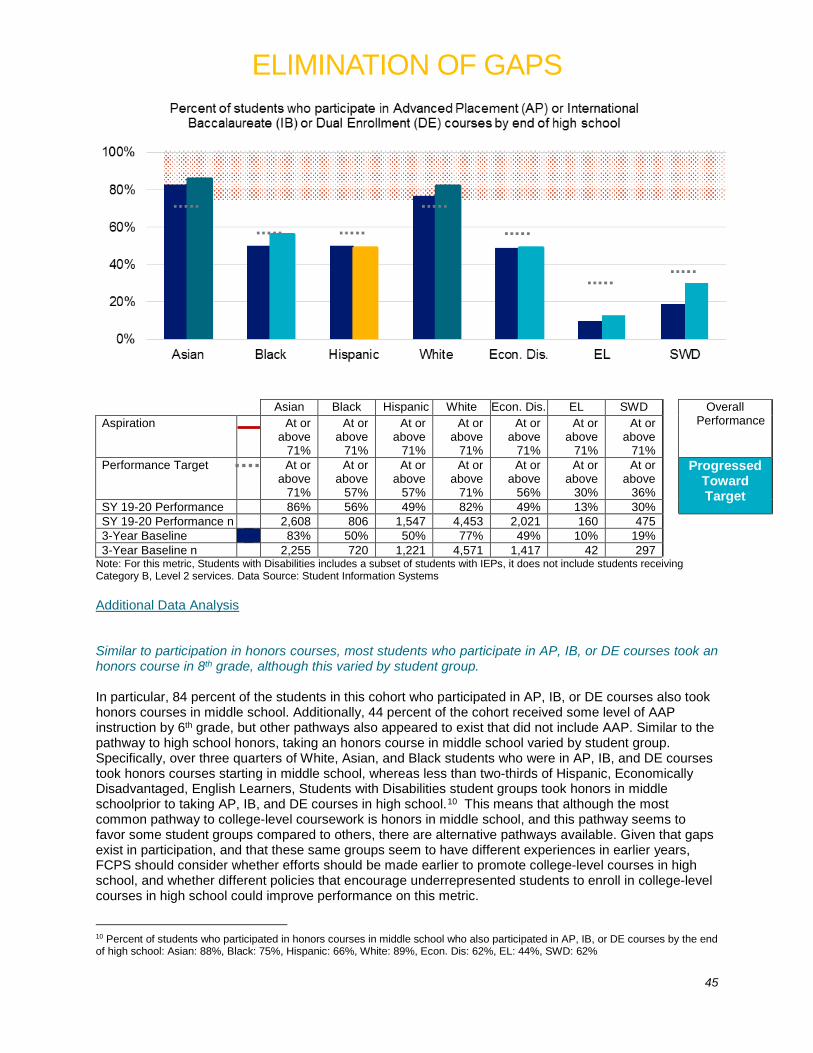
ELIMINATION OF GAPS
45
Asian Black Hispanic White Econ. Dis. EL SWD Overall Performance Aspiration At or
above 71%
At or above
71%
At or above
71%
At or above
71%
At or above
71%
At or above
71%
At or above
71% Performance Target At or
above 71%
At or above
57%
At or above
57%
At or above
71%
At or above
56%
At or above
30%
At or above
36%
Progressed Toward Target
SY 19-20 Performance 86% 56% 49% 82% 49% 13% 30% SY 19-20 Performance n 2,608 806 1,547 4,453 2,021 160 475 3-Year Baseline 83% 50% 50% 77% 49% 10% 19% 3-Year Baseline n 2,255 720 1,221 4,571 1,417 42 297
Note: For this metric, Students with Disabilities includes a subset of students with IEPs, it does not include students receiving Category B, Level 2 services. Data Source: Student Information Systems Additional Data Analysis Similar to participation in honors courses, most students who participate in AP, IB, or DE courses took an honors course in 8th grade, although this varied by student group. In particular, 84 percent of the students in this cohort who participated in AP, IB, or DE courses also took honors courses in middle school. Additionally, 44 percent of the cohort received some level of AAP instruction by 6th grade, but other pathways also appeared to exist that did not include AAP. Similar to the pathway to high school honors, taking an honors course in middle school varied by student group. Specifically, over three quarters of White, Asian, and Black students who were in AP, IB, and DE courses took honors courses starting in middle school, whereas less than two-thirds of Hispanic, Economically Disadvantaged, English Learners, Students with Disabilities student groups took honors in middle schoolprior to taking AP, IB, and DE courses in high school.10 This means that although the most common pathway to college-level coursework is honors in middle school, and this pathway seems to favor some student groups compared to others, there are alternative pathways available. Given that gaps exist in participation, and that these same groups seem to have different experiences in earlier years, FCPS should consider whether efforts should be made earlier to promote college-level courses in high school, and whether different policies that encourage underrepresented students to enroll in college-level courses in high school could improve performance on this metric.
10 Percent of students who participated in honors courses in middle school who also participated in AP, IB, or DE courses by the end of high school: Asian: 88%, Black: 75%, Hispanic: 66%, White: 89%, Econ. Dis: 62%, EL: 44%, SWD: 62%
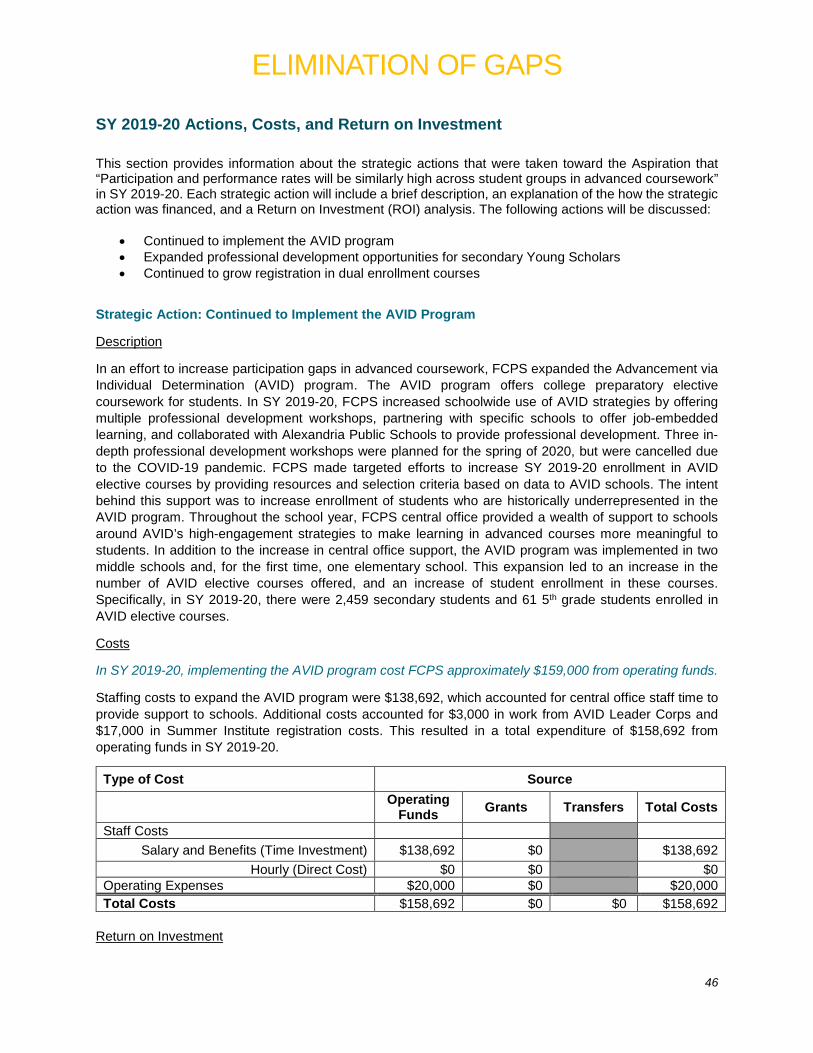
ELIMINATION OF GAPS
46
SY 2019-20 Actions, Costs, and Return on Investment This section provides information about the strategic actions that were taken toward the Aspiration that “Participation and performance rates will be similarly high across student groups in advanced coursework” in SY 2019-20. Each strategic action will include a brief description, an explanation of the how the strategic action was financed, and a Return on Investment (ROI) analysis. The following actions will be discussed:
• Continued to implement the AVID program • Expanded professional development opportunities for secondary Young Scholars • Continued to grow registration in dual enrollment courses
Strategic Action: Continued to Implement the AVID Program
Description
In an effort to increase participation gaps in advanced coursework, FCPS expanded the Advancement via Individual Determination (AVID) program. The AVID program offers college preparatory elective coursework for students. In SY 2019-20, FCPS increased schoolwide use of AVID strategies by offering multiple professional development workshops, partnering with specific schools to offer job-embedded learning, and collaborated with Alexandria Public Schools to provide professional development. Three in-depth professional development workshops were planned for the spring of 2020, but were cancelled due to the COVID-19 pandemic. FCPS made targeted efforts to increase SY 2019-20 enrollment in AVID elective courses by providing resources and selection criteria based on data to AVID schools. The intent behind this support was to increase enrollment of students who are historically underrepresented in the AVID program. Throughout the school year, FCPS central office provided a wealth of support to schools around AVID’s high-engagement strategies to make learning in advanced courses more meaningful to students. In addition to the increase in central office support, the AVID program was implemented in two middle schools and, for the first time, one elementary school. This expansion led to an increase in the number of AVID elective courses offered, and an increase of student enrollment in these courses. Specifically, in SY 2019-20, there were 2,459 secondary students and 61 5th grade students enrolled in AVID elective courses.
Costs
In SY 2019-20, implementing the AVID program cost FCPS approximately $159,000 from operating funds.
Staffing costs to expand the AVID program were $138,692, which accounted for central office staff time to provide support to schools. Additional costs accounted for $3,000 in work from AVID Leader Corps and $17,000 in Summer Institute registration costs. This resulted in a total expenditure of $158,692 from operating funds in SY 2019-20.
Type of Cost Source
Operating Funds Grants Transfers Total Costs
Staff Costs Salary and Benefits (Time Investment) $138,692 $0 $138,692
Hourly (Direct Cost) $0 $0 $0 Operating Expenses $20,000 $0 $20,000 Total Costs $158,692 $0 $0 $158,692
Return on Investment
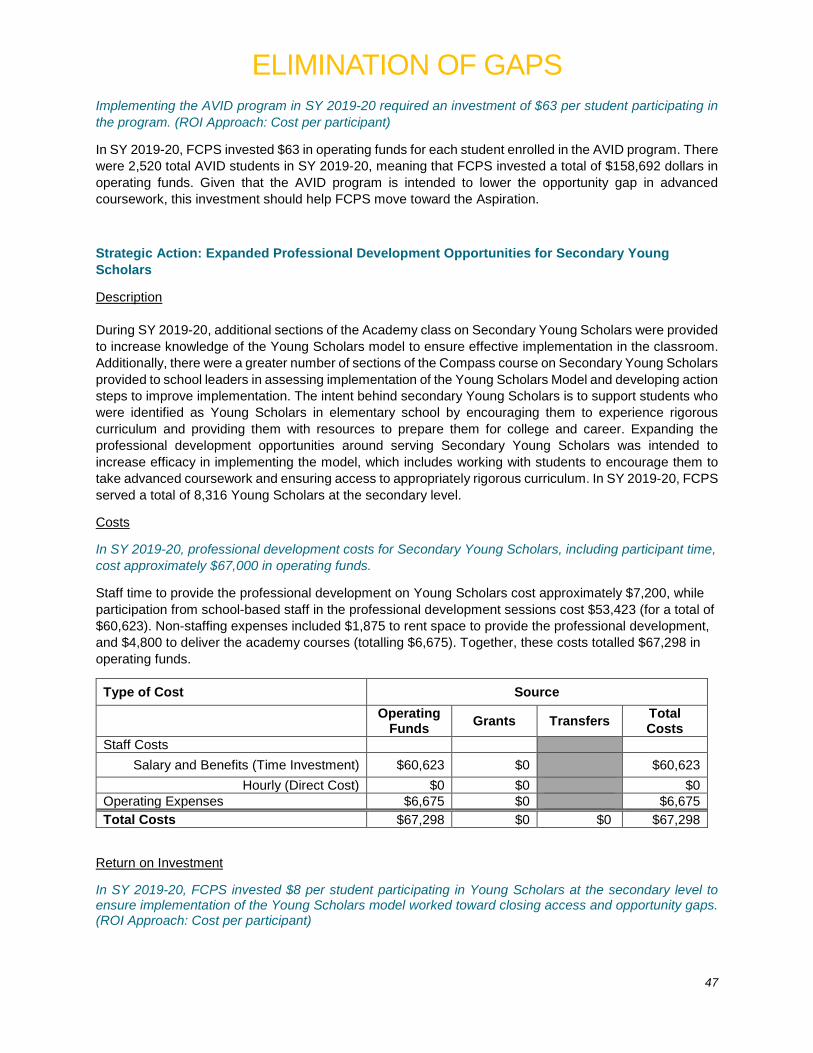
ELIMINATION OF GAPS
47
Implementing the AVID program in SY 2019-20 required an investment of $63 per student participating in the program. (ROI Approach: Cost per participant)
In SY 2019-20, FCPS invested $63 in operating funds for each student enrolled in the AVID program. There were 2,520 total AVID students in SY 2019-20, meaning that FCPS invested a total of $158,692 dollars in operating funds. Given that the AVID program is intended to lower the opportunity gap in advanced coursework, this investment should help FCPS move toward the Aspiration.
Strategic Action: Expanded Professional Development Opportunities for Secondary Young Scholars
Description During SY 2019-20, additional sections of the Academy class on Secondary Young Scholars were provided to increase knowledge of the Young Scholars model to ensure effective implementation in the classroom. Additionally, there were a greater number of sections of the Compass course on Secondary Young Scholars provided to school leaders in assessing implementation of the Young Scholars Model and developing action steps to improve implementation. The intent behind secondary Young Scholars is to support students who were identified as Young Scholars in elementary school by encouraging them to experience rigorous curriculum and providing them with resources to prepare them for college and career. Expanding the professional development opportunities around serving Secondary Young Scholars was intended to increase efficacy in implementing the model, which includes working with students to encourage them to take advanced coursework and ensuring access to appropriately rigorous curriculum. In SY 2019-20, FCPS served a total of 8,316 Young Scholars at the secondary level.
Costs
In SY 2019-20, professional development costs for Secondary Young Scholars, including participant time, cost approximately $67,000 in operating funds.
Staff time to provide the professional development on Young Scholars cost approximately $7,200, while participation from school-based staff in the professional development sessions cost $53,423 (for a total of $60,623). Non-staffing expenses included $1,875 to rent space to provide the professional development, and $4,800 to deliver the academy courses (totalling $6,675). Together, these costs totalled $67,298 in operating funds.
Type of Cost Source
Operating Funds Grants Transfers Total
Costs Staff Costs
Salary and Benefits (Time Investment) $60,623 $0 $60,623 Hourly (Direct Cost) $0 $0 $0
Operating Expenses $6,675 $0 $6,675 Total Costs $67,298 $0 $0 $67,298
Return on Investment
In SY 2019-20, FCPS invested $8 per student participating in Young Scholars at the secondary level to ensure implementation of the Young Scholars model worked toward closing access and opportunity gaps. (ROI Approach: Cost per participant)
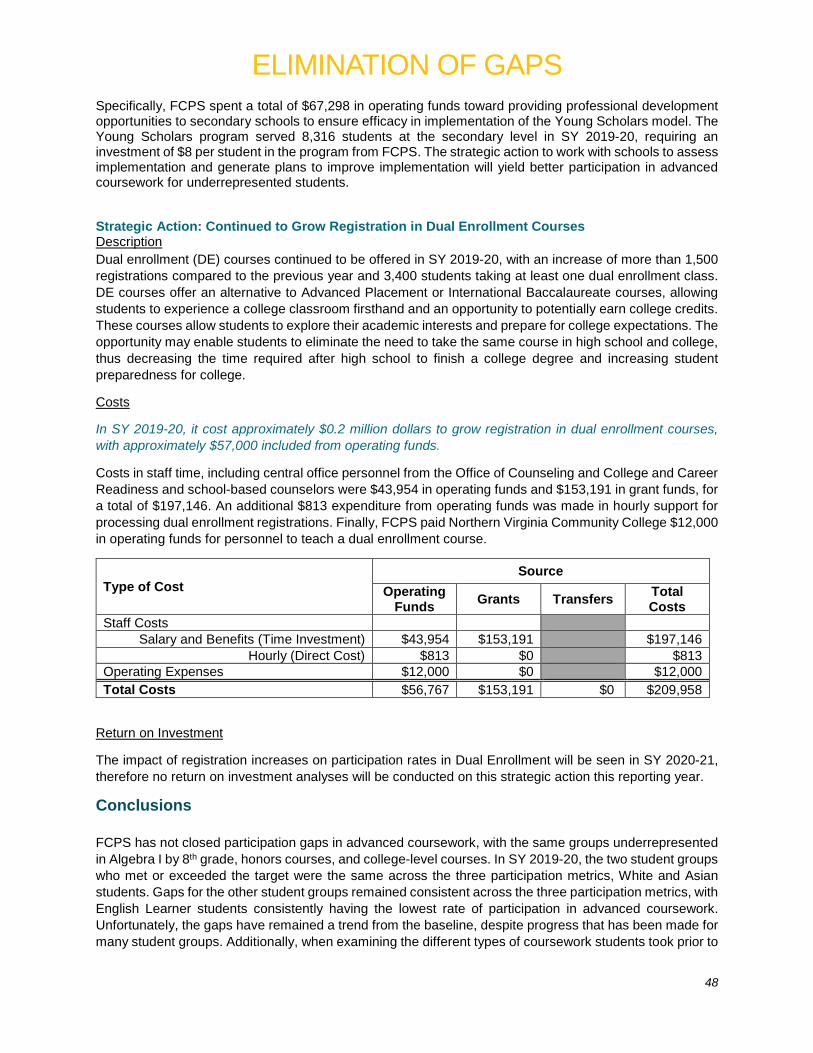
ELIMINATION OF GAPS
48
Specifically, FCPS spent a total of $67,298 in operating funds toward providing professional development opportunities to secondary schools to ensure efficacy in implementation of the Young Scholars model. The Young Scholars program served 8,316 students at the secondary level in SY 2019-20, requiring an investment of $8 per student in the program from FCPS. The strategic action to work with schools to assess implementation and generate plans to improve implementation will yield better participation in advanced coursework for underrepresented students.
Strategic Action: Continued to Grow Registration in Dual Enrollment Courses Description Dual enrollment (DE) courses continued to be offered in SY 2019-20, with an increase of more than 1,500 registrations compared to the previous year and 3,400 students taking at least one dual enrollment class. DE courses offer an alternative to Advanced Placement or International Baccalaureate courses, allowing students to experience a college classroom firsthand and an opportunity to potentially earn college credits. These courses allow students to explore their academic interests and prepare for college expectations. The opportunity may enable students to eliminate the need to take the same course in high school and college, thus decreasing the time required after high school to finish a college degree and increasing student preparedness for college.
Costs
In SY 2019-20, it cost approximately $0.2 million dollars to grow registration in dual enrollment courses, with approximately $57,000 included from operating funds.
Costs in staff time, including central office personnel from the Office of Counseling and College and Career Readiness and school-based counselors were $43,954 in operating funds and $153,191 in grant funds, for a total of $197,146. An additional $813 expenditure from operating funds was made in hourly support for processing dual enrollment registrations. Finally, FCPS paid Northern Virginia Community College $12,000 in operating funds for personnel to teach a dual enrollment course.
Type of Cost Source
Operating Funds Grants Transfers Total
Costs Staff Costs
Salary and Benefits (Time Investment) $43,954 $153,191 $197,146 Hourly (Direct Cost) $813 $0 $813
Operating Expenses $12,000 $0 $12,000 Total Costs $56,767 $153,191 $0 $209,958
Return on Investment
The impact of registration increases on participation rates in Dual Enrollment will be seen in SY 2020-21, therefore no return on investment analyses will be conducted on this strategic action this reporting year.
Conclusions FCPS has not closed participation gaps in advanced coursework, with the same groups underrepresented in Algebra I by 8th grade, honors courses, and college-level courses. In SY 2019-20, the two student groups who met or exceeded the target were the same across the three participation metrics, White and Asian students. Gaps for the other student groups remained consistent across the three participation metrics, with English Learner students consistently having the lowest rate of participation in advanced coursework. Unfortunately, the gaps have remained a trend from the baseline, despite progress that has been made for many student groups. Additionally, when examining the different types of coursework students took prior to
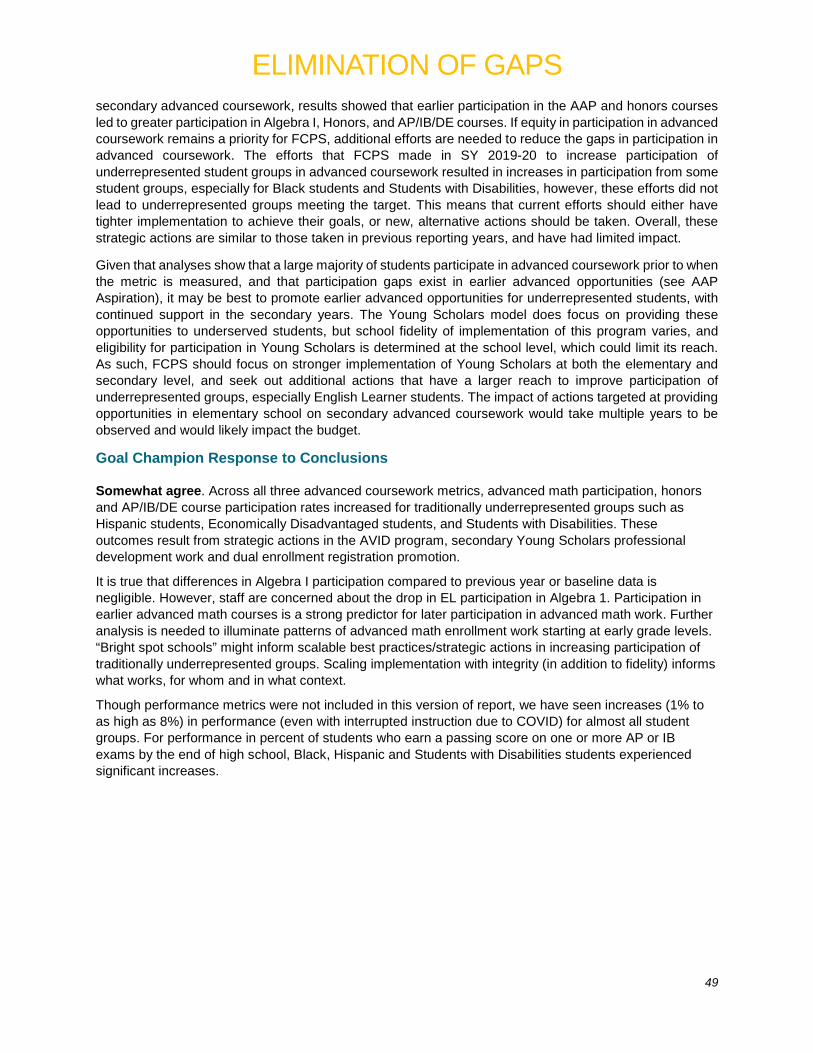
ELIMINATION OF GAPS
49
secondary advanced coursework, results showed that earlier participation in the AAP and honors courses led to greater participation in Algebra I, Honors, and AP/IB/DE courses. If equity in participation in advanced coursework remains a priority for FCPS, additional efforts are needed to reduce the gaps in participation in advanced coursework. The efforts that FCPS made in SY 2019-20 to increase participation of underrepresented student groups in advanced coursework resulted in increases in participation from some student groups, especially for Black students and Students with Disabilities, however, these efforts did not lead to underrepresented groups meeting the target. This means that current efforts should either have tighter implementation to achieve their goals, or new, alternative actions should be taken. Overall, these strategic actions are similar to those taken in previous reporting years, and have had limited impact.
Given that analyses show that a large majority of students participate in advanced coursework prior to when the metric is measured, and that participation gaps exist in earlier advanced opportunities (see AAP Aspiration), it may be best to promote earlier advanced opportunities for underrepresented students, with continued support in the secondary years. The Young Scholars model does focus on providing these opportunities to underserved students, but school fidelity of implementation of this program varies, and eligibility for participation in Young Scholars is determined at the school level, which could limit its reach. As such, FCPS should focus on stronger implementation of Young Scholars at both the elementary and secondary level, and seek out additional actions that have a larger reach to improve participation of underrepresented groups, especially English Learner students. The impact of actions targeted at providing opportunities in elementary school on secondary advanced coursework would take multiple years to be observed and would likely impact the budget.
Goal Champion Response to Conclusions Somewhat agree. Across all three advanced coursework metrics, advanced math participation, honors and AP/IB/DE course participation rates increased for traditionally underrepresented groups such as Hispanic students, Economically Disadvantaged students, and Students with Disabilities. These outcomes result from strategic actions in the AVID program, secondary Young Scholars professional development work and dual enrollment registration promotion.
It is true that differences in Algebra I participation compared to previous year or baseline data is negligible. However, staff are concerned about the drop in EL participation in Algebra 1. Participation in earlier advanced math courses is a strong predictor for later participation in advanced math work. Further analysis is needed to illuminate patterns of advanced math enrollment work starting at early grade levels. “Bright spot schools” might inform scalable best practices/strategic actions in increasing participation of traditionally underrepresented groups. Scaling implementation with integrity (in addition to fidelity) informs what works, for whom and in what context.
Though performance metrics were not included in this version of report, we have seen increases (1% to as high as 8%) in performance (even with interrupted instruction due to COVID) for almost all student groups. For performance in percent of students who earn a passing score on one or more AP or IB exams by the end of high school, Black, Hispanic and Students with Disabilities students experienced significant increases.

ELIMINATION OF GAPS
50
School Board Considerations Strategic Considerations . FCPS should provide additional supports to all schools where reading and mathematics gaps exist to ensure students are provided with every opportunity to succeed. The new Department of School Improvement and Support will expand its supports to all schools, partnering with school administrative teams to identify gaps that exist and provide specific recommendations that can be incorporated in their School Improvement and Innovation Plans. Given the impact of the COVID-19 pandemic on learning, FCPS should follow student progress to determine whether larger gaps are increasing for vulnerable groups of students. Budget Considerations The gaps for English learner students across the metric data, coupled with the findings from a strategic review on English learners that showed underfunding for English learner resources in elementary schools, indicate a need for changes to the staffing formula for ESOL staffing at the elementary level.
FCPS should fund additional AARTs as a resource to schools who want to provide more students with advanced curriculum, especially at the elementary level. Moreover, implementation of the recommendations associated with the AAP study may have budget implications. FCPS should establish long term funding for digital curriculum tools (ST Math, Gizmos, Imagine Learning, Pioneer Valley, Jason Learning) FCPS should establish long term funding for on-demand translations to support written and oral communication with families. Policy FCPS should revise its policies on open enrollment and student participation in advanced coursework in order to provide equitable opportunities for all students. Specifically, FCPS should prioritize aptitude and performance in courses over parent and teacher voice, as both indicators could show bias.
EARLY EDUCATION
51
Aspiration: All future FCPS students will enter kindergarten with the essential skills needed for school success SY19-20 Outcomes and Analysis There is one metric measuring the Aspiration “All future FCPS students will enter kindergarten with the essential skills needed for school success.” Key metrics, which provide data central to determining progress toward the Desired Outcome, are included below.
The following key metrics are presented below: • Percent of students with executive functioning skills at kindergarten entry
Metric Data In SY19-20, the first year of the Child Behavior Rating Scale was administered, providing FCPS with data on kindergarten readiness skills. A majority of FCPS students who entered kindergarten in SY 2019-20 met the standard for executive functioning skills, however gaps in these skills are present. In SY 2019-20, kindergartners were assessed using the Child Behavior Rating Scale (CBRS) to receive initial information about students’ fundamental skills and provide teachers with helpful information for the beginning of the school year. These fundamental skills or executive functioning skills are necessary for students to understand how to self-regulate. Teachers observed students and rated them on their ability to follow and respond to directions, remained organized, concentrate on learning, and attempt challenges. Data show that 76 percent of all kindergartners entered FCPS with these skills in SY 2019-20, however, gaps between student groups are present. FCPS Aspiration is that all students enter kindergarten with tools that they need to be successful and additional efforts will need to be taken to ensure that students are ready for kindergarten. Furthermore, efforts should be concentrated to close gaps in this area, targeting Black, Hispanic, Economically Disadvantaged, English Learner, and Student with Disabilities student groups.
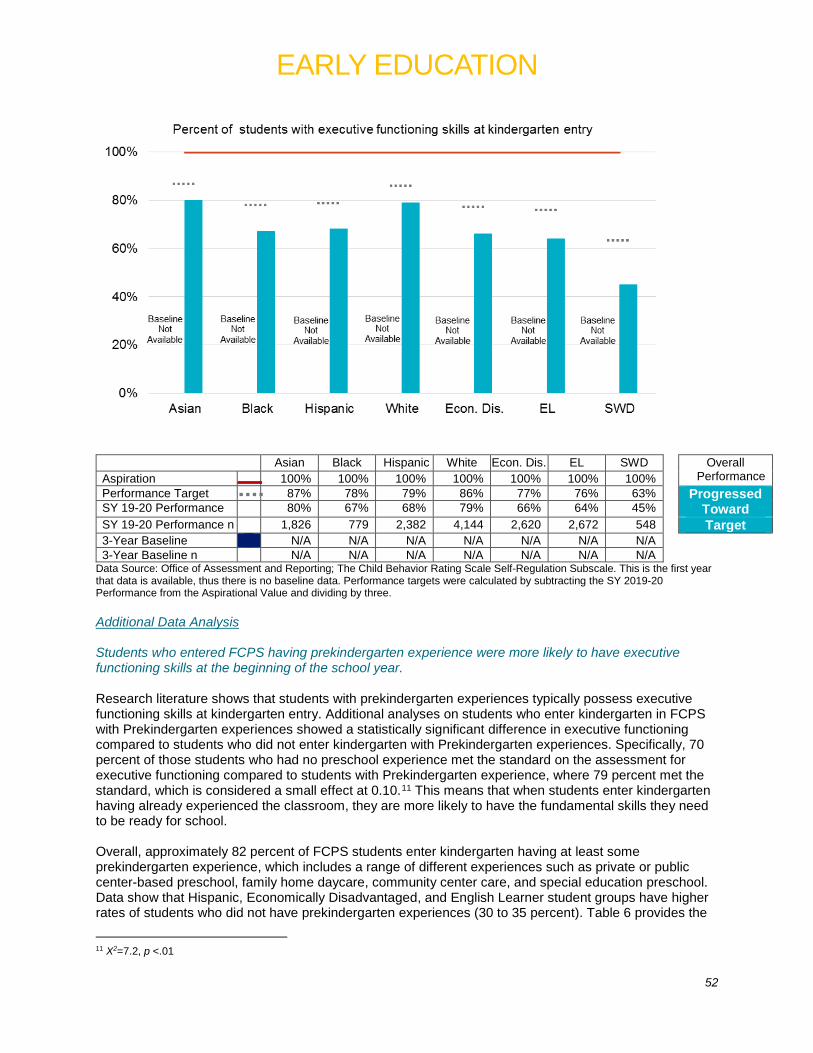
EARLY EDUCATION
52
Asian Black Hispanic White Econ. Dis. EL SWD Overall Performance Aspiration 100% 100% 100% 100% 100% 100% 100%
Performance Target 87% 78% 79% 86% 77% 76% 63% Progressed Toward SY 19-20 Performance 80% 67% 68% 79% 66% 64% 45%
SY 19-20 Performance n 1,826 779 2,382 4,144 2,620 2,672 548 Target 3-Year Baseline N/A N/A N/A N/A N/A N/A N/A 3-Year Baseline n N/A N/A N/A N/A N/A N/A N/A
Data Source: Office of Assessment and Reporting; The Child Behavior Rating Scale Self-Regulation Subscale. This is the first year that data is available, thus there is no baseline data. Performance targets were calculated by subtracting the SY 2019-20 Performance from the Aspirational Value and dividing by three. Additional Data Analysis Students who entered FCPS having prekindergarten experience were more likely to have executive functioning skills at the beginning of the school year. Research literature shows that students with prekindergarten experiences typically possess executive functioning skills at kindergarten entry. Additional analyses on students who enter kindergarten in FCPS with Prekindergarten experiences showed a statistically significant difference in executive functioning compared to students who did not enter kindergarten with Prekindergarten experiences. Specifically, 70 percent of those students who had no preschool experience met the standard on the assessment for executive functioning compared to students with Prekindergarten experience, where 79 percent met the standard, which is considered a small effect at 0.10.11 This means that when students enter kindergarten having already experienced the classroom, they are more likely to have the fundamental skills they need to be ready for school. Overall, approximately 82 percent of FCPS students enter kindergarten having at least some prekindergarten experience, which includes a range of different experiences such as private or public center-based preschool, family home daycare, community center care, and special education preschool. Data show that Hispanic, Economically Disadvantaged, and English Learner student groups have higher rates of students who did not have prekindergarten experiences (30 to 35 percent). Table 6 provides the
11 X2=7.2, p <.01
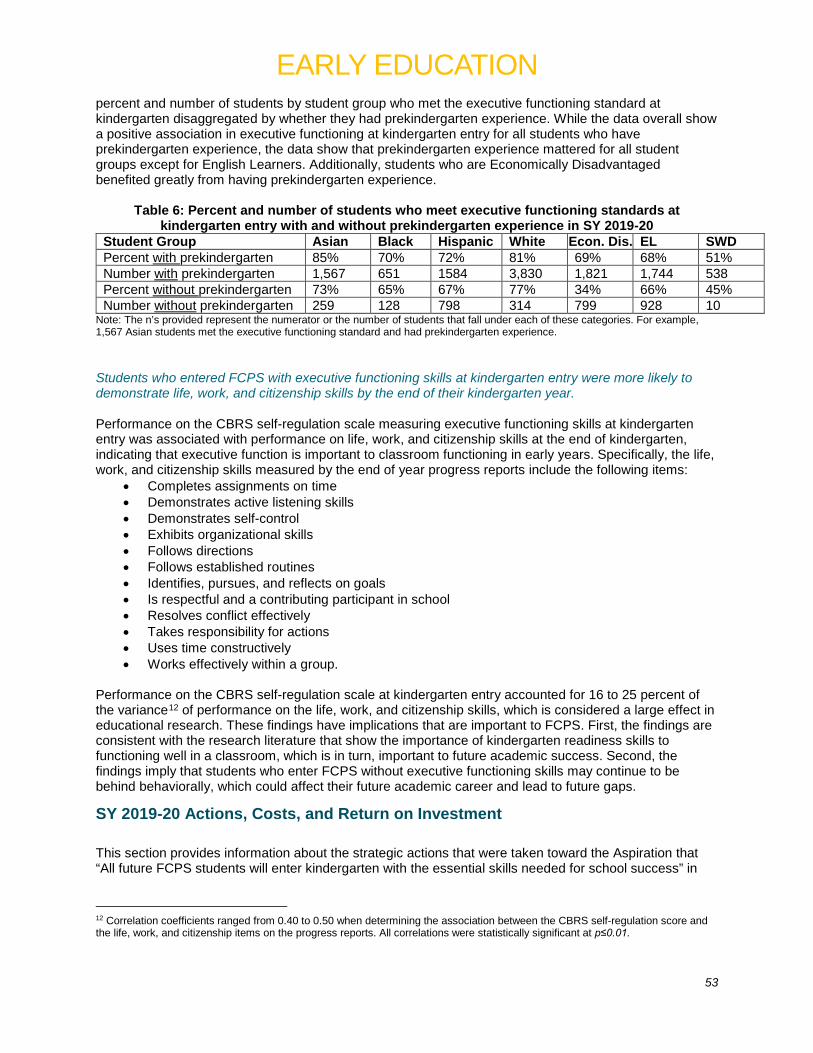
EARLY EDUCATION
53
percent and number of students by student group who met the executive functioning standard at kindergarten disaggregated by whether they had prekindergarten experience. While the data overall show a positive association in executive functioning at kindergarten entry for all students who have prekindergarten experience, the data show that prekindergarten experience mattered for all student groups except for English Learners. Additionally, students who are Economically Disadvantaged benefited greatly from having prekindergarten experience.
Table 6: Percent and number of students who meet executive functioning standards at kindergarten entry with and without prekindergarten experience in SY 2019-20
Student Group Asian Black Hispanic White Econ. Dis. EL SWD Percent with prekindergarten 85% 70% 72% 81% 69% 68% 51% Number with prekindergarten 1,567 651 1584 3,830 1,821 1,744 538 Percent without prekindergarten 73% 65% 67% 77% 34% 66% 45% Number without prekindergarten 259 128 798 314 799 928 10
Note: The n’s provided represent the numerator or the number of students that fall under each of these categories. For example, 1,567 Asian students met the executive functioning standard and had prekindergarten experience. Students who entered FCPS with executive functioning skills at kindergarten entry were more likely to demonstrate life, work, and citizenship skills by the end of their kindergarten year. Performance on the CBRS self-regulation scale measuring executive functioning skills at kindergarten entry was associated with performance on life, work, and citizenship skills at the end of kindergarten, indicating that executive function is important to classroom functioning in early years. Specifically, the life, work, and citizenship skills measured by the end of year progress reports include the following items:
• Completes assignments on time • Demonstrates active listening skills • Demonstrates self-control • Exhibits organizational skills • Follows directions • Follows established routines • Identifies, pursues, and reflects on goals • Is respectful and a contributing participant in school • Resolves conflict effectively • Takes responsibility for actions • Uses time constructively • Works effectively within a group.
Performance on the CBRS self-regulation scale at kindergarten entry accounted for 16 to 25 percent of the variance12 of performance on the life, work, and citizenship skills, which is considered a large effect in educational research. These findings have implications that are important to FCPS. First, the findings are consistent with the research literature that show the importance of kindergarten readiness skills to functioning well in a classroom, which is in turn, important to future academic success. Second, the findings imply that students who enter FCPS without executive functioning skills may continue to be behind behaviorally, which could affect their future academic career and lead to future gaps.
SY 2019-20 Actions, Costs, and Return on Investment This section provides information about the strategic actions that were taken toward the Aspiration that “All future FCPS students will enter kindergarten with the essential skills needed for school success” in
12 Correlation coefficients ranged from 0.40 to 0.50 when determining the association between the CBRS self-regulation score and the life, work, and citizenship items on the progress reports. All correlations were statistically significant at p≤0.01.
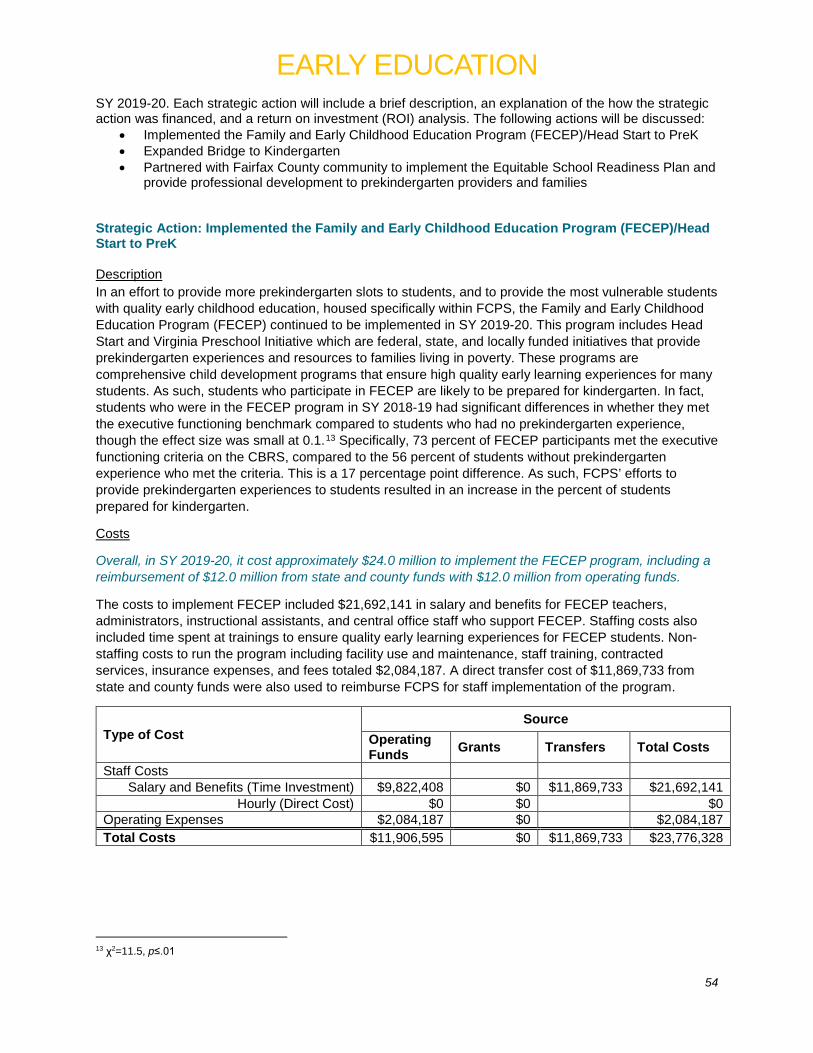
EARLY EDUCATION
54
SY 2019-20. Each strategic action will include a brief description, an explanation of the how the strategic action was financed, and a return on investment (ROI) analysis. The following actions will be discussed:
• Implemented the Family and Early Childhood Education Program (FECEP)/Head Start to PreK • Expanded Bridge to Kindergarten • Partnered with Fairfax County community to implement the Equitable School Readiness Plan and
provide professional development to prekindergarten providers and families Strategic Action: Implemented the Family and Early Childhood Education Program (FECEP)/Head Start to PreK Description In an effort to provide more prekindergarten slots to students, and to provide the most vulnerable students with quality early childhood education, housed specifically within FCPS, the Family and Early Childhood Education Program (FECEP) continued to be implemented in SY 2019-20. This program includes Head Start and Virginia Preschool Initiative which are federal, state, and locally funded initiatives that provide prekindergarten experiences and resources to families living in poverty. These programs are comprehensive child development programs that ensure high quality early learning experiences for many students. As such, students who participate in FECEP are likely to be prepared for kindergarten. In fact, students who were in the FECEP program in SY 2018-19 had significant differences in whether they met the executive functioning benchmark compared to students who had no prekindergarten experience, though the effect size was small at 0.1.13 Specifically, 73 percent of FECEP participants met the executive functioning criteria on the CBRS, compared to the 56 percent of students without prekindergarten experience who met the criteria. This is a 17 percentage point difference. As such, FCPS’ efforts to provide prekindergarten experiences to students resulted in an increase in the percent of students prepared for kindergarten.
Costs
Overall, in SY 2019-20, it cost approximately $24.0 million to implement the FECEP program, including a reimbursement of $12.0 million from state and county funds with $12.0 million from operating funds.
The costs to implement FECEP included $21,692,141 in salary and benefits for FECEP teachers, administrators, instructional assistants, and central office staff who support FECEP. Staffing costs also included time spent at trainings to ensure quality early learning experiences for FECEP students. Non-staffing costs to run the program including facility use and maintenance, staff training, contracted services, insurance expenses, and fees totaled $2,084,187. A direct transfer cost of $11,869,733 from state and county funds were also used to reimburse FCPS for staff implementation of the program.
Type of Cost Source
Operating Funds Grants Transfers Total Costs
Staff Costs Salary and Benefits (Time Investment) $9,822,408 $0 $11,869,733 $21,692,141
Hourly (Direct Cost) $0 $0 $0 Operating Expenses $2,084,187 $0 $2,084,187 Total Costs $11,906,595 $0 $11,869,733 $23,776,328
13 χ2=11.5, p≤.01
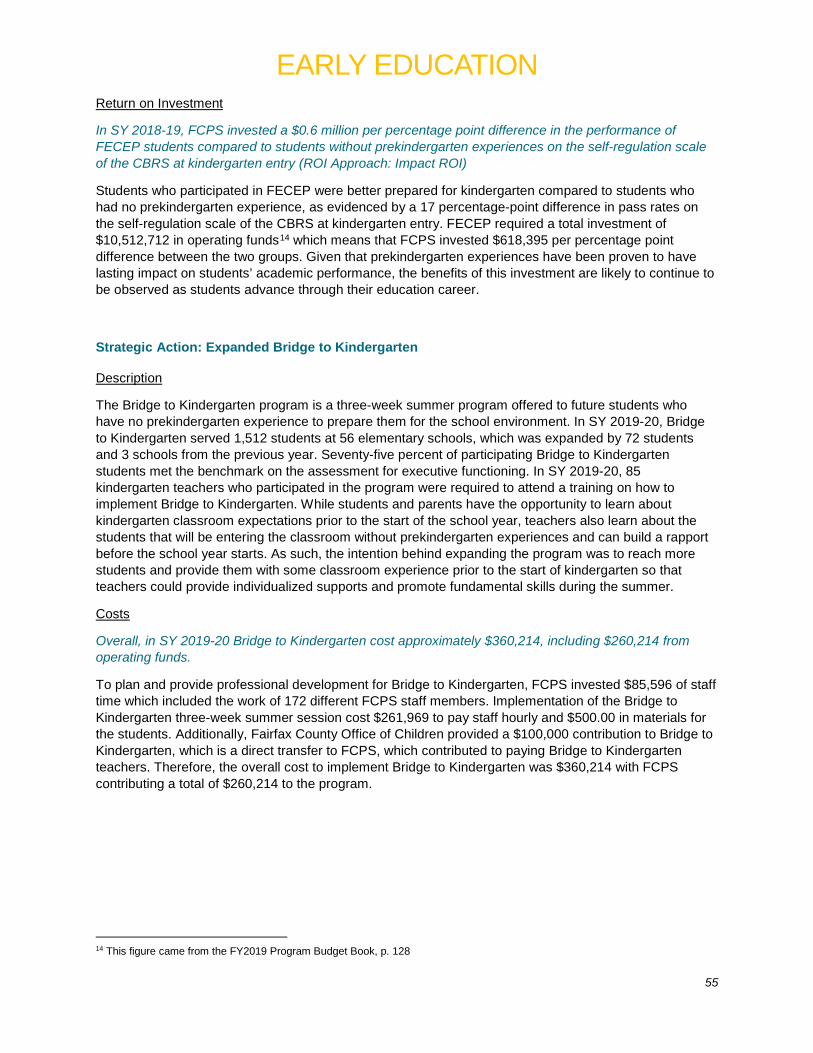
EARLY EDUCATION
55
Return on Investment
In SY 2018-19, FCPS invested a $0.6 million per percentage point difference in the performance of FECEP students compared to students without prekindergarten experiences on the self-regulation scale of the CBRS at kindergarten entry (ROI Approach: Impact ROI)
Students who participated in FECEP were better prepared for kindergarten compared to students who had no prekindergarten experience, as evidenced by a 17 percentage-point difference in pass rates on the self-regulation scale of the CBRS at kindergarten entry. FECEP required a total investment of $10,512,712 in operating funds14 which means that FCPS invested $618,395 per percentage point difference between the two groups. Given that prekindergarten experiences have been proven to have lasting impact on students’ academic performance, the benefits of this investment are likely to continue to be observed as students advance through their education career.
Strategic Action: Expanded Bridge to Kindergarten Description
The Bridge to Kindergarten program is a three-week summer program offered to future students who have no prekindergarten experience to prepare them for the school environment. In SY 2019-20, Bridge to Kindergarten served 1,512 students at 56 elementary schools, which was expanded by 72 students and 3 schools from the previous year. Seventy-five percent of participating Bridge to Kindergarten students met the benchmark on the assessment for executive functioning. In SY 2019-20, 85 kindergarten teachers who participated in the program were required to attend a training on how to implement Bridge to Kindergarten. While students and parents have the opportunity to learn about kindergarten classroom expectations prior to the start of the school year, teachers also learn about the students that will be entering the classroom without prekindergarten experiences and can build a rapport before the school year starts. As such, the intention behind expanding the program was to reach more students and provide them with some classroom experience prior to the start of kindergarten so that teachers could provide individualized supports and promote fundamental skills during the summer.
Costs
Overall, in SY 2019-20 Bridge to Kindergarten cost approximately $360,214, including $260,214 from operating funds.
To plan and provide professional development for Bridge to Kindergarten, FCPS invested $85,596 of staff time which included the work of 172 different FCPS staff members. Implementation of the Bridge to Kindergarten three-week summer session cost $261,969 to pay staff hourly and $500.00 in materials for the students. Additionally, Fairfax County Office of Children provided a $100,000 contribution to Bridge to Kindergarten, which is a direct transfer to FCPS, which contributed to paying Bridge to Kindergarten teachers. Therefore, the overall cost to implement Bridge to Kindergarten was $360,214 with FCPS contributing a total of $260,214 to the program.
14 This figure came from the FY2019 Program Budget Book, p. 128
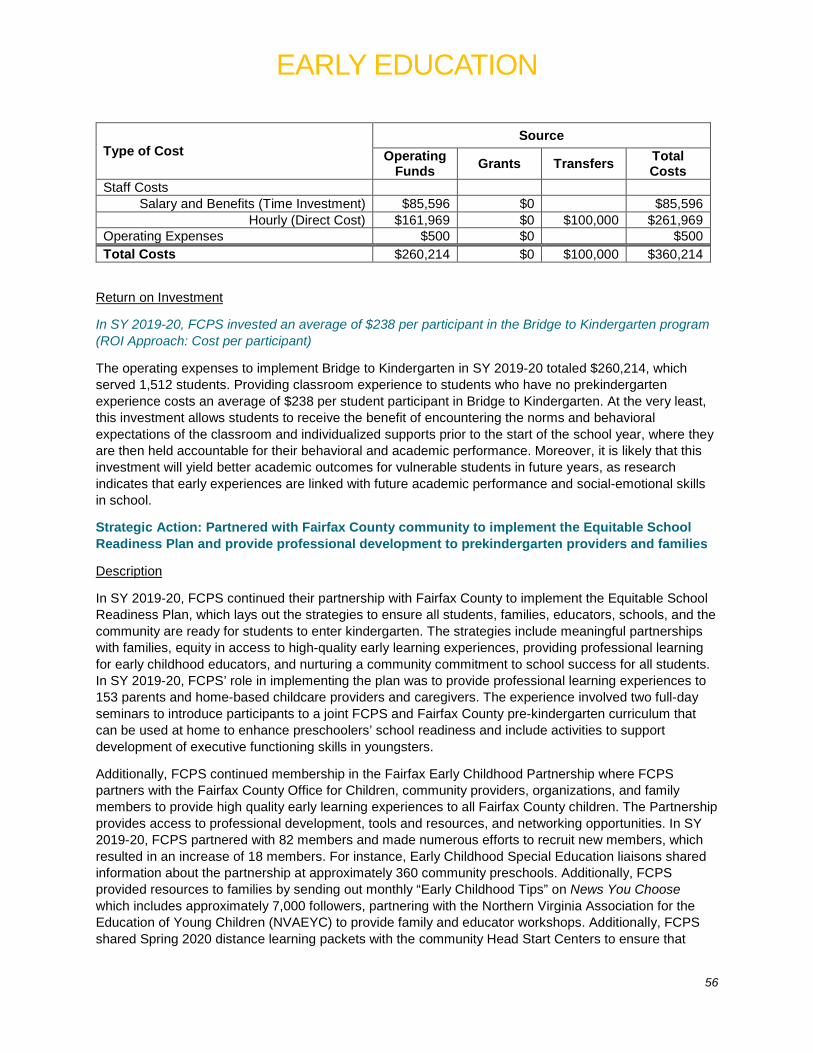
EARLY EDUCATION
56
Type of Cost Source
Operating Funds Grants Transfers Total
Costs Staff Costs
Salary and Benefits (Time Investment) $85,596 $0 $85,596 Hourly (Direct Cost) $161,969 $0 $100,000 $261,969
Operating Expenses $500 $0 $500 Total Costs $260,214 $0 $100,000 $360,214
Return on Investment
In SY 2019-20, FCPS invested an average of $238 per participant in the Bridge to Kindergarten program (ROI Approach: Cost per participant)
The operating expenses to implement Bridge to Kindergarten in SY 2019-20 totaled $260,214, which served 1,512 students. Providing classroom experience to students who have no prekindergarten experience costs an average of $238 per student participant in Bridge to Kindergarten. At the very least, this investment allows students to receive the benefit of encountering the norms and behavioral expectations of the classroom and individualized supports prior to the start of the school year, where they are then held accountable for their behavioral and academic performance. Moreover, it is likely that this investment will yield better academic outcomes for vulnerable students in future years, as research indicates that early experiences are linked with future academic performance and social-emotional skills in school.
Strategic Action: Partnered with Fairfax County community to implement the Equitable School Readiness Plan and provide professional development to prekindergarten providers and families
Description
In SY 2019-20, FCPS continued their partnership with Fairfax County to implement the Equitable School Readiness Plan, which lays out the strategies to ensure all students, families, educators, schools, and the community are ready for students to enter kindergarten. The strategies include meaningful partnerships with families, equity in access to high-quality early learning experiences, providing professional learning for early childhood educators, and nurturing a community commitment to school success for all students. In SY 2019-20, FCPS’ role in implementing the plan was to provide professional learning experiences to 153 parents and home-based childcare providers and caregivers. The experience involved two full-day seminars to introduce participants to a joint FCPS and Fairfax County pre-kindergarten curriculum that can be used at home to enhance preschoolers’ school readiness and include activities to support development of executive functioning skills in youngsters.
Additionally, FCPS continued membership in the Fairfax Early Childhood Partnership where FCPS partners with the Fairfax County Office for Children, community providers, organizations, and family members to provide high quality early learning experiences to all Fairfax County children. The Partnership provides access to professional development, tools and resources, and networking opportunities. In SY 2019-20, FCPS partnered with 82 members and made numerous efforts to recruit new members, which resulted in an increase of 18 members. For instance, Early Childhood Special Education liaisons shared information about the partnership at approximately 360 community preschools. Additionally, FCPS provided resources to families by sending out monthly “Early Childhood Tips” on News You Choose which includes approximately 7,000 followers, partnering with the Northern Virginia Association for the Education of Young Children (NVAEYC) to provide family and educator workshops. Additionally, FCPS shared Spring 2020 distance learning packets with the community Head Start Centers to ensure that
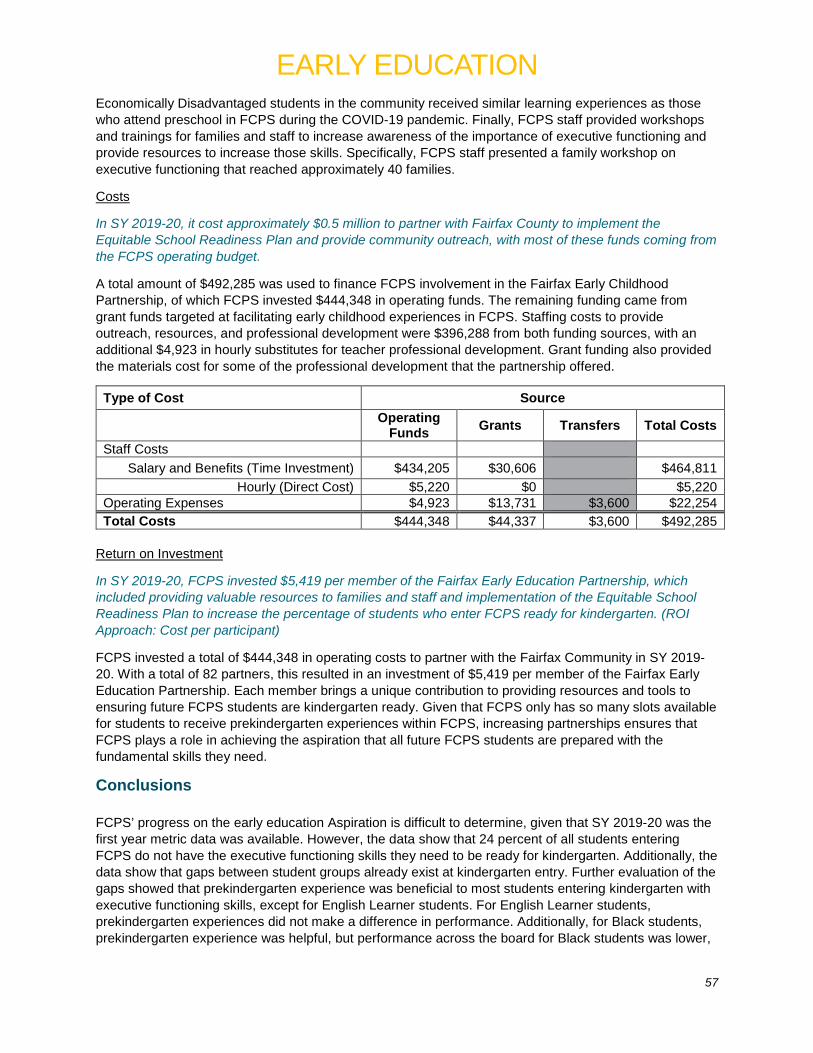
EARLY EDUCATION
57
Economically Disadvantaged students in the community received similar learning experiences as those who attend preschool in FCPS during the COVID-19 pandemic. Finally, FCPS staff provided workshops and trainings for families and staff to increase awareness of the importance of executive functioning and provide resources to increase those skills. Specifically, FCPS staff presented a family workshop on executive functioning that reached approximately 40 families.
Costs
In SY 2019-20, it cost approximately $0.5 million to partner with Fairfax County to implement the Equitable School Readiness Plan and provide community outreach, with most of these funds coming from the FCPS operating budget.
A total amount of $492,285 was used to finance FCPS involvement in the Fairfax Early Childhood Partnership, of which FCPS invested $444,348 in operating funds. The remaining funding came from grant funds targeted at facilitating early childhood experiences in FCPS. Staffing costs to provide outreach, resources, and professional development were $396,288 from both funding sources, with an additional $4,923 in hourly substitutes for teacher professional development. Grant funding also provided the materials cost for some of the professional development that the partnership offered.
Type of Cost Source
Operating Funds Grants Transfers Total Costs
Staff Costs Salary and Benefits (Time Investment) $434,205 $30,606 $464,811
Hourly (Direct Cost) $5,220 $0 $5,220 Operating Expenses $4,923 $13,731 $3,600 $22,254 Total Costs $444,348 $44,337 $3,600 $492,285
Return on Investment
In SY 2019-20, FCPS invested $5,419 per member of the Fairfax Early Education Partnership, which included providing valuable resources to families and staff and implementation of the Equitable School Readiness Plan to increase the percentage of students who enter FCPS ready for kindergarten. (ROI Approach: Cost per participant)
FCPS invested a total of $444,348 in operating costs to partner with the Fairfax Community in SY 2019-20. With a total of 82 partners, this resulted in an investment of $5,419 per member of the Fairfax Early Education Partnership. Each member brings a unique contribution to providing resources and tools to ensuring future FCPS students are kindergarten ready. Given that FCPS only has so many slots available for students to receive prekindergarten experiences within FCPS, increasing partnerships ensures that FCPS plays a role in achieving the aspiration that all future FCPS students are prepared with the fundamental skills they need.
Conclusions FCPS’ progress on the early education Aspiration is difficult to determine, given that SY 2019-20 was the first year metric data was available. However, the data show that 24 percent of all students entering FCPS do not have the executive functioning skills they need to be ready for kindergarten. Additionally, the data show that gaps between student groups already exist at kindergarten entry. Further evaluation of the gaps showed that prekindergarten experience was beneficial to most students entering kindergarten with executive functioning skills, except for English Learner students. For English Learner students, prekindergarten experiences did not make a difference in performance. Additionally, for Black students, prekindergarten experience was helpful, but performance across the board for Black students was lower,
EARLY EDUCATION
58
regardless of experiences prior to kindergarten entry. Furthermore, additional analyses show how important executive functioning skills are, as these skills at kindergarten entry were associated with life, work, and citizenship skills from end of year progress reports.
In SY 2019-20, FCPS provided low income students with prekindergarten experiences through FECEP, which did make a difference in their executive functioning skills in kindergarten. Bridge to Kindergarten also provides future FCPS students with classroom experience, but it is unclear whether the short time that students are exposed to the classroom environment with no prekindergarten experience is sufficient to increase executive functioning skills. At the very least, Bridge to Kindergarten familiarizes parents and students with the new environment and prepares them for what to expect during the school year. Additionally, it is unclear whether the professional development and outreach that FCPS conducted through the partnership with Fairfax County yielded increases in executive functioning, as the metric is measured at the beginning of the year, and the activities associated with the partnership were taken throughout the year or were cancelled because of COVID-19. FCPS has limited resources and influence to ensure the skills of future students. Therefore, partnerships and early education programming are the two approaches that will likely yield the best outcomes, both of which were part of FCPS efforts in SY 2019-20. However, these approaches have not been implemented to their fullest possibility for many reasons that include time and money.
Looking forward, the data show that FCPS should consider how to build executive functioning skills of young students beyond providing slots for prekindergarten. Specifically, FCPS should enhance the outreach that they provide to families about the importance of these skills, including increasing partnerships with those who interact with families on a regular basis (e.g. pediatricians), and expanding workshops to parents to provide tools at home or other settings to facilitate executive functioning skills. More resources may need to be invested to expand these opportunities within FCPS so that partnerships can continue to be meaningful, and so that FCPS has a more hands-on influence on preparing young children for kindergarten. Additionally, given that the data show that FCPS students enter kindergarten already experiencing gaps, which means that some students are below the curve before they even arrive, FCPS should take additional efforts to address these gaps. While FCPS has limited control in closing gaps prior to kindergarten entry, FCPS should advocate with partners to assess these skills early on to determine early intervention needs. One way that FCPS can address this is to encourage local prekindergarten providers to assess students early and provide resources to improve deficits in those skills.
Goal Champion Response to Conclusions Somewhat agree. While gaps persist, positive signs underrepresented groups especially those in poverty exist. With a new kindergarten readiness measure (executive functioning) in place for the 1st year, FCPS data has confirmed that gaps start as early as PreK and we have seen better outcomes for families who received our early childhood programs and services. Performance on the Child Behavior Rating Scale (CBRS) with a focus on executive functioning skills at kindergarten entry is found to be highly associated with performance on life, work, and citizenship skills at the end of kindergarten. Countywide programs such as PreK and Bridge to K are dedicated to ensuring high quality early learning experiences for vulnerable families. We have utilized substantial resources in building professional development modules to train our teachers with hands-on strategies with the most vulnerable students and their families in mind. FCPS data has suggested that students with PreK experience and/or participating in bridge to K are more likely to meet CBRS criteria. Partnering with local PreK providers will allow FCPS to address learning gaps before entry to Kindergarten by implementing research-based strategies into a wider range of PreK classrooms (outside FCPS owned). The division should continue efforts to provide research-based strategies through professional development opportunities with customized support to families and students in need. As data and research have shown early detection and intervention is critical in closing the achievement gap as gaps start early and exacerbate over time. Students particularly those from vulnerable families (English learners and Black students) often experience significant changes when
EARLY EDUCATION
59
transitioning into a formal school setting from their home culture. Teachers with culturally inclusive pedagogy and relationship building often will ease the transition for these families and students. Thus, professional development for teachers will have an increased focus on culturally and linguistically inclusive pedagogy with equity being at the center of our work.
EARLY EDUCATION
60
School Board Considerations Strategic Concerns FCPS should continue to work with the County and the community to enhance partnerships, which may require support or facilitation from the School Board. Budget Considerations FCPS could reach more families if there was a full-time position in the Early Education Office designed to make outreach efforts.
FCPS should expand Bridge to Kindergarten to reach all students without prekindergarten experience to ensure that students enter Kindergarten with some familiarity of the rules and expectations of a classroom setting.
FCPS should continue to fund Bridge to Kindergarten and advocate for additional Fairfax County funding of Early Childhood programs
FCPS should establish permanent funding for Waterford Early Learning: Reading and Professional Services: Virtual Training
Policy None
PORTRAIT OF A GRADUATE
61
Aspiration: All students will meet grade-level expectations for Portrait of a Graduate outcomes as measured by their performance on end-of-year POG Presentations of Learning. SY 2019-20 Outcomes and Analysis There is one metric measuring the Aspiration “All students will meet grade-level expectations for Portrait of a Graduate outcomes as measured by their performance on end-of-year POG Presentations of Learning.” Key metrics, which provide data central to determining progress toward the Desired Outcome, are included below. The following key metrics are presented below:
• Percent of students who demonstrate proficiency (matrix rating of “proficient” or higher) on their end of year PoG presentations of learning.
Metric Data In SY 2019-20, no Presentations of Learning took place due to COVID-19, so data is not available for this metric.
Asian Black Hispanic White Econ. Dis. EL SWD Overall Performance Aspiration 100% 100% 100% 100% 100% 100% 100%
Performance Target Data Not Available SY 19-20 Performance
SY 19-20 Performance n 3-Year Baseline 3-Year Baseline n
The Data for this Desired Outcome are Not Available
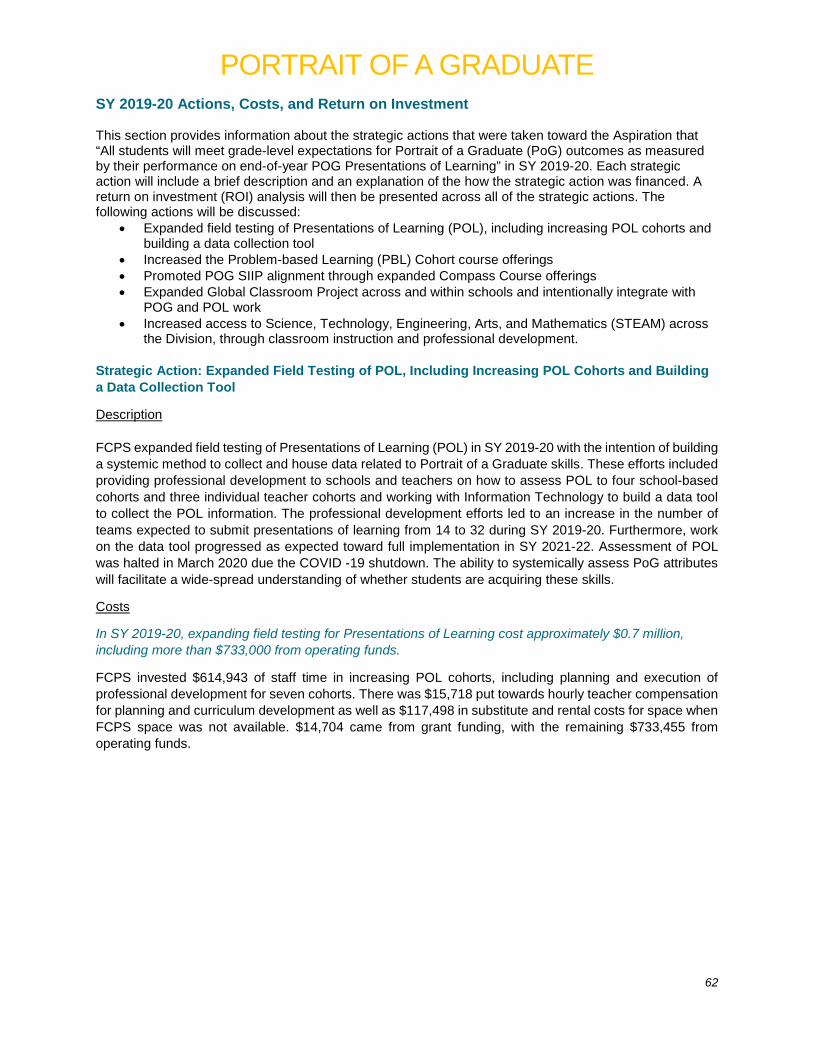
PORTRAIT OF A GRADUATE
62
SY 2019-20 Actions, Costs, and Return on Investment This section provides information about the strategic actions that were taken toward the Aspiration that “All students will meet grade-level expectations for Portrait of a Graduate (PoG) outcomes as measured by their performance on end-of-year POG Presentations of Learning” in SY 2019-20. Each strategic action will include a brief description and an explanation of the how the strategic action was financed. A return on investment (ROI) analysis will then be presented across all of the strategic actions. The following actions will be discussed:
• Expanded field testing of Presentations of Learning (POL), including increasing POL cohorts and building a data collection tool
• Increased the Problem-based Learning (PBL) Cohort course offerings • Promoted POG SIIP alignment through expanded Compass Course offerings • Expanded Global Classroom Project across and within schools and intentionally integrate with
POG and POL work • Increased access to Science, Technology, Engineering, Arts, and Mathematics (STEAM) across
the Division, through classroom instruction and professional development. Strategic Action: Expanded Field Testing of POL, Including Increasing POL Cohorts and Building a Data Collection Tool
Description FCPS expanded field testing of Presentations of Learning (POL) in SY 2019-20 with the intention of building a systemic method to collect and house data related to Portrait of a Graduate skills. These efforts included providing professional development to schools and teachers on how to assess POL to four school-based cohorts and three individual teacher cohorts and working with Information Technology to build a data tool to collect the POL information. The professional development efforts led to an increase in the number of teams expected to submit presentations of learning from 14 to 32 during SY 2019-20. Furthermore, work on the data tool progressed as expected toward full implementation in SY 2021-22. Assessment of POL was halted in March 2020 due the COVID -19 shutdown. The ability to systemically assess PoG attributes will facilitate a wide-spread understanding of whether students are acquiring these skills.
Costs
In SY 2019-20, expanding field testing for Presentations of Learning cost approximately $0.7 million, including more than $733,000 from operating funds.
FCPS invested $614,943 of staff time in increasing POL cohorts, including planning and execution of professional development for seven cohorts. There was $15,718 put towards hourly teacher compensation for planning and curriculum development as well as $117,498 in substitute and rental costs for space when FCPS space was not available. $14,704 came from grant funding, with the remaining $733,455 from operating funds.
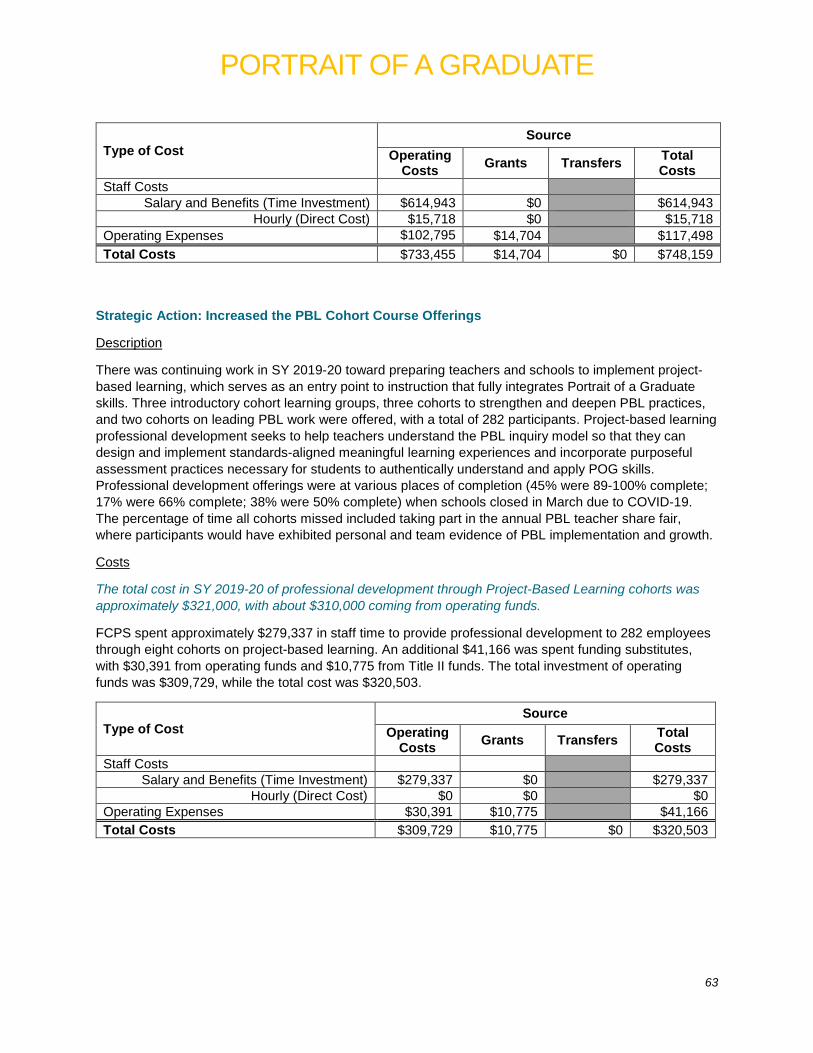
PORTRAIT OF A GRADUATE
63
Type of Cost Source
Operating Costs Grants Transfers Total
Costs Staff Costs
Salary and Benefits (Time Investment) $614,943 $0 $614,943 Hourly (Direct Cost) $15,718 $0 $15,718
Operating Expenses $102,795 $14,704 $117,498 Total Costs $733,455 $14,704 $0 $748,159
Strategic Action: Increased the PBL Cohort Course Offerings
Description
There was continuing work in SY 2019-20 toward preparing teachers and schools to implement project-based learning, which serves as an entry point to instruction that fully integrates Portrait of a Graduate skills. Three introductory cohort learning groups, three cohorts to strengthen and deepen PBL practices, and two cohorts on leading PBL work were offered, with a total of 282 participants. Project-based learning professional development seeks to help teachers understand the PBL inquiry model so that they can design and implement standards-aligned meaningful learning experiences and incorporate purposeful assessment practices necessary for students to authentically understand and apply POG skills. Professional development offerings were at various places of completion (45% were 89-100% complete; 17% were 66% complete; 38% were 50% complete) when schools closed in March due to COVID-19. The percentage of time all cohorts missed included taking part in the annual PBL teacher share fair, where participants would have exhibited personal and team evidence of PBL implementation and growth.
Costs
The total cost in SY 2019-20 of professional development through Project-Based Learning cohorts was approximately $321,000, with about $310,000 coming from operating funds.
FCPS spent approximately $279,337 in staff time to provide professional development to 282 employees through eight cohorts on project-based learning. An additional $41,166 was spent funding substitutes, with $30,391 from operating funds and $10,775 from Title II funds. The total investment of operating funds was $309,729, while the total cost was $320,503.
Type of Cost Source
Operating Costs Grants Transfers Total
Costs Staff Costs
Salary and Benefits (Time Investment) $279,337 $0 $279,337 Hourly (Direct Cost) $0 $0 $0
Operating Expenses $30,391 $10,775 $41,166 Total Costs $309,729 $10,775 $0 $320,503

PORTRAIT OF A GRADUATE
64
Strategic Action: Promoted POG SIIP Alignment through Expanded Compass Course Offerings
Description
In SY 2019-20, FCPS planned new professional development courses on PoG POL which will be delivered in SY 2020-21. The new offerings included courses on leading POG POL work, sharing best practices, and two courses on integrating POG goals into the SIIP; one as an introduction and one for schools ready to go more in depth. The effort continues work toward integrating POG POL work and ensuring all students meet end of year expectations. Because the courses were expected to start in April, they did not occur due to the COVID-19 shutdown.
Costs
The costs of planning for Compass Courses to support aligning Portrait of a Graduate and SIIPs in SY 2019-20 was negligible. Type of Cost
Source
Operating Costs Grants Transfers Total
Costs Staff Costs
Salary and Benefits (Time Investment) $0 $0 $0 Hourly (Direct Cost) $0 $0 $0
Operating Expenses $0 $0 $0 Total Costs $0 $0 $0 $0
Strategic Action: Expanded Global Classroom Project Across and Within Schools and Intentionally Integrate with PoG and POL Work
Description
In SY 2019-20, there was a new focus to intentionally align Global Classroom Project (GCP) to the PoG POL with teams participating in the POL cohorts and using GCP as the pathway to collect evidence for POL. Global Classroom Project expanded from 15 to 31 schools and also expanded to more teams within existing schools. GCP is authentic, collaborative work in which students work with others from across the globe on real world challenges. Under the umbrella of being an ethical and global citizen, students work on all individual PoG skills. There continued to be five pathways offered: STEAM, Sustainability, Language Acquisition, Cultural Responsiveness, and Content Enrichment. Because GCP work is primarily virtual, many teachers were able to continue worldwide collaboration during the COVID-19 closure.
Costs
In SY 2019-20, approximately $146,000 in operating funds was invested in expanding Global Classroom Project and integrating it with Portrait of a Graduate Presentations of Learning.
Approximately $132,491 was spent in SY 2019-20 in staff time on supporting an expansion of Global Classroom Project, including teacher professional development and central office staff work. An additional $13,083 was invested to pay for substitutes so teachers could attend professional development. This results in a total cost of $145,574 in operating funds.

PORTRAIT OF A GRADUATE
65
Type of Cost Source
Operating Costs Grants Transfers Total
Costs Staff Costs
Salary and Benefits (Time Investment) $132,491 $0 $132,491
Hourly (Direct Cost) $0 $0 $0 Operating Expenses $13,083 $0 $13,083
Total Costs $145,574 $0 $0 $145,574
Strategic Action: Increased Access to STEAM across Division through Classroom Instruction and Professional Development
Description
In SY 2019-20, FCPS provided more opportunities to develop Portrait of a Graduate skills by increasing access to STEAM curriculum. Through the Early Childhood Initiative, 12 schools piloted integrating engineering, coding, programming, and computational thinking into preschool instruction. Teachers at the 12 schools were trained in how to engage students in computer science and engineering. A Community of Learning was established, with an elementary cohort of 15 schools focusing on developing STEAM goals and practices. In addition, a Computer Science Learning Cohort of 14 schools was established to provide direct support of schools with integrating computer science standards, POG skills, and content. To support this work, a specialist was added as a resource. All these efforts seek to expand meaningful and authentic learning experiences to students where they can practice POG skills. When schools closed due to COVID-19 professional development and cohort work ceased.
Costs
In SY 2019-20, the cost of increasing access to STEAM was approximately $490,000, with most costs paid by FCPS.
There were $446,315 in staff time costs associated with central office staff supporting the Early Childhood Initiative, a Community of Learning, and a Computer Science Learning Cohort. Approximately $941 in hourly work on curriculum and kit support work was also done. Most of the $42,505 spent on operating expenses supported substitute costs for professional development and purchase of technology. Of the total $489,760 spent on this action, $486,605 came from operating funds and $3,155 was from grant funding.
Type of Cost Source
Operating Costs Grants Transfers Total
Costs Staff Costs
Salary and Benefits (Time Investment) $446,315 $0 $446,315
Hourly (Direct Cost) $941 $0 $941 Operating Expenses $39,350 $3,155 $42,505
Total Costs $486,605 $3,155 $0 $489,760
PORTRAIT OF A GRADUATE
66
Return on Investment
In SY 2019-20, FCPS invested $8 per student to support students in meeting grade level expectations for Portrait of a Graduate outcomes. (ROI Approach: Cost per participant)
Collectively, all the actions supporting students in meeting Portrait of a Graduate outcomes cost approximately $1.7 million in FCPS funds. Using total enrollment in FCPS in SY 2019-20 of over 200,000 students, this is equivalent to $8 per FCPS student. Together, these actions should allow FCPS to promote and assess PoG attributes, however a greater investment is needed to fully implement these actions across FCPS.
Conclusions Portrait of a Graduate has been a focus for FCPS since it was adopted in 2014, but formal data has yet to be collected on progress toward this metric. There has been no metric data available as part of strategic plan reporting, and only 32 schools were expected to have POL available for analysis, even before the COVID-19 interruption. This goal will not be achieved at the current rate of implementation and the lack of formal data complicates the ability to determine a return on investment thus far. At this time, actions designed to integrate PoG into classrooms, including POL and PBL cohorts, Compass courses, Global Classroom Project groups, and STEAM cohorts, rely on a relatively small number of teachers and schools to spread the work to others. While the professional development for these cohorts supports the ultimate goal, there has yet to be a critical mass of educators in FCPS invested in these actions to make significant progress toward this goal. With PoG listed a priority and resources allocated toward increasing these attributes for all students, it is unclear why implementation has not been scaled to include all FCPS schools. FCPS must either commit to following through on this goal for all schools or revise it.
Goal Champion Response to Conclusions Disagree. Portrait of a Graduate (POG) should remain a separate Desired Outcome and assessed using the established grade-level rubrics and presentations of learning. The work to integrate POG into content and program curriculum is currently underway and will continue to require resources. While information on strategic actions related to POG outcomes are included in the report, the named actions represent a small sampling of impactful elements that contribute to a larger body of work. Specific foci for POG growth/integration overlooked in the report include:
● Ongoing development and support of Project-Based Learning and POG Lead Teachers as job-embedded professional development at the school level
● Personalized school-based and collaborative team support ● Academy Courses (29 sections across 5 courses tiered to support a progression of teacher
readiness) ● Resource/curriculum creation and integration into content and program curriculum ● After School Specials ● POG Labsites (elementary)
Professional development offerings and the POG Presentations of Learning (POL) field test came to an abrupt halt in March with school closures; however, there is evidence of progress towards POG outcomes for students at both the classroom and school levels in SY 2019-20. For example, 79% of schools participating in the POG POL cohorts reported PBL practices as a foundation for continuing their journey to assessment of POG skills through POG POL. This assessment piece is critical as it is the measured guarantor of POG outcomes for students as a part of the guaranteed and viable FCPS curriculum. The POG POL field test supported 420 school-based participants in growing POG-focused instructional and assessment practices. 87.2% of participants reported that the cohort led to shifts in practice and instruction, despite the mid-year (March) halt to implementation of the field test. Key take-aways as identified by participants included that “assessment is a process, not a product” and the importance of making growth over time visible with students.

PORTRAIT OF A GRADUATE
67
Additionally, school-level progress can be analyzed through SIIP goals. For SY 2019-20, 88 schools included a SIIP goal for student growth in POG skills as an outcome; this represents an increase of 50% over the number of schools submitting POG goals in SY 2018-19. Of the 54 schools attending POG/SIIP courses in SY 2018-19, 45 submitted POG goals for SY 2019-20, or 83% of schools attending the course. Across the division, 44% of schools submitted POG/SIIP goals. Schools attending POG Compass Courses submitted POG goals at almost double the rate of schools overall.
While school closures derailed existing plans, inquiry and POG-focused curriculum resources continued to be created to support Spring Distance Learning and Summer Continuity of Learning. Centrally-created Student Learning Packets and Summer Practice Books included intentional opportunities for students to learn, apply, and reflect on POG skills. Additionally, asynchronous PBL units created for this time focused on providing authentic opportunities for students to apply and reflect on these timely and necessary skills.
PORTRAIT OF A GRADUATE
68
School Board Considerations Strategic Concerns Given the FCPS commitment to equity, structures and expectations should be established to ensure that all students receive equitable learning opportunities, including the opportunity to participate in presentations of learning, that focus on development of POG skills. All levels of leadership are needed to clearly communicate PoG as a priority goal/outcome for students. Budget Considerations To fully implement Presentations of Learning (POL) as originally intended, more resources are needed to scale the current work to the division level. Resources may include additional positions to lead the work, large scale professional development for teachers, and systems in place to manage the data collection.
If FCPS integrates PoG skills into curriculum, money would be needed for curriculum development and professional development for central office staff as well as teachers.
Policy None
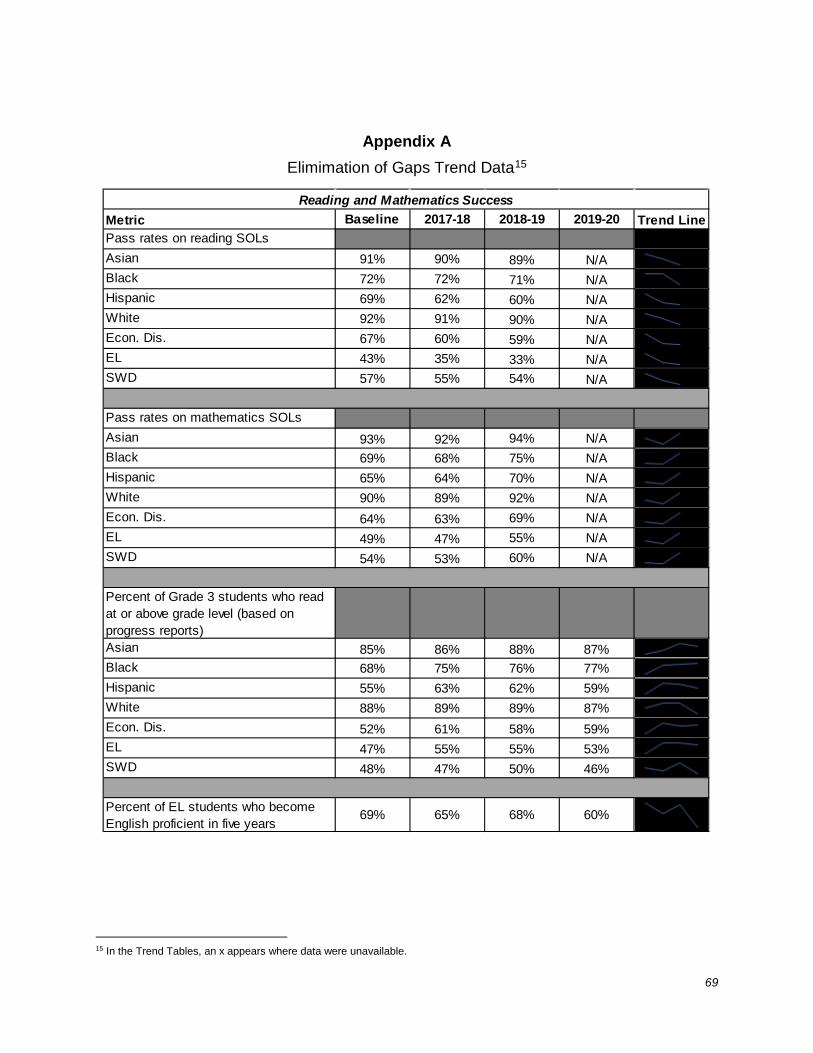
69
Appendix A Elimimation of Gaps Trend Data15
15 In the Trend Tables, an x appears where data were unavailable.
Metric Baseline 2017-18 2018-19 2019-20 Trend LinePass rates on reading SOLsAsian 91% 90% 89% N/A xBlack 72% 72% 71% N/A xHispanic 69% 62% 60% N/A xWhite 92% 91% 90% N/A xEcon. Dis. 67% 60% 59% N/A xEL 43% 35% 33% N/A xSWD 57% 55% 54% N/A x
Pass rates on mathematics SOLsAsian 93% 92% 94% N/A xBlack 69% 68% 75% N/A xHispanic 65% 64% 70% N/A xWhite 90% 89% 92% N/A xEcon. Dis. 64% 63% 69% N/A xEL 49% 47% 55% N/A xSWD 54% 53% 60% N/A x
Percent of Grade 3 students who read at or above grade level (based on progress reports)Asian 85% 86% 88% 87%Black 68% 75% 76% 77%Hispanic 55% 63% 62% 59%White 88% 89% 89% 87%Econ. Dis. 52% 61% 58% 59%EL 47% 55% 55% 53%SWD 48% 47% 50% 46%
Percent of EL students who become English proficient in five years
69% 65% 68% 60%
Reading and Mathematics Success

70
Metric Baseline 2017-18 2018-19 2019-20 Trend LinePercent of students who either pass a college-level exam, pass a dual enrollment course, or earn an industry certification before graduatonAsian 75% 76% 79% 79%Black 39% 40% 44% 47%Hispanic 42% 39% 40% 41%White 69% 71% 72% 75%Econ. Dis. 40% 40% 40% 41%EL 9% 9% 10% 11%SWD 17% 19% 18% 23%
Virginia on-time graduation ratesAsian 97% 98% 98% 98%Black 92% 94% 93% 96%Hispanic 77% 74% 75% 79%White 97% 98% 98% 99%Econ. Dis. 85% 87% 86% 90%EL 66% 67% 68% 73%SWD 90% 91% 92% 95%
Percent of students with plans for college or career on the Senior SurveyAsian 99% 99% 98% 94%Black 97% 98% 97% 84%Hispanic 97% 98% 95% 81%White 98% 99% 97% 93%Econ. Dis. 97% 98% 95% 80%EL 90% 94% 87% 69%SWD 93% 95% 91% 78%
College and Career Ready
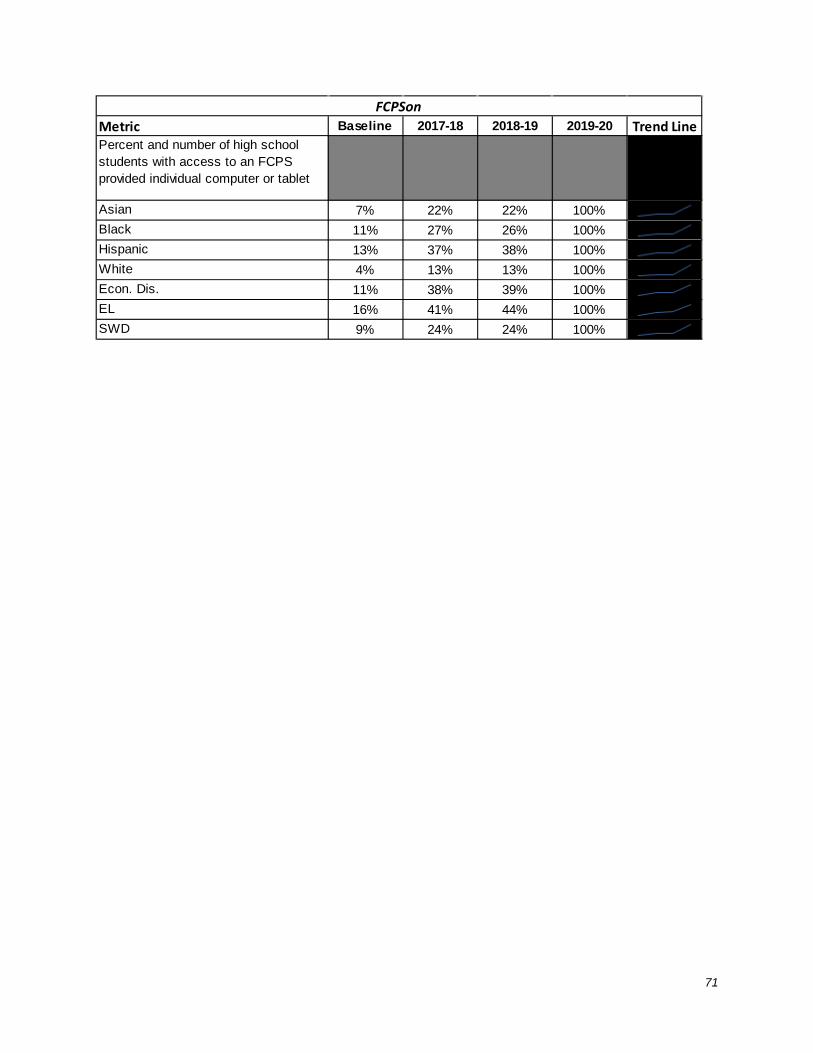
71
Metric Baseline 2017-18 2018-19 2019-20 Trend LinePercent and number of high school students with access to an FCPS provided individual computer or tablet
Asian 7% 22% 22% 100%Black 11% 27% 26% 100%Hispanic 13% 37% 38% 100%White 4% 13% 13% 100%Econ. Dis. 11% 38% 39% 100%EL 16% 41% 44% 100%SWD 9% 24% 24% 100%
FCPSon
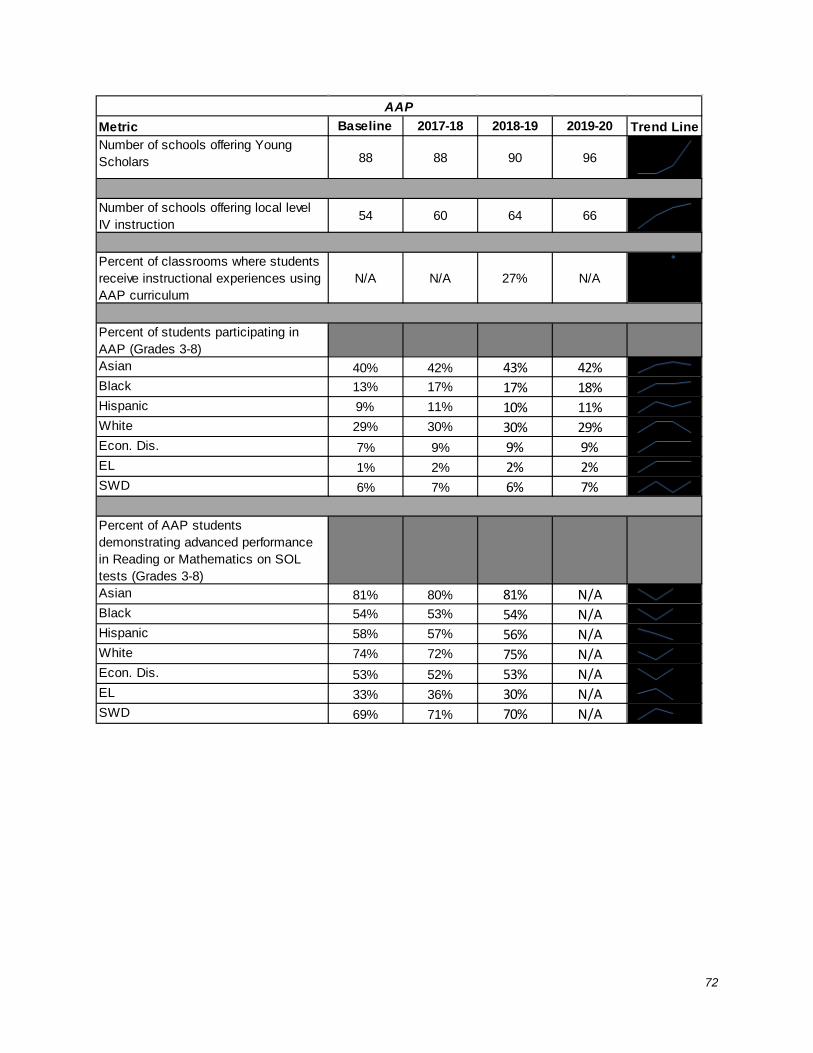
72
Metric Baseline 2017-18 2018-19 2019-20 Trend LineNumber of schools offering Young Scholars 88 88 90 96
Number of schools offering local level IV instruction
54 60 64 66
Percent of classrooms where students receive instructional experiences using AAP curriculum
N/A N/A 27% N/Ax x x
Percent of students participating in AAP (Grades 3-8)Asian 40% 42% 43% 42%Black 13% 17% 17% 18%Hispanic 9% 11% 10% 11%White 29% 30% 30% 29%Econ. Dis. 7% 9% 9% 9%EL 1% 2% 2% 2%SWD 6% 7% 6% 7%
Percent of AAP students demonstrating advanced performance in Reading or Mathematics on SOL tests (Grades 3-8)Asian 81% 80% 81% N/A xBlack 54% 53% 54% N/A xHispanic 58% 57% 56% N/A xWhite 74% 72% 75% N/A xEcon. Dis. 53% 52% 53% N/A xEL 33% 36% 30% N/A xSWD 69% 71% 70% N/A x
AAP
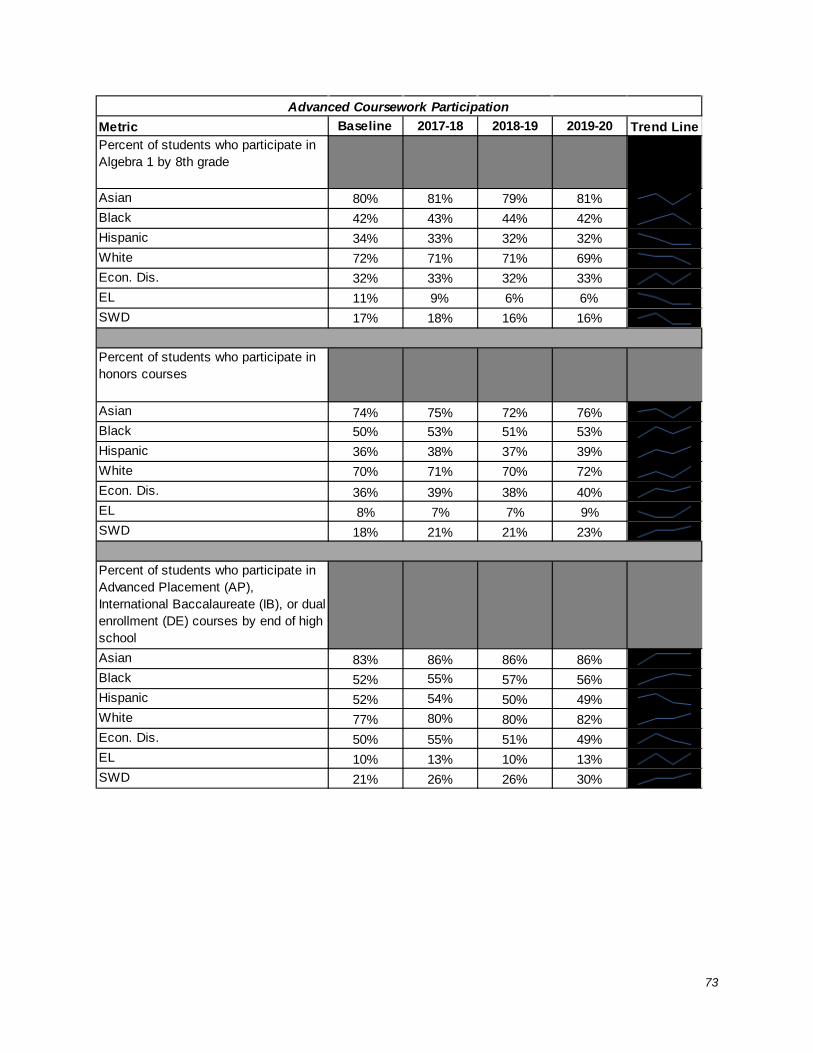
73
Metric Baseline 2017-18 2018-19 2019-20 Trend LinePercent of students who participate in Algebra 1 by 8th grade
Asian 80% 81% 79% 81%Black 42% 43% 44% 42%Hispanic 34% 33% 32% 32%White 72% 71% 71% 69%Econ. Dis. 32% 33% 32% 33%EL 11% 9% 6% 6%SWD 17% 18% 16% 16%
Percent of students who participate in honors courses
Asian 74% 75% 72% 76%Black 50% 53% 51% 53%Hispanic 36% 38% 37% 39%White 70% 71% 70% 72%Econ. Dis. 36% 39% 38% 40%EL 8% 7% 7% 9%SWD 18% 21% 21% 23%
Percent of students who participate in Advanced Placement (AP), International Baccalaureate (IB), or dual enrollment (DE) courses by end of high school Asian 83% 86% 86% 86%Black 52% 55% 57% 56%Hispanic 52% 54% 50% 49%White 77% 80% 80% 82%Econ. Dis. 50% 55% 51% 49%EL 10% 13% 10% 13%SWD 21% 26% 26% 30%
Advanced Coursework Participation
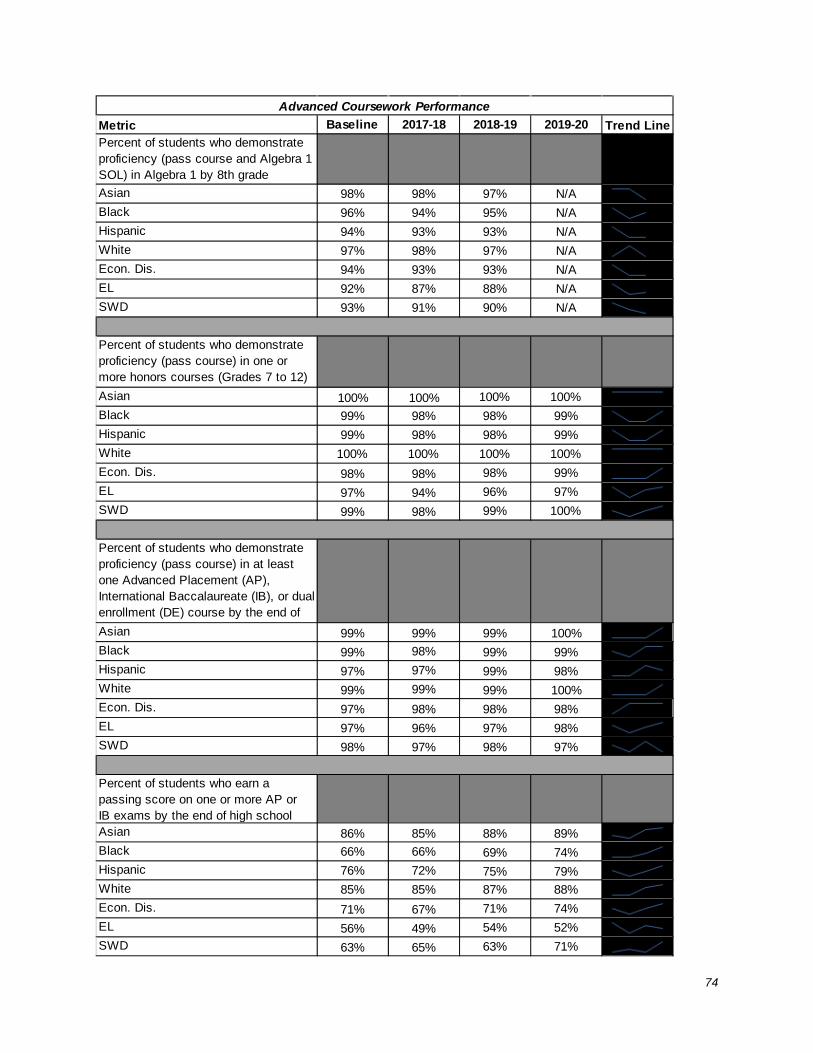
74
Metric Baseline 2017-18 2018-19 2019-20 Trend LinePercent of students who demonstrate proficiency (pass course and Algebra 1 SOL) in Algebra 1 by 8th grade Asian 98% 98% 97% N/A xBlack 96% 94% 95% N/A xHispanic 94% 93% 93% N/A xWhite 97% 98% 97% N/A xEcon. Dis. 94% 93% 93% N/A xEL 92% 87% 88% N/A xSWD 93% 91% 90% N/A x
Percent of students who demonstrate proficiency (pass course) in one or more honors courses (Grades 7 to 12) Asian 100% 100% 100% 100%Black 99% 98% 98% 99%Hispanic 99% 98% 98% 99%White 100% 100% 100% 100%Econ. Dis. 98% 98% 98% 99%EL 97% 94% 96% 97%SWD 99% 98% 99% 100%
Percent of students who demonstrate proficiency (pass course) in at least one Advanced Placement (AP), International Baccalaureate (IB), or dual enrollment (DE) course by the end of
Asian 99% 99% 99% 100%Black 99% 98% 99% 99%Hispanic 97% 97% 99% 98%White 99% 99% 99% 100%Econ. Dis. 97% 98% 98% 98%EL 97% 96% 97% 98%SWD 98% 97% 98% 97%
Percent of students who earn a passing score on one or more AP or IB exams by the end of high school Asian 86% 85% 88% 89%Black 66% 66% 69% 74%Hispanic 76% 72% 75% 79%White 85% 85% 87% 88%Econ. Dis. 71% 67% 71% 74%EL 56% 49% 54% 52%SWD 63% 65% 63% 71%
Advanced Coursework Performance
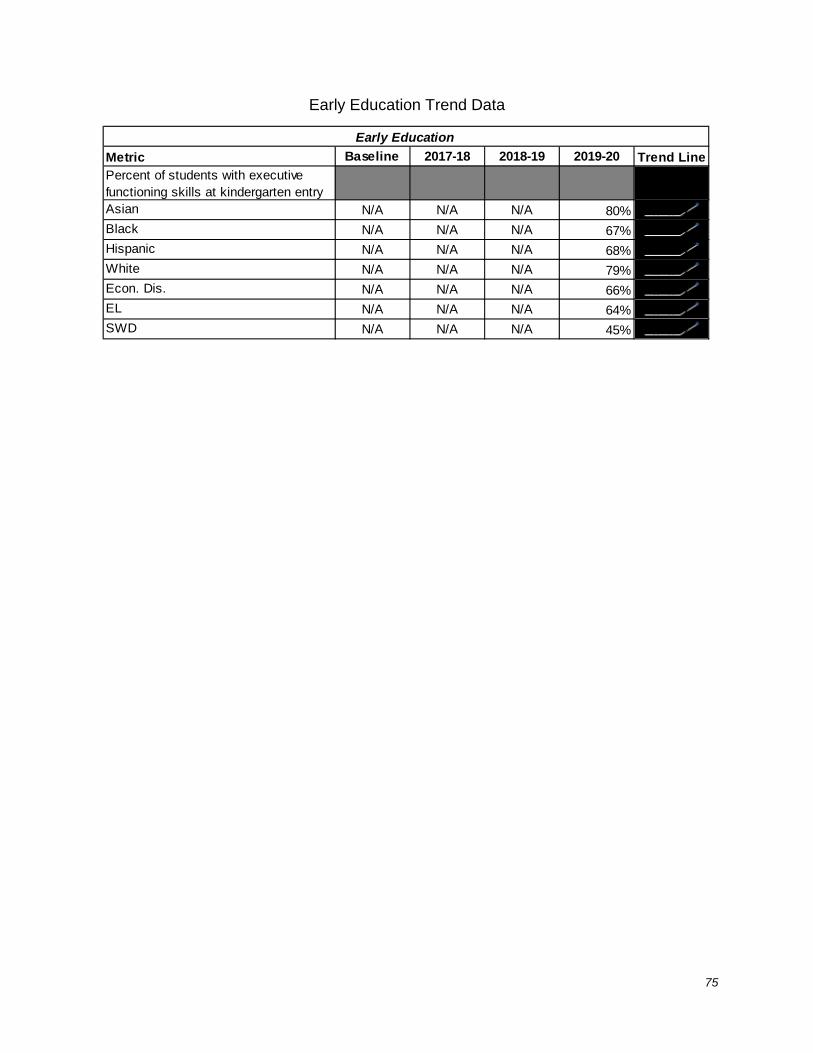
75
Early Education Trend Data
Metric Baseline 2017-18 2018-19 2019-20 Trend LinePercent of students with executive functioning skills at kindergarten entry Asian N/A N/A N/A 80% x x xBlack N/A N/A N/A 67% x x xHispanic N/A N/A N/A 68% x x xWhite N/A N/A N/A 79% x x xEcon. Dis. N/A N/A N/A 66% x x xEL N/A N/A N/A 64% x x xSWD N/A N/A N/A 45% x x x
Early Education
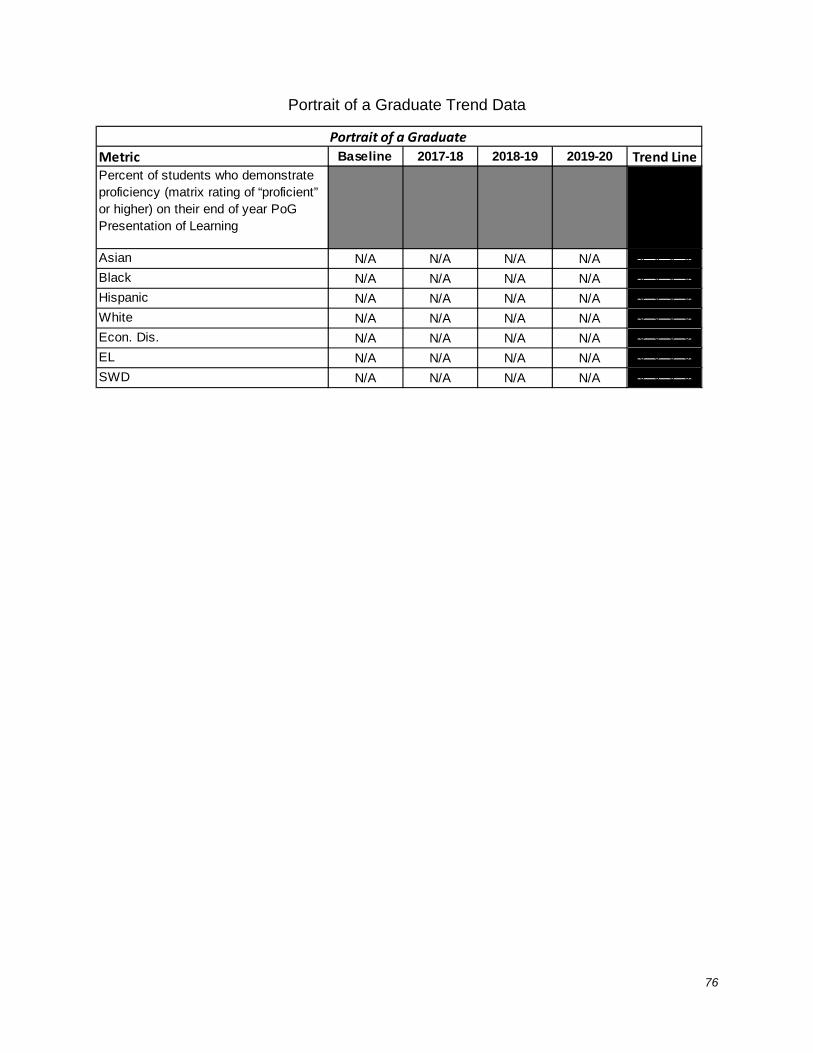
76
Portrait of a Graduate Trend Data
Metric Baseline 2017-18 2018-19 2019-20 Trend LinePercent of students who demonstrate proficiency (matrix rating of “proficient” or higher) on their end of year PoG Presentation of Learning
Asian N/A N/A N/A N/A x x x xBlack N/A N/A N/A N/A x x x xHispanic N/A N/A N/A N/A x x x xWhite N/A N/A N/A N/A x x x xEcon. Dis. N/A N/A N/A N/A x x x xEL N/A N/A N/A N/A x x x xSWD N/A N/A N/A N/A x x x x
Portrait of a Graduate

77
Appendix B
Funding to Support SY 2019-20 / FY 20 Strategic Actions
DESIRED OUTCOME: ELIMINATION OF GAPS
Aspiration SY 2019-20 Actions
FY20 Operating Costs by Action
FY20 Operating Costs by Aspiration
All students will be successful in reading and math. $11,276,839 Updated CAG Framework and supported integration into SIIPs $200,474
Developed high quality job-embedded coaching in reading and mathematics $1,151,564
Continued to implement EL Innovation Cohorts and the EL Innovation Networked Improvement Community $319,938
Continued to advance secondary literacy through development of concept-based curriculum units and expansion of lab sites to middle and high schools
$1,375,167
Supported divisionwide reading and mathematics MTSS implementation through utilization of self-assessment tool and expanded access to coaches $371,595
Provided Continuity of Learning resources to support Distance Learning $5,042,939
Through Project Momentum, provided individualized supports to schools, including professional development and financial resources, to strengthen their ability to meet state accreditation standards $2,815,162 All students will graduate on time, college or career ready $672,438 Increased resources provided to schools to ensure on-time graduation $613,792 Expanded parent and family outreach for College Success Programs $58,646
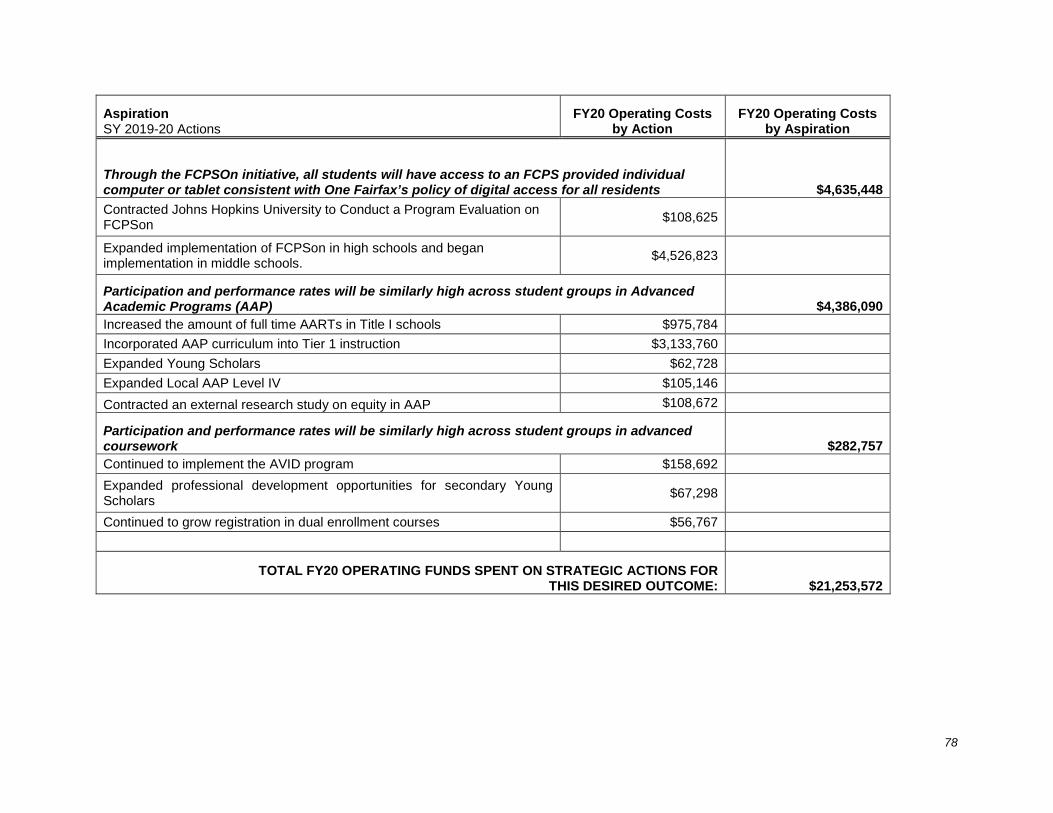
78
Aspiration SY 2019-20 Actions
FY20 Operating Costs by Action
FY20 Operating Costs by Aspiration
Through the FCPSOn initiative, all students will have access to an FCPS provided individual computer or tablet consistent with One Fairfax’s policy of digital access for all residents $4,635,448 Contracted Johns Hopkins University to Conduct a Program Evaluation on FCPSon $108,625
Expanded implementation of FCPSon in high schools and began implementation in middle schools. $4,526,823
Participation and performance rates will be similarly high across student groups in Advanced Academic Programs (AAP) $4,386,090 Increased the amount of full time AARTs in Title I schools $975,784 Incorporated AAP curriculum into Tier 1 instruction $3,133,760 Expanded Young Scholars $62,728 Expanded Local AAP Level IV $105,146 Contracted an external research study on equity in AAP $108,672
Participation and performance rates will be similarly high across student groups in advanced coursework $282,757 Continued to implement the AVID program $158,692 Expanded professional development opportunities for secondary Young Scholars $67,298
Continued to grow registration in dual enrollment courses $56,767
TOTAL FY20 OPERATING FUNDS SPENT ON STRATEGIC ACTIONS FOR THIS DESIRED OUTCOME: $21,253,572

79
DESIRED OUTCOME: EARLY EDUCATION
Aspiration SY 2019-20 Actions
FY20 Operating Costs by Action
FY20 Operating Costs by Aspiration
All future FCPS students will enter kindergarten with the essential skills needed for school success $12,611,157
Implemented the Family and Early Childhood Education Program (FECEP) $11,906,595
Expanded Bridge to Kindergarten $260,214 Partnered with Fairfax County community to implement the Equitable School Readiness Plan and provide professional development to prekindergarten providers and families $444,348
TOTAL FY20 OPERATING FUNDS SPENT ON STRATEGIC ACTIONS FOR THIS DESIRED OUTCOME: $ 12,611,157
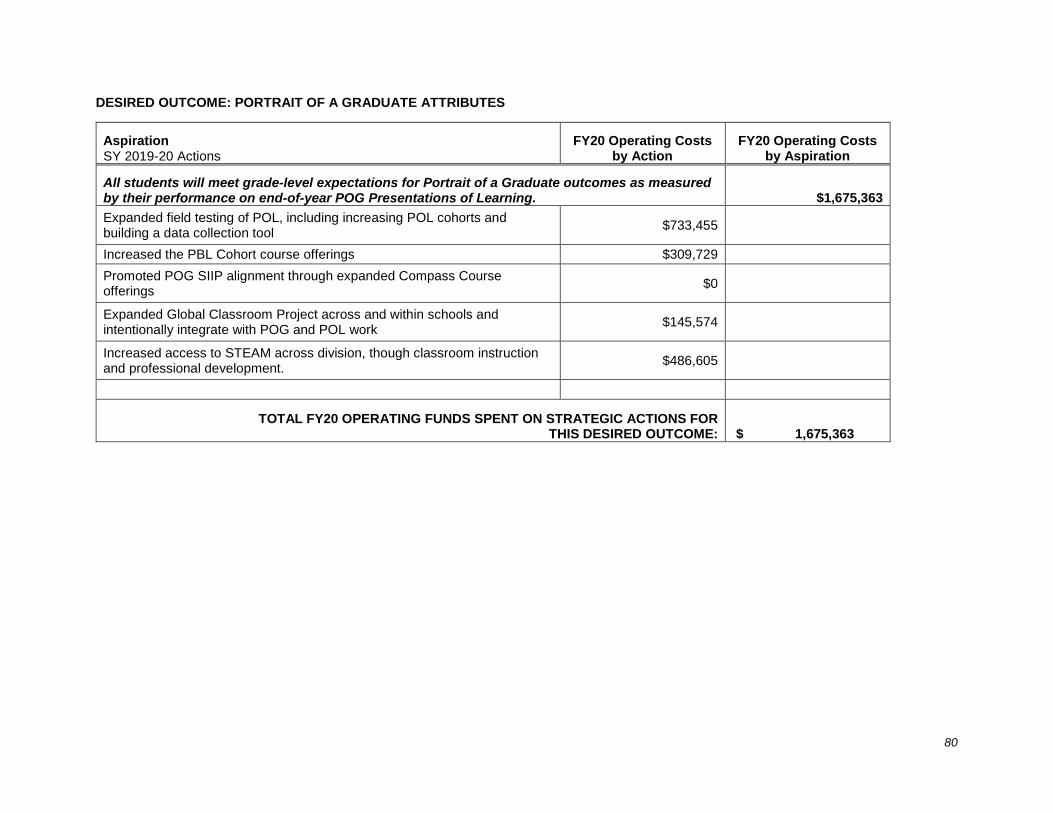
80
DESIRED OUTCOME: PORTRAIT OF A GRADUATE ATTRIBUTES
Aspiration SY 2019-20 Actions
FY20 Operating Costs by Action
FY20 Operating Costs by Aspiration
All students will meet grade-level expectations for Portrait of a Graduate outcomes as measured by their performance on end-of-year POG Presentations of Learning. $1,675,363 Expanded field testing of POL, including increasing POL cohorts and building a data collection tool $733,455
Increased the PBL Cohort course offerings $309,729 Promoted POG SIIP alignment through expanded Compass Course offerings $0
Expanded Global Classroom Project across and within schools and intentionally integrate with POG and POL work $145,574
Increased access to STEAM across division, though classroom instruction and professional development. $486,605
TOTAL FY20 OPERATING FUNDS SPENT ON STRATEGIC ACTIONS FOR THIS DESIRED OUTCOME: $ 1,675,363
81
Appendix C
Additional Performance Metrics
This section offers additional performance data on metrics that were not included in the main body of the report. These metrics were excluded from the main body of the report for the following reasons:
• The metric data were unavailable due to the COVID-19 pandemic • There were no strategic actions tied to the metric • Performance on the metric has been historically similar to performance this year, and
thus did not provide any additional information.
This Appendix is organized by Desired Outcome, and then Aspiration. The following Aspirations included all metrics in the main body of the report, and therefore are excluded from this Appendix.
• College and Career Readiness • FCPSon • Early Education • Portrait of a Graduate
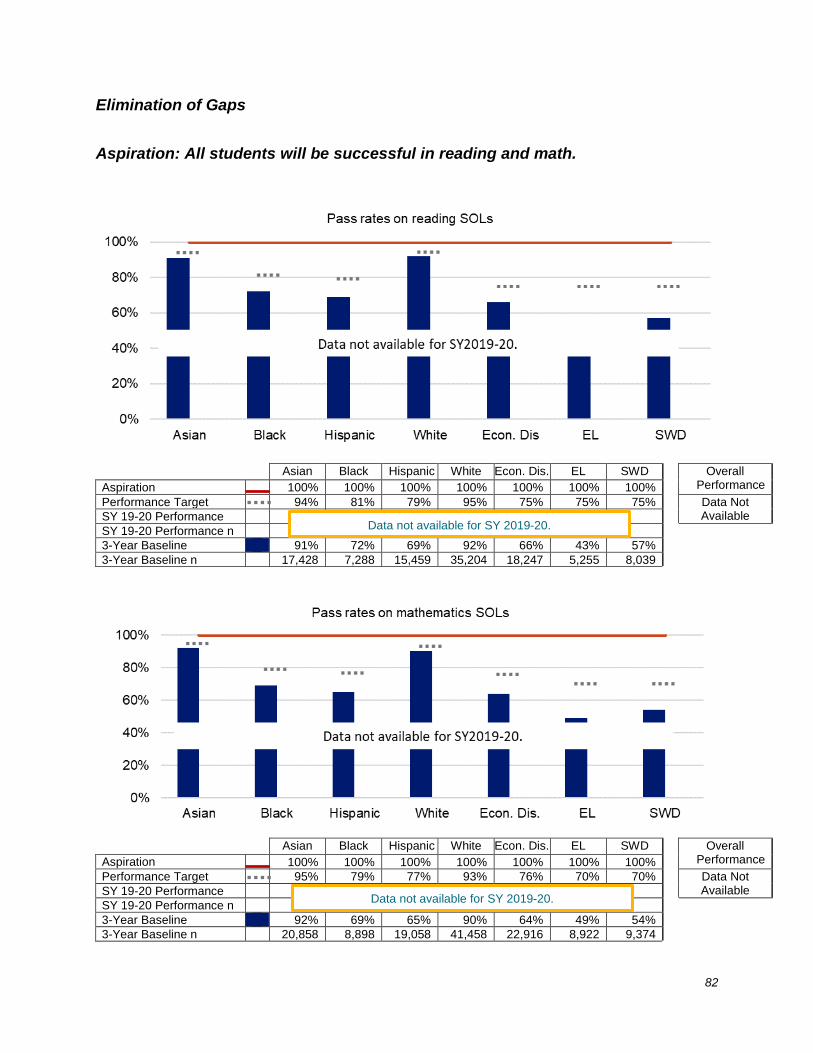
82
Elimination of Gaps Aspiration: All students will be successful in reading and math.
Asian Black Hispanic White Econ. Dis. EL SWD Overall Performance Aspiration 100% 100% 100% 100% 100% 100% 100%
Performance Target 94% 81% 79% 95% 75% 75% 75% Data Not Available SY 19-20 Performance
SY 19-20 Performance n 3-Year Baseline 91% 72% 69% 92% 66% 43% 57% 3-Year Baseline n 17,428 7,288 15,459 35,204 18,247 5,255 8,039
Asian Black Hispanic White Econ. Dis. EL SWD Overall Performance Aspiration 100% 100% 100% 100% 100% 100% 100%
Performance Target 95% 79% 77% 93% 76% 70% 70% Data Not Available SY 19-20 Performance
SY 19-20 Performance n 3-Year Baseline 92% 69% 65% 90% 64% 49% 54% 3-Year Baseline n 20,858 8,898 19,058 41,458 22,916 8,922 9,374
Data not available for SY 2019-20.
Data not available for SY 2019-20.
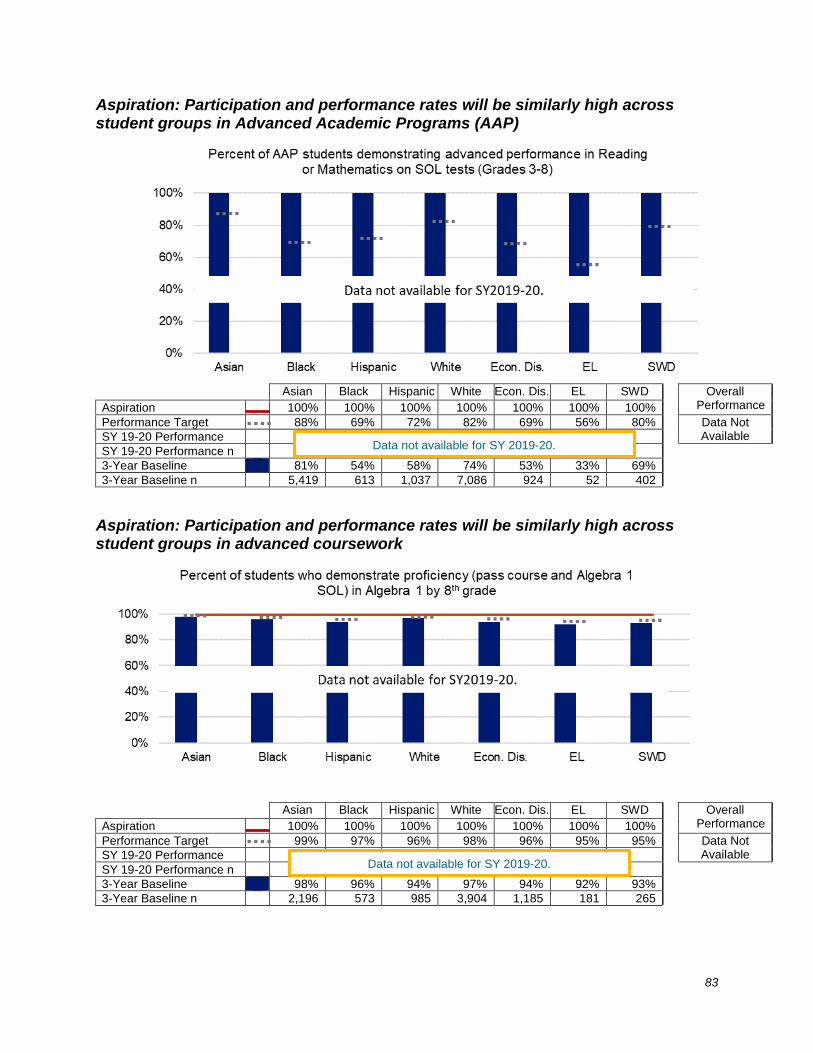
83
Aspiration: Participation and performance rates will be similarly high across student groups in Advanced Academic Programs (AAP)
Asian Black Hispanic White Econ. Dis. EL SWD Overall
Performance Aspiration 100% 100% 100% 100% 100% 100% 100% Performance Target 88% 69% 72% 82% 69% 56% 80% Data Not
Available SY 19-20 Performance SY 19-20 Performance n 3-Year Baseline 81% 54% 58% 74% 53% 33% 69% 3-Year Baseline n 5,419 613 1,037 7,086 924 52 402
Aspiration: Participation and performance rates will be similarly high across student groups in advanced coursework
Asian Black Hispanic White Econ. Dis. EL SWD Overall
Performance Aspiration 100% 100% 100% 100% 100% 100% 100% Performance Target 99% 97% 96% 98% 96% 95% 95% Data Not
Available SY 19-20 Performance SY 19-20 Performance n 3-Year Baseline 98% 96% 94% 97% 94% 92% 93% 3-Year Baseline n 2,196 573 985 3,904 1,185 181 265
Data not available for SY 2019-20.
Data not available for SY 2019-20.
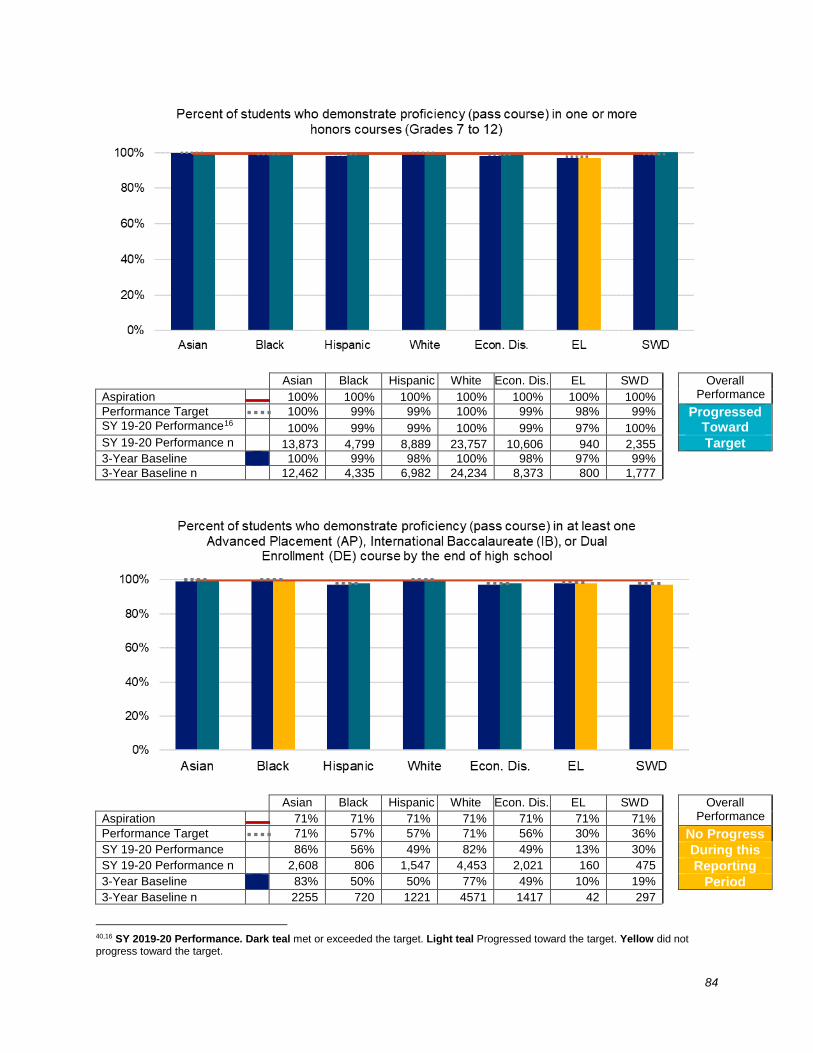
84
Asian Black Hispanic White Econ. Dis. EL SWD Overall Performance Aspiration 100% 100% 100% 100% 100% 100% 100%
Performance Target 100% 99% 99% 100% 99% 98% 99% Progressed Toward SY 19-20 Performance16 100% 99% 99% 100% 99% 97% 100%
SY 19-20 Performance n 13,873 4,799 8,889 23,757 10,606 940 2,355 Target 3-Year Baseline 100% 99% 98% 100% 98% 97% 99% 3-Year Baseline n 12,462 4,335 6,982 24,234 8,373 800 1,777
Asian Black Hispanic White Econ. Dis. EL SWD Overall Performance Aspiration 71% 71% 71% 71% 71% 71% 71%
Performance Target 71% 57% 57% 71% 56% 30% 36% No Progress SY 19-20 Performance 86% 56% 49% 82% 49% 13% 30% During this SY 19-20 Performance n 2,608 806 1,547 4,453 2,021 160 475 Reporting 3-Year Baseline 83% 50% 50% 77% 49% 10% 19% Period 3-Year Baseline n 2255 720 1221 4571 1417 42 297
40,16 SY 2019-20 Performance. Dark teal met or exceeded the target. Light teal Progressed toward the target. Yellow did not progress toward the target.
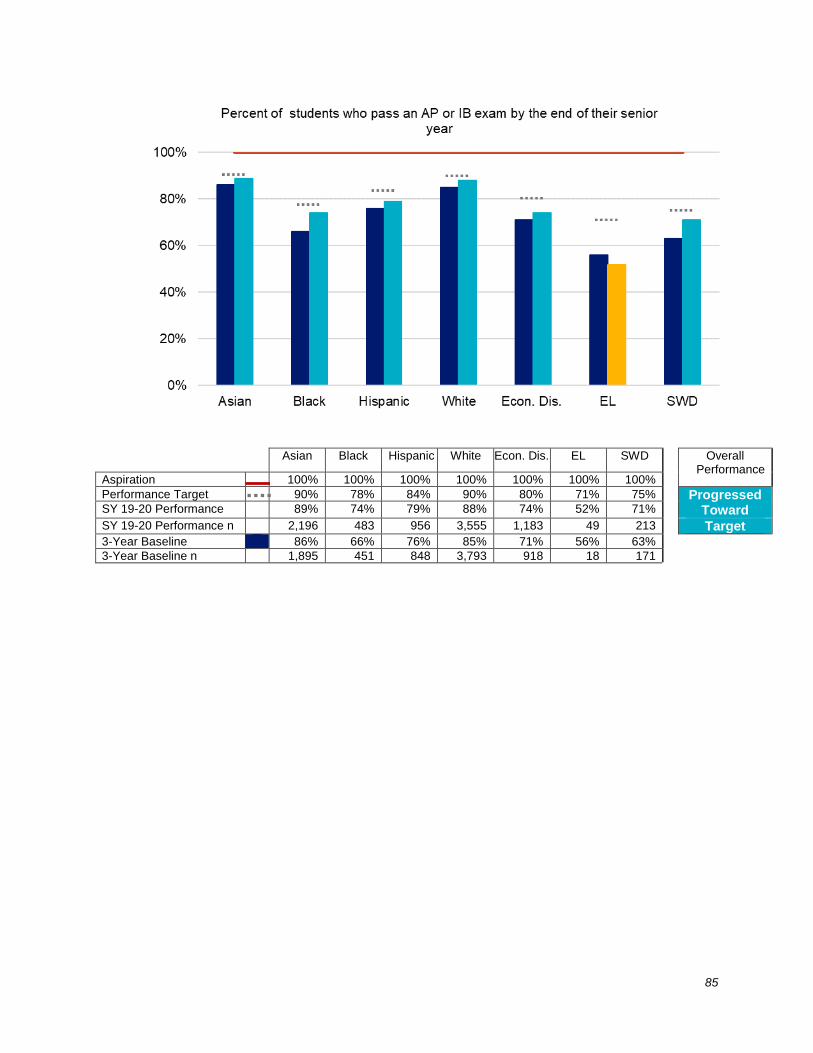
85
Asian Black Hispanic White Econ. Dis. EL SWD Overall Performance
Aspiration 100% 100% 100% 100% 100% 100% 100% Performance Target 90% 78% 84% 90% 80% 71% 75% Progressed
Toward SY 19-20 Performance 89% 74% 79% 88% 74% 52% 71% SY 19-20 Performance n 2,196 483 956 3,555 1,183 49 213 Target 3-Year Baseline 86% 66% 76% 85% 71% 56% 63% 3-Year Baseline n 1,895 451 848 3,793 918 18 171