orthogonal evolution of teams: a class of algorithms for evolving teams with inversely correlated...
Post on 22-Dec-2015
216 views
TRANSCRIPT

Orthogonal Evolution of Teams: A Class of Algorithms for Evolving
Teams with Inversely Correlated Errors
Terence Soule and Pavankumarreddy
Komireddy
This work is supported by NSF Grant #0535130

Teams/EnsemblesMultiple solutions that ‘cooperate’ to generate a solutionCooperation mechanisms:
Majority voteWeighted voteTeam leaderMultiple agents/distributed workload
Some problems are too hard to reasonably expect a monolithic solution

Island ModelP populations – best from each to make a team
I1,1
I1,2 I3,2
IN,1I3,1
I2,2
I2,1
I1,P
I1,i
I1,3
IN,P
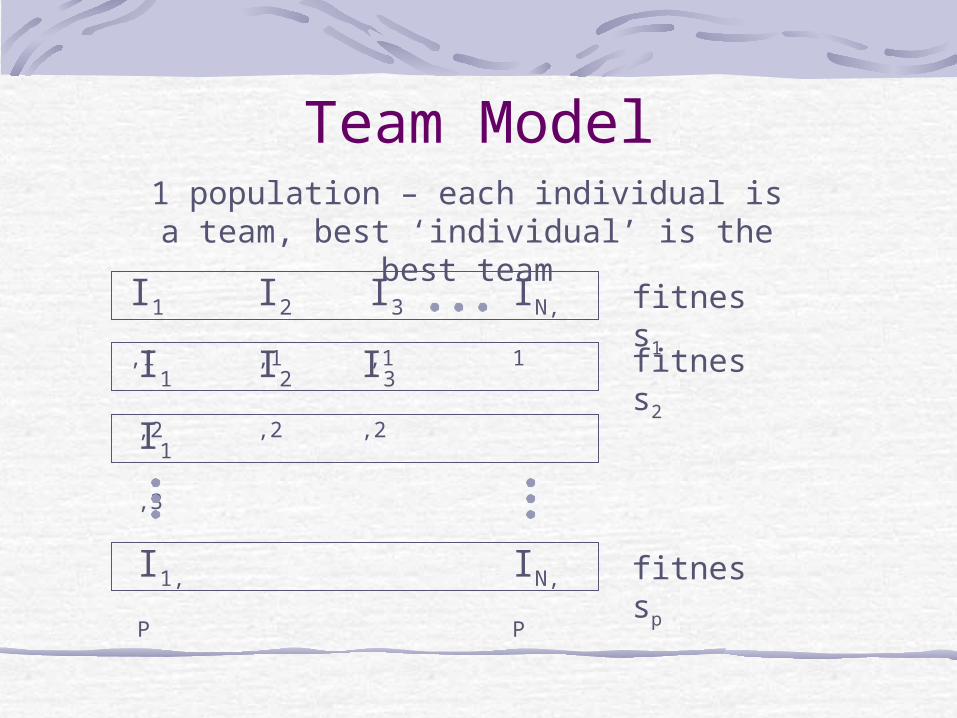
Team Model1 population – each individual is a team, best
‘individual’ is the best team
I1,1
I1,2 I3,2
IN,1I3,1
I2,2
I2,1
I1,P
I1,3
IN,P
fitness1
fitness2
fitnessp

Previous Results(?)
Island Model – Good individuals (=evolved individuals)Poor teams (worse than ‘expected’)
Team Model –Poor individuals (<< evolved individuals)Good teams (> evolved individuals)
Expected Failure Rate
kkN ppN
MKK
Nf )(1
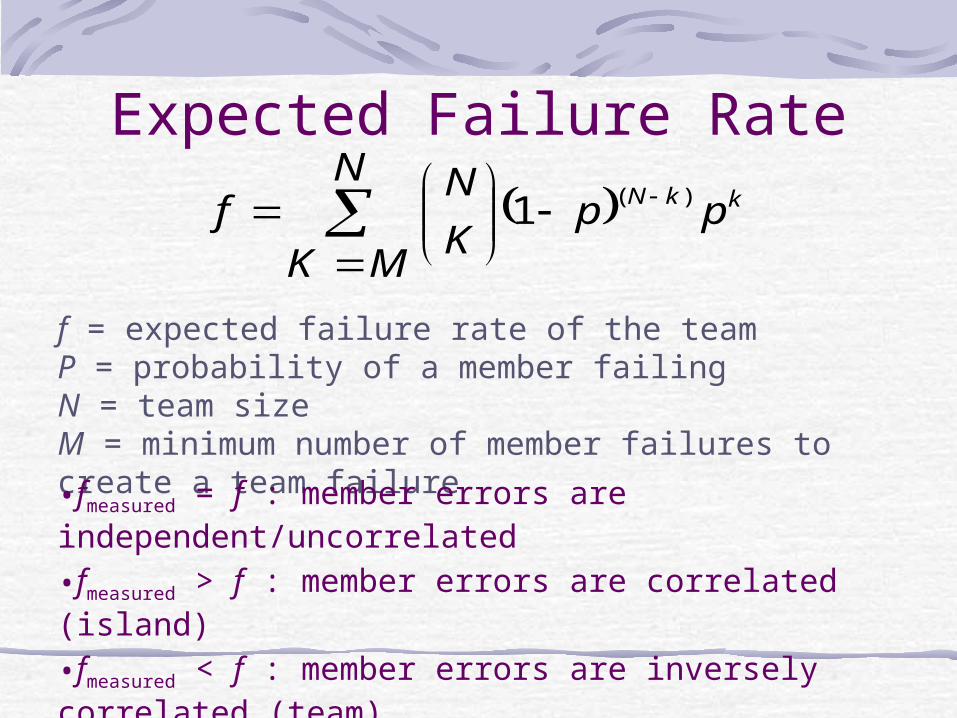
f = expected failure rate of the team P = probability of a member failingN = team sizeM = minimum number of member failures to create a team failure
•fmeasured = f : member errors are independent/uncorrelated
•fmeasured > f : member errors are correlated (island)
•fmeasured < f : member errors are inversely correlated (team)
Expected Failure Rate
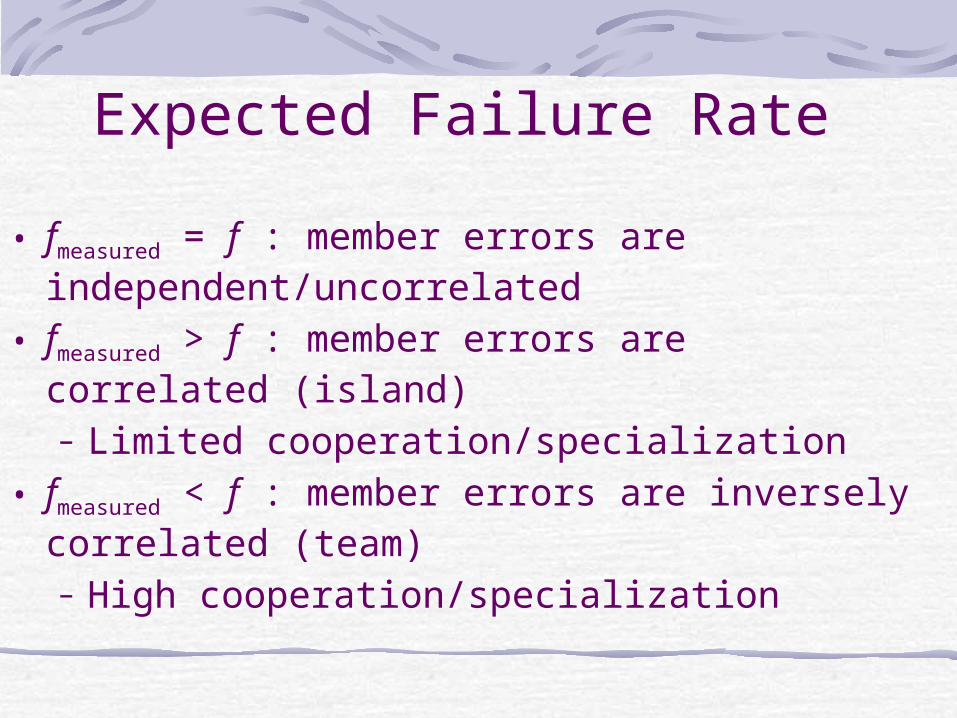
• fmeasured = f : member errors are independent/uncorrelated
• fmeasured > f : member errors are correlated (island)
– Limited cooperation/specialization• fmeasured < f : member errors are inversely correlated (team)
– High cooperation/specialization

Orthogonal Evolution
I1,1
I1,2 I3,2
IN,1I3,1
I2,2
I2,1
I1,P
I1,3
IN,P
fitness1
fitness2
fitnessp
fitness1,1
Alternately treat as islands and as teams
Orthogonal Evolution
I1,1
I1,2 I3,2
IN,1I3,1
I2,2
I2,1
I1,P
I1,3
IN,P
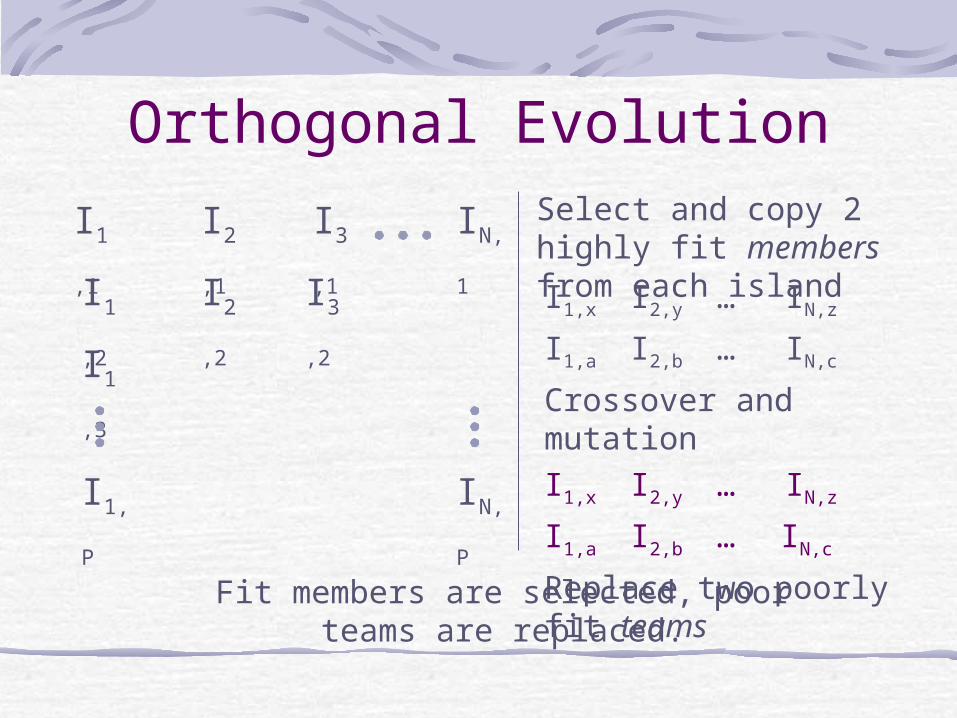
Select and copy 2 highly fit members from each island
I1,x I2,y … IN,z
I1,a I2,b … IN,c
Crossover and mutation
I1,x I2,y … IN,z
I1,a I2,b … IN,c
Replace two poorly fit teamsFit members are selected, poor teams are replaced.
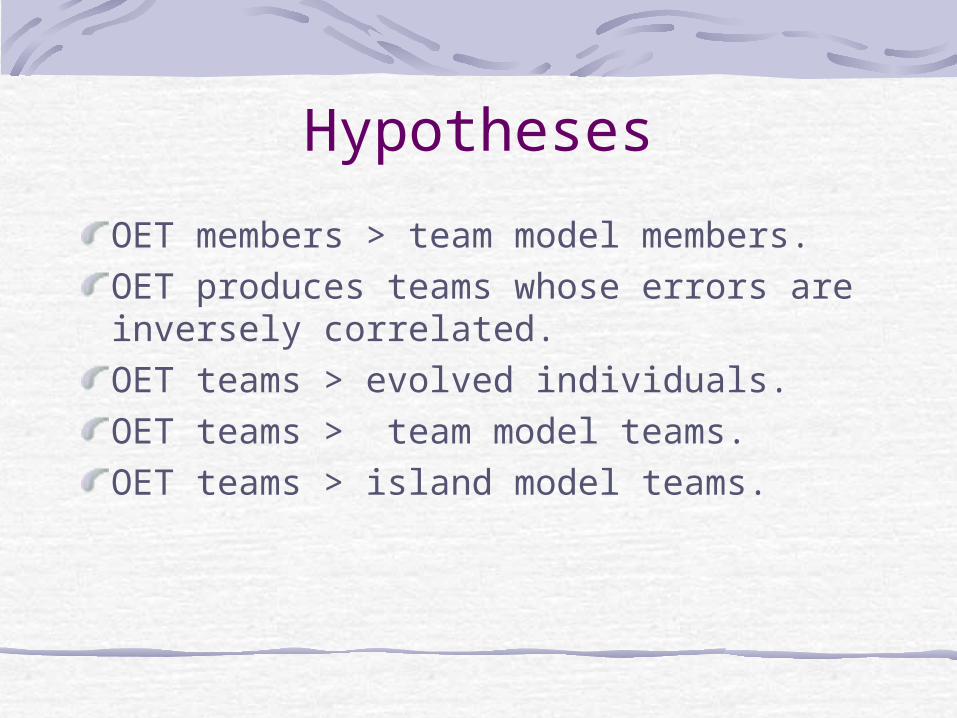
Hypotheses
OET members > team model members.OET produces teams whose errors are inversely correlated. OET teams > evolved individuals.OET teams > team model teams. OET teams > island model teams.

Illustrative ProblemIndividual:
Individual = | V1 | … | V70 |V {1,100}Fitness = number of unique values (max = 70)
Team: N individualsFitness = number of unique values in majority of individuals
5 | 6 | 3 | 13 | 7 | 5 | 38 | 2 | 9 | 14 | 2 | 3 | 23 | 8 | 6 | 11 | 8 | 4 | 1
3, 6, and 8 NOT 5 or 2
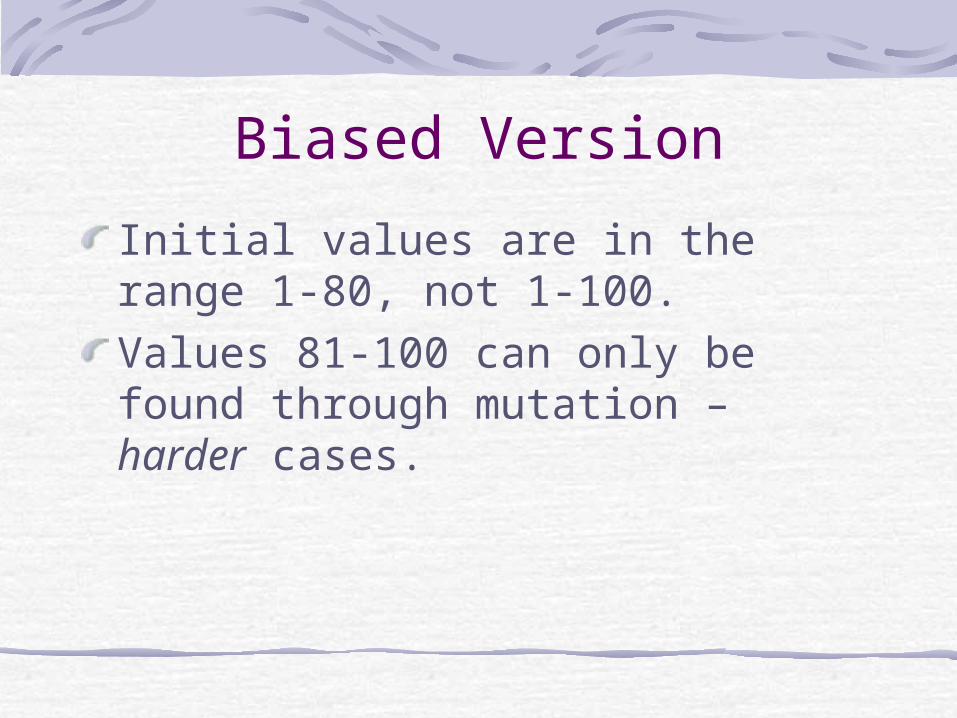
Biased Version
Initial values are in the range 1-80, not 1-100.Values 81-100 can only be found through mutation – harder cases.
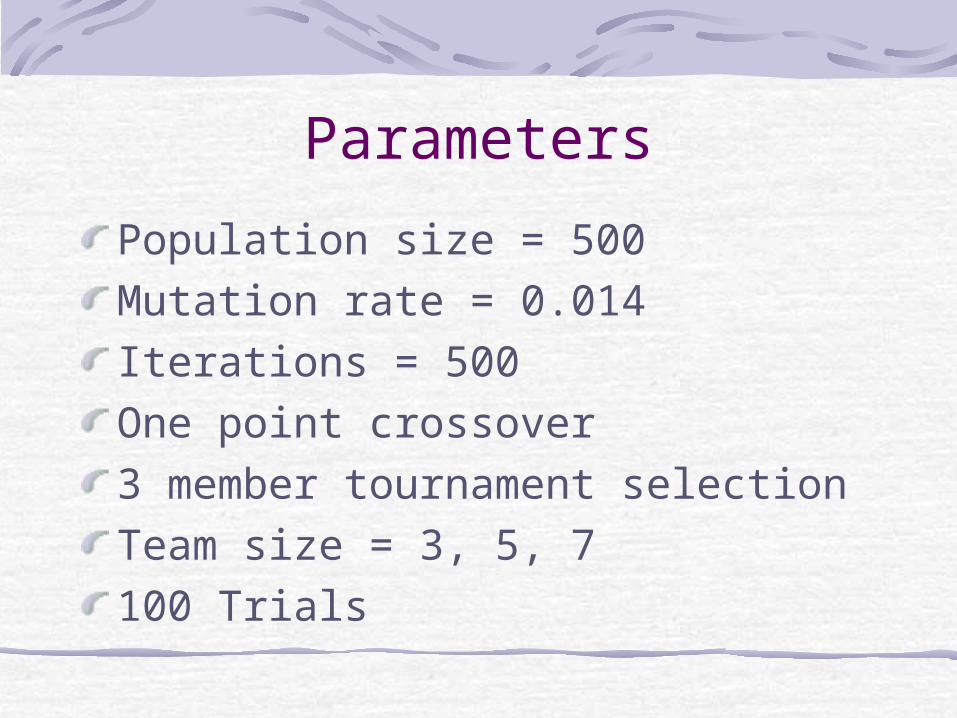
Parameters
Population size = 500Mutation rate = 0.014
Iterations = 500One point crossover3 member tournament selectionTeam size = 3, 5, 7100 Trials
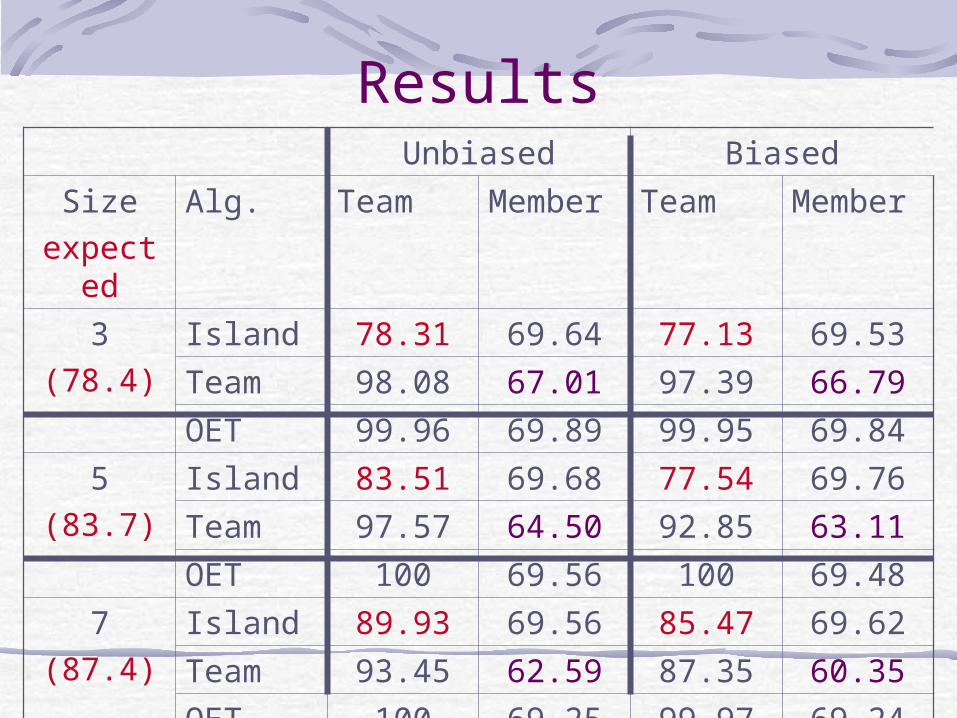
ResultsUnbiased Biased
Sizeexpecte
d
Alg. Team Member Team Member
3(78.4)
Island 78.31 69.64 77.13 69.53
Team 98.08 67.01 97.39 66.79
OET 99.96 69.89 99.95 69.84
5(83.7)
Island 83.51 69.68 77.54 69.76
Team 97.57 64.50 92.85 63.11
OET 100 69.56 100 69.48
7(87.4)
Island 89.93 69.56 85.47 69.62
Team 93.45 62.59 87.35 60.35
OET 100 69.25 99.97 69.24
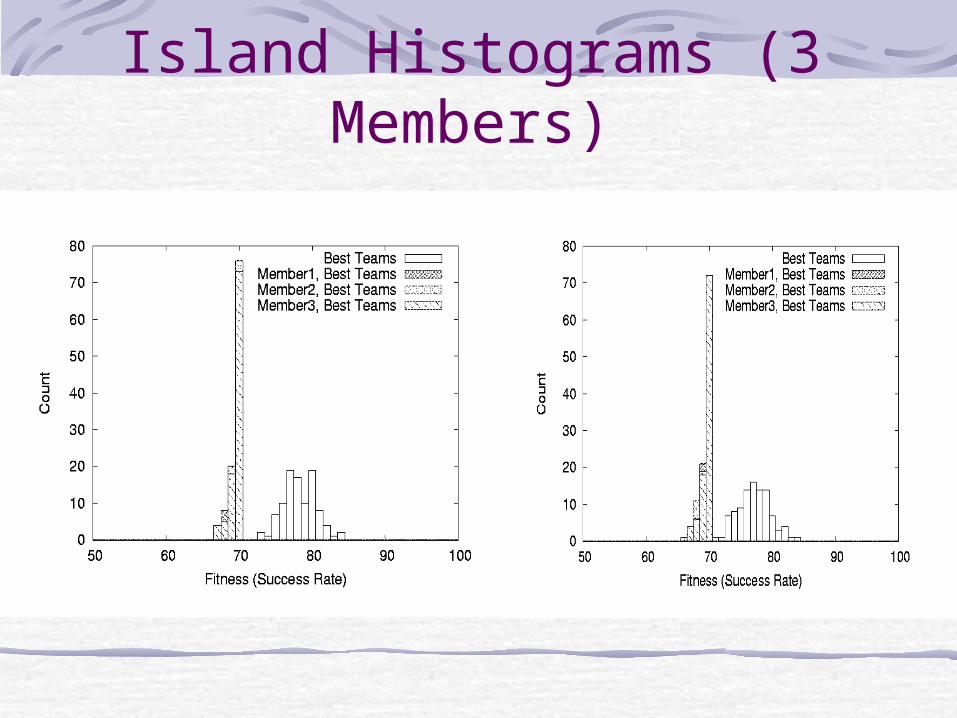
Island Histograms (3 Members)
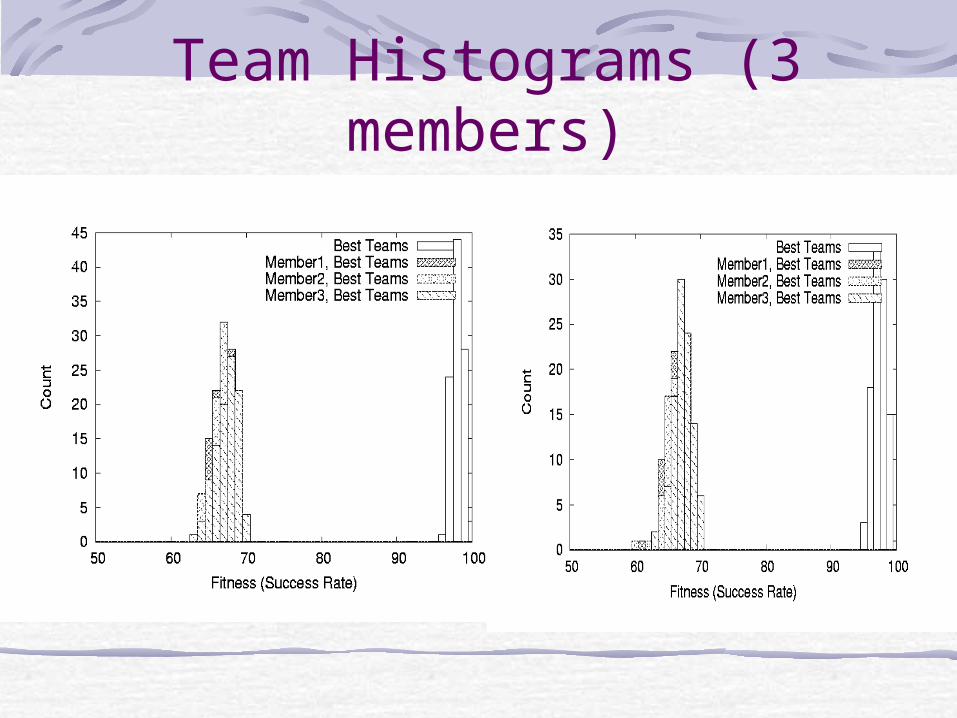
Team Histograms (3 members)
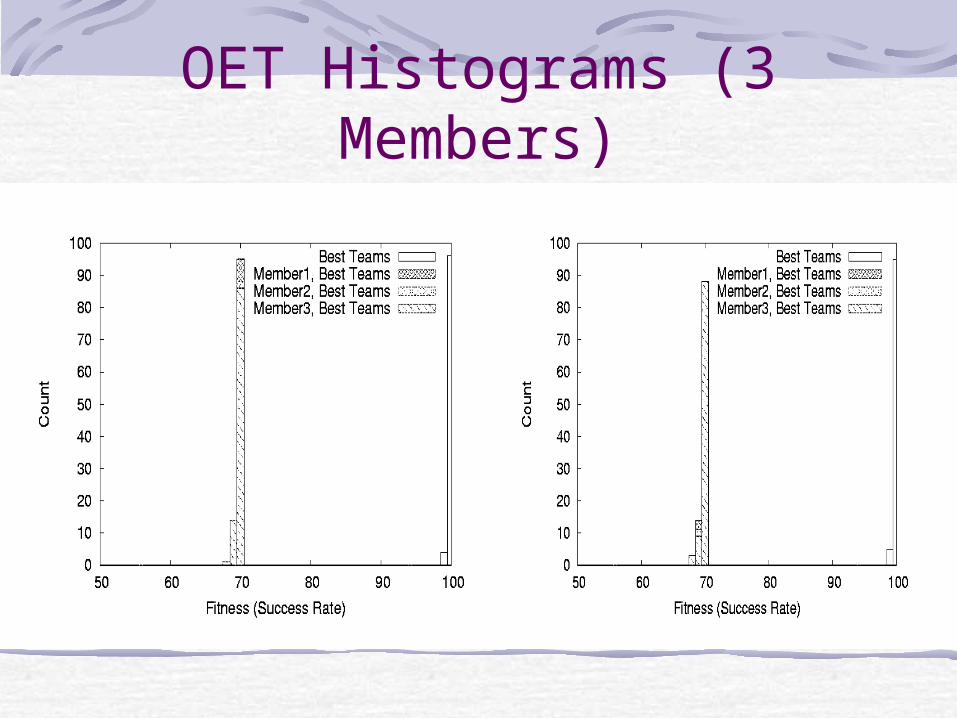
OET Histograms (3 Members)

Inter-twined SpiralsPopulation size = 400Mutation rate = 0.01 Iterations = 200,000 (600,000 for non-team)90/10 crossover3 member tournament selectionTeam size = 3Ramped half and half initialization40 Trials
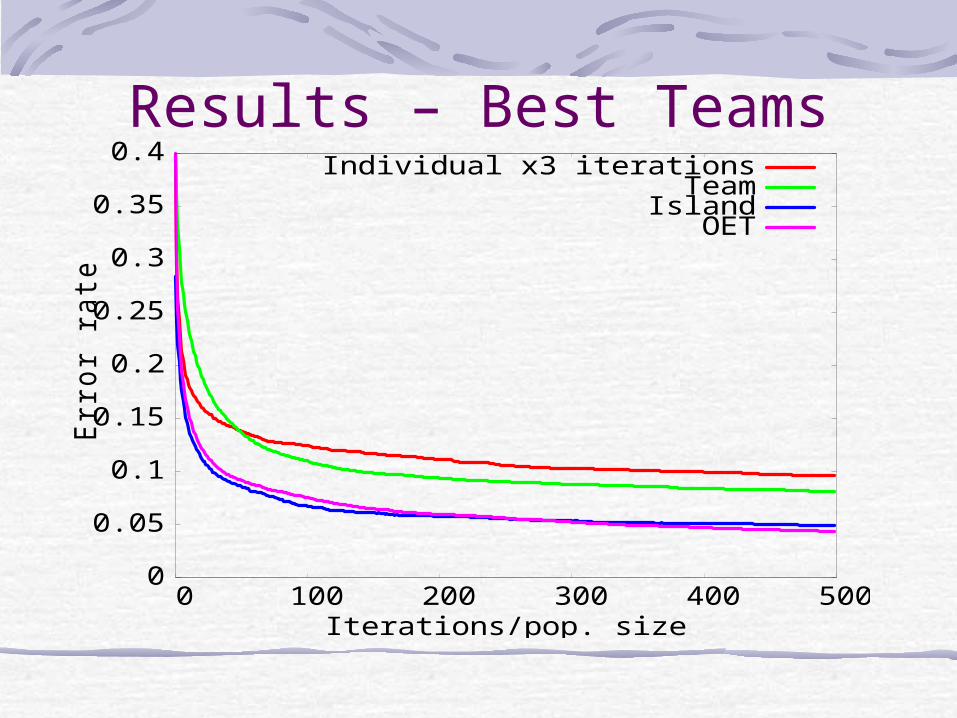
Results – Best Teams
0
0.05
0.1
0.15
0.2
0.25
0.3
0.35
0.4
0 100 200 300 400 500
Err
or
rate
Iterations/pop. size
Individual x3 iterationsTeamIsland
OET
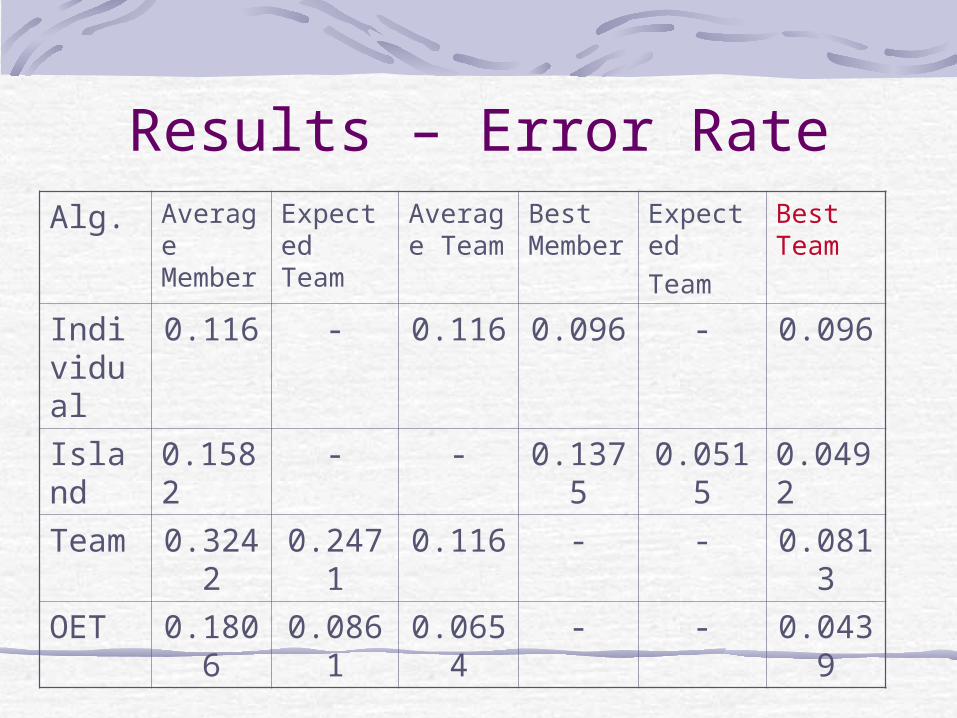
Results – Error RateAlg. Averag
e Member
Expected Team
Average Team
Best Member
ExpectedTeam
Best Team
Individual
0.116 - 0.116 0.096 - 0.096
Island
0.1582
- - 0.1375
0.0515
0.0492
Team 0.3242
0.2471
0.116 - - 0.0813
OET 0.1806
0.0861
0.0654
- - 0.0439
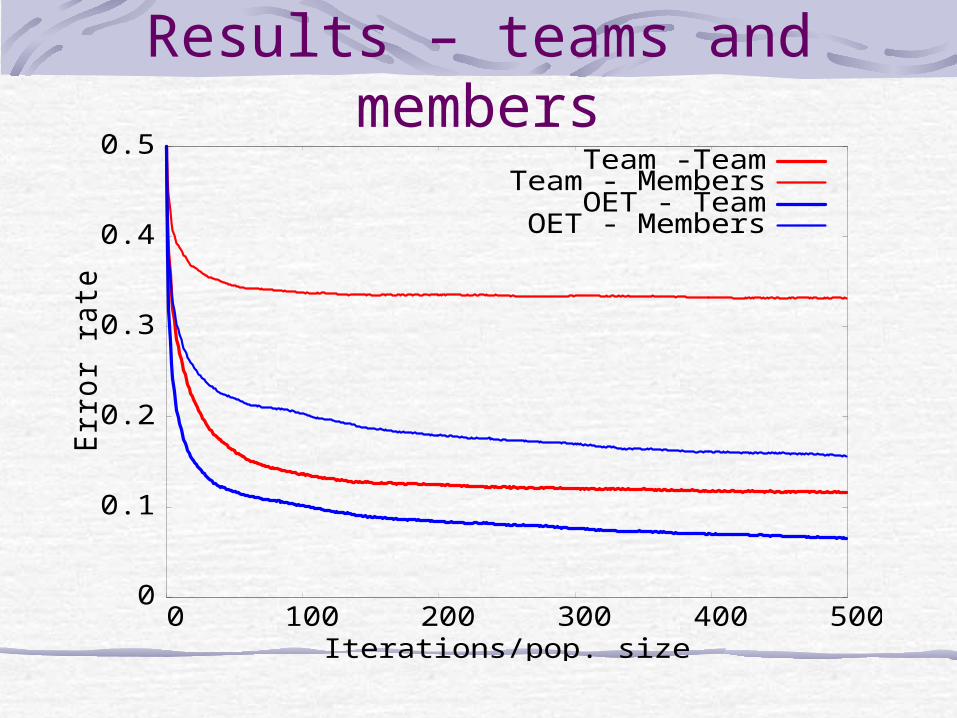
Results – teams and members
0
0.1
0.2
0.3
0.4
0.5
0 100 200 300 400 500
Err
or
rate
Iterations/pop. size
Team -TeamTeam - Members
OET - TeamOET - Members
ConclusionsEvolving ensembles helpsOET produces better team members than the team approach.OET produces teams whose errors are inversely correlated. OET teams > island model teams ???
DiscussionExpected fault tolerance model is useful for measuring cooperation/specializationIs it necessary to measure team members’ fitness?
Team model – noIsland, OET – yesCould use team fitness for, e.g., lead member’s fitness.

Thank You
Questions?