osat manufacturing systems group december 2003 changing
TRANSCRIPT

OSAT - Manufacturing Systems Group December 2003
CHANGING AUTOMOTIVE BODY MEASUREMENT SYSTEM PARADIGMS WITH
3D NON-CONTACT MEASUREMENT SYSTEMS
A Comparison of CMM vs. CogniTens Optigo 3D Non-Contact System
UMTRI Technical Report: UMTRI-2003-43
Patrick C. Hammett, Ph.D., Kenneth D. Frescoln and Luis Garcia-Guzman, Ph.D. Office for the Study of Automotive Transportation (OSAT)
University of Michigan Transportation Research Institute (UMTRI) The University of Michigan
2901 Baxter Road Ann Arbor, Michigan 48109-2150
December 5,2003

OSAT - Manufacturing Systems Group
Technical Report Documentation Page
December, 2003
1. Report No.
UMTRI-2003 -43 2. Government Accession No. 3. Recipient's Catalog No.
4. Title and Subtitle
Changing Automotive Body Measurement System Paradigms with 3D Nan-Contact Measurement Systems
7. Authorjs)
Hammett, P.C., Frescoln, K.D., and Garcia-Guzman, L. 9. Performing Organization Name and Address
The University of Michigan Transportation Research Institute 2901 Baxter Road Ann Arbor, Michigan 48 109-2150 U.S.A. 12. Sponsoring Agency Name and Address
General Motors - NAO Small Car 1420 Stephenson Hwy. P.O. Box 7025 MC: 480-991-320 Troy, MI 48083 15. Supplementary Notes
5. Report Date
December 2003 6. Performing Organization Code
379078 8. Performing Organization Report No.
UMTRI-2003-43 10. Work Unit no. (TRAIS)
11. Contract or Grant No.
NO02690
13. Type of Report and Period Covered
14. Sponsoring Agency Code
16. Abstract
This report assesses the measurement system capability of the 3D non-contact measurement system Optigo 200, produced by CogniTens Ltd. The Optigo 200 is portable, manually operated, and uses CCD cameras to create 3D past feature representations that can compared to part design nominal conditions. To evaluate the effectiveness of this system, Optigo measurement readings are compared to measurements of the same panels using Coordinate Measuring Machine (CMM) systems.
This report examines several potential sources of measurement system variation including repeatability (both static and dynamic), reproducibility, and accuracy. The parts used include a rear compartment side rail, a structural reinforcement, and a hood inner panel. Using these panels, various past features are analyzed including surface points, trim edge points, and hole positions.
The results suggest that the Optigo 200 system is capable of meeting typical industry Gage R&R standards, measured by comparing measurement system capability relative to either historical part variation values or typical tolerance widths. Overall, the results indicate that the average Gage R&R for the Optigo system, in terms of 5.150RkR. is 0.20 (or k 0.12 in terms of k 3sigma metric). This is slightly higher than the results involving the same parts using the CMM. The CMM average Gage R&R, in terms of 5.150RkR. was 0.13 (or f 0.08 in terms of * 3sigma). Still, these data suggest that the Optigo system is capable of measuring parts with tolerances of approximately f 0.4 or higher.
More importantly, a correlation and mean bias study between the Optigo 200 system and the CMM suggests a very strong correlation with only a small magnitude difference between systems. In general, the Optigo system measured within 0.1 mm of CMM measurements at common discrete point locations. This finding demonstrates that the Optigo 3D noncontact system may replicate the CMM system.
The overall conclusion of this report is that the Optigo system represents a viable measurement system alternative for automotive body manufacturing in terms of measurement system capability. In addition, the Optigo system offers significant advantages over traditional discrete point measurement systems in terms of diagnostic capability.
18. D~stribution Statement
Unlimited
22. Price
17. Key Words
measurement system capability, 3D non-contact measurement system, CMM, Optigo, sheet metal stamping, automotive body, Gage R&R 19. Security Classification (of this report)
None 20. Security Classification (of t hs page)
None 21. No. of Pages
28

OSAT - Manufacturing Systems Group
Table of Contents
December, 2003
List of Figures and Tables iv
Executive Summary v
1. Introduction 1
2. 3D Non-Contact Measurement and the CogniTens System 4
3. Potential Sources of Measurement Variation 8
4. Measurement System Analysis Case Studies 12
4.1 Mapping Process Measurement Error and Static Repeatability 12
4.2 Gage Repeatability and Reproducibility Analysis 15
4.3 Optigo Vs. CMM: Feature Correlation and Accuracy 19
5. Conclusions 22
References 23

OSAT - Manufacturing Systems Group
List of Figures and Tables
December, 2003
Figures
Figure 1. Sample Checking Fixture with Discrete Point Measurement Location 1
Figure 2. Sample Output from a CogniTens Optigo 200 System 3
Figure 3. Measuring a Stamping Rail Panel Using Targets 5
Figure 4. Measurement Results Relative to CAD Design Nominals 6
Figure 5. Hood Inner Panel Measurement Results with Discrete Points 7
Figure 6. Accuracy, Repeatability, and Reproducibility 8
Figure 7. Global Body Coordinate System (Front, Center, Bottom: 0,0,0) 10
Figure 8. Part Feature Types 11
Figure 9. Rail Study: Mapping Effect and Static Repeatability 12
Figure 10. Rail Measurements 13
Figure 11. Structural Reinforcement Panel with Discrete Point Dimensions 16
Figure 12. Correlation Differences for Each Set of Panel Measurement by Type 2 1
Figure 13. Mean Differences for Each Set of Panel Measurement by Feature Type 21
Tables
Table 1. Fixture Mapping Effect
Table 2. Static Repeatability Error (Note: Average CMM Gstatic - 0.007) 14
Table 3. Static Repeatability Error by Feature Type (Rail Part) 15
Table 4. Full Gage R&R Comparison: CMM vs. Optigo 16
Table 5. Gage R&R Relative to Historical Variation and Tolerances 17
Table 6. Gage R&R Relative to Observed Study Variation 18
Table 7. Theoretical Tolerances and Measurable Inherent Part Variation 19
Table 8. Reinforcement Panel Correlation1 Mean Bias Measurement Differences 20

OSAT - Manufacturing Systems Group December 2003
Executive Summary
The purpose of this report is to assess the measurement system capability of a 3D non-
contact measurement system. Three-dimensional non-contact systems generate thousands of
measurements or a cloud of points. For complex-shaped parts, point cloud data provides a means
to fully characterize a part shape, as opposed to only measuring at discrete point locations. A
main driver for 3D non-contact measurement point cloud data is that it provides an enhanced
problem solving diagnostic capability for lower total measurement system costs.
The non-contact system used for this study is the Optigo 200 produced by CogniTens,
Ltd. This system is a portable, manually operated non-contact measurement system that uses
CCD cameras to create 3D part feature representations that may be compared to part design
nominal conditions. To evaluate the effectiveness of this system, Optigo 200 measurement
readings were compared to measurements of the same panels using Coordinate Measuring
Machine (CMM) systems.
This report examines several potential sources of measurement system variation
including repeatability (both static and dynamic), reproducibility, and accuracy. Accuracy
measurements are based on comparing Optigo 200 data to CMM measurements for identical
automotive stamped parts. The parts used in the case study include a rear compartment side rail,
a structural reinforcement, and a hood inner panel. Using these panels, various part features are
analyzed including surface points, trim edge points, and hole positions.
The results of these studies suggest that the Optigo 200 is capable of meeting typical
industry Gage R&R standards, measured by comparing measurement system capability relative
either to historical part variation values or to typical tolerance widths. Overall, the results of the
case studies indicate that the average Gage R&R for the Optigo system, in terms of 5.150RaR, is
0.20 (or k 0.12 in terms of k 3sigma metric). This is slightly higher than the results involving the
same parts using the CMM. The CMM average Gage R&R, in terms of 5.150RkR, was 0.13 (or
k 0.08 in terms of k 3sigma). Still, these data suggest that the Optigo 200 is capable of
measuring parts with tolerances of approximately h 0.4 or higher. (Note: Typical surface and
trim edge tolerances for sheet metal parts are h 0.5 mm or higher.)
More importantly, a correlation and mean bias study between the Optigo 200 system and
the CMM suggest a very strong correlation with only a small magnitude difference between
OSAT - Manufacturing Systems Group December, 2003
systems. In general, the Optigo system measured within 0.1 mm of CMM measurements at
common discrete point locations. This finding demonstrates that the Optigo 200 3D non-contact
system may replicate the CMM system.
Although the Optigo system is shown capable of meeting typical industry measurement
capability standards, some potential challenges exist. For example, the static repeatability of the
Optigo system was not as high as that achieved by the CMM. One explanation is that the CMM
uses a physical touch probe moving along an ijk vector path normal to the part surface. This
appears to allow for better static repeatability than does the 3D non-contact system, which must
virtually calculate the normal-to-surface measurements at discrete point locations. In addition,
some small differences between systems may exist due to the location at which a feature is
measured. In the case of trim edge points, the Optigo system measures along the top surface of
the part whereas a CMM may measure in the middle of the blank. Overall, these differences are
considered relatively minor.
The overall conclusion of this study is that the Optigo 200 system represents a viable
measurement system alternative for automotive body manufacturing in terms of measurement
system capability. In addition, the Optigo system offers significant advantages over traditional
discrete point measurement systems in terms of diagnostic capability. The system provides the
ability to fully measure a panel shape and thus the potential to make better decisions on how best
to resolve downstream process dimensional concerns.

OSAT - Manufacturing Systems Group December, 2003
1. Introduction
Part measurement systems used in automotive body applications largely consist of
discrete point inspection. Here, a manufacturer takes a stamped or welded assembly part and
identifies key features at specific discrete locations defined by three-dimensional coordinates
(X,Y, and Z). Manufacturers then measure these discrete locations relative to part design
nominal dimensions. These discrete measurements are typically made using either Coordinate
Measuring Machines (CMM) or traditional checking fixtures with electronic data collection
bushings and measurement probes (see Figure 1). This approach closely links the cost of
checking (e.g., time and resources to measure at a specific location) with the number of discrete
points identified. As a result, automotive body manufacturers often seek to minimize the number
of discrete inspection points to reduce costs.
Figure 1. Sample Checking Fixture with Discrete Point Measurement Location
One concern with trying to minimize the number of discrete measurement locations is
that a manufacturer may not fully comprehend potential problem areas. For instance, body
manufacturing problems tend to arise in areas not being checked. In addition, some part
characteristics such as flatness, parallelism of a mating surface, or trim edge consistency become
very difficult to evaluate using discrete points, as each of these characteristics requires multiple

OSAT - Manufacturing Systems Group December, 2003
discrete points to estimate. Another concern with discrete point checking systems is that a
manufacturer may not be able to pre-define which discrete point locations are critical during the
part design and development process. Thus, manufacturers often incur significant costs during
the product lifecycle for adding, changing, or deleting discrete point locations.
One strategy that mitigates some of the above concerns is to utilize Coordinate
Measuring Machine (CMM) inspection systems. CMMs provide greater flexibility by allowing
addindchanginddeleting inspection points through programming, versus having to make hard
tooling changes as required by traditional check fixtures with electronic data collection bushings.
CMM inspection, however, is primarily just a more flexible discrete point measurement system.
It has limited capability in evaluating complex part shapes and other characteristics such as
consistency of an entire surface, part radii, or parallelism. For these particular features, it requires
a significant number of pre-programmed discrete measurement points. For example, to fully
comprehend a door assembly, a manufacturer using a CMM might require pre-programming
200-300 discrete point locations. Unfortunately, measuring a large data set with a CMM may
take four to eight hours for a single part, and comprehensive information regarding the part shape
still may not be fully represented. In addition, the engineering development and metrology
resources needed to determine the desired X,Y,Z location and the respective angle of
measurement approach (often defined by an i j ,k approach vector) for a large CMM data set of a
complex part often makes this activity cost prohibitive. Also of concern with CMM systems are
the transportation costs associated with moving parts to a special inspection room.
These traditional check fixture and CMM limitations have resulted in the adoption of
non-contact discrete point vision systems. These systems, made popular by Perceptron, are
widely used for in-line measurement, particularly in automotive body shops to measure large
body sides, underbodies, and main body assemblies. In-line vision systems usually incorporate
either several fixed position cameras in a work cell or a few cameras mounted to robots. As an
example, a full body might require four robots to access all of the discrete point locations.
Historically, these systems have provided tremendous advantages in terms of ease of data
collection for discrete point measurements. Still, they have limitations similar to CMMs in terms
of their strong cost and time dependency on the number of discrete point locations. As a result,
cost considerations often force manufacturers to measure fewer points than desired.

OSAT - Manufacturing Systems Group December, 2003
Recently, the development of 3D non-contact measurement systems that generate point
cloud data offers the potential to replace or augment these traditional discrete point checking
systems (e.g., traditional hard tooling check fixtures, in-line vision systems, and CMM systems).
These 3D non-contact point cloud systems offer the flexibility to measure the full part shape (or
critical part areas) as well as provide measurements at discrete point locations which typically
are necessary to satisfy data sampling requirements for process capability analysis studies.
Figure 2 illustrates sample output from a 3D non-contact measurement system for a hood inner
panel using the CogniTens' Optigo 200. For this particular example, only certain areas of the
part were measured, as indicated by the colored areas. In addition, the colored balls represent
discrete point locations, whereas the remaining areas represent clouds of points. These clouds of
points illustrate the conformance of the part surface to the CAD design nominal values. Note:
Dark blue and dark red represent areas with the largest deviations from nominal.
Figure 2. Sample Output from a CogniTens Optigo 200 System
3
OSAT - Manufacturing Systems Group December, 2003
For automotive body applications, CMMs are the typical standard to which to compare
new measurement technology systems. For instance, organizations using in-line vision systems
routinely calibrate their process measurements based on correlation studies with CMM systems.
In fact, manufacturers commonly incorporate "mean offsets" in their in-line vision systems to
correlate the mean dimensions from the in-process inspection studies to their CMM reports. This
practice is common because differences in measurement algorithms and the physical tooling
locators used to hold parts during measurement can result in inherent mean biases between
systems. The need for these "mean offsets" due to inherent fixture biases represents another
measurement system challenge. Although these mean offsets are typically related to fixture
differences rather than limitations of vision system technology, most companies desire new
technology that matches CMM performance in terms of measurement system variation capability
and mean consistency (i.e., to reduce the need for mean offsets).
The purpose of this paper is to assess the measurement system capability of a 3D non-
contact measurement system developed by CogniTens (the Optigo 200). This paper first includes
a brief discussion of 3D non-contact measurement technology and several potential sources of
measurement error in automotive body applications. Next, three case studies are used to assess
the measurement system capability and make comparisons between the CMM and Optigo 200.
These case studies evaluate measurement system repeatability (both static and dynamic),
reproducibility (thus, Gage R&R) and feature correlation (i.e., measurement system accuracy and
biases). The various sources of measurement system error also are by body measurement feature
such as surface measurements, edge points, and hole positions.
2. 3D Non-Contact Measurement Technology and the CogniTens System
Various systems have been developed for 3D non-contact measurement, such as laser
scanners/trackers and photogrammetry-based systems. All of these systems involve the use of
structured light to generate part measurements. Gershon and Benady [I] and Mitchell [2] provide
overviews of these systems and a more detailed discussion of the various technologies.
One of these 3D systems, developed by CogniTens, involves the use of three high
resolution CCD (Charge Coupled Device) cameras with indirect photogrammetry to obtain
multiple 2D image projections. These projections, obtained in tiles (approximately 300-600 mm

OSAT - Manufacturing Systems Group December, 2003
in length and width), are then "stitched" together to provide a part shape representation. The
amount of stitching is based on the relationship between the size of the part and the tile's field of
view size. In general, smaller relative tile sizes provide more accurate readings.
The time to measure a complete part with the Optigo system is dependent on the
relationship between the part size and the tile size. In some instances, a manufacturer may be
interested only in a portion of the full part shape, which reduces the measurement time. For
example, a manufacturer may wish to measure along the critical mating flange surface of a
stamped part. In general, a complex part such as a body side may be comprehensively measured
in less than an hour using the portable, manual system. This time may be reduced to less than one
minute with more automated systems or holding fixture enhancements.
In measuring a part, the Optigo system uses coded targets either on the part or integrated
into the part holding fixture to align measurements relative to a single global coordinate system
(see Figure 3). The process of establishing a coordinate system from the targets is known as
mapping. For automotive body measurement applications, the mapping process is integral to
providing accurate and repeatable part measurement data. Once the global coordinate system is
established, part measurements may then be compared to either part CAD model nominal
dimensions or relative to other parts within a sample. Section 4 provides an evaluation of the
mapping process, which is critical in comparing the measurement system capability and
correlation between the CMM and the Optigo system under typical factory conditions.
Figure 3. Me asuring a Stamping Rail Panel Using Targets
OSAT - Manufacturing Systems Group December, 2003
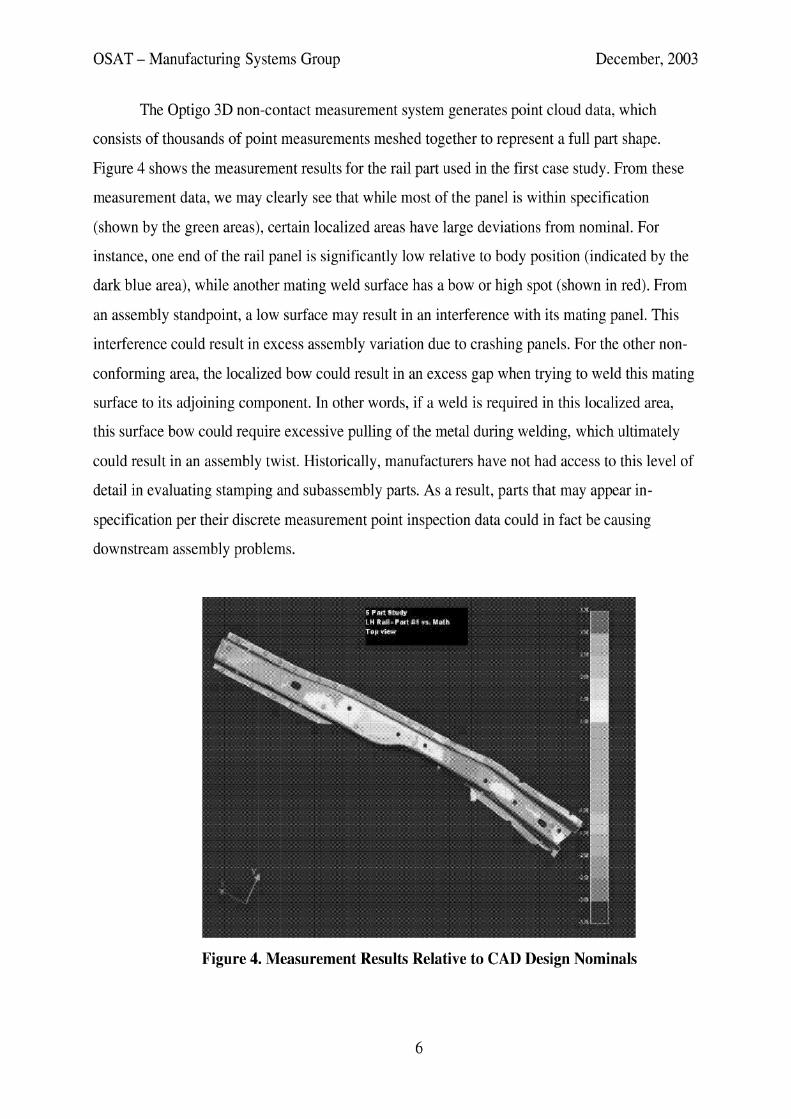
The Optigo 3D non-contact measurement system generates point cloud data, which
consists of thousands of point measurements meshed together to represent a full part shape.
Figure 4 shows the measurement results for the rail part used in the first case study. From these
measurement data, we may clearly see that while most of the panel is within specification
(shown by the green areas), certain localized areas have large deviations from nominal. For
instance, one end of the rail panel is significantly low relative to body position (indicated by the
dark blue area), while another mating weld surface has a bow or high spot (shown in red). From
an assembly standpoint, a low surface may result in an interference with its mating panel. This
interference could result in excess assembly variation due to crashing panels. For the other non-
conforming area, the localized bow could result in an excess gap when trying to weld this mating
surface to its adjoining component. In other words, if a weld is required in this localized area,
this surface bow could require excessive pulling of the metal during welding, which ultimately
could result in an assembly twist. Historically, manufacturers have not had access to this level of
detail in evaluating stamping and subassembly parts. As a result, parts that may appear in-
specification per their discrete measurement point inspection data could in fact be causing
downstream assembly problems.
Figure 4. Measurement Results Relative to CAD Design Nominals
OSAT - Manufacturing Systems Group December, 2003
One potential concern with using point cloud data is over-reaction or over-adjustment to
non-conforming areas of a part. For instance, even though a local bow exists in the rail part
shown earlier, it may have no effect on the assembly process. Thus, even with point cloud data,
manufacturers will likely need to utilize physical functional evaluations or assembly slow builds
to determine if these localized deviations are actually causing assembly concerns. Still, having
point cloud data significantly enhances diagnostic ability particularly when trying to determine if
an assembly concern is attributed to variability in its components or related to the manufacturing
process.
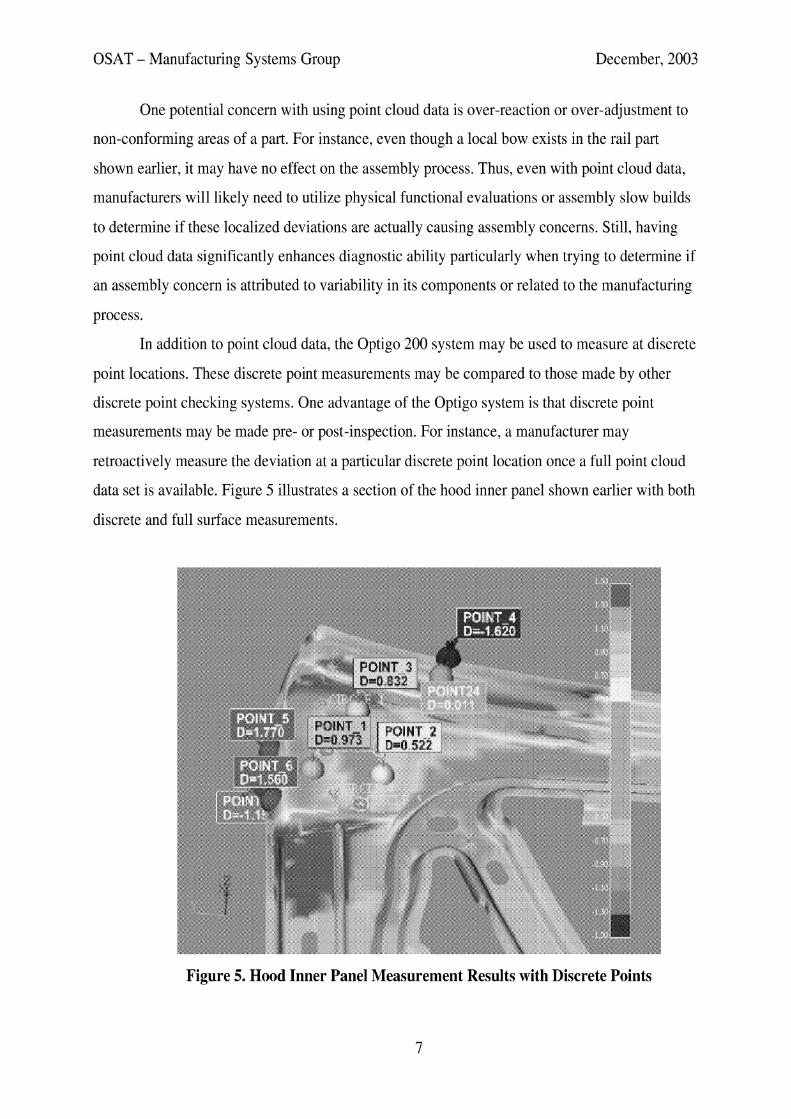
In addition to point cloud data, the Optigo 200 system may be used to measure at discrete
point locations. These discrete point measurements may be compared to those made by other
discrete point checking systems. One advantage of the Optigo system is that discrete point
measurements may be made pre- or post-inspection. For instance, a manufacturer may
retroactively measure the deviation at a particular discrete point location once a full point cloud
data set is available. Figure 5 illustrates a section of the hood inner panel shown earlier with both
discrete and full surface measurements.
Figure 5. Hood Inner Panel Measurement Results with Discrete Points
7

OSAT - Manufacturing Systems Group December, 2003
Although the focus of this report examines the portable, manually operated Optigo 200
system typically used for off-line inspection, similar technology is available for automated or in-
line measurement applications. Here, the Optigo system may be integrated with a robot to
provide an automated measuring process.
3. Potential Sources of Measurement Variation
The capability of a measurement system is typically characterized by its accuracy and
measurement error. The term measurement system error is often preferred over gage error
because other factors beyond the gage itself may contribute to the variation. The three most
common metrics used to assess measurement system capability are repeatability, reproducibility,
and accuracy.
Measurement system repeatability represents the random variation in measurements
when one operator uses the same gage to measure the same parts multiple times. Repeatability is
occasionally separated into static and dynamic repeatability. Static repeatability is determined by
repeatedly measuring a part in its holding fixture without loading and unloading between trials.
Reproducibility represents the variation in average measurements made by different operators
using the same gage and the same parts. The combination of repeatability and reproducibility is
often referred to as R&R or Gage R&R.
Measurement system accuracy is typically determined by comparing the observed
average from a sample of parts using a specific measurement device to a "true" or "master"
measurement determined from a more precise gage. Thus, the "true" average may be viewed as
the standard that a measurement device is trying to replicate. Since CMM measurements are
typically considered the most accurate method of body measurement, we will use them as the
standard to compare to the Optigo system. Figure 6 illustrates these three types of measurement
system variability
Accuracy or Mean Bias Observed Average
A\7 A c
I I I
Observed Average - Repeatability - opemm
Figure 6. Accuracy, Repeatability, and Reproducibility

OSAT - Manufacturing Systems Group December, 2003
Most manufacturers evaluate gage repeatability and reproducibility (Gage R&R) using
ratios between the measurement system variation (R&R) and the part variation and/or the
tolerance width (see [3] -- "Measurement System Analysis: Reference Manual"). Most industries
use the following set of equations to assess the contribution of repeatability, reproducibility, and
their combined R&R. (Note: In some industries, the 5.15 is replaced by 6 to represent 99.73% of
a population of measurements instead of 99%).
% EV - Tolerance = 5.150 repeatabiiq
USL - LSL
% AV - Tolerance = 5' 50 reprod~icibili;\.
USL - LSL
5 . 1 5 0 , ~ ~ % R & R - Tolerance =
USL - LSL
Another technique to evaluate the contribution of the measurement error component is to
assess the ratio of the measurement system variance relative to the observed part variance. The
following equations represent formulas to assess this percentage contribution.
Alternatively, the contribution of the R&R variation may be related to the part variation
by taking the ratio of 5 . 1 5 0 ~ ~ ~ / 5.150 Pan study Variation. Note: Repeatability and reproducibility
may be examined as well by using 5. 1 5 ~ ~ ~ ~ ~ ~ ~ ~ ~ ~ ~ ~ ~ ~ / 5.150 study Variation and 5.150reproducibillty /
5.150 Pa* study Variation. For analysis purposes, we recommend assessing the percentage contribution
of the variance as the more appropriate comparison. Repeatability and reproducibility variances
are independent, and thus generally considered to be additive. The ratios using 5.150's are based
on standard deviations, which are not additive.
OSAT - Manufacturing Systems Group December, 2003
For automotive body component dimensions, typical tolerances used for part features
range from & 0.5 mm to & 1.5 mm. In terms of part variation, typical estimates for the inherent
standard deviation of a stamping dimension, G, ,~ , ranges from 0.1 to 0.25 mm. To provide a
more robust comparison between the various part and dimensional studies conducted in this
report, we use typical tolerances and historical estimates of part variation rather than observed
study part variation. This provides a more representative comparison since the amount of
observed variation among the part samples used varies by case study.
Measurement equipment providers often assess measurement system sources of variation
by measuring known artifacts. For instance, manufacturers first would obtain highly precise
manufactured gage blocks or other objects, such as cones or spheres, with known dimensions.
Next, they would measure the accuracy and repeatability of their systems based on the "known"
dimensions of the artifacts. Although this approach clearly provides a measure of the inherent or
pure accuracy and repeatability of a measurement system, it may not necessarily reflect the
capability of the system to evaluate production parts under normal manufacturing conditions.
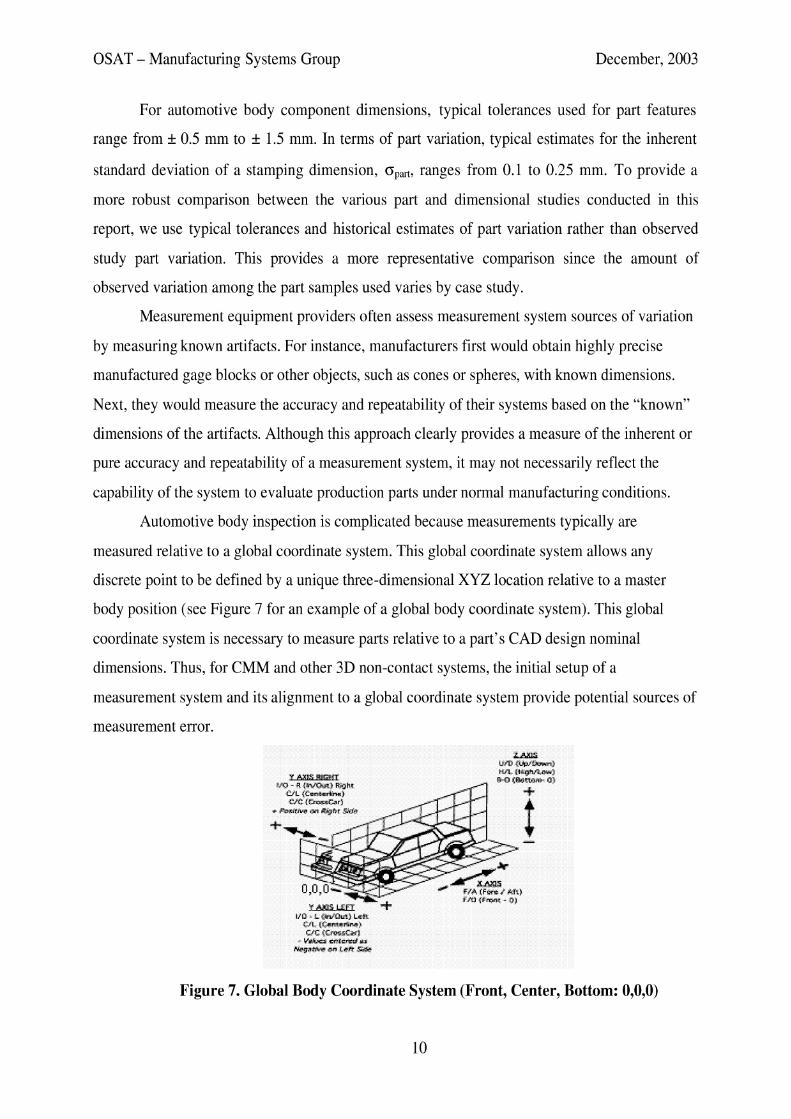
Automotive body inspection is complicated because measurements typically are
measured relative to a global coordinate system. This global coordinate system allows any
discrete point to be defined by a unique three-dimensional XYZ location relative to a master
body position (see Figure 7 for an example of a global body coordinate system). This global
coordinate system is necessary to measure parts relative to a part's CAD design nominal
dimensions. Thus, for CMM and other 3D non-contact systems, the initial setup of a
measurement system and its alignment to a global coordinate system provide potential sources of
measurement error.
L?& urn SwJ-2
Figure 7. Global Body Coordinate System (Front, Center, Bottom: 0,0,0)
10

OSAT - Manufacturing Systems Group December, 2003
Automotive body component measurements also may be affected by the holding fixture
used to secure and align a part during measurement [4]. Part holding fixtures typically utilize
clamps and pins (often defined using Geometric Dimensioning and Tolerancing - GD&T -
Standards for Datums) to repeatedly secure a part for measurement. Both the Optigo and CMM
systems require alignment of the part holding fixture datums to the global coordinate system.
Some common alignment methods include the use of tooling balls or fixture coordinates at
assumed known XYZ locations in order to relate the fixtures to the global body coordinate
system. Any time a measurement system (CMM or Optigo 200) loses its reference relationship to
the global coordinate system, the system must be re-setup or re-aligned.
Thus, for complex-shaped automotive body panels, numerous factors may impact the
measurement system capability including the gage, the fixtures used to hold parts during
measurement, the global coordinate setup process, the measurement instructions, and the gage
operators. Thus, rather than using artifacts, we use actual stamped parts to assess the
measurement system capability and to determine if any significant differences exist between the
Optigo system and the CMM. (Note: For each of the case studies presented in this report, we
measure the same set of parts at specific discrete locations for both the CMM and Optigo.)
In assessing measurement system capability and correlation between systems, we may
stratify our metrics by part feature type. The feature types examined in this report include surface
points, trim edges, and hole positions. Figure 8 illustrates various discrete measurement locations
for the reinforcement part used in the Gage R&R case study. These features are designated by
surface point, trim edge, and hole. In evaluating hole positions, we also examine various
algorithms used by manufacturers to determine the center location.
Figure 8. Part Feature Types
11

OSAT - Manufacturing Systems Group December, 2003
4. Measurement System Analysis Case Studies
To evaluate the various sources of measurement variation with the Optigo 200, we
created three case studies. The first case study involved a rear compartment side rail and is used
to evaluate the Optigo mapping process and static repeatability. Next, we used a structural
reinforcement panel to compare Gage R&R between systems. Finally, we studied a more
complex hood inner panel to evaluate accuracy and correlation of specific part features between
the Optigo and CMM systems.
4.1 Mapping Process Measurement Error and Static Repeatability
The Optigo 200 uses a mapping process to align the measuring device with the fixture
prior to recording measurements. Mapping involves the use of coded targets placed on the part or
on the fixture to establish a coordinate reference system. In terms of potential measurement error,
mapping is similar to the CMM fixture alignment setup process. Here, when a part holding
fixture is placed on a CMM plate, the CMM must align the fixture to a global coordinate system
in order to measure deviations relative to body coordinates. For purposes of this report, we refer
to the mapping effect consistency as Ofixluremapping.
To evaluate the fixture mapping alignment effect of the Optigo process, we studied a rear
compartment side rail, measuring 43 dimensions on five panel samples. For each panel, we
conducted two different mappings prior to measurement. In addition, we measured panels twice
during each mapping without removing the part from the fixture. Figure 9 illustrates the
experimental combinations in the study.
Rail Study
P 1 .S - sample part 1 - 5 M 1. .2 - mapping 1 and mapping 2 3 o ,,,,,e~,, ping
T 1.. 2 - trial 1 and trial 2 3 'static-repeatability
Figure 9. Rail Study: Mapping Effect and Static Repeatability

OSAT - Manufacturing Systems Group December, 2003
From this study, we may estimate two components of measurement variation, the fixture
mapping effect and the static repeatability. Static repeatability represents the pure measurement
system repeatability without the load and unload operation of a part in a fixture. In other words,
static repeatability represents the pure repeatability error of the measuring device. A typical Gage
Repeatability Study involves loading and unloading parts between trials. Thus, static
repeatability represents one variation component of measurement system repeatability.
Table 1 summarizes the mapping process effect for the 43 dimensions by feature type and
Figure 10 illustrates the location of several dimensions. Overall, the potential measurement error
due to mapping is quite small. The average OfixtuR.mapping is only 0.004 with a 95th percentile of
0.013. For automotive body component applications, a low-end tolerance requirement is +I- 0.5
rnm with a part variation, op&, requirement of less than 0.15. Based on these values, the mapping
effect variance would, in a poor condition, only account for about 1% of part variance 2 (calculated using ofixtuE.mapping / o,,?), and only 7% of measurement error relative to tolerance
(assumes a +I- 0.5 mm tolerance and is calculated using Percentage Fixture Effect = 5.15 ofixtwe.
,,ping 1 Tolerance Width).
Table 1. Fixture Mapping Effect
Full Rail Lower Rail Sect ion
Figure 10. Rail Measurements

OSAT - Manufacturing Systems Group December, 2003
In this study, we measured each part twice per mapping without unloading it from the
fixture. Thus, we may also assess the static repeatability of the system. Compared with the
mapping effect, the potential measurement error due to static repeatability is more significant.
The average ostatic-repeatabi1ity for the parts was 0.017 with a 95th percentile of 0.028 (see Table 2).
Again, we may compare these results to a low-end tolerance value of & 0.5 mm and a part
variation target, o,,,, of 0.15. Based on these desired values, the static repeatability variance
would, at a worst condition, account for about 3.5% of part variance (based on ~ s t a t i c x p a t a b i l i t ~ 1
o,,:) and 14% of measurement error relative to a & 0.5 mm tolerance (i.e., based on 5.15
ostatic-repeatability / Tolerance Width). Note: Using average ostatic-repeatabilitJ. values instead of the 95 th
percentile condition, the Optigo 200 system would account for about 9% of the tolerance width,
assuming a tolerance of k 0.5 mm.
Table 2. Static Repeatability Error (Note: Average CMM ostat ic - 0.007)
Average-Hole Position Average-Surface Points Average-Edge Points
Average-All 95th Percentile-All
The static repeatability of the Optigo 200 system was higher than another study involving
CMM systems. In a different study of CMM static repeatability for a body side outer panel, the
average static repeatability observed was 0.007 with a 95th percentile of 0.015 [5] (versus 0.017
and 0.028 for the Optigo). One explanation for the higher static repeatability in the Optigo 200
system is that the Optigo does not perform a physical measurement directly along an ijk vector.
With CMM measurements, an ijk vector path is programmed along with an XYZ nominal
position to determine the normal to surface path for the measurement probe of the CMM. With
the Optigo system, this normal to surface vector path is calculated during the measurement
process.
# Dimensions
5 25 13
43
ostatic-repeatability
0.01 1 0.017 0.019
0.017 0.028
5. 5*ostatic-repeatability
0.057 0.088 0.098
0.088 0.144

OSAT - Manufacturing Systems Group December, 2003
Based on these data, static repeatability appears to be a greater concern for edge and
surface points than for hole position measurements (see Table 3). We further explore the
repeatability issue in our Gage R&R study (see section 4.2), where the repeatability error is
compounded by including the part loading and unloading effect.
Table 3. Static Repeatability Error by Feature Type (Rail Part)
4.2 Gage Repeatability and Reproducibility Analysis
To evaluate measurement system repeatability and reproducibility, we conducted a 5 x 2 ~ 2
Gage R&R study for a structural reinforcement panel using both the CMM and the Optigo 200.
A 5 x 2 ~ 2 study involves five parts measured twice each by two different operators. Figure 11
shows this reinforcement panel and the discrete point locations used to assess the measurement
system capability. In this analysis, we compare the various sources of measurement error relative
to historical tolerance widths, historical estimates of part variation, and the actual observed study
variation.

OSAT - Manufacturing Systems Group December, 2003
Figure 11. Structural Reinforcement Panel with Discrete Point Dimensions
Table 4 summarizes the observed repeatability, reproducibility, and total Gage R&R for
each of the discrete points examined. In this study, we examine three edge points, six hole
positions. and nine surface points. Overall, the CMM slightly outperformed the Optigo system.
The 95th percentile o ~ & ~ ~ s 0.063 for the Optigo and 0.050 for the CMM.
AverageALL 1 0.035 1 0.018 1 0.01 3 I 0.014 1 0.040 1 0.025 1 0.205 1 0.131 95th Percentile-ALL 1 0.050 1 0.034 1 0.040 1 0.033 1 0.063 1 0.050 1 0.326 1 0.256 *Based on the ANOVA Method

OSAT - Manufacturing Systems Group December, 2003
Table 4. Full Gage R&R Comparison: CMM vs. Optigo
Although the CMM outperformed the CogniTens system in terms of magnitude of
measurement system error, the practical impact of this difference is relatively minor. If we
equate the gage error estimates relative to our various metrics (percentage of historical part
variance and percentage of tolerance), we notice that the difference is marginal relative to
industry criteria for acceptability (see Table 5). For these data, both the CMM and the Optigo
would pass a Gage R&R study using the typical criteria which seeks a Percentage Gage R&R -
Tolerance < 30%. However, we should note that the repeatability concern could potentially
affect Gage R&R pass rates for dimensions with tight tolerances, even though the percentage of
part variance explained by repeatability would be relatively low.
Table 5. Gage R&R Relative to Historical Variation and Tolerances
In the automotive industry, measurement system capability occasionally is measured by
comparing the predicted range (5 .15*0~&~) with the observed variation in the study. Table 6

OSAT - Manufacturing Systems Group December, 2003
shows the results of such an analysis for these parts. Using this analysis methodology, numerous
discrete points for both the Optigo and CMM would fail the 30% desired criteria. The reason for
this finding is that the observed standard deviation for the dimensions in this study is quite low.
For instance, approximately half of the dimensions had standard deviations less than 0.15 mm. In
other words, for small levels of standard deviation, both the CMM and Optigo would have
difficulty separating gage variation from these levels of observed part variation.
Table 6. Gage R&R Relative to Observed Study Variation
We may use these estimates for repeatability and full Gage R&R to estimate the
tolerances and part variance that could be measured using an 18% desired goal for repeatability
or a 30% desired goal for R&R [3]. Table 7 summarizes these results. Overall? we would expect
the Optigo system to pass Gage R&R requirements for typical tolerances ranging from f 0.3 and
f 0.7 (again, based on meeting the 30% criteria). We also may assess the ability of the
measurement system to separate gage variation from part variation by examining the ratio of the 2 variances (i.e., compare o lo^,,, < 30%). Based on this study, the Optigo system is capable of

OSAT - Manufacturing Systems Group December, 2003
separating gage variation from part variation for inherent part sigma levels of 0.07 mm and
higher. In comparison, CMM would be able to separate at standard deviation levels of 0.05.
Average-ALL 95th Percentile-ALL
Table 7. Theoretical Tolerances and Measurable Inherent Part Variation
Criteria Average Tolerance(+/-) 95th Percentile Tolerance Average Part Variation, o,,,,
95th Percentile Part Variation, o,,,,
Overall, this study suggests that the Optigo system is capable of meeting the requirements for
automotive body measurement system Gage Repeatability and Reproducibility. The system
is capable both in terms of its ability to pass Gage R&R criteria based on typical tolerance
widths and in separating measurement system variation from part variation for historical
levels of standard deviation.
Optigo Repeatability
0.035 0.050
4.3 Optigo Vs. CMM: Feature Correlation and Accuracy
Another potential source of measurement system error is accuracy. Traditionally, we
measure the accuracy of a gage using a master part or artifact. For purposes of this study, we
considered CMM measurements as the master and examined if any systematic mean biases
existed between systems. We evaluated mean differences between the systems using an overall
feature correlation study and a test of mean differences between measurement readings for
individual discrete points.
For this analysis, we examined a more complex hood inner panel. Table 8 summarizes
the correlation between features, and the average/95Ih percentile mean differences across
common features on the hood inner panel (i.e.. mean of dimension using CMM versus mean of
same dimension using Optigo). Originally, we observed a correlation difference with respect to
hole measurement position. However, it was determined that the method used to calculate hole
1 8% 0.5 0.7 0.08 0.12
CMM Repeatability
0.01 8 0.034
18% 0.3 0.5
0.04 0.08
Optigo R&R
0.040 0.063
CMM R&R
0.025 0.050
30% 0.3 0.5 0.07 0.12
30% 0.2 0.4 0.05 0.09

OSAT - Manufacturing Systems Group December, 2003
positions was inconsistent between systems. This inconsistency was corrected and the final
results are shown below. We mention this inconsistency because numerous methods exist to
measure true position of holes and it is important to use common approaches to correlate the two
systems.
Table 8 indicates a very strong correlation between specific discrete point measurement
locations on the CMM versus the Optigo. In addition to these strong correlation values, the
magnitude of the difference in means is quite small. For hole and surface measurements, the
average mean deviation between systems was approximately 0.03 mm. This finding is
significantly better than typically observed in comparing measurement systems such as
traditional check fixtures with EDC bushings versus CMM or in-line vision systems versus
CMM.
Table 8. Reinforcement Panel Correlation1 Mean Bias Measurement Differences
Group
Holes Edge Points Surfaces
Although the results are positive, some issues exist in comparing means between pairs of
measurements (e.g., panel 1 with CMM vs, panel 1 with Optigo). In particular, edge points
tended to have greater mean differences than holes and surfaces. Figures 12 and 13 provide box
plots showing observed differences in correlation and mean difference magnitude by feature type
categories (holes, edge points, surfaces). Interestingly, the edge points for the Optigo system are
biased to one side whereas the hole positions and surface measurements are scattered about a
difference of 0. Since the mean difference shown in these figures is calculated using CMM-
Optigo measurements, the positive values suggest that the CMM trim edge measurement
readings are more outboard.
An explanation for this phenomenon relates to where on the part these edge points are
measured. The CMM uses a probe with a wider contact area. Thus, the CMM values typically
pick up the maximum tangent point of the sheet metal edge. In contrast, the Optigo system
# Meas Pairs
20 8 16
Feature Correlation
0.997 0.996 0.999
Average Difference
ICMM-O ti ol 0.03 0.1 2 0.03
95th Percentile Difference
0.09 0.22 0.08

OSAT - Manufacturing Systems Group December, 2003
measures along the top of the surface. Body panel edge points are created by trim operations in
the stamping die lineup. So, as the die trim steels wear, the breakage at the top of a surface will
be different from the breakage in the middle of the blank. As a result, we would expect edge
points to be slightly biased when compared to CMM measurements. However, given that trim
edge feature requirements typically have wider tolerances (f 0.7 to f 1.5) compared with mating
surfaces or hole positions, this difference would not likely have a practical impact on the final
body assembly process.
0.985 4 4 Edge Hole Surface
Type
Figure 12. Correlation Differences for Each Set of Panel Measurement by Type
Edge Hole Suriace
Type
Figure 13. Mean Differences for Each Set of Panel Measurement by Feature Type
These measurement system correlation findings are particularly critical because a primary
reason for point cloud data is to better represent larger, more complex automotive body parts.
Compared with measurement system Gage R&R, having the ability to effectively replicate CMM
measurement values in terms of correlation and mean bias for discrete locations is probably more

OSAT - Manufacturing Systems Group December, 2003
important in terms of diagnostic value. In addition, the Optigo system provides full point cloud
data to better evaluate conformance of complex panel shapes to design nominal dimensions.
5. Conclusions
Historically, automotive body measurements have relied on discrete point checking
systems to produce inspection data. The limitations of these systems are well known. They tend
to require significant engineering resources to establish key part features, and often the selected
features are in the wrong location or are insufficient to effectively diagnose next-level assembly
process build problems. A technology that has the potential to provide significantly better
diagnostic capability is 3D non-contact measurement systems, which produce point cloud data.
However, for these systems to represent a viable alternative, they must be able to meet
industry expectations for Gage R&R and accuracy. The various case studies used in this report
demonstrate that the Optigo system is capable of meeting these industry expectations and is very
similar to the CMM in terms of accuracy as supported by high measurement system correlation.
These case studies, however, do indicate that some inherent differences exist that could
potentially affect adoption of 3D non-contact measurement systems. Among the potential
concerns is higher static repeatability in the Optigo system. In addition, some minor differences
in measurement may result due to the difference between using a physical touch probe versus a
non-contact system. Still, the significant added benefits of the Optigo system in terms of its
ability to provide more comprehensive panel shape representation likely outweighs these
particular measurement system differences.
To further assess the "productionization" of 3D non-contact measurement systems,
additional comparisons are needed in terms of system costs, benefits, and actual applications.
Having point cloud data available for problem diagnostics is only one part of the equation;
understanding how to effectively utilize this point cloud data is another. Historically, not all
stamping deviations necessarily translate into assembly problems. So, having more out-
specification data potentially could lead to over-adjustment or unnecessary rework. These issues
and others related to system cost comparisons will be the subject of future reports.
In conclusion, these case studies indicate that the Optigo 200 system is capable of
meeting industry standards for measurement system capability. More importantly, these results
suggest that manufacturers may enhance their measurement system effectiveness in terms of
diagnostic capability and total system costs using 3D non-contact measurement.

OSAT - Manufacturing Systems Group December, 2003
REFERENCES
1. Gershon R. and Benady M., "Noncontact 3-D Measurement Technology Enters a New
Era," Quality Digest, 2000.
2. Mitchell, G., "Use Sensors Intelligently," Controls Engineering Online, 2001.
3. Measurement Syftems Analysis. Reference Manual. 3"1 Edition. Automotive Industry
Action Group, 2002.
4. Liggett, J.V., Dinzensional Variation Management Handbook - A Guide for Quality,
Design, and Manufacturing Engineers. Englewood Cliffs, NJ: Prentice Hall. 1993.
5 . Hammett, P. and Baron, J., Alitonzotive Body Measzirement System Capability. Report
prepared for the Auto Steel Partnership Program. 1999.