osba statement no. 1 before the 4 - puc.state.pa.us · osba statement no. 1 before the ... do you...
TRANSCRIPT

OSBA STATEMENT NO. 1
BEFORE THE
PENNSYLVANIA PUBLIC UTILITY COMMISSION
PENNSYLVANIA PUBLIC UTILITY COMMISSION
V.
THE PEOPLES NATURAL GAS COMPANY, T/A DOMINION PEOPLES
4
DOCKET NO. R-00061301
Direct Testimony of
BRIAN KALCIC
On Behalf of the
Office of Small Business Advocate
Date Served: May 16, 2006
Date Submitted for the Record:
Direct Testimonv of Brian Kalcic
4 Q. Please state your name and business address.
5 A. Brian Kalcic, 225 S. Meramec Avenue, St. Louis, Missouri 63105.
6
7 Q. What is your occupation?
8 A. I am an economist and consultant in the field of public utility regulation, and
9 principal of Excel Consulting. My qualifications are described in the
JO Appendix to this testimony.
11 k
12 Q. On whose behalf are you testifying in this case?
13 A. I am testifying on behalf of the Office of Small Business Advocate
14 ("OSBA"), which is representing small business customers served by The
15 Peoples Natural Gas Company, d/b/a Dominion Peoples (or "Company").
16
17 Q. What is the subject of your testimony?
18 A. I will discuss Dominion Peoples' response to certain Commission directives
19 that were issued to the Company at the conclusion of Docket No. R-
20 00050267, i.e., those arising from the events surrounding the Energy
1 Information Administration's ("EIA") release of its Weekly Gas Storage
2 Report on November 24, 2004 ("Report"). I will also comment on the
3 Company's proposed hedging plan.
4
5 EIA's November 24, 2004 Weekly Storage Report
6
7 Q. Mr. Kalcic, please provide a brief description of the OSBA's position
8 concerning the events surrounding the release ofthe Report, as presented
9 in Docket No. R-00050267.
TO A. In Docket No. R-00050267, the OSBA presented testimony describing the
J1 events that led to a spike in natural gas market prices. Those events were
12 triggered by an erroneous storage report issued by EIA on November 24,
13 2004, which in turn arose out of an apparent clerical error by an employee of
14 Dominion Transmission, Incorporated ("DTI"). The OSBA argued that
15 Dominion Peoples' sales customers were adversely affected by the DTI
16 reporting error, and that the Company had an obligation to take legal action to
17 recover the excess purchased gas costs attributable to the reporting error. In
18 lieu of any action by the Company to recover such excess costs, the OSBA

1 proposed that the Commission adjust Dominion Peoples' claimed historical
2 gas costs downward by $ 1.44 million.1
3
4 Q, Did the Company object to the OSBA's proposed gas cost adjustment?
5 A. Yes, it did.2
6
7 Q* How did the Commission rule with respect to this issue?
8 A. In its Opinion and Order ("Order") in Docket No. R-00050267 entered
9 September 30, 2005, the Commission concluded:
*10
.11 We, hereby, direct Dominion Peoples to actively seek to recover from
12 its suppliers, including its affiliates, the amounts paid for gas supplies
13 that were in excess of reasonably anticipated prices as a result of the
14 DTI reporting error. ALJ Meehan recommended that these efforts to
15 seek recovery should include consideration of instituting appropriate
16 legal action, or joining an ongoing legal action for recovery of
17 such funds. Upon obtaining any forthcoming recovery of such
See the Commissioivs Opinion and Order in Docket No. R-00050267 at 8. See Dominion Peoples' Statement No. 1 at 51 for a summary of the Company's position on this matter.

1 payments, the amount of the recovery should be flowed through to the
2 customers of Dominion Peoples. We also direct that in Dominion
3 Peoples' next Section 1307(f) proceeding (2006), it shall submit a
4 report detailing, for each of its gas suppliers to whom it paid
5 December FOM prices, the efforts made to recover the excess portion
6 of said prices, and the amount of any recovery received from each
7 . supplier. Order at 16. (Emphasis supplied.)
9 Q. Has the Company provided any evidence that it has joined any ongoing
10 legal action for recovery of amounts paid in excess of reasonably
"l l anticipated prices stemming from DTI's reporting error?
12 A. No, it has not.
13 •
14 Q. Has the Company provided any evidence that it intends to join any such
15 ongoing legal action?
16 A. No.
17
18
19
•20
1 Q. Is the OSBA aware of any such ongoing legal action?
2 A. Yes. Counsel informs me that, as noted in Dominion Peoples' Statement No.
3 1 at 51, a legal action was filed in Kanawha County Circuit Court, West
4 Virginia, and was subsequently removed to the U. S. District Court.
5
6 Q. What specific actions has Dominion Peoples undertaken in response to
7 the above directives?
8 A. At page 55 of his prepared direct testimony, Mr. Walther indicates that the
9 Company: 1) sought the advice of outside counsel regarding the potential
.10 merits of instituting a law suit for damages against DTI and/or its relevant
11 suppliers; and 2) approached the North American Energy Standards Board
12 ("NAESB") in an attempt to establish future contractual standards that would
13 address circumstances where prices may be skewed.
14
15 Q. Do you wish to comment on the legal opinions reached by Dominion
16 Peoples5 outside counsel?
17 A. No. Counsel informs me that the OSBA will confine its discussion of the
18 Company's proffered legal conclusions to its post-hearing briefs.
19
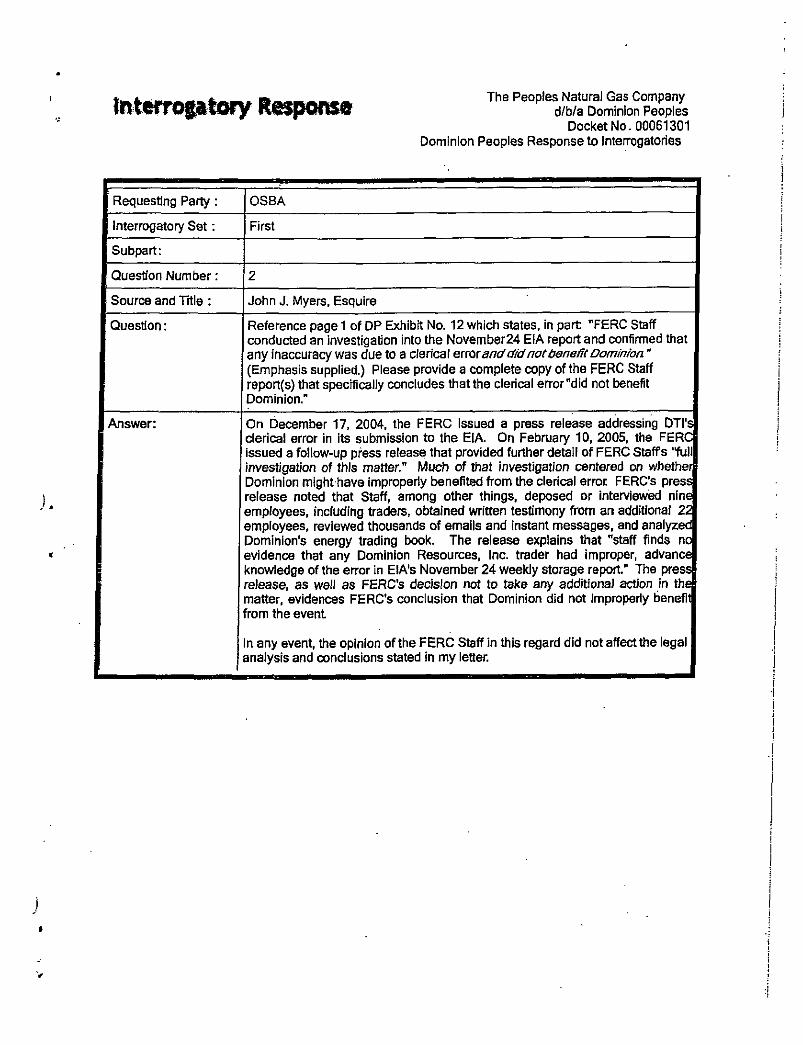
1 Q. Mr. Kalcic, do you have any comment on the purported statement of
2 facts that appears in the opinion of the Company's outside counsel?
3 A. Yes, in one area. In OSBA-I-2, the OSBA referenced the following statement
4 contained in page 1 of DP Exhibit No. 12: "FERC Staff conducted an
5 investigation into the November 24 EIA report and confirmed that any
6 inaccuracy was due to a clerical error and did not benefit Dominion." The
7 OSBA requested a complete copy ofthe FERC Staff report(s) that specifically
8 concludes that the clerical error "did not benefit Dominion."
•10 Q. Did the Company provide the requested Staff report(s) in its response to
.11 OSBA-I-2?
12 A. No, it did not. A complete copy ofthe Company's response is attached-to my
13 testimony.
14
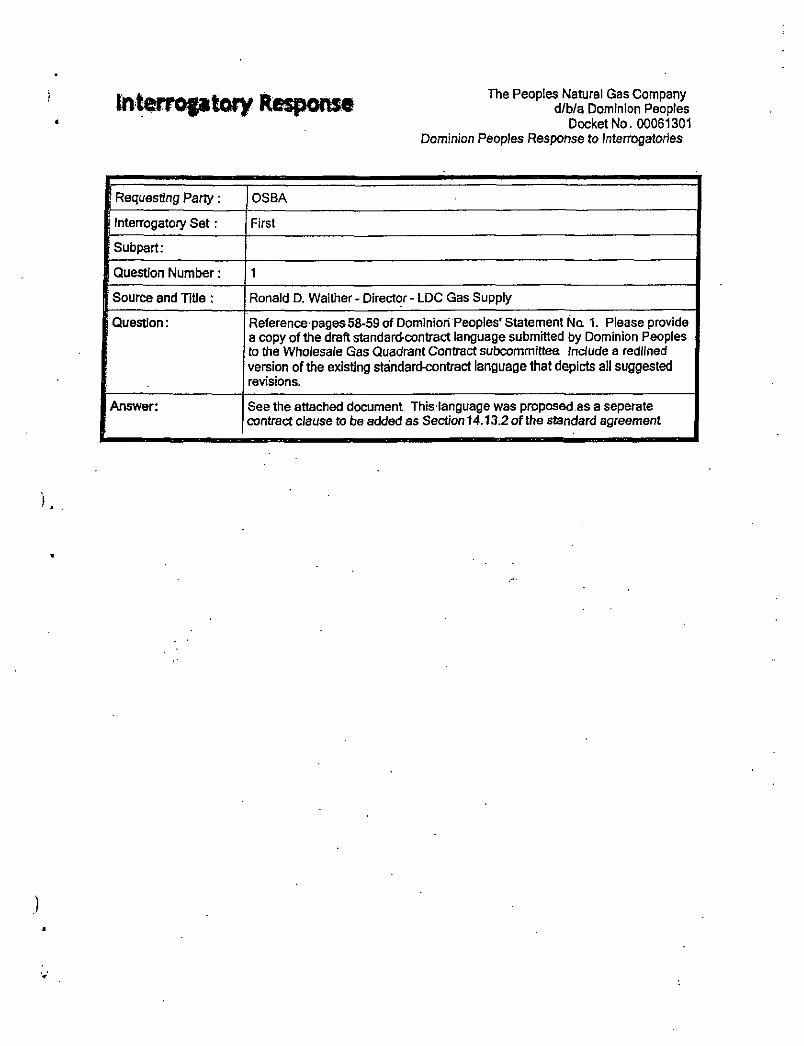
15 Q. Have you reviewed the standard-contract language changes sponsored by
16 Dominion Peoples before the NAESB?
17 A. Yes, I have. The Company's suggested new language is contained in Section
18 14.13.2 of the standard agreement, which is provided in the Company's
19 response to OSBA-i-1.
-20

1 Q. Do you have any comment on the suggested new standard-contract
2 language?
3 A. Yes. It appears that the proposed contract language seeks to supplement the
4 existing dispute resolution provisions contained in Section 14.13.1 of the
5 standard agreement. Section 14.13.1 addresses a "Market Disruption Event,"
6 such as the failure of an index to announce or publish the information
7 necessary to determine the trading price agreed to in a transaction. Section
8 14.13.2 would establish a dispute resolution process to address a "Market
9 Dislocation Event," defined as a situation where an index has been "unduly
-10 influenced by manipulation or mistake of reported data." As such, it appears
.11 that Section 14.13.2, if adopted, would provide an important vehicle with
12 which to address future events like that which occurred on November 24,
13 2004.
14
15 Q. Has Dominion Peoples sought the support of other Pennsylvania gas
16 distribution companies for its proposed standard-contract language?
17 A. The Company does not say. However, if such support has not been solicited,
18 I would recommend that the Commission direct the Company to do so.
19
•20

1 Hedging Program
2
3 Q. Mr. Kalcic, has Dominion Peoples completed its 2-year pilot hedging
4 program that was approved in its 2004 1307(f) proceeding?
5 A. Yes, it has.
6
7 Q. Has Dominion Peoples proposed a plan to hedge prices on a portion of its
8 monthly gas purchases on an ongoing basis?
9 A. Yes. Dominion Peoples proposes to hedge approximately 25% of its total
-10 projected monthly purchases on a volumetric basis. Mr. Walther indicates
v l l that this would double the annual amount of gas purchases that the Company
12 hedged under its pilot program. In addition, the Company would propose to
13 increase the number of hedges from three to twelve (or one each month)
14 under its new plan.
15
16 Q. Does the OSBA have any concerns about the Company's proposal
17 to hedge 25% of its total projected monthly purchases, via twelve
18 separate transactions?
19 A. No, not at this time. As Mr. Walther indicated, in the Company's 2005
'20 1307(f) proceeding, the OSBA recommended, and the Commission agreed,

1 that Dominion Peoples should be directed to explore the feasibility of
2 hedging a greater percentage of its gas purchases. The Company's plan to
3 increase the total amount of hedged purchases, via twelve separate monthly
4 transactions, should help reduce the exposure of Dominion Peoples' sales
5 customers to gas price volatility, as compared to the pilot hedging program.
6
7 Q. Did the Commission direct the Company to explore any other changes to
8 its pilot program?
9 A. Yes. In addition to exploring the possibility of hedging a greater percentage
•10 of its gas purchases, the Commission directed the Company to examine the
.11 feasibility of spreading its hedged purchases over a greater number of trading
12 days in a given month.
13
14 Q. What would be the potential benefit of spreading gas purchases over a
15 greater number of trading days in a given month?
16 A. Spreading gas purchases over a greater number of trading days within a
17 month could mitigate exposure to daily price spikes, such as the one that
18 occurred on November 24, 2004.
19

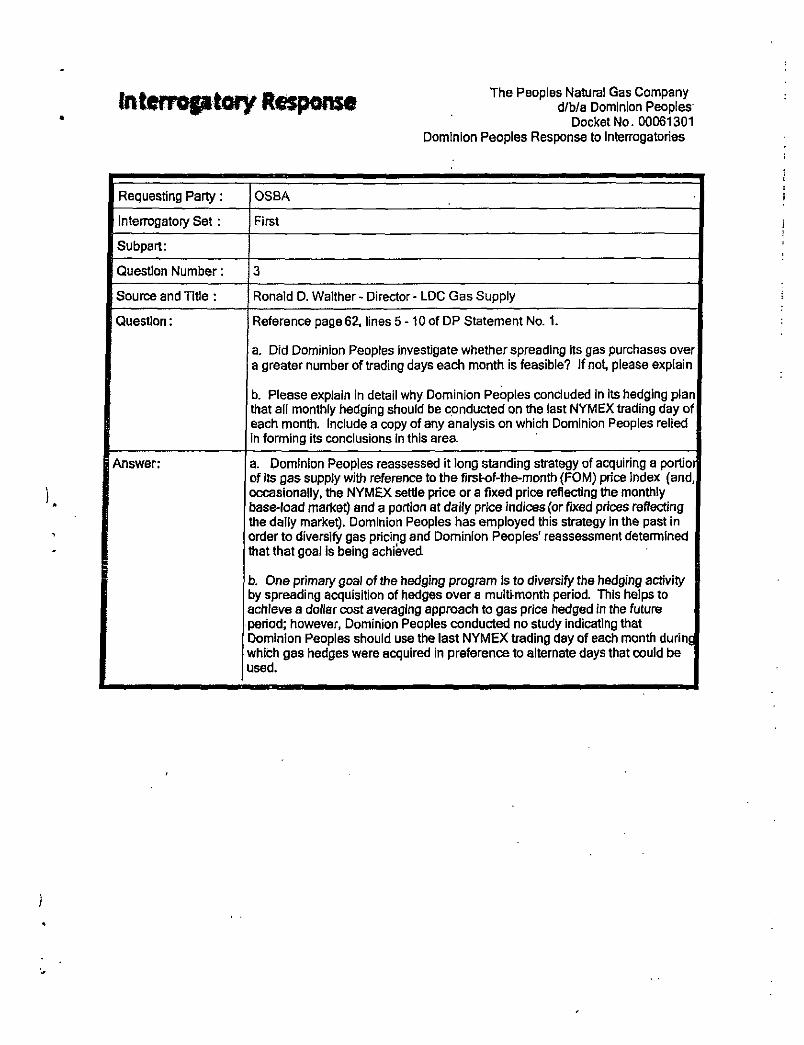
1 Q. Does the Company's hedging plan include spreading hedged purchases
2 over a greater number of trading days in a month?
3 A. No. Dominion Peoples proposes to conduct all monthly hedging at first-of-
4 the-month ("FOM") prices.
5
6 Q. Has Dominion Peoples performed any study to determine whether
7 executing hedges over a greater number of trading days would be
8 appropriate?
9 A. No, it has not.3
•10
.11 Q. What do you recommend?
12 A. I recommend that the Company be ordered to comply with the Commission's
13 previous directive in this area and report its findings in its next 1307(f)
14 proceeding.
15
16 Q. Does this conclude your direct testimony?
17 A. Yes.
19
3 See the Company's response io OSBA-I-3.
10

REFERENCED INTERROGATORY RESPONSES
OSBA-I-1
OSBA - 1-2
OSBA-I-3
In terrofjtory Response The Peoples Natural Gas Company d/b/a Dominion Peoples
Docket No. 00061301 Dominion Peoples Response to Interrogatories
Requesting Party: OSBA
Interrogatory Set: First
Subpart:
Question Number: 1
| Source and Title : Ronald D. Walther - Director - LDC Gas Supply
Question: Reference pages58-59 of Dominion Peoples'Statement No 1. Please provide a copy ofthe draft standard-contract language submitted by Dominion Peoples to the Wholesale Gas Quadrant Contract subcommittee Jndude a redlined version of the existing standard-contract language that depicts all suggested revisions.
Answer: See the attached document This language was proposed.as a seperate contract clause to be added as Section 14.13.2 of the standard agreement

The People's Natural Gas Company (PA) Comments
January 5, 2006
The Peoples Natural Gas Company f PA) proposes to supplement EnCana Marketing proposed changes to Article 14, Section 14.13 by adding the following paragraph 14.13.2
Article 14 - Miscellaneous
14.13.1 If a Market Disruption Event has occurred-during a Trading Day, then the parties shall negotiate In good faith to agree on a Floating Price (or a method for determining a Floating Price) for the affected Tracfing Pay, and if the parties have not so agreed on or before the second Business Day following the first Trading Day on which the Markel Disruption Event occurred or existed, then the Roatlng Price shall be determinecf within the next two (2) following Business Days with each party obtaining in good faith two quotes from a leading dealer In the relevant marfcet and averaging the four quotes. If either party fails to provide two quotes then the average of the other party's two quotes shall determine the Floating Price. "Floating Price' means the price or a portion of ihe price agreed to In the transaction as being based upon a specified index. 'Market Pismofion Event" means, with respect to an Index, any of the following events: (a) the failure of the index to announce or publish Infonnation necessary for determining the Boating Price; (b) the failure of trading to commence or the permanent discontinuation or material suspension of tradng in the relevant options contract or commocfity on the exchange or market acting as the index; (c) the temporary or permanent discontinuanoe or unavailability of the Index; (d) the temporary or permanent dosing of any exchange acting as the index; or (e) both parties agree that a material change in the formula for OT the method of determining the Floating Price has" occurred. Tradino Day* means a day in respect of which the relevant price source published the relevant price.
14.t3.2 If either party bdfeves in good faith that a Market Dislocation Event has occurred during a Trading Day, then, within fifteen Business Days following the date on which the Market Dislocation Event was discovered, such party may provide notice to the other that it Is disputing the Floating Price applicable to such Trading Day and provide an Alternative Floating Price together with supporting documentation acceptable in industry practice to support the Alternative Roatlng Price. In response to a proposed Alternative Floating Price, the responding party may agree wilh the proposed Alternative Roatlng Price, may support the original Floating Price, or may propose its own Alternative Floating Price, The parties shall negotiate in good faith to agree on an applicable Boating Price (or a method for determining an applicable Roating Price) for the affected Trading Day. If the parties have noi so agreed on or before the fifteenth Business Day following the providing of the Alternative Floating Price, then either party may submit the dispute to arbitration. Once the dispute Is submitted to arbitration, both parties shall submit to the arbitrator their respective applicable Floating Price, and the arbitrator shall determine which shall apply. The prevailing party shall be entitled to attorneys' fees. "Market Dislocation Event" means, with respect to an index, that such index has been unduly influenced by manipulation or mistake of reported data, including (but not limited to) data that affects the index but is not reported to the index, e.g.; storage Inventory data. "Alternative Roating Price" means the price or a portion of the price in the transaction reflecting the party's estimate of what the spedfied index price would have.been absent the Market Dislocation Event.
Interrogatory Response The Peoples Natural Gas Company d/b/a Dominion Peoples
Docket No. 00061301 Dominion Peoples Response to Interrogatories
Requesting Party : OSBA
Interrogatory Set: First
Subpart:
Question Number: 2
Source and Title : John J. Myers, Esquire
Question: Reference page 1 of DP Exhibit No. 12 which states, in part "FERC Staff conducted an investigation into the November24 EIA report and confirmed that any inaccuracy was due to a clerical error ana'did not benefit Dominion " (Emphasis supplied.) Please provide a complete copy of the FERC Staff repon(s) that specifically concludes that the clerical errorndid not benefit Dominion."
Answer: On December 17, 2004, the FERC issued a press release addressing DTI's clerical error in its submission to the EIA. On February 10, 2005, the FERC issued a follow-up press release that provided further detail of FERC Staffs "full investigation of this matter." Much of that investigation centered on whether Dominion might have improperly benefited from the clerical erroc FERC's press release noted that Staff, among other things, deposed or interviewed nine employees, including traders, obtained written testimony from an additional 22 employees, reviewed thousands of emails and instant messages, and analyzed Dominion's energy trading book. The release explains that "staff finds no evidence that any Dominion Resources, Inc. trader had improper, advance knowledge of the error in EIA's November 24 weekly storage report." The press release, as well as FERC's decision not to take any additional action in the matter, evidences FERC's conclusion that Dominion did not improperly benefit from the event
In any event, the opinion ofthe FERC Staff in this regard did not affect the legal analysis and conclusions stated in my letter.
The Peoples Natural Gas Company d/b/a Dominion Peoples
Docket No. 00061301 Dominion Peoples Response to Interrogatories
Requesting Party: OSBA
Interrogatory Set: First
Subpart:
Question Number: 3
Source and Title : Ronald D. Walther - Director - LDC Gas Supply
Question: Reference page 62, lines 5 -10 of DP Statement No. 1.
a. Did Dominion Peoples investigate whether spreading its gas purchases over a greater number of trading days each month is feasible? If not, please explain
b. Please explain in detail why Dominion Peoples concluded in Its hedging plan that all monthly hedging should be conducted on the last NYMEX trading day of each month. Include a copy of any analysis on which Dominion Peoples relied in forming its conclusions In this area
Answer: a. Dominion Peoples reassessed it long standing strategy of acquiring a portioi of its gas supply with reference to the first-of-the-month (FOM) price index (and, occasionally, the NYMEX settle price or a fixed price reflecting the monthly base-load marlcet) and a portion at daily price indices (or fixed prices reflecting the daily market). Dominion Peoples has employed this strategy In the past in order to diversify gas pricing and Dominion Peoples' reassessment detennined that that goal is being achieved
b. One primary goal of the hedging program is to diversify the hedging activity by spreading acquisition of hedges over a multi-month period. This helps to achieve a dollar cost averaging approach to gas price hedged in the future period; however, Dominion Peoples conducted no study indicating that Dominion Peoples should use the last NYMEX trading day of each month during which gas hedges were acquired in preference to alternate days that could be used.

APPENDIX A
APPENDIX
Qualifications of Brian Kalcic
Mr. Kalcic graduated from Illinois Benedictine College with a Bachelor of Arts
degree in Economics in December, 1974. In May, 1977 he received a Master of Arts
degree in Economics from Washington University, St. Louis. In addition, he has
completed all course requirements at Washington University for a Ph.D. in
Economics.
From 1977 to 1982, Mr. Kalcic taught courses in economics at both Washington
University and Webster University, including such subjects as Microeconomic and
Macroeconomic Theory, Labor Economics and Public Finance.
During 1980 and 1981, Mr. Kalcic was a consultant to the Equal Employment
Opportunity Commission, St. Louis District Office. His responsibilities included data
collection and organization, statistical analysis and trial testimony.
From 1982 to 1996, Mr. Kalcic joined the firm of Cook, Eisdorfer & Associates,
Inc. During that time, he participated in the analysis of electric, gas and water utility
rate case filings. His primary responsibilities included cost-of-service and economic
analysis, model building, and statistical analysis.
In March 1996, Mr. Kalcic founded Excel Consulting, a consulting practice
which offers business and regulatory services.
Mr. Kalcic has previously testified before the state regulatory commissions of
Delaware, Kansas, Kentucky, Maine, Massachusetts, Minnesota, Missouri, New
Jersey, New York, Ohio, Oregon, Pennsylvania, Texas, and the Bonneville Power
Administration.

.BEFORE THE
PENNSYLVANIA PUBLIC UTILITY COMMISSION
PENNSYLVANIA PUBLIC UTILITY COMMISSION
v.
THE PEOPLES NATURAL GAS COMPANY d/b/a DOMINION PEOPLES
DOCKET NO. R-00061301
DIRECT TESTIMONY
OF
JEROME D. MIERZWA
ON BEHALF OF THE •
PENNSYLVANIA OFFICE OF CONSUMER ADVOCATE
MAY 2006
EXETER ASSOCIATES, INC.
5565 Sterrett Place Suite 310
Columbia, Maryland 21044 JUL 1 7 2006
Pittsburgh Office of A.LJ. Public Utility Commission
TABLE OF CONTENTS
PAGE
I. INTRODUCTION
II. DESIGN PEAK AND PIPELINE CAPACITY ENTITLEMENTS 4
III. EXCHANGE REVENUES 11
IV. OFF-SYSTEM SALES 12
V. COMPETITIVE ENERGY RATE - RATE CER 13
VI. HEDGING PROGRAM 14
VII. RETAINAGE DISCOUNTS 15
VIII. STORAGE LOSSES 21

1 I. INTRODUCTION
2 Q. WOULD YOU PLEASE STATE YOUR NAME AND BUSINESS ADDRESS.
3 A. My name is Jerome D. Mierzwa. I am a principal and Vice President of Exeter
4 Associates, Inc. My business address is 5565 Sterrett Place, Suite 310,
5 Columbia, Maryland 21044. Exeter specializes in providing public utility-related
6 consulting services.
7 Q. PLEASE DESCRIBE YOUR EDUCATIONAL BACKGROUND AND EXPERI-
8 ENCE.
9 A. I graduated from Canisius College in Buffalo, New York, in 1981 with a Bachelor
10 of Science Degree in Marketing. In. 1985,1 received a Masters Degree in Busi-
11 ness Administration with a concentration in finance, also from Canisius College.
12 In July 1986, I joined National Fuel Gas Distribution Corporation ("NFGD") as a
13 Management Trainee in the Research and Statistical Services Department
14 ("RSS"). I was promoted to Supervisor RSS in January 1987. While employed
15 with NFGD, I conducted various financial and statistical analyses related to the
16 company's market research activity and state regulatory affairs. In April 1987, as
17 part of a corporate reorganization, I was transferred to National Fuel Gas Supply
18 Corporation's ("NFG Supply") rate department where my responsibilities included
19 utility cost of service and rate design analysis, expense and revenue requirement
20 forecasting and activities related to federal regulation. I was also responsible for
21 preparing NFG Supply's Purchased Gas Adjustment ("PGA") filings and
22 developing interstate pipeline and spot market supply gas price projections.
23 These forecasts were utilized for internal planning purposes as well as in
24 NFGD's 1307(f) proceedings.
Direct Testimony of Jerome D. Mierzwa Page 1
1 In April 1990,1 accepted a position as a Utility Analyst with Exeter Associ-
2 ates, Inc. In December 1992,1 was promoted to Senior Regulatory Analyst.
3 Effective April 1,1996,1 became a principal of Exeter Associates. Since joining
4 Exeter Associates, I have specialized in evaluating the gas purchasing practices
5 and policies of natural gas utilities, utility class cost of service and rate design
6 analysis, sales and rate forecasting, performance-based incentive regulation,
7 revenue requirement analysis, the unbundling of utility services and evaluation of
8 customer choice natural gas transportation programs.
9 Q. HAVE YOU PREVIOUSLY TESTIFIED IN REGULATORY PROCEEDINGS
10 ON UTILITY RATES?
11 A. Yes. I have provided testimony on more than 100 occasions in proceedings
12 before the Federal Energy Regulatory Commission ("FERC"), utility regulatory
13 commissions in Delaware, Georgia, Illinois, Indiana, Louisiana, Montana,
14 Nevada, New Jersey, Ohio, Rhode Island, Texas and Virginia, as well as before
15 this Commission.
16 Q. WHAT IS THE PURPOSE OF YOUR TESTIMONY?
17 A. Exeter Associates, Inc. was retained by the Pennsylvania Office of Consumer
18 Advocate ("OCA") to review Dominion Peoples' ("the Company") 2006 1307(f)
19 Purchased Gas Cost ("PGC") filing. My testimony presents the results of my
20 review.
21 Q. HAVE YOU PREPARED EXHIBITS TO ACCOMPANY YOUR TESTIMONY?
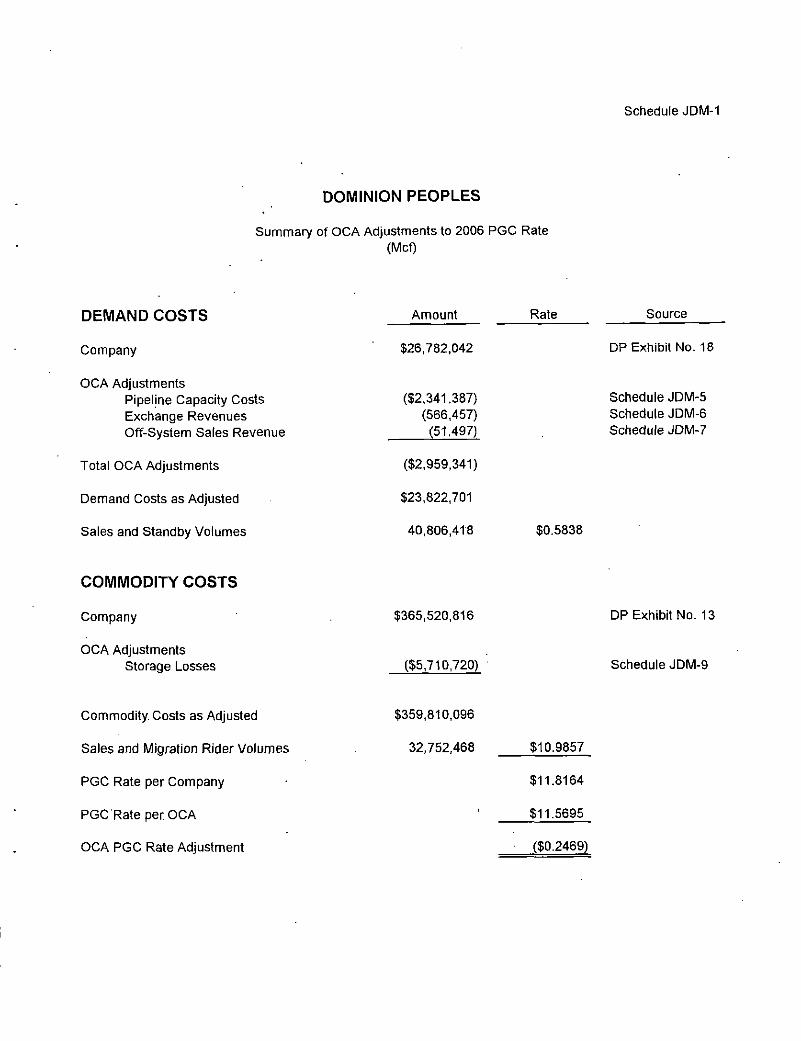
22 A. Yes, I have. Schedules JDM-1 through JDM-10 are attached to my direct
23 testimony. Schedule JDM-1 summarizes my adjustments to the Company's
24 projected purchased gas costs and presents a revised 2006 PGC rate.
25 Q. PLEASE SUMMARIZE YOUR FINDINGS AND RECOMMENDATIONS.
Direct Testimony of Jerome D. Mierzwa Page 2
1 A. My findings and recommendations are as follows:
2 • Historically, Dominion Peoples has reserved sufficient interstate pipeline 3 capacity to meet the design peak day requirements of its PGC and P-1 4 choice transportation customers, and the balancing requirements of its 5 NP-1 transportation customers. In response to the recent significant 6 increase in the price of natural gas, Dominion Peoples' customers have 7 reduced their demand for natural gas. The model utilized by the 8 Company to estimate its customers' design peak day requirements fails to 9 adequately account for this decrease in demand, and overstates the
10 Company's design peak day requirements by approximately 83,000 Mcf. 11 Dominion Peoples should adjust its interstate pipeline capacity portfolio to 12 account for this decrease in design peak day requirements;
13 • Dominion Peoples' exchange transaction revenues should be shared with 14 ratepayers, with PGC customers being credited with 75 percent of these 15 revenues;
16 • The incremental revenues generated by Dominion People's off-system 17 sales activities should be shared with ratepayers, with PGC customers 18 being credited with 75 percent of these revenues;
19 • Rate CER should be modified to exclude competition from other 20 Pennsylvania natural gas distribution companies as a valid basis to offer 21 this discounted service;
22 ' • The Company's proposed hedging plan should be modified to provide that 23 50 percent of the hedged volumes be hedged two seasons prior to 24 delivery;
25 • Dominion Peoples has developed a net benefits test to determine whether 26 retainage discounts should be provided to certain customers. The 27 retainage charge included in the Company's net benefits test should be 28 increased to 6.43 percent to reflect actual recent lost and unaccounted-for 29 ("LUFG") and company use experience;
30 • The costs associated with retainage discounts should be recovered from 31 all customers by increasing the Company's generally applicable retainage 32 charge to 8 percent;
33 • Standards should be adopted with respect to the discounting of retainage 34 and base rate charges under which Dominion Peoples cannot discount 35 retainage charges by a greater percentage than it has discounted the 36 applicable base rate charges; and
Direct Testimony of Jerome D. Mierzwa Page 3
1 • The Company claims that it experienced a storage loss of 800,000 Mcf at 2 its Rager Mountain storage field, and has assigned a cost of $5.7 million 3 to this loss. The Company is proposing to recover this loss from PGC 4 customers over a one-year period. The Company's proposal is 5 unreasonable and unsupported and should be rejected.
6 Q. WHAT IS THE OVERALL IMPACT OF YOUR RECOMMENDATION ON
7 DOMINION PEOPLES' 2006 PGC RATE?
8 A. As shown on Schedule JDM-1, my recommendations decrease Dominion
9 Peoples' 2006 PGC rate by 24.69 cents to $11.5695 per Mcf from the $11.8164
10 per Mcf rate proposed by the Company.
11
12 II. DESIGN PEAK AND PIPELINE CAPACITY ENTITLEMENTS
13 Q. PLEASE IDENTIFY THE GENERAL CATEGORIES OF CUSTOMERS
14 SERVED BY DOMINION PEOPLES.
15 A. On the Dominion Peoples system, PGC and small transportation customers
16 participating in the Company's choice program are referred to as Priority 1, or P-
17 1, customers. General transportation customers are referred to as Non-Priority
18 1, or NP-1, customers.
19 Q. DOES DOMINION PEOPLES SECURE CAPACITY TO PROVIDE FOR
20 THE DELIVERY OF GAS SUPPLIES TO ITS SYSTEM IN SUFFICIENT
21 QUANTITIES TO SERVE ALL OF ITS CUSTOMERS?
22 A. No. Dominion Peoples reserves sufficient capacity to meet the design peak day
23 requirements of its P-1 customers. NP-1 customers are responsible for securing
24 their own capacity. Dominion Peoples reserves capacity to meet the balancing
25 requirements of NP-1 customers,
26 Q. WHAT IS A DESIGN PEAK DAY?
Direct Testimony of Jerome D. Mierzwa Page 4
Q.
1 A.
2
3
4
5
6
7
8 A.
9
10
11 Q.
12
13 A.
14
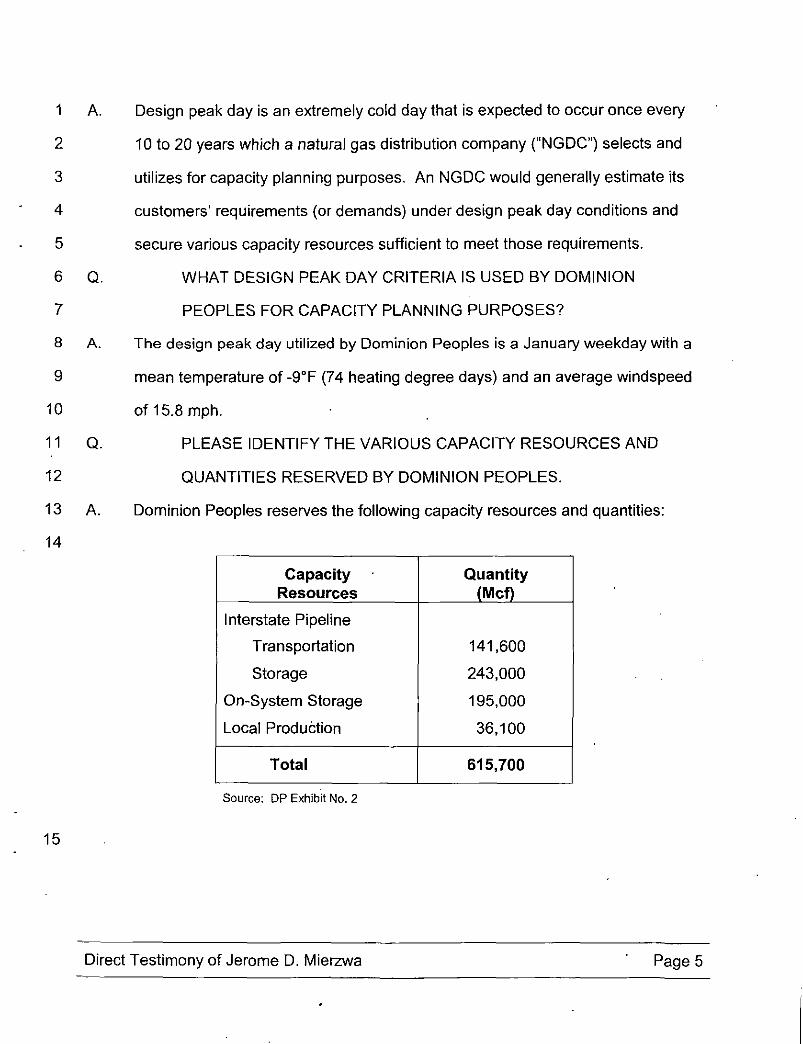
Design peak day is an extremely cold day that is expected to occur once every
10 to 20 years which a natural gas distribution company ("NGDC") selects and
utilizes for capacity planning purposes. An NGDC would generally estimate its
customers' requirements (or demands) under design peak day conditions and
secure various capacity resources sufficient to meet those requirements.
WHAT DESIGN PEAK DAY CRITERIA IS USED BY DOMINION
PEOPLES FOR CAPACITY PLANNING PURPOSES?
The design peak day utilized by Dominion Peoples is a January weekday with a
mean temperature of -90F (74 heating degree days) and an average windspeed
of 15.8 mph.
PLEASE IDENTIFY THE VARIOUS CAPACITY RESOURCES AND
QUANTITIES RESERVED BY DOMINION PEOPLES.
Dominion Peoples reserves the following capacity resources and quantities:
Capacity Quantity Resources (Mcf)
Interstate Pipeline
Transportation 141,600
Storage 243,000
On-System Storage 195,000
Local Production 36,100
Total 615,700
Source: DP Exhibit No. 2
15
Direct Testimony of Jerome D. Mierzwa Page 5
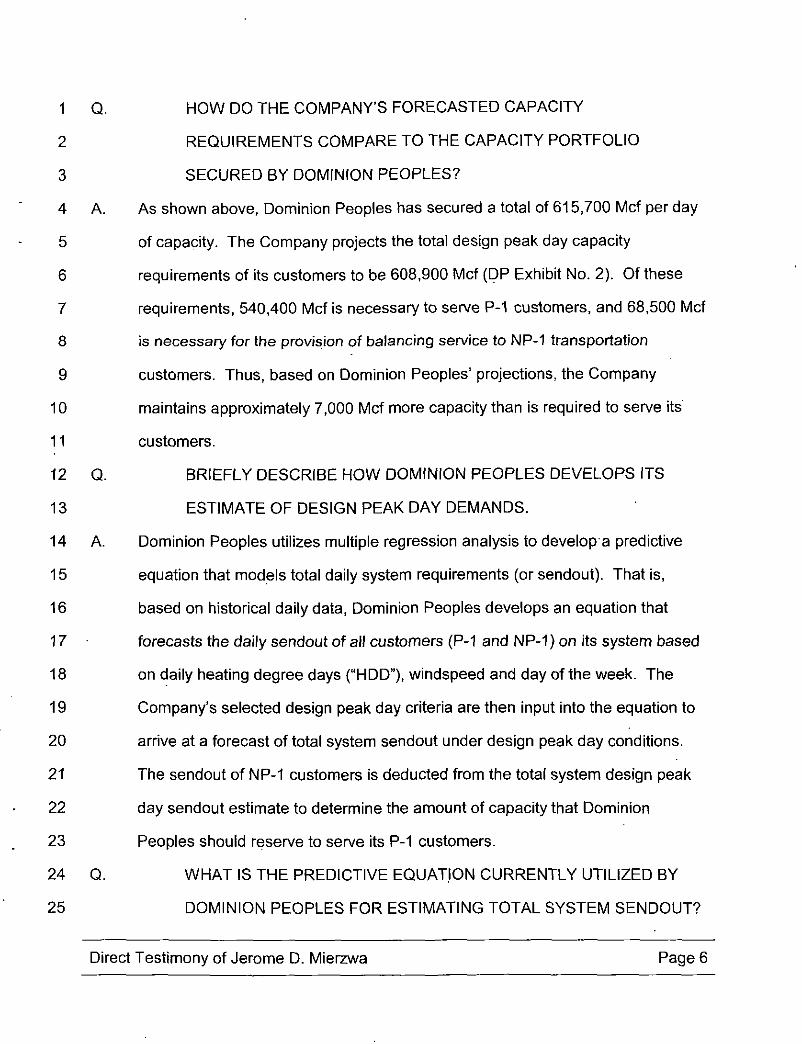
1 Q. HOW DO THE COMPANY'S FORECASTED CAPACITY
2 REQUIREMENTS COMPARE TO THE CAPACITY PORTFOLIO
3 SECURED BY DOMINION PEOPLES?
4 A. As shown above. Dominion Peoples has secured a total of 615,700 Mcf per day
5 of capacity. The Company projects the total design peak day capacity
6 requirements of its customers to be 608,900 Mcf (DP Exhibit No. 2). Of these
7 requirements, 540,400 Mcf is necessary to serve P-1 customers, and 68,500 Mcf
8 is necessary for the provision of balancing service to NP-1 transportation
9 customers. Thus, based on Dominion Peoples' projections, the Company
10 maintains approximately 7,000 Mcf more capacity than is required to serve its
11 customers.
12 Q. BRIEFLY DESCRIBE HOW DOMINION PEOPLES DEVELOPS ITS
13 ESTIMATE OF DESIGN PEAK DAY DEMANDS.
14 A. Dominion Peoples utilizes multiple regression analysis to develop a predictive
15 equation that models total daily system requirements (or sendout). That is,
16 based on historical daily data, Dominion Peoples develops an equation that
17 • forecasts the daily sendout of all customers (P-1 and NP-1) on its system based
18 on daily heating degree days ("HDD"), windspeed and day of the week. The
19 Company's selected design peak day criteria are then input into the equation to
20 arrive at a forecast of total system sendout under design peak day conditions.
21 The sendout of NP-1 customers is deducted from the total system design peak
22 day sendout estimate to determine the amount of capacity that Dominion
23 Peoples should reserve to serve its P-1 customers.
24 Q. WHAT IS THE PREDICTIVE EQUATION CURRENTLY UTILIZED BY
25 DOMINION PEOPLES FOR ESTIMATING TOTAL SYSTEM SENDOUT?
Direct Testimony of Jerome D. Mierzwa Page 6
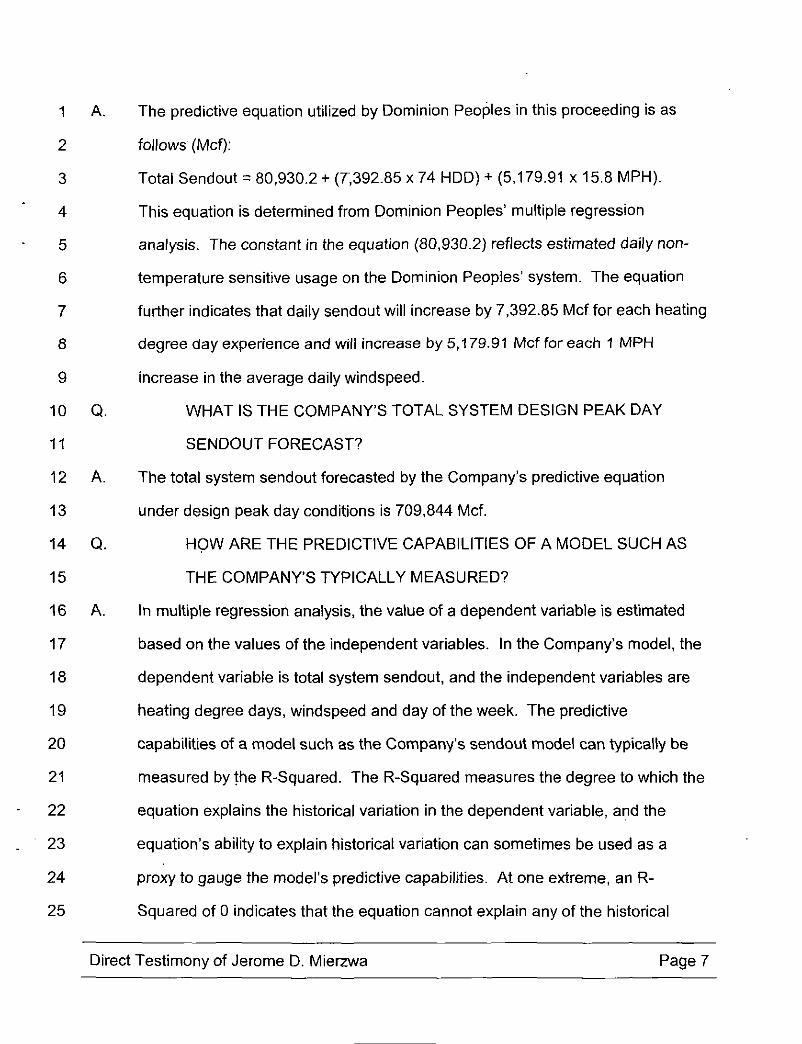
1 A. The predictive equation utilized by Dominion Peoples in this proceeding is as
2 follows (Mcf):
3 Total Sendout = 80,930.2 + (7;392.85 x 74 HDD) + (5,179.91 x 15.8 MPH).
4 This equation is determined from Dominion Peoples' multiple regression
5 analysis. The constant in the equation (80,930.2) reflects estimated daily non-
6 temperature sensitive usage on the Dominion Peoples' system. The equation
7 further indicates that daily sendout will increase by 7,392.85 Mcf for each heating
8 degree day experience and will increase by 5,179.91 Mcf for each 1 MPH
9 increase in the average daily windspeed.
10 Q. WHAT IS THE COMPANY'S TOTAL SYSTEM DESIGN PEAK DAY
11 SENDOUT FORECAST?
12 A. The total system sendout forecasted by the Company's predictive equation
13 under design peak day conditions is 709,844 Mcf.
14 Q. HOW ARE THE PREDICTIVE CAPABILITIES OF A MODEL SUCH AS
15 THE COMPANY'S TYPICALLY MEASURED?
16 A. In multiple regression analysis, the value of a dependent variable is estimated
17 based on the values ofthe independent variables. In the Company's model, the
18 dependent variable is total system sendout, and the independent variables are
19 heating degree days, windspeed and day ofthe week. The predictive
20 capabilities of a model such as the Company's sendout model can typically be
21 measured by the R-Squared. The R-Squared measures the degree to which the
22 equation explains the historical variation in the dependent variable, and the
23 equation's ability to explain historical variation can sometimes be used as a
24 proxy to gauge the model's predictive capabilities. At one extreme, an R-
25 Squared of 0 indicates that the equation cannot explain any of the historical
Direct Testimony of Jerome D. Mierzwa Page 7

1 variation of the dependent variable. An R-Squared of 1.0 indicates that the
2 model fully explains the variation in the dependent variable. The R-Squared of
3 the Company's model is .9336. This means that during the historical period
4 analyzed by the Company, the independent variables were able to predict
5 approximately 93 percent of the variation in the dependent variable sendout.
6 Q. UNDER WHAT CIRCUMSTANCES WOULD THE R-SQUARED NOT BE
7 A GOOD INDICATOR OF A MODEL'S PREDICTIVE CAPABILITIES?
8 A. The R-Squared would not be a good indicator of a model's predictive capabilities
9 if the underlying behavior experienced during the historical period is not reflective
10 of underlying behavior during the future period.
11 Q. WHAT HISTORICAL TIME PERIOD WAS UTILIZED TO DEVELOP THE
12 COMPANY'S PREDICTIVE EQUATION?
13 A. Dominion Peoples utilized daily winter period (November-March) sendout,
14 temperature and windspeed data from the period November 1992 through
15 December 2005 to develop its predictive equation.
16 Q. DOES THE MODEL DEVELOPED BY DOMINION PEOPLES PROVIDE
17 A REASONABLE ESTIMATE OF THE COMPANY'S DESIGN PEAK DAY
18 SENDOUT?
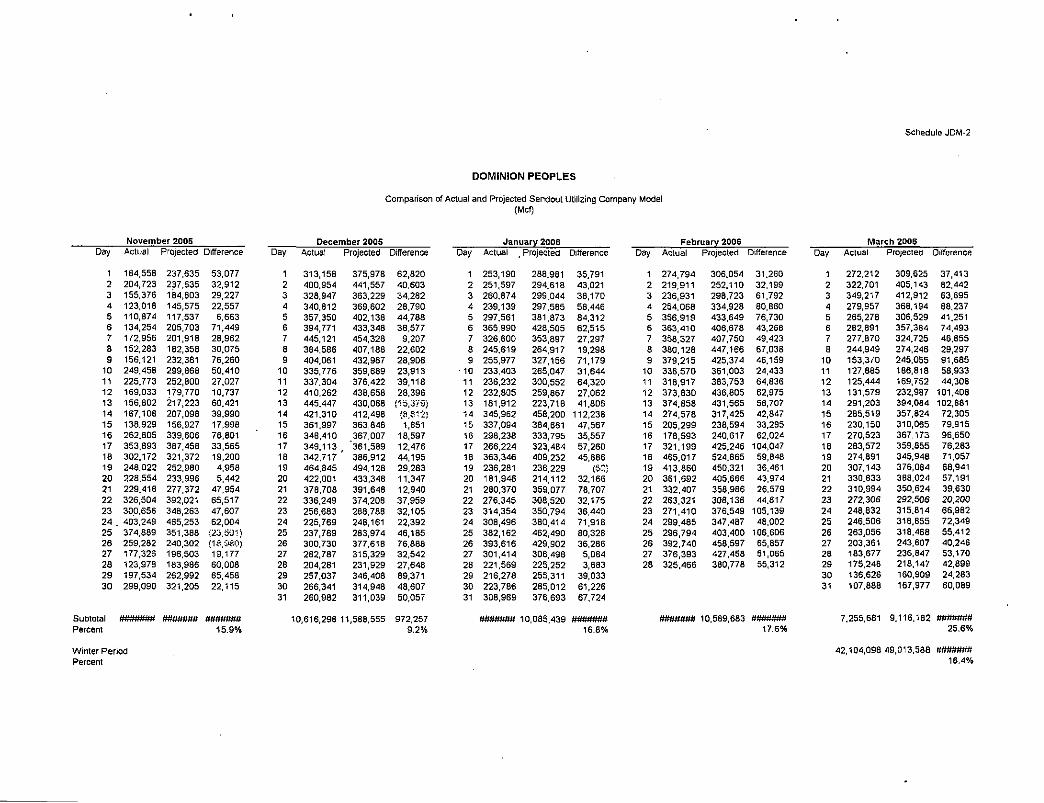
19 A. No, it does not. As shown on Schedule JDM-2, I have utilized the Company's
20 predictive equation to calculate projected total sendout for each day during the
21 winter of 2005-2006 based on actual heating degree days, windspeed and day of
22 the week. As shown there, on all but 5 days during this 151-day period, the
23 Company's model overestimated actual sendout. For the entire period, on
24 average, the Company's model overestimated actual sendout by over 16
25 percent. If the Company's model produced reasonable estimates, it would be
Direct Testimony of Jerome D. Mierzwa Page 8
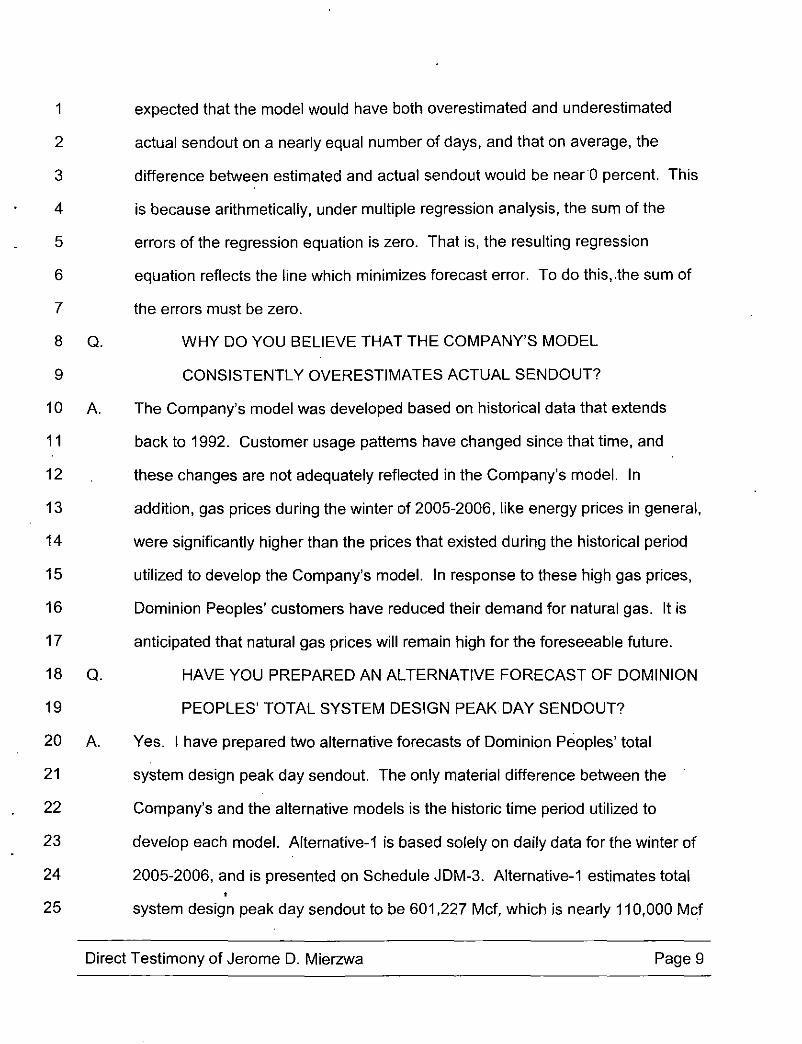
1 expected that the model would have both overestimated and underestimated
2 actual sendout on a nearly equal number of days, and that on average, the
3 difference between estimated and actual sendout would be near 0 percent. This
4 is because arithmetically, under multiple regression analysis, the sum of the
5 errors of the regression equation is zero. That is, the resulting regression
6 equation reflects the line which minimizes forecast error. To do this,.the sum of
7 the errors must be zero.
8 Q. WHY DO YOU BELIEVE THAT THE COMPANY'S MODEL
9 CONSISTENTLY OVERESTIMATES ACTUAL SENDOUT?
10 A. The Company's model was developed based on historical data that extends
11 back to 1992. Customer usage patterns have changed since that time, and
12 these changes are not adequately reflected in the Company's model. In
13 addition, gas prices during the winter of 2005-2006, like energy prices in general,
14 were significantly higher than the prices that existed during the historical period
15 utilized to develop the Company's model. In response to these high gas prices,
16 Dominion Peoples' customers have reduced their demand for natural gas. It is
17 anticipated that natural gas prices will remain high for the foreseeable future.
18 Q. HAVE YOU PREPARED AN ALTERNATIVE FORECAST OF DOMINION
19 PEOPLES' TOTAL SYSTEM DESIGN PEAK DAY SENDOUT?
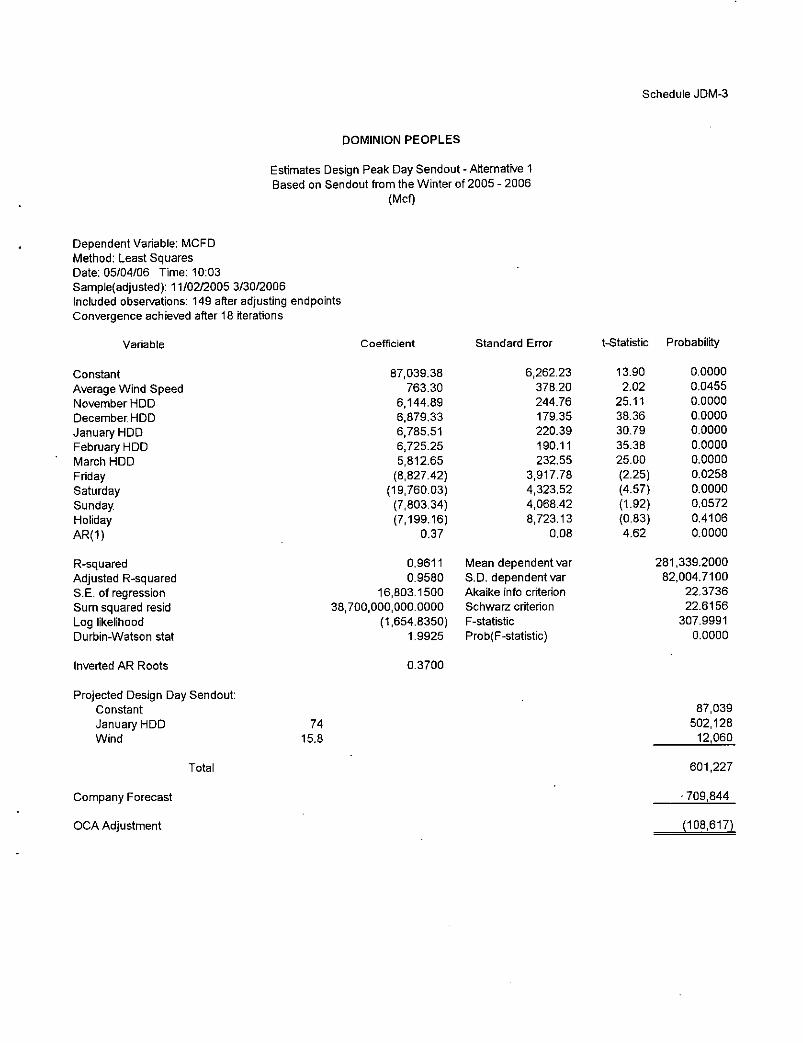
20 A. Yes. I have prepared two alternative forecasts of Dominion Peoples' total
21 system design peak day sendout. The only material difference between the
22 Company's and the alternative models is the historic time period utilized to
23 develop each model. Alternative-1 is based solely on daily data for the winter of
24 2005-2006, and is presented on Schedule JDM-3. Alternative-1 estimates total
25 system design peak day sendout to be 601,227 Mcf, which is nearly 110,000 Mcf
Direct Testimony of Jerome D. Mierzwa Page 9
1
2
3
4
5
6
7 Q.
8 A.
9 Q.
10
11 A.
12
13
14 Q.
15
16 A.
17
18
19
20
21
22
23
24 Q.
25
less than the Company's projection. Alternative-2 is based on daily data from
the 3 previous winter periods (2003-2004, 2004-2005 and 2005-2006), and thus
includes daily requirements for a period of time prior to the noted natural gas
price increase experienced last winter. Alternative-2 is presented on Schedule
JDM-4, and estimates design peak day sendout to be 626,980 Mcf, which is
approximately 83,000 Mcf less than the Company's projection.
WHICH OF THE ALTERNATIVE FORECASTS DO YOU RECOMMEND?
To be conservative, I recommend that the Company utilize Alternative-2.
WHAT COURSE OF ACTION DO YOU RECOMMEND DOMINION
PEOPLES PURSUE?
Dominion Peoples should realign its interstate pipeline capacity portfolio to
match the design peak day sendout requirements of its customers as estimated
under Alternative-2.
BY HOW MUCH SHOULD DOMINION PEOPLES REDUCE ITS
INTERSTATE PIPELINE CAPACITY?
As shown on Schedule JDM-5,1 estimate that ofthe 83,000 Mcf reduction to
design peak day requirements, approximately 4,000 Mcf is attributable to the
reduced demands of general transportation customers. In addition, as previously
indicated, Dominion Peoples had secured approximately 7,000 Mcf more
capacity than necessary to meet the requirements of the customers on whose
behalf it secures capacity. Thus, Dominion Peoples currently secures
approximately 86,000 Mcf of capacity in excess of its customers' design peak
day requirements.
HAVE YOU PREPARED A SCHEDULE QUANTIFYING THE IMPACT OF
YOUR RECOMMENDATION?
Direct Testimony of Jerome D. Mierzwa Page 10

1 A. Yes. The estimated impact of my recommendation is presented on Schedule
2 JDM-5 and JDM-6. However, to implement my recommendation, it will be
3 necessary for the Company to perform an extensive analysis of its current
4 capacity portfolio to determine how to best realign that portfolio. Therefore, the
5 estimated $2,341,387 reduction to PGC rates shown on Schedule JDM-6 will
6 likely differ from the actual rate reduction. Provided the Company realigns its
7 portfolio consistent with least cost gas procurement principles, any difference
8 between my estimate and the actual rate reduction will be reconcilable.
9
10 III. EXCHANGE REVENUES
11 Q. BRIEFLY DESCRIBE EXCHANGE TRANSACTIONS.
12 A. There are two primary types of exchange transactions - parks and loans. Under
13 a park transaction, an NGDC accepts the delivery of gas from a third-party
14 during a particular period, typically over a month, and returns the gas to the third-
15 party at a later point in time. Under a loan transaction, an NGDC delivers gas to
16 a third-party during a particular period, and the gas is returned by the third-party
17 at a later point in time. NGDCs are compensated by third-parties for performing
18 these transactions.
19 Q. DID DOMINION PEOPLES ENGAGE IN EXCHANGE ACTIVITIES
20 DURING THE PERIOD SUBJECT TO REVIEW IN THIS PROCEEDING?
21 A. Yes. Dominion Peoples engaged in six park transactions during the period
22 subject to review in this proceeding. Under each transaction, the Company
23 claims that third-party gas was injected into its on-system storage facilities and
24 later withdrawn. These transactions generated revenues of $755,276. The
25 Company is proposing to fully retain these revenues.
Direct Testimony of Jerome D. Mierzwa Page 11

1 Q. SHOULD DOMINION PEOPLES BE PERMITTED TO FULLY RETAIN
2 THESE REVENUES?
3 A. No. In Equitable Gas Company's 2005 1307(f) proceeding at Docket No. R-
4 00050272, the Commission required a 75 percent sharing of exchange revenues
5 with PGC customers. This sharing was provided for because interstate pipeline.
6 assets paid for by PGC customers were utilized to effectuate the exchange
7 transactions. Although Dominion Peoples claims that on-system resources were
8 used to effectuate its exchange transactions, interstate pipeline assets could
9 have been used to perform these transactions, and use of interstate pipeline
10 assets would have been consistent with least-cost gas acquisition principles.
11 Therefore, the sharing procedures adopted for Equitable should be applied to
12 Dominion Peoples' review period exchange transactions. A sharing of these
13 revenues will also assist in mitigating the impact of high gas prices on PGC
14 customers. An adjustment to PGC rates to reflect my recommendation is
15 presented on Schedule JDM-7.
16
17 IV. OFF-SYSTEM SALES
18 Q. ( DID DOMINION PEOPLES ENGAGE IN OFF-SYSTEM SALES
19 TRANSACTIONS DURING THE PERIOD SUBJECT TO REVIEW IN
20 THIS PROCEEDING?
21 A. Yes. Dominion Peoples engaged in approximately 30 off-system sales
22 transactions during the period subject to review in this proceeding. These
23 transactions generated incremental revenues of $68,662. Dominion Peoples is
24 also proposing to fully retain these revenues.
Direct Testimony of Jerome D. Mierzwa Page 12
1 Q. SHOULD DOMINION PEOPLES BE PERMITTED TO FULLY RETAIN
2 THE INCREMENTAL REVENUES ASSOCIATED WITH OFF-SYSTEM
3 SALES?
4 A. No. As with exchange revenues, in Docket No. R-00050272, the Commission
5 determined that incremental revenues generated by off-system sales should be
6 shared 75 percent with PGC customers. Schedule JDM-8 presents an
7 adjustment to PGC rates to reflect a sharing of incremental off-system revenues,
8 consistent with the Commission's Order in Docket No. R-00050272.
9
10 V. COMPETITIVE ENERGY RATE - RATE CER
11 Q. PLEASE DESCRIBE DOMINION PEOPLES' COMPETITIVE ENERGY
12 RATE, RATE CER.
13 A. Rate CER is a firm service available to residential, commercial and industrial
14 ratepayers, who in the Company's sole discretion, would not request service
15 from the Company due to competitive alternatives but for the availability of
16 service under Rate CER. Rate CER provides for a discount to the otherwise
17 applicable PGC rate. The discount is negotiated between the Company and the
18 ratepayer. The rates for CER service for residential ratepayers will be discounted
19 only where the Company's service territory overlaps areas also served by other
20 NGDCs subject to the Commission's jurisdiction.
21 Q. WHAT IS YOUR CONCERN WITH RATE CER?
22 A. Under Rate CER, Dominion Peoples is authorized to offer service at rates that
23 are discounted from the othen/vise applicable PGC rate in response to
24 competition from other Pennsylvania NGDCs. Under PGC procedures, these
25 gas cost discounts are automatically recovered from remaining, captive PGC
Direct Testimony of Jerome D. Mierzwa Page 13
1 customers. In the Order in Dominion Peoples' 2005 1307(f) proceeding (Docket
2 No. R-00050267), the Commission found that the granting of discounts to
3 * compete against other Pennsylvania NGDCs in combination with the automatic
4 flow-through ofthe costs ofthe discounts to be an unreasonable practice.
5 Dominion Peoples' existing Rate CER should be modified to be consistent with
6 the Commission's Order in Docket No. R-00050267. That is, Rate CER should
7 be modified to exclude competition from other Pennsylvania NGDCs as a valid
8 basis to offer this discounted service.
9
10 VI. HEDGING PROGRAM
11 Q. BRIEFLY DESCRIBE DOMINION PEOPLES' CURRENT HEDGING
12 PLAN TO MITIGATIVE GAS PRICE VOLATILITY.
13 A. Pursuant to a pilot program approved by the Commission in the Company's 2004
14 1307(f) proceeding (Docket No. R-00049153), Dominion Peoples hedged
15 approximately 18 percent of its total 2005 summer period purchases by
16 purchasing that gas during the summer of 2004, and approximately 18 percent of
17 its total 2006 summer period purchases during the summer of 2005.
18 Q. WHAT IS DOMINION PEOPLES PROPOSING WITH RESPECT TO
19 FUTURE HEDGING ACTIVITIES WHEN THE PILOT PROGRAM •
20 EXPIRES?
21 A. Dominion Peoples is proposing to hedge the price of 25 percent of its monthly
22 purchases on an ongoing basis. This portion of winter deliveries will be hedged
23 during the immediately prior summer, and summer deliveries will be hedged
24 during the immediately prior winter.
Direct Testimony of Jerome D. Mierzwa Page 14

1 Q. SHOULD DOMINION PEOPLES PROPOSED HEDGING PLAN BE
2 ADOPTED?
3 A. Yes, with one modification. To provide for additional price diversification, rather
4 than hedging all ofthe affected volumes during the prior season, I recommend
5 that 50 percent of the volumes should be hedged two seasons prior to delivery.
6 That is, for example, 50 percent of the volumes to be hedged for the summer of
7 2007 should be hedged during the summer of 2006 and 50 percent should be
8 hedged during the winter of 2006-2007.
9
10 VII. RETAINAGE DISCOUNTS
11 Q. WHAT IS RETAINAGE?
12 A. A portion of the gas delivered to an NGDC is lost or otherwise unaccounted-for
13 ("LUFG"). In addition, a portion ofthe gas delivered to an NGDC is used in
14 company operations. Currently, approximately 6.5 percent of deliveries to
15 Dominion Peoples' system are either LUFG or used in company operations
16 (collectively "losses"). That is, for example, if 1,000 Mcf is delivered to Dominion
17 Peoples, only 9,350 Mcf is delivered to customers. For sales customers, LUFG
18 and company-use gas is recovered through PGC rates. For transportation
19 customers, these losses are typically recovered through a retainage, or fuel
20 retention charge. That is, if the retainage charge is 6.5 percent, and if a
21 transportation customer expects to consume 9,350 Mcf, it must deliver 1,000 Mcf
22 to Dominion Peoples. The 650 Mcf difference would be retained by Dominion
23 Peoples as compensation for LUFG and company use gas. As subsequently
24 discussed, Dominion Peoples' current retainage charge for transportation
Direct Testimony of Jerome D. Mierzwa Page 15

1 customers is 5.3 percent, which is less than the Company's actual loss
2 experience.
3 Q. HAS THE COMPANY HISTORICALLY DISCOUNTED ITS RETAINAGE
4 CHARGE?
5 A. Yes. The discounting of retainage charges was addressed by the Commission in
6 the Company's 2005 1307(f) proceeding (Docket No. R-00050267).
7 Q. WHAT DID THE COMMISSION FIND WITH RESPECT TO THE
8 DISCOUNTING OF RETAINAGE CHARGES IN THE COMPANY'S 2005
9 1307(f) PROCEEDING?
10 A. The Commission found that Dominion Peoples was discounting retainage
11 charges in response to competition from other Pennsylvania NGDCs, and that
12 the costs associated with these discounts were being recovered from PGC
13 customers. The Commission found that this was not a reasonable practice, and
14 ruled that retainage charges could only be discounted under certain
15 circumstances. These circumstances included instances in which a customer
16 may obtain service by direct bypass, receive service through facilities that could
17 not produce the system average loss percentage, a competitive offer from a non-
18 jurisdictional entity, economic development and job retention, and instances
19 where there is a bona fide competitive offer from an alternative energy source.
20 The Commission further stated that if such circumstances exist, then "it should
21 also be demonstrated that the existing customer charges cover, at a minimum,
22 the marginal cost of providing transportation service, so as to ensure a
23 contribution to fixed costs."
24 Q. WHAT IS THE COMPANY PROPOSING WITH RESPECT TO THE
25 DISCOUNTING OF RETAINAGE CHARGES IN THIS PROCEEDING?
Direct Testimony of Jerome D. Mierzwa Page 16
1. A. For those customers that the Company believes warrant a retainage charge
2 discount, under circumstances identified by the Commission, Dominion Peoples
3 has established a test to determine if service to those customers results in a net
4 benefit to remaining customers. This test quantifies the incremental revenues
5 generated by serving a customer and compares those revenues with the
6 incremental costs incurred by the Company to provide service. Included in the
7 net benefits test are the costs associated with retainage discounts. The net
8 benefits test is meant to determine if a customer's existing charges exceed the
9 marginal cost of providing transportation service, so as to produce a contribution
10 to fixed costs. Those customers that provide a contribution to fixed costs are
11 granted a retainage charge discount.
12 Q. IN GENERAL, IS DOMINION PEOPLES' NET BENEFITS TEST A
13 REASONABLE RESPONSE TO THE COMMISSION'S ORDER
14 CONCERNING THE DISCOUNTING OF RETAINAGE CHARGES?
15 A. In general, the net benefits test appears to be consistent with the Commission's
16 Order. However, as subsequently discussed, there are several modifications to
17 the discounting of retainage and the recovery of the associated costs that should
18 be adopted. First, the fuel retention charge included in the net benefits test
19 should be increased to 6.43 percent. Second, the costs associated with
20 retainage discounts should be recovered from all customers, not just PGC sales
21 customers. Finally, standards should be adopted with respect to the discounting
22 of retainage charges and base rates.
23 o' WHY SHOULD DOMINION PEOPLES UTILIZE A RETAINAGE CHARGE
24 OF 6.43 PERCENT IN ITS NET BENEFITS TEST?
Direct Testimony of Jerome D. Mierzwa Page 17
1 A. Over the past three years, LUFG and company use gas have averaged 6.43
2 percent of total deliveries, not the 5.3 percent utilized in the net benefits test.
3 Since the retainage charge is intended to recover the costs associated with
4 LUFG and company-use, the retainage charge utilized in the net benefits test
5 should be increased to 6.43 percent.
6 Q. WHY SHOULD THE COSTS ASSOCIATED WITH RETAINAGE
7 CHARGE DISCOUNTS NOT BE RECOVERED SOLELY FROM PGC
8 CUSTOMERS?
9 A. The majority of the Company's throughput is transportation service. Since all
10 gas is subject to being lost and otherwise unaccounted for, and since all services
11 are supported by company operations that also utilize gas, there is no basis to
12 limit the recovery of retainage charge discounts to only PGC customers.
13 Q. HOW COULD RETAINAGE CHARGE DISCOUNTS BE RECOVERED
14 FROM TRANSPORTATION CUSTOMERS WHO DO NOT RECEIVE A
15 DISCOUNT?
16 A. To recover retainage charge discounts from transportation customers who do not
17 receive a discount, the retainage charge to these customers should be increased
18 to recover a pro rata share of the discounts. This would be accomplished by
19 raising the generally applicable retainage charge to 8 percent (Schedule JDM :9).
20 This recommended retainage charge reflects Dominion Peoples' recent loss
21 experience of 6.43 percent and a pro rata allocation of discounts. If the retainage
22 charge is not increased, transportation customers would continue to be assessed
23 a retainage charge of 5.3 percent; while PGC customers would effectively pay a
24 retainage charge of over 10 percent (Schedule JDM-9). This disparity would
25 occur because in addition to paying for retainage on a system average basis,
Direct Testimony of Jerome D. Mierzwa Page 18
1 PGC customers would also be paying for all of the retainage not collected from
2 transportation customers.
3 Q. WHAT IS YOUR CONCERN WITH RESPECT TO THE ABILITY OF
4 DOMINION PEOPLES TO DISCOUNT BOTH BASE RATES AND
5 RETAINAGE CHARGES?
6 A. By granting discounts to retainage charges, Dominion Peoples is able to
7 increase the recovery of base rate margins from the transportation customers to
8 whom discounts are granted. The cost of these retainage discounts would then
9 be automatically recovered from other customers through the operation of the
10 PGC mechanism. These discounts may be substantial, especially as gas costs
11 have increased. It is unreasonable to leave to Dominion Peoples' discretion the
12 extent to which retainage charge discounts should be granted to select
13 customers in competitive situations, while offering Dominion Peoples the ability
14 to automatically collect these discounts through its PGC rates. Standards should
15 be established with respect to the discounting of base rates and retainage
16 charges.
17 Q. WHAT STANDARDS DO YOU RECOMMEND?
18 A. I recommend that Dominion Peoples not discount retainage charges to a
19 transportation customer by a greater percentage than it has discounted the
20 applicable base rate charges.
21 Q. ARE YOU PROPOSING AN ADJUSTMENT TO PGC RATES TO
22 REFLECT THE ADOPTION OF YOUR RECOMMENDATIONS
23 CONCERNING RETAINAGE CHARGES AND DISCOUNTS?
24 A. No. The PGC rates projected in the Company's filing generally assume that the
25 same retainage charge assessed to transportation customers will be applicable
Direct Testimony of Jerome D. Mierzwa Page 19

1 to PGC customers. As just explained, Dominion Peoples is proposing to recover
2 retainage charge discounts solely from PGC customers, and the retainage
3 charge currently assessed to other non-discounted transportation customers (5.3
4 percent) is less than the Company's recent loss experience (6.43 percent). As a
5 result, PGC customers will effectively pay a higher retainage charge than
6 transportation customers. This higher charge is not reflected in the Company's
7 PGC rate projections. The cost consequences of the higher retainage charge to
8 PGC customers will not be realized until actual gas costs and gas cost
9 recoveries are reconciled. Therefore, I am not proposing an adjustment to PGC
10 rates to reflect my recommendations concerning retainage charges. However, I
11 have prepared Schedule JDM-9 to show the impact of adopting my
12 recommendations on the gas costs of PGC customers during the reconciliation
13 of actual gas costs and recoveries. As shown here, my recommendations would
14 decrease the gas costs of PGC customers by approximately $8.3 million.
15 Q. DO YOU HAVE ANY OTHER COMMENTS CONCERNING THE
16 RETAINAGE ISSUE?
17 A. Yes, I have two. First, during the course of discovery, the Company noted that
18 errors were made in the preparation of DP Exhibit No. 25. This exhibit presented
19 the Company's net benefits test analyses. The Company has indicated that it
20 will revise the exhibit; however, the Company has not yet made the revised
21 exhibit available.
22 Second, in discovery, the OCA asked to review the contract files of the
23 customers to whom retainage discounts-are being granted. The Company
24 indicted that these files would only be available for review at the offices of
25 counsel for the Company. Due to scheduling difficulties, review of these contract
Direct Testimony of Jerome D. Mierzwa Page 20
1 files will not occur within sufficient time to include any findings from the review in
2 my testimony. Therefore, upon review of revised DP Exhibit No. 25 and the
3 contract files of the customers to whom retainage discounts are being granted, it
4 may be necessary to supplement my testimony on the issue of retainage.
5
6 VIII. STORAGE LOSSES
7 Q. WHAT IS DOMINION PEOPLES PROPOSING IN THIS PROCEEDING
8 WITH RESPECT TO STORAGE LOSSES?
9 A. Dominion People claims that a recent storage engineering analysis determined
10 that a former production well owned and operated by the Company was actually
11 withdrawing gas from the Company's Rager Mountain storage field. As a result,
12 the Company's Rager Mountain storage facility experienced a loss of 800,000
13 Mcf. The Company has valued this loss at $5.71 million, and is proposing to
14 recover the loss from PGC customers over a one-year period.
15 Q. IS THE COMPANY'S PROPOSAL TO RECOVER THE RAGER
16 MOUNTAIN STORAGE LOSS REASONABLE?
17 A. No, the Company's proposal is unsupported and unreasonable, and should be .
18 rejected. The loss at the Rager Mountain storage field occurred because a
19 company owned well was producing gas from the field. The loss occurred over a
20 number of years prior to 1993. The Company has assigned a price of $7.1384
21 per Mcf to the loss. This price reflects the Company's average cost of gas in
22 2005, and significantly exceeds the cost of gas during the period the loss
23 occurred. Thus, the Company has utilized an incorrect cost basis to value the
24 loss and its valuation of the loss is unsupported.
Direct Testimony of Jerome D. Mierzwa Page 21
1 In addition, the Company's proposal to recover the loss from current PGC
2 customers over a one-year period is unreasonable, and creates an
3 intergenerational subsidy. The loss occurred over a number of years many
4 years ago. Dominion Peoples' cost recovery proposal would charge current
5 PGC customers for the benefits received by PGC customers many years ago.
6 Schedule JDM-10 adjusts PGC rates to reflect my recommendation concerning
7 the Rager Mountain storage loss.
8 Q. IF THE COMMISSION DOES NOT ADOPT YOUR POSITION AND
9 DETERMINES THAT RECOVERY OF THE LOSS IS APPROPRIATE,
10 HOW SHOULD THE LOSS BE RECOVERED?
11 A. I recommend that any loss that the Commission permits the Company to recover
12 be amortized over a 10-year period and collected from all customers. A 10-year
13 amortization is consistent with the Commission's Order in Docket No. R-
14 00038170 wherein, due to the Company's error, it failed to seek timely recovery
15 of a purchased gas cost under collection. Recovery from all customers
16 recognizes that the customers taking sales service from the Company at the time
17 the loss occurred cannot be identified, and many current transportation
18 customers were PGC customers at the time.
19 Q. DOES THIS CONCLUDE YOUR DIRECT TESTIMONY?
20 A. Yes, it does.
21
22
23 24 88781 25
Direct Testimony of Jerome D. Mierzwa Page 22
.BEFORE THE
PENNSYLVANIA PUBLIC UTILITY COMMISSION
PENNSYLVANIA PUBLIC UTILITY COMMISSION
v.
THE PEOPLES NATURAL GAS COMPANY d/b/a DOMINION PEOPLES
DOCKET NO. R-00061301
SCHEDULES ACCOMPANYING THE
DIRECT TESTIMONY
OF
JEROME D. MIERZWA
ON BEHALF OF THE
PENNSYLVANIA OFFICE OF CONSUMER ADVOCATE
MAY 2006
EXETER ASSOCIATES, INC.
5565 Sterrett Place Suite 310
Columbia, Maryland 21044
DOMINION PEOPLES
Summary of OCA Adjustments to 2006 PGC Rate (Mcf)
Schedule JDM-1
DEMAND COSTS
Company
OCA Adjustments Pipeline Capacity Costs Exchange Revenues Off-System Sales Revenue
Total OCA Adjustments
Demand Costs as Adjusted
Sales and Standby Volumes
Amount Rate Source
$26,782,042
($2,341,387) (566,457) (51,497)
($2,959,341)
$23,822,701
40,806,418
DP Exhibit No. 18
Schedule JDM-5 Schedule JDM-6 Schedule JDM-7
$0.5838
COMMODITY COSTS
Company
OCA Adjustments Storage Losses
Commodity. Costs as Adjusted
Sales and Migration Rider Volumes
PGC Rate per Company
PGC Rate per. OCA
OCA PGC Rate Adjustment
$365,520,816
($5,710,720)
$359,810,096
32,752,468 $10.9857
$11.8164
$11.5695
DP Exhibit No. 13
Schedule JDM-9
($0.2469)
DOMINION P E O P L E S
Comparison of Actual and Projected Sendout Utilizing Company Model (Mcf)
Schedule JDM-2
November 2005 December 2005 January 2006 Day Actual Projected Difference Day Actual Projected Difference Day Actual , Projected Difference Day
1 184,558 237,635 53,077 1 313,158 375,978 62,820 1 253,190 288,981 35,791 1 2 204,723 237,635 32,912 2 400,954 441,557 40,603 2 251,597 294,518 43,021 2 3 155.376 184,603 29,227 3 328,947 363,229 34,282 3 260,874 299,044 38,170 3 4 123,018 145,575 22,557 4 340,812 369,602 28,790 4 239,139 297,565 58,446 4 5 110,874 117,537 6,663 5 357,350 402,138 44.788 5 297,561 381,873 84,312 5 6 134,254 205,703 71,449 6 394,771 433,348 38,577 6 365,990 428,505 62,515 6 7 172,956 201,918 28,962 7 445,121 454,328 9,207 7 326,600 353,897 27,297 7 8 152,283 182,358 30.075 8 364,586 407,188 22,602 8 245.619 264,917 19,298 8 9 156,121 232,381 76,260 9 404,061 432,967 28,906 9 255,977 327,156 71,179 9
10 249,458 299,868 50,410 10 335,776 359,689 23,913 • 10 233,403 265,047 31,644 10 11 225.773 252,800 27,027 11 337,304 376,422 39,118 11 236,232 300,552 64,320 11 12 169,033 179,770 10,737 12 410.262 438,658 28,396 12 232,805 259,867 27.062 12 13 156,802 217,223 60,421 13 445,447 430,068 {15,375} 13 181,912 223,718 41.806 13 14 167,108 207,098 39,990 14 421,310 412,498 14 345,962 458,200 112,238 14 15 138,929 156,927 17,998 15 361,997 363,848 1,851 15 337,094 384,661 47,567 15 16 262.805 339,606 76,801 16 348,410 367,007 18,597 16 298,238 333,795 35,557 16 17 353,893 387,458 33,565 17 349.113 "361.589 12,476 17 266,224 323,484 57,260 17 18 302,172 321,372 19,200 18 342,717 386.912 44,195 IB 363,346 409,232 45,886 18 19 248,022 252,980 4,958 19 464,845 494,128 29,263 19 236,281 236,229 19 20 228,554 233,996 5,442 20 422,001 433,346 11.347 20 181,946 214,112 32,166 20 21 229,418 277.372 47,954 21 378,708 391.646 12,940 21 280,370 359,077 78,707 21 22 326,504 392,021 65,517 22 336,249 374,208 37,959 22 276,345 308,520 32,175 22 23 300,656 348,263 47,607 23 256,683 288,788 32,105 23 314,354 350,794 36,440 23 24 . 403,249 465,253 62,004 24 225,769 248,161 22,392 24 308,496 380,414 71,918 24 25 374,889 351,388 :2o :Oii': i 25 237,789 283,974 46,185 25 382,162 462,490 80,328 25 26 259,282 240,302 26 300,730 377,618 76,888 26 393,616 429,902 36,286 26 27 177,326 196,503 19,177 27 282,787 315,329 32,542 27 301,414 306,498 5,084 27 28 123,978 183,986 60,008 26 204,281 231,929 27,648 28 221,569 225,252 3,683 28 29 197,534 262,992 65,458 29 257,037 346,408 89,371 29 216,278 255,311 39,033 30 299,090 321,205 22,115 30 266,341 314,948 48,607 30 223,786 285,012 61,226
31 260,982 311,039 50,057 31 308,969 376,693 67,724
Subtotal 10,616,296 11,588,555 972,257 mm-m 10,085,439
February 2006 March ZD06 roj ected Difference •ay Actual P reject ed Difference
306,054 31.260 1 272,212 309,625 37,413 252.110 32,199 2 322,701 405,143 82,442 298,723 61,792 3 349,217 412,912 63,695 334,928 60,660 4 279,957 368,194 68,237 433,649 76,730 5 265,278 306,529 41.251 406,678 43,266 6 282,891 357,384 74,493 407,750 49,423 7 277,870 324,725 46,855 447,166 67.038 8 244,949 274,246 29,297 425,374 46.159 10 153,370 245,055 91,685 361.003 24,433 11 127,885 166,818 58.933 383,753 64,836 12 125,444 169,752 44,308 436,605 62,975 13 131.579 232.987 101.408 431,565 56,707 14 291,203 394,084 102,681 317,425 42,847 15 285.519 357,824 72,305 238,594 33,295 16 230,150 310,065 79.915 240,617 62.024 17 270,523 367,173 96,650 425.246 104,047 18 283,572 359,855 76,283 524,865 59,648 19 274,891 345,948 71.057 450,321 36,461 20 307,143 376,084 68.941 405,666 43,974 21 330,633 388,024 57,191
358.986 26.579 22 310,994 350,624 39,630 308,138 44,817 23 272,306 292,506 20,200 376,549 105.139 24 248,832 315.814 66,962 347,487 48,002 25 246.506 318,855 72,349
403,400 106,606 26 263,056 318,468 55.412 458,597 65,857 27 203,361 243,607 40,246 427,458 51,065 26 183,677 236,847 53.170 380,778 55,312 29 175.248 218.147 42,899
30 136.626 160.909 24,283
31 107.888 167,977 60,089
Percent 15.9% 9.2% 16.8%
274,794 219,911 236,931 254,068 336,919 363,410 358,327 380.128 379,215 336,570 318,917 373,830 374.858 274,578 205,299 178,593 321.199 465.017 413,860 361,692 332,407 263,321 271.410 299.465 296,794 392,740 376,393 325,466
mmmtt io,589,683 nmmm 17.6%
7.255,681 9,116,162 m m i m 25.6%
Winter Period Percent
42,104,098 49,013,588 mtlMtt!) 16.4%
Schedule JDM-3
DOMINION PEOPLES
Estimates Design Peak Day Sendout - Alternative 1 Based on Sendout from the Winter of 2005 - 2006
(Mcf)
Dependent Variable: MCFD Method: Least Squares Date: 05/04/06 Time: 10:03 Sample(adjusted): 11/02/2005 3/30/2006 Included observations: 149 after adjusting endpoints Convergence achieved after 18 iterations
Variable Coefficient Standard Error t-Statistic Probability
Constant 87,039.38 6,262.23 13.90 0.0000 Average Wind Speed 763.30 378.20 2.02 0.0455 November HDD 6,144.89 244.76 25.11 0.0000 December, HDD 6,879.33 179.35 38.36 0.0000 January HDD 6,785.51 220.39 30.79 0.0000 February HDD 6,725.25 190.11 35.38 0.0000 March HDD 5,812.65 232.55 25.00 0.0000 Friday (8,827.42) 3,917.78 (2.25) 0.0258 Saturday (19,760.03) 4,323.52 (4-57) 0.0000 Sunday. (7,803.34) 4,068.42 (1.92) 0.0572 Holiday (7,199.16) 8,723.13 (0.83) 0.4106 AR(1) 0.37 0.08 4.62 0.0000
R-squared 0.9611 Mean dependent var 281,339.2000 Adjusted R-squared 0.9580 S.D. dependent var 82,004.7100 S.E. of regression 16,803.1500 Akaike info criterion 22.3736 Sum squared resid 38,700,000,000.0000 Schwarz criterion 22.6156 Log likelihood (1,654.8350) F-statistic 307.9991 Durbin-Watson stat 1.9925 Prob(F-statistic) 0.0000
Inverted AR Roots 0.3700
Projected Design Day Sendout: Constant January HDD Wind
Company Forecast
OCA Adjustment
74 15.8
Total
87,039 502,128 12,060
601,227
709,844
(108,617)
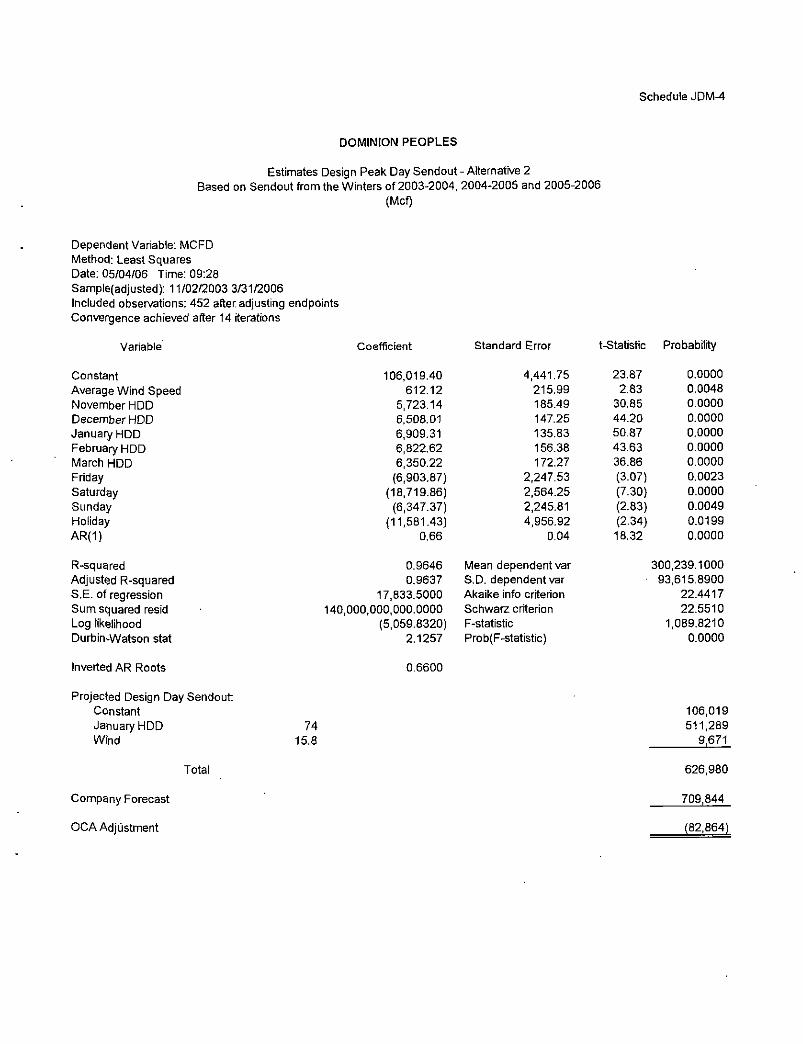
Schedule JDM-4
DOMINION PEOPLES
Estimates Design Peak Day Sendout - Alternative 2 Based on Sendout from the Winters of 2003-2004, 2004-2005 and 2005-2006
(Mcf)
Dependent Variable: MCFD Method: Least Squares Date: 05/04/06 Time: 09:28 Sample(adjusted): 11/02/2003 3/31/2006 Included observations: 452 after adjusting endpoints Convergence achieved after 14 iterations
Variable Coefficient Standard Error t-Statistic Probability
Constant 106,019.40 4,441.75 23.87 0.0000 Average Wind Speed 612.12 215.99 2.83 0.0048 November HDD 5,723.14 185.49 30.85 0.0000 December HDD 6,508.01 147.25 44,20 0.0000 January HDD 6,909.31 135.83 50.87 0.0000 February HDD 6,822.62 156.38 43.63 0.0000 March HDD 6,350.22 172.27 36.86 0.0000 Friday (6,903.87) 2,247.53 (3.07) 0.0023 Saturday (18,719.86) 2,564.25 (7.30) 0.0000 Sunday (6,347.37) 2,245.81 (2.83) 0.0049 Holiday (11,581.43) 4,956.92 (2.34) 0.0199 AR(1) 0.66 0.04 18.32 0.0000
R-squared 0.9646 Mean dependent var 300,239.1000 Adjusted R-squared 0.9637 S.D. dependentvar 93,615.8900 S.E. of regression 17,833.5000 Akaike info criterion 22.4417 Sum squared resid 140,000,000,000.0000 Schwarz criterion 22.5510 Log likelihood (5,059.8320) F-statistic 1,089.8210 Durbin-Watson stat 2.1257 Prob( F-statistic) 0.0000
Inverted AR Roots 0.6600
Projected Design Day Sendout: Constant January HDD Wind
74 15.8
106,019 511,289
9,671
Company Forecast
OCA Adjustment
Total 626,980
709,844
(82,864)

Schedule JDM-5
DOMINION PEOPLES
Calculation of Excess Capacity (Mcf)
OCA Adjustment to Desigh Peak Day Forecast 83,000
Excess Capacity in Current Portfolio 7,000
Normalized Commercial & Industrial Transportation Volumes
January 2005 3,542,860 January 2006 3,410,544
Percent Change 3.9%
Projected Design Day Requirements 102,900
Change in Design Day Transportation Requirements (3,992)
Adjustment to Capacity Requirements 86,008
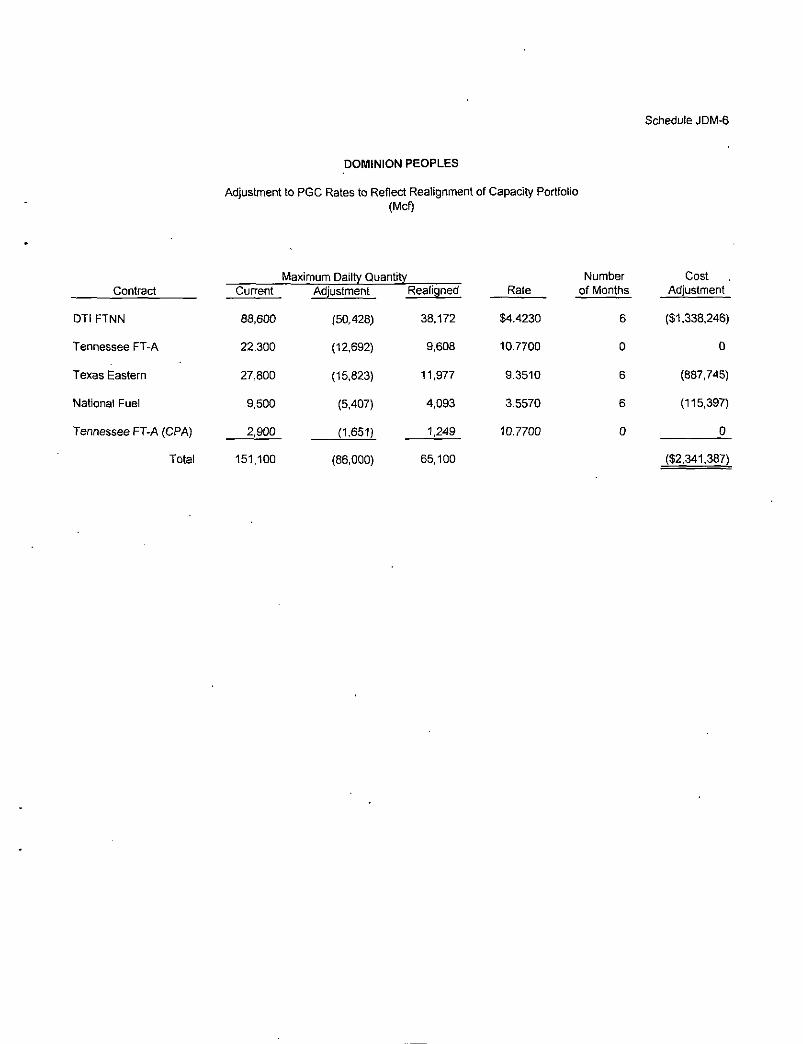
Schedule JDM-6
DOMINION PEOPLES
Adjustment to PGC Rates to Reflect Realignment of Capacity Portfolio (Mcf)
Maximum Dailty Quantity Number Cost Contract Current Adjustment Realigned Rate of Months Adjustment
DTI FTNN 88,600 (50,428) 38.172 $4.4230 6 ($1,338,246)
Tennessee FT-A 22,300 (12,692) 9,608 10.7700 0 0
Texas Eastern 27,800 (15,823) 11,977 9.3510 6 (887,745)
National Fuel 9,500 (5,407) 4,093 3.5570 6 (115,397)
Tennessee FT-A (CPA) 2,900 (1,651) 1,249 10.7700 0 0
Total 151,100 (86,000) 65,100 ($2,341,387)
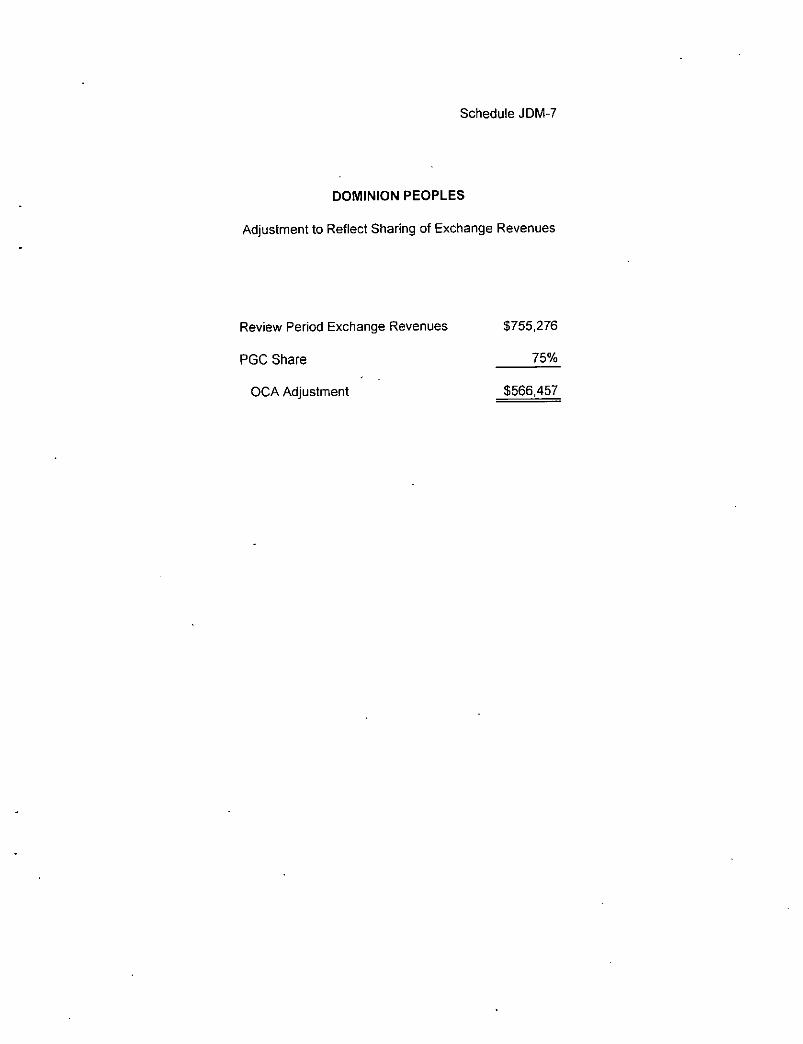
Schedule JDM-7
DOMINION PEOPLES
Adjustment to Reflect Sharing of Exchange Revenues
Review Period Exchange Revenues $755,276
PGC Share 75%
OCA Adjustment $566,457
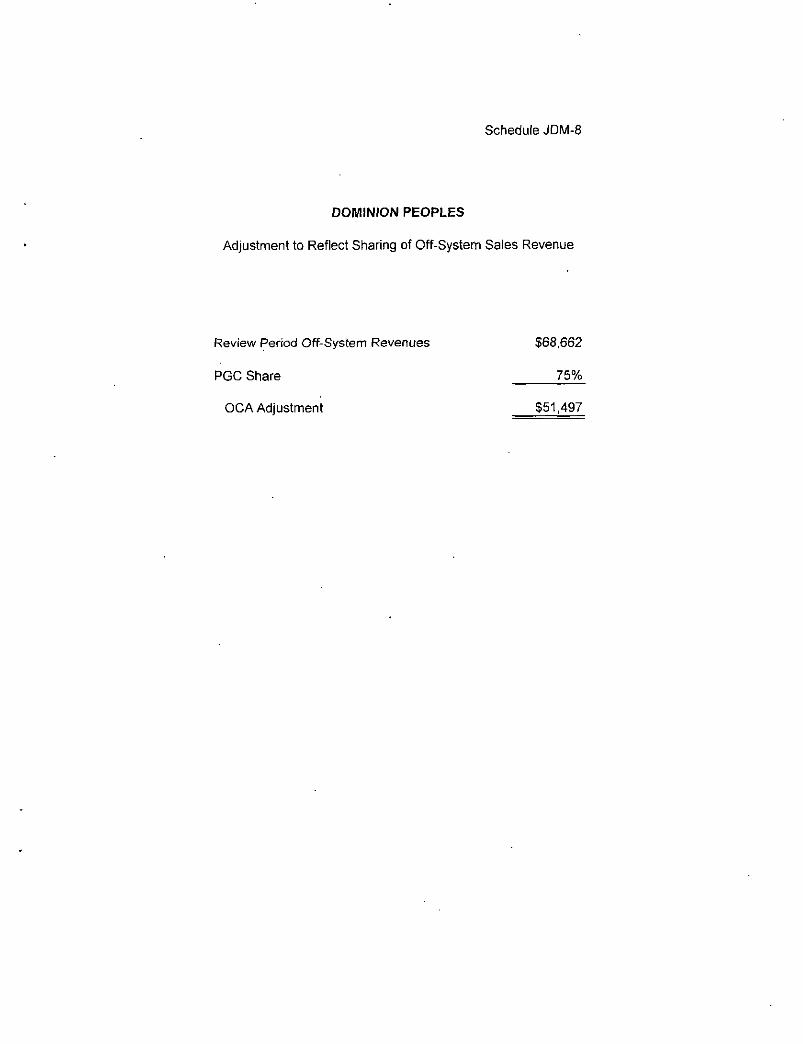
Schedule JDM-8
DOMINION PEOPLES
Adjustment to Reflect Sharing of Off-System Sales Revenue
Review Period Off-System Revenues $68,662
PGC Share 75%
OCA Adjustment $51,497

Schedule JDM-9
DOMINION PEOPLES
Estimated Impact of Retainage Recommendations on PGC Customers (Mcf)
Line No. 1
4 5 6 7
9 10 11 12 13 14 15 16 17 18 19 20 21 22 23 24 25 26 27 28 29 30 31 32 33 34 35 36 37 38
Projected 2006 PGC Period Volumes
PGC Sales P-1 Transportation NP-1 Transportation
Total
Retainage Discounted Volumes
Total Non-Retainage Discounted Volumes Total Transportation Non-Retainage Discounted Volumes
Source/Calculation
32,752,468 8,053,950
28,260,145
69,066,563
10,280,945
58,785,618 26,033.150
4,746,158
26,991
4,719,167
Actual Loss Experience 6.43%
Required Retainage
Retainage from Discounted Volumes
Additional Retainage to be Recovered
Retainage as a Percent of Non-Discounted Volumes 8.00%
Current Retainage Charge 5.30%
Required Increase in Retainage Charge 2.70%
Retainage Collected from Transportation Customers at Existing Char 1,456,977
Retainage from Transportation Customers at Sytem Average 2,263,752
Overco I lection of Retainage from PGC Customers
Cost of Gas
Cost Impact on PGC Customers _ _ _ _ _
Effective Retainage Charge to PGC Customers 10.0%
806,775
$10.3340
$8,337,218
DP Exhibit 18, Schedule 1 DP Exhibit 18, BB&A DP Exhibit 18. BB&A
Lines 3 + 4 + 5
DP Exhibit 25
Line 7 - Line 9 Line 4 + 5 - 9
OCA Statement No. 1
(Line 7/(1 - Line 14) - Line 7
DP Exhibit 25
Line 16-18
Line 20/L ine 11
Per Tariff
Line 22 - 24
(Line 12/(1 - Line 24) - Line 12
(Line 12/(1 - Line 22) - Line 12
Line 30 - 28
DP Exhibit 18, Commodity
Line 32 x 34
(Line 20-28) / Line 16
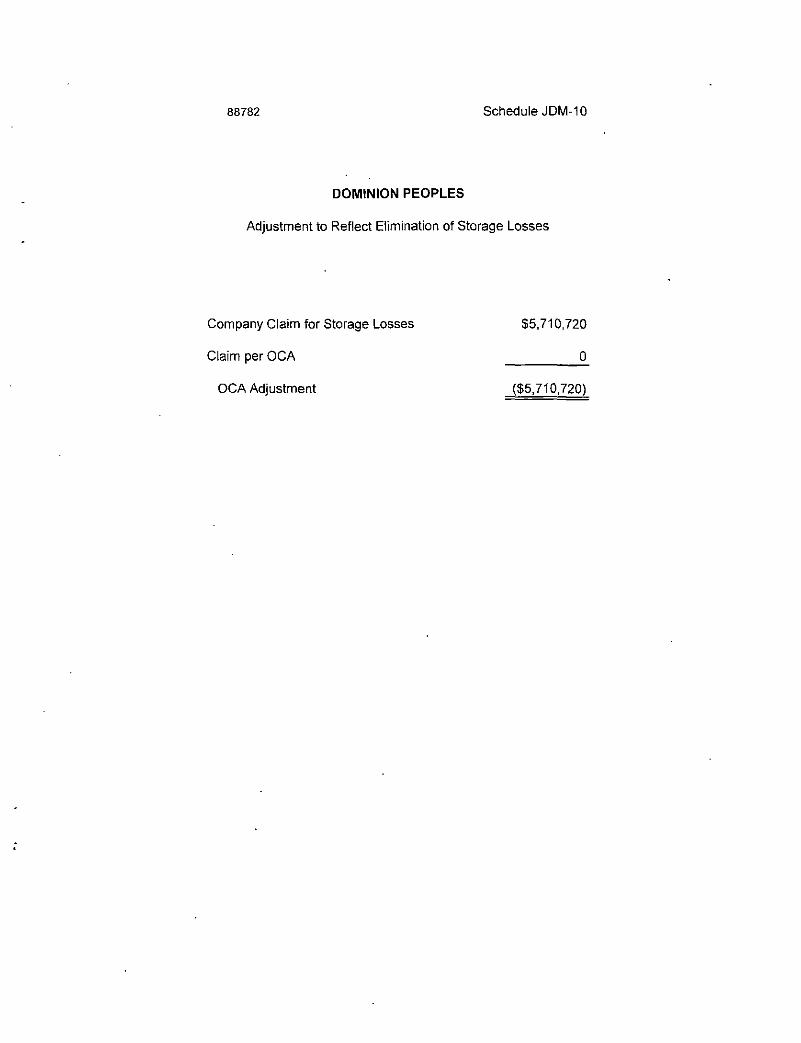
88782 Schedule JDM-10
DOMINION PEOPLES
Adjustment to Reflect Elimination of Storage Losses
Company Claim for Storage Losses $5,710,720
Claim per OCA 0
OCA Adjustment ($5,710,720)
OCA Statement No. 1-S
BEFORE THE
PENNSYLVANIA PUBLIC UTILITY COMMISSION
PENNSYLVANIA PUBLIC UTILITY COMMISSION
v.
THE PEOPLES NATURAL GAS COMPANY d/b/a DOMINION PEOPLES
DOCKET NO. R-00061301
SURREBUTTAL TESTIMONY
OF
JEROME D. MIERZWA
ON BEHALF OF THE
PENNSYLVANIA OFFICE OF CONSUMER ADVOCATE
JUNE 2006
EXETER ASSOCIATES, INC.
5565 Sterrett Place Suite 310
Columbia. Maryland 21044
WE JUL 1 7 2006
Pittsburgh Office of A.LJ. Public Utility Commission
1 I. INTRODUCTION
2 Q. WOULD YOU PLEASE STATE YOUR NAME AND BUSINESS ADDRESS.
3 A. My name is Jerome D. Mierzwa. I am a principal and Vice President of Exeter
4 Associates, Inc. My business address is 5565 Sterrett Place, Suite 310, Columbia,
5 Maryland 21044. Exeter specializes in providing public utility-related consulting
6 services.
7 Q. HAVE YOU PREVIOUSLY PRESENTED TESTIMONY IN THIS
8 PROCEEDING?
9 A. Yes. My prepared direct testimony was presented as OCA Statement No. 1.
10 Q. . WHAT IS THE PURPOSE OF YOUR SURREBUTTAL TESTIMONY?
11 A. The purpose of my surrebuttal testimony is to respond to certain portions of the
12 rebuttal testimony of Dominion Peoples' witnesses Joseph A. Gregorini and Ronald
13 D. Walther, and Office of Trial Staff witness Joseph Kubas.
14
15 II. WITNESS: RONALD D. WALTHER
16 Issue: Design Day Capacity
17 Q. WHAT IS THE DIFFERENCE BETWEEN THE DESIGN DAY MODEL
18 UTILIZED BY THE COMPANY AND THE MODEL PRESENTED IN YOUR
19 DIRECT TESTIMONY?
20 A. The model utilized by the Company relies on 14 years of daily winter-period data
21 while the model presented in my direct testimony utilizes three years of winter -
22 period data.
Page 1
1 Q. WHY DID YOU UTILIZE THREE YEARS WORTH OF DATA?
2 A. Use of three years of data is consistent with the recommendations of the R.J.
3 Rudden Report ("Rudden Report") described by witness Walther. The Rudden
4 Report states: 5 6 "RJRA also analyzed 3 years of daily throughput data 7 to more closely estimate the daily throughput 8 requirements at various temperatures and windspeeds. 9 Use of a 3-year time period was deemed appropriate
10 in recognition of the same two considerations 11 discussed above."
12 The two considerations discussed above were: 13 •14 (1) the need to capture a sufficient number of data points to 15 perform an analysis; and 16 17 (2) the need to use a time period which generally reflected 18 demand characteristics representative of current 19 conditions.
20 Q. DOES THE COMPANY'S STUDY MEET THE CONSIDERATIONS
21 DESCRIBED IN THE RUDDEN REPORT?
22 A. No. The Company's study utilizes 14 years of data. This is inconsistent with the
23 need to use a time period which generally reflects demand characteristics
24 • representative of current conditions. There can be no dispute that customer usage
25 characteristics have changed over the last 14 years.
26 Q. ON WHAT BASIS DOES WITNESS WALTHER DISAGREE WITH THE USE
27 OF THE THREE YEARS WORTH OF DATA?
28 A. Witness Walther claims that my study is flawed because the last three winter
29 periods were not representative ofthe full range of potential weather. He contends
30 that when weather conditions approach a design day, customers' furnaces run on
31 nearly a continuous basis and that the use of three years of weather data ignores
32 this.
Page 2
1 Q. HOW DO YOU RESPOND TO WITNESS WALTHER?
2 A. Witness Walther has incorrectly interpreted the impact of design day weather on
3 customer usage. The design day studies sponsored by the Company and the OCA
4 both assume a linear relationship between heating degree days and customer
5 usage. The Company's study indicates that usage increases by 7,393 Mcf for each
6 heating degree day ("HDD") experienced in January, while the OCA's study
7 indicates increased usage of 6,909 Mcf per HDD. Once furnaces are running on a
8 continuous basis, they cannot consume additional gas if temperatures decline
9 further. Thus, when furnaces are running on a continual basis, a linear relationship
10 between heating degree days and customer usage no longer exists. Total usage
11 remains constant, and use per heating degree day declines. This is known as the
12 "bend-over" effect. Attached as Schedule JDM-11 is additional information related
13 to the "bend-over" effect from a report prepared by the author ofthe Rudden Report.
14 I would also point out that the study presented by the OCA forecasts usage
15 at the Company's design day temperature of -90F. It does not forecast design day
16 usage based on the temperatures experienced during the most recent three-year
17 period.
18 Q. WITNESS WALTHER CLAIMS THAT THE COLDEST DAY DURING THE
19 PERIOD UTILIZED IN YOUR MODEL HAD AN AVERAGE TEMPERATURE
20 OF ONLY 60F, AND THAT THE COMPANY USES A DESIGN DAY OF -90F.
21 PLEASE RESPOND.
22 A. Again, I reiterate, the OCA's model forecasts usage at the Company's design day
23 temperature of-9 0F. Moreover, I would note that the original model presented in the
24 Rudden Report utilized data for the winters of 1990-1991, 1991-1992 and 1992-
25 1993. The coldest day during the three-year period used in the Rudden Report was
Page3
1 also 60F (February 18, 1993). Finally, as explained by witness Walther in his
2 rebuttal, just after the Company adopted the model in the Rudden Report, the
3 Company experienced the most extreme weather ever recorded in its service
4 territory on January 19,1994. Dominion Peoples had sufficient capacity to serve its
5 customers on this day, and the amount of capacity reserved by the Company was
6 determined using the three-year model presented in the Rudden Report.
7 Q. ON JANUARY 19, 1994, THE AVERAGE TEMPERATURE RECORDED IN
8 DOMINION PEOPLES SERVICE TERRITORY WAS -130F. SHOULDN'T
9 THIS DAY BE UTILIZED FOR DESIGN DAY?
10 A. In essence, as subsequently explained, the weather observed on January 19,1994,
11 was nearly equivalent to Dominion Peoples' design day. In the design day study
12 included in the Rudden Report, a 10F decrease in temperature had the same effect
13 on sendout as a 2 MPH increase in average windspeed. On January 19,1994, the
14 average daily temperature was -130F and the average windspeed was 10 MPH.
15 The design day criteria approved by the Commission for Dominion Peoples is a day
16 with an average temperature of -90F and an average windspeed of 15.8 MPH.
17 From the standpoint of projected sendout, the weather conditions observed on
18 January 19,1994, and Dominion Peoples' design day criteria, are nearly equivalent.
19 That is, the 4 0F temperature difference between these two days is nearly offset by
20 the 5.8 MPH average windspeed difference.
21 In addition, I would note that design day is an extremely cold day which an
22 NGDC utilizes for capacity planning purposes. Typically, design day conditions are
23 expected to occur once every 10 to 20 years. NGDCs do not typically utilize the
24 coldest day in their service territory for design day. The design day criteria selected
25 by an NGDC is subject to Commission approval.
Page 4

1 Q. WOULD THE INCLUSION OF A DAY WITH EXTREME WEATHER HAVE
2 MUCH OF AN IMPACT ON YOUR DESIGN DAY FORECAST AS WITNESS
3 WALTHER CONTENDS?
4 A. No. I have rerun the OCA's recommended study and have included actual weather
5 and usage data observed on January 19, 1994. As shown on Schedule JDM-12,
6 inclusion of this day increases the OCA's design day forecast by only 15,688 Mcf or
7 2.5 percent. Of course, this overstates the impact of such an extreme day because
8 it assumes usage based on 1994 consumption characteristics.
9 Q. WITNESS WALTHER PLACES A GREAT DEAL OF SIGNIFICANCE ON
10 THE NEED FOR THE FULL RANGE OF WEATHER TO BE
11 REPRESENTED IN THE DATA RELIED UPON TO CONDUCT A DESIGN
12 DAY STUDY. DO YOU HAVE ANY COMMENTS.
13 A. The Company utilized 14 years of data in its design day study to capture the coldest
14 day in recent history which was January 19,1994. Witness Walther places a great
15 deal of significance on the importance of including this date in the Company's
16 design day study. On Schedule JDM-13,1 present two versions of the Company's
17 study utilizing the period November 1992 through January 2005.1
18 On page 1 of Schedule JDM-13, I show projected design day sendout
19 utilizing a model which relies on each winter day during this period. On page 2 of
20 Schedule JDM-13, I show projected design day sendout utilizing a model which
21 relies on each winter day during this period with the exception of January 19,1994.
22 This comparison reveals a inconsequential difference in projected design day
23 sendout of less than 400 Mcf. Clearly, the emphasis which the Company places on
1 The Company's study utilized the period November 1992 through December 2005. Data for the months of February, March, November, and December 2005 were not available for inclusion in these versions of the Company's study. However, exclusion of this data would not have a material impact on the comparison.
Page 5
1 including January 19,1994 data in the design day study is significantly overstated.
2 Q. DO YOU HAVE ANY ADDITIONAL COMMENTS ON WITNESS
3 WALTHER'S CLAIM THAT YOUR DESIGN DAY STUDY IS FLAWED
4 BECAUSE THE FULL RANGE OF POTENTIAL WEATHER WAS NOT
5 EXPERIENCED DURING THE LAST THREE YEARS?
6 A. Yes. As previously explained, the Company's study indicates that usage increases
7 by 7,393 Mcf per HDD, while the OCA's study indicates an increase of 6,909 Mcf
8 per HDD. This is a difference of 483 Mcf per HDD. Applying this difference to the
9 74 HDD utilized by the Company for design day implies a temperature-sensitive
10 difference of nearly 36,000 Mcf between the two models. This is the most that
11 could be attributable to the lack of representative weather if witness Walther's
12 assertions were right, which I have shown they are not, Even accepting witness
13 Walther's methodology, the amount of excess capacity would still be 50,000 Mcf
14 compared to the 86,000 Mcf set forth on Schedule JDM-5 which was based on my
15 model, the amount of excess capacity from the 86,000 Mcf reflected on Schedule
16 JDM-5 to 50,000 Mcf.
17 Q. • WITNESS WALTHER CLAIMS THE PRICE OF GAS IS EXPECTED TO
18 DECLINE.
19 A. I hope that witness Walther's forecast of $3.00 Mcf gas comes true. However,
20 market prices for natural gas in the future are currently listed on the New York
21 Mercantile Exchange ("NYMEX"). NYMEX prices are widely used as a natural gas
22 price benchmark. Unfortunately, as shown on Schedule JDM-14, natural gas prices
23 are not expected to decline to $3.00 Mcf, but are expected to remain high for the
24 foreseeable future. At 5.8 million BTUS per barrel of distillate oil, witness Walther's
25 $3.00 gas price assumption is equivalent to $16.80 per barrel of oil. Since gas and
Page 6
1 oil are substitutes, $3.00 gas prices can not persist at anything like today's oil
2 prices.
3 Q. WITNESS WALTHER CONTENDS THAT USAGE WILL REBOUND WITH
4 DECLINING PRICES. WILL USAGE REBOUND IF PRICES DECLINE?
. 5 A. Not necessarily. The effect of high prices on customer conservation efforts may
6 have not fully been recognized. Customers may implement longer-term
7 conservation measures. In addition, customers who have implemented
8 conservation measures (e.g., additional insulation) will not remove those measures
9 if prices decline. Nevertheless, if usage ever does rebound, due to lower prices, the
10 Company can acquire additional capacity which would be available on DTI and the
11 other interstate pipelines from which it currently takes service.
12 Q. WITNESS WALTHER INDICATES THAT YOU IMPUTED DIFFERENT TIME
13 PERIODS IN YOUR MODEL THAN WAS ORIGINALLY USED IN THE
14 RUDDEN REPORT. TO WHAT IS HE REFERRING?
15 A. The original Rudden Report utilized weather data recorded on a calendar day basis
16 and sendout information for a 24-hour period beginning at 8 A.M. of each day.
17 Since the Rudden Report, the natural gas industry has adopted the 24-hour period
18 beginning at 10 A.M. as a standard day. In my study, I utilize weather and sendout
19 data for the 24-hour period beginning at 10 A.M. It is logical and reasonable to
20 utilize consistent time periods for weather and sendout data.
21 Q. IN A DISCOVERY RESPONSE, WITNESS WALTHER CLAIMS THAT YOU
22 STATE THAT IF YOUR DESIGN DAY FORECAST WERE TOO LOW AND
23 A DESIGN DAY OCCURRED, THE COMPANY COULD ACQUIRE
24 SUPPLIES ON A "DELIVERED-TO-CITYGATE" BASIS. PLEASE
25 ELABORATE ON YOUR RESPONSE TO THE DISCOVERY REQUEST.
Page 7
1 A. First, the discovery request served by the Company presents a hypothetical
2 situation. It assumes usage would rise above the levels indicate in the OCA's study.
3 The OCA's study is based on a method established in 1993 in the Rudden Report
4 which has proven to be reliable. Therefore, there is no basis to conclude that a
5 capacity shortfall will materialize if the OCA's study is adopted.
6 In addition, delivered-to-citygate gas supplies will be available, it is just a
7 matter of at what price. Given the low probability ofthe occurrence of a design day,
8 it would be expected that the purchase of gas on a delivered-to-citygate basis would
9 be a lower cost option than the reservation of pipeline capacity. I would note that
10 Equitable Gas Company, which is proposing to acquire Dominion Peoples and
11 serves many of the same geographic regions served by Dominion Peoples, plans to
12 rely on delivered-to-citygate supplies, among other things, to serve its customers if
13 the capacity it reserves is insufficient to meet the requirements of its customers.
14
15 Issue: Exchange Transactions
16 Q. IN HIS REBUTTAL TESTIMONY, WITNESS WALTHER CLAIMS THAT
17 ASSETS PAID FOR BY TRANSPORTATION CUSTOMERS WERE USED
18 TO SUPPORT THE COMPANY'S EXCHANGE TRANSACTIONS. GIVEN
19 THIS, ARE YOU CONTINUING TO RECOMMEND A SHARING OF
20 EXCHANGE REVENUES WITH PGC CUSTOMERS?
21 A. No. For the first time, the Company is now claiming that assets paid for by
22 transportation customers were used to support the Company's exchange
23 transactions. Since these transactions were done utilizing non-PGC assets, I am no
24 longer recommending that revenues from these transactions be shared.
25
Page 8
1 Issue: Off-System Sales
2 0. WITNESS WALTHER CLAIMS THAT SINCE THERE WAS NO SHARING
3 MECHANISM IN PLACE FOR OFF-SYSTEM SALES REVENUES THE
4 COMPANY IS ENTITLED TO 100 PERCENT OF THE PROCEEDS. DO
5 YOU AGREE?
6 A. No. Counsel advises me that if no sharing mechanism is in place, the Company is
7 not entitled to retain any ofthe revenues from off-system transactions. Unlike the
8 exchange transactions discussed in the previous question and answer, these off-
9 system sales did utilize PGC assets. Therefore, all off-system sales revenues
10 should be credited to PGC customers. From a policy perspective, the Company's
11 claim is unreasonable because it would result in ratepayers paying all the costs
12 incurred to support off-system sales, while being totally excluded from any share of
13 the benefits.
14
15 Issue: Proposed Hedging Plan
16 Q. WITNESS WALTHER INDICATES THAT YOU HAVE PROPOSED THAT
17 THE COMPANY PURCHASE 50 PERCENT OF THE HEDGE VOLUMES
18 TWO SEASONS PRIOR TO DELIVERY IN ORDER TO ACHIEVE LOWER
19 PRICES. IS HE CORRECT?
20 A. No. The basis for my proposal is to achieve greater price diversification. Greater
21 price diversification would be achieved because the hedge volumes would be
22 purchased over a longer time period.
23
Page 9

1 lit. WITNESS: JOSEPH A. GREGORINI
2 Issue: Retainage Waiver
3 Q. WITNESS GREGORINI PRESENTS AN ANALYSIS WHICH INDICATES
4 THAT THE RETAINAGE RATE THAT SHOULD BE APPLICABLE TO
5 TRANSPORTATION CUSTOMERS IS 5.6 PERCENT, WHICH CLOSELY
6 APPROXIMATES THE CURRENT RETAINAGE RATE OF 5.3 PERCENT
7 AND, THEREFORE, NO CHANGE TO THE CURRENT RATE IS
8 REQUIRED. HOW DO YOU RESPOND?
9 A. Many of Dominion Peoples' transportation customers have meters which correct for
10 differences between actual and standard temperature. Dominion Peoples, for the
11 first time in its rebuttal testimony, presents the results of an analysis prepared by its
12 Metering Department in 2004. The analysis indicates that the effect of temperature
13 correcting meters is an improvement in usage measurement of 2.3 percent.
14 Accounting for this effect indicates that a retainage charge of 5.6 percent should be
15 assessed to transportation customers. The current retainage charge is 5.3 percent.
16 Therefore, witness Gregorini recommends no change to the retainage charge
17 assessed to transportation customers. On a standalone basis, witness Gregorini's
18 recommendation appears reasonable. However, under witness Gregorini's
19 recommendation, the retainage discounts extended to certain customers would
20 continue to be assessed solely to PGC customers. As explained in my direct
21 testimony, this is unreasonable.
22 Q. WITNESS GREGORINI DISAGREES WITH YOUR PROPOSAL TO
23 ALLOCATE THE COSTS ASSOCIATED WITH THE RETAINAGE WAIVERS
24 GRANTED CERTAIN CUSTOMERS TO ALL CUSTOMERS. WHAT IS
25 YOUR RESPONSE?
Page 10
1 A. It appears that witness Gregorini believes that it is inappropriate for the Commission
2 to refine existing policy. The Commission should not have its hands tied and be
3 restricted from even considering additional policy related to an area of existing
4 policy. I would also note that no party to Dominion Peoples' 2005 1307(f)
5 proceeding at Docket No. R-00050267 recommended that a net benefits test be
6 adopted for retainage waivers. Thus, no party should be prohibited from adopting a
7 position not raised in last year's proceeding.
8 Q. WITNESS GREGORINI ALSO DISAGREES WITH YOUR PROPOSAL FOR
9 EQUAL PROPORTIONATE RETAINAGE AND BASE RATE DISCOUNTS.
10 WHAT IS YOUR RESPONSE?
11 A. Again, witness Gregorini believes that it is inappropriate for the Commission to
12 refine existing policy. Moreover, in my opinion, the Commission has not adopted a
13 specific policy with respect to trade-offs between the discounting of base rates and
14 fuel retention charges. Further, I would note that in T.W. Phillips Gas & Oil
15 Company's 2006 1307(f) proceeding at Docket No. 0051134, the ALJ approved
16 similar discounting procedures and a final order in that docket is pending before the
17 Commission.
18 Q. WITNESS GREGORINI CLAIMS THAT A PROPORTIONATE DISCOUNT
19 POLICY IS NOT NECESSARY FOR DOMINION PEOPLES. WHAT IS
20 YOUR RESPONSE?
21 A. Witness Gregorini claims that such a provision is unnecessary since the base rates
22 charged to customers receiving a retainage discount or waiver already reflect an 87
23 percent discount to maximum tariff rates. Dominion Peoples has completely waived
24 the fuel retention charge for a number of its customers. Certainly, the Company
25 could have collected some level of retainage from these customers in return for a
Page 11
1 further discount to base rates. Therefore, a provision providing for proportionate
2 discounts is necessary for Dominion Peoples.
3 Q. PLEASE SUMMARIZE YOUR RECOMMENDATIONS CONCERNING
4 RETAINAGE.
5 A. The retainage charge, which should be included in the Company's net benefit test
6 and assessed to general transportation customers, is 5.3 percent. All customers
7 should be required to share in responsibility for the costs associated with retention
8 waivers and discounts extended to certain customers. This would be accomplished
9 by adopting a generally applicable retainage charge of 6.3 percent (see Schedule
10 - JDM-15).
11
12 Issue: Rager Mountain Storage Loss
13 Q. WHY DID YOU RECOMMEND THAT THE COMPANY'S PROPOSAL TO
14 RECOVER A STORAGE GAS LOSS AT RAGER MOUNTAIN BE
15 REJECTED?
16 A. In my direct testimony, I recommended the rejection of the Company's claim
17 because the price the Company assigned to the loss significantly exceeded the
18 actual cost of the loss. In addition, the Company's proposal to recover the loss
19 solely from PGC customers over a one-year period was unreasonable.
20 Q. WHAT WAS THE COMPANY'S RESPONSE TO YOUR
21 RECOMMENDATION?
22 A. The Company has now proposed to recover the loss over a five-year period from all
23 of its PGC and Priority-One ("P-1") transportation customers.
Page 12

1 Q. WHAT IS YOUR RESPONSE TO THE COMPANY'S PROPOSAL?
2 A. The Company's proposal to recover the loss over a 5-year period appears
3 reasonable! Recovering a portion of the loss from P-1 customers is a step in the
4 right direction; however, non-Priority-One ("NP-1") customers should also bear
5 responsibility for a portion ofthe loss. This is because the losses occurred at a time
6 when all of Dominion Peoples' customers were buying their gas supplies from the
7 Company. See Revised Schedule JDM-10 for my proposed adjustment. •
8
9 IV. WITNESS: JOSEPH KUBAS
10 Issue: Hedging Program Proposal
11 Q. WITNESS KUBAS DISAGREES WITH YOUR PROPOSAL THAT 50
12 PERCENT OF THE VOLUMES SHOULD BE HEDGED TWO SEASONS
13 PRIOR TO DELIVERY. WHAT IS YOUR RESPONSE?
14 A. Witness Kubas believes that my proposal would result in micromanaging of the
15 Company's operations. I disagree. The Company's hedging program is designed
16 to contain a non-discretionary component. Under this approach, the Company is
17 not required to speculate as to the best time to hedge its purchases. Under extreme
18 conditions such as those which existed in October 2005 as described by witness
19 Kubas, the Company would continued to have discretion to deviate from the
20 scheduled purchase of gas. I would also note that the Company did not find my
21 proposal unreasonable or characterize it as micromanagement. Therefore, witness
22 Kubas concerns are misplaced.
23 Q. DOES THIS CONCLUDE YOUR'SURREBUTTAL TESTIMONY?
24 A. Yes, it does.
89352
Page 13
BEFORE THE
PENNSYLVANIA PUBLIC UTILITY COMMISSION
PENNSYLVANIA PUBLIC UTILITY COMMISSION
v.
THE PEOPLES NATURAL GAS COMPANY d/b/a DOMINION PEOPLES
DOCKET NO. R-00061301
SCHEDULES ACCOMPANYING THE
SURREBUTTAL TESTIMONY
OF
JEROME D. MIERZWA
ON BEHALF OF THE
PENNSYLVANIA OFFICE OF CONSUMER ADVOCATE
JUNE 2006
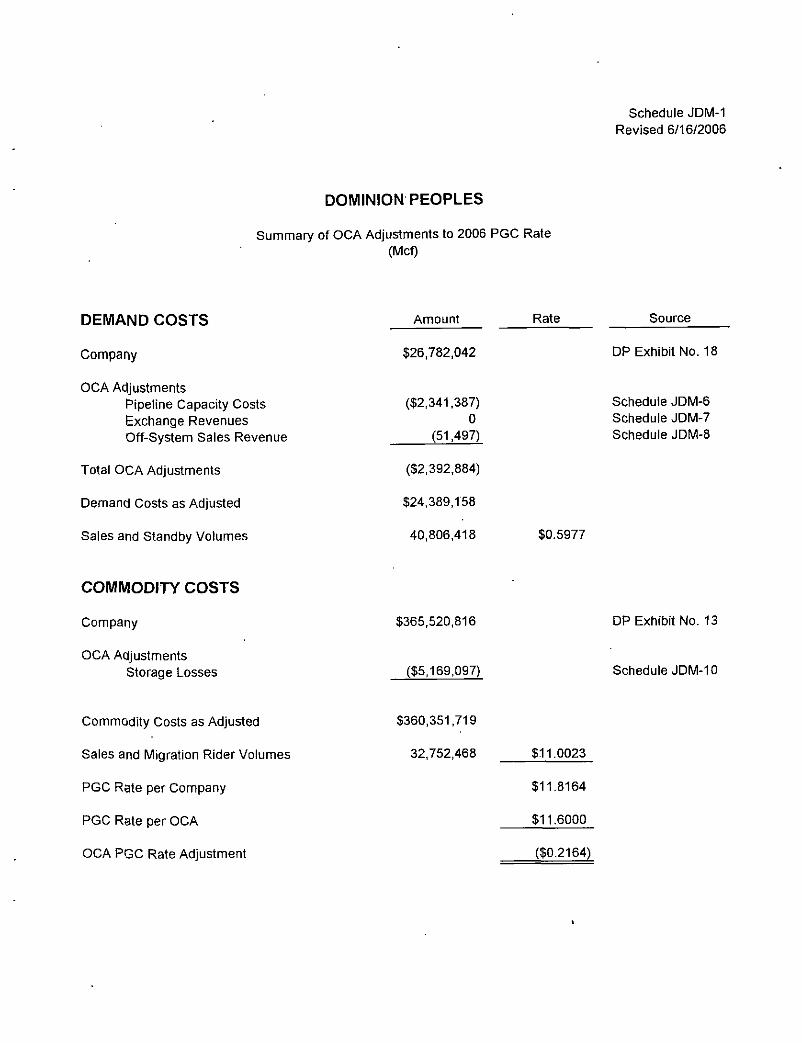
DOMINION PEOPLES
Summary of OCA Adjustments to 2006 PGC Rate (Mcf)
Schedule JDM-1 Revised 6/16/2006
DEMAND COSTS
Company
OCA Adjustments Pipeline Capacity Costs Exchange Revenues Off-System Sales Revenue
Total OCA Adjustments
Demand Costs as Adjusted
Sales and Standby Volumes
Amount Rate Source
$26,782,042
($2,341,387) 0
(51,497)
($2,392,884)
$24,389,158
40,806,418
DP Exhibit No. 18
Schedule JDM-6 Schedule JDM-7 Schedule JDM-8
$0.5977
COMMODITY COSTS
Company
OCA Adjustments Storage Losses
$365,520,816
($5,169,097)
DP Exhibit No. 13
Schedule JDM-10
Commodity Costs as Adjusted
Sales and Migration Rider Volumes
PGC Rate per Company
PGC Rate per OCA
OCA PGC Rate Adjustment
$360,351,719
32,752,468 $11.0023
$11.8164
$11.6000
($0.2164)
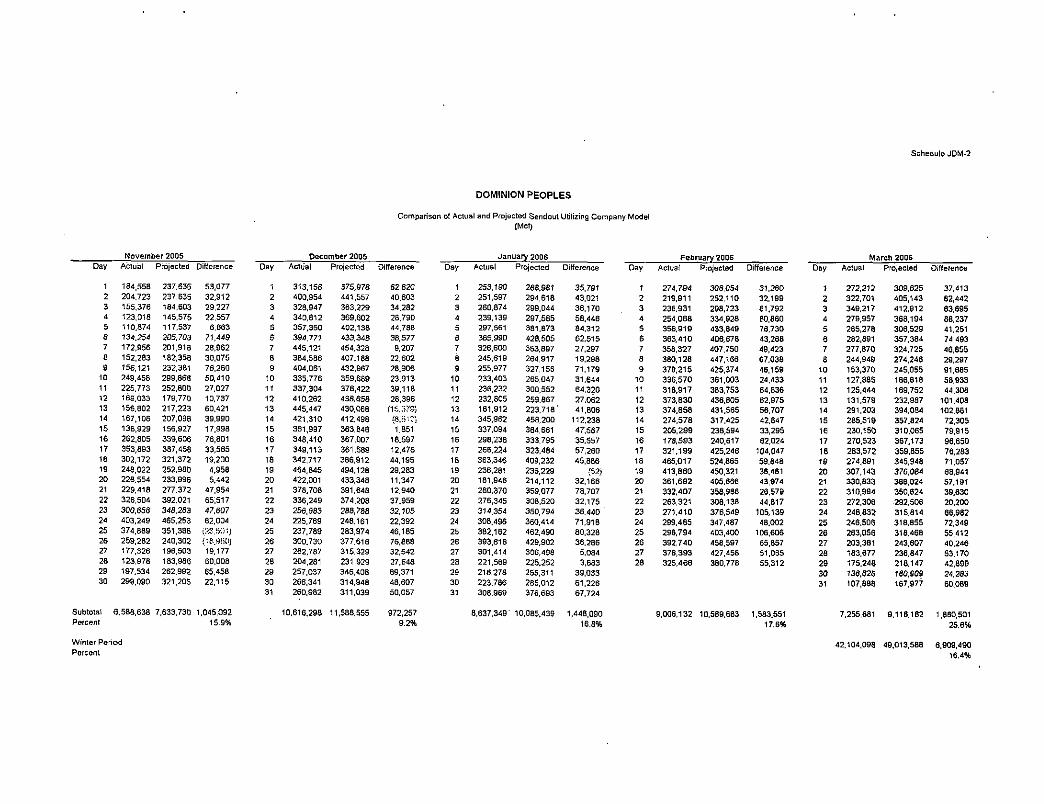
DOMINION PEOPLES
Comparison o! Actual and Projected Sendout Utilizing Company Model (Mcf)
Schedule JDM-2
November 2005 Day Actual Projected Difference
December 20Q5 Day Actual Projected Difference
January 2006 •ay Actual Proj acted Difference
February 2006 March 2006 Day Actual Projected Difference Day Actual Projected Difference
10 11 12 13 14 15 16 17 16 19 20 21 22 23 24 25 25 27 28 29 30
184,558 204.723 155,376 123,018 110,874 134.254 172,956 152,263 156,121 249,458 225,773 169,033 156,802 167,108 138,929 262,805 353,893 302,172 248,022 228.554 229.418 326,504 300,656 403,249 374,889 259,282 177,326 123,978 197.534 299,090
237,635 237,635 184,603 1 '15,575 117,537 205,703 201,918 182,358 232,381 299,868 252,800 179.770 217,223 207,098 156,927 339,606 387,458 321,372 252,980 233,996 277.372 392.021 345,253 465,253 351,388 240,302 196,503 183.986 262,992 321,205
53,077 32,912 29,227 22,557
6,663 71,449 28,962 30,075 76,260 50,410 27,027 10,737 60,421 39,990 17,998 76,801 33,565 19,200 4.956 5,442
47,954 65;517 47,607 62,004
19,177 60,008 65,458 22,115
1 2 3 4 5 5 7 8 9
10 11 12 13 14 15 16 17 18 19 20 21 22 23 24 25 26 27 28 29 30 31
313,156 400,954 328,947 340,812 357.350 394,771 445.121 384,586 404,061 335.776 337,304 410.262 445,447 421,310 361,997 348,410 349,113 342,717 464,845 422.001 378.708 336,249 256,883 225,769 237,789 300.730 282,787 204,281 257,037 266,341 260,982
375,976 441,557 363,229 369,602 402,136 433,348 454,328 407,188 432,967 359,689 376,422 436,658 430,068 412,498 363,648 367,007 361,589 386,912 494,128 433,348 391,648 374,208 253,788 248.161 283,974 377,618 315.329 231,929 346,408 314,948 311,039
Subtotal 6.588,638 7,633.730 1,045,092 Percent 15.9%
Winter Period Percent
10,616,298 11,588,555
62,820 40,603 34,282 28.790 44,788 38,577 9,207
22,602 28,906 23,913 39,116 28,396
1,851 18.597 12,476 44,195 29,283 11,347 12,940 37.959 32,105 22,392 46,185 76,688 32,542 27,648 89.371 48,607 50,057
972,257 9.2%
2 3 4 5 6 7 8 9
10 11 12 13 14 15 16 17 18 19 20 21 22 23 24 25 26 27 28 29 30 31
253,190 251.597 260,874 239,139 297.561 365.990 326,600 245,619 255,977 233,403 236,232 232,805 181,912 345,962 337,094 298,238 266.224 363,346 236,281 181,946 280,370 276,345 314,354 308,496 382,162 393,616 301,414 221,569 216,278 223,786 308,969
288.981 294,618 299,044 297,585 381.873 428,505 353,897 264,917 327,156 265,047 300,552 259.867 223.718' 458,200 384,661 333,795 323,484 409,232 236,229 214,112 359,077 308,520 350,794 380,414 462,490 429,902 306,498 225,252 255,311 265,012 376,693
35,791 43,021 38,170 58,446 84.312 62,515 27,297 19,298 71.179 31,644 64,320 27,062 41,806
112,238 47,567 35,557 57,260 45,886
{S.2) 32,166 78,707 32,175 36,440 ' 71,918 80,328 36.286
5,084 3,663
39.033 61,226 67,724
1 2 3 4 S 6 7 8 9
10 11 12 13 14 15 16 17 18 19 20 21 22 23 24 25 26 27 28
274,794 219,911 236,931 254,068 356,919 363.410 358,327 380,126 370,215 336,570 318,917 373,830 374,858 274,578 205,299 178.5S3 321.199 465.017 413,860 361,692 332,407 263,321 271,410 299,485 296,794 392,740 376,393 325,466
306,054 252,110 298,723 334,928 433,649 406,678 407,750 447,166 425,374 361,003 383,753 436.605 431,565 317.425 238,594 240,617 425.246 524,865 450,321 405,666 358,986 308,138 376.549 347,487 403,400 456,597 427.458 380,778
31,260 32.199 61,792 80,860 76.730 43,268 49,423 67,038 46,159 24,433 64,836 62,975 56,707 42,647 33,295 62,024
104,047 59.648 38,461 43,974 26,579 44,817
105,139 48.002
106,606 65,857 51,065 55,312
10 11 12 13 14 15 16 17 IB 19 20 21 22 23 24 25 26 27 28 29 30 31
272,212 322,701 349,217 279,957 265,278 282,891 277,870 244,949 153,370 127.885 125,444 131,579 291,203 265.519 230,150 270,523 283,572 274,891 307,143 330,833 310,994 272,306 248,832 246,503 263,056 203,361 183,877 175.246 136,623 107,888
309,625 405,143 412,912 368,194 306,529 357,384 324,725 274,246 245,055 186,816 169,752 232,987 394,084 357.824 310,065 367,173 359,855 345,948 376,084 388.024 350,624 292.506 315,814 318,855 318.468 243,607 236.647 218,147 160.809 167.977
37,413 82,442 63,695 66,237 41,251 74,493 46,855 29,297 91,885 58.933 44,306
101,408 102,861 72,305 79.915 96.650 76,283 71,057 68,941 57,191 39,630 20,200 66,962 72,349 55,412 40,246 53.170 42,899 24,283 60,089
8,637,349" 10,085,439 1,448,090 16.8%
9,006,132 10,589,683 1,583.551 17.6%
7,255,681 9,116,162 1,680,501 25.6%
42.104,098 49.013,568 6,909,490 16.4%
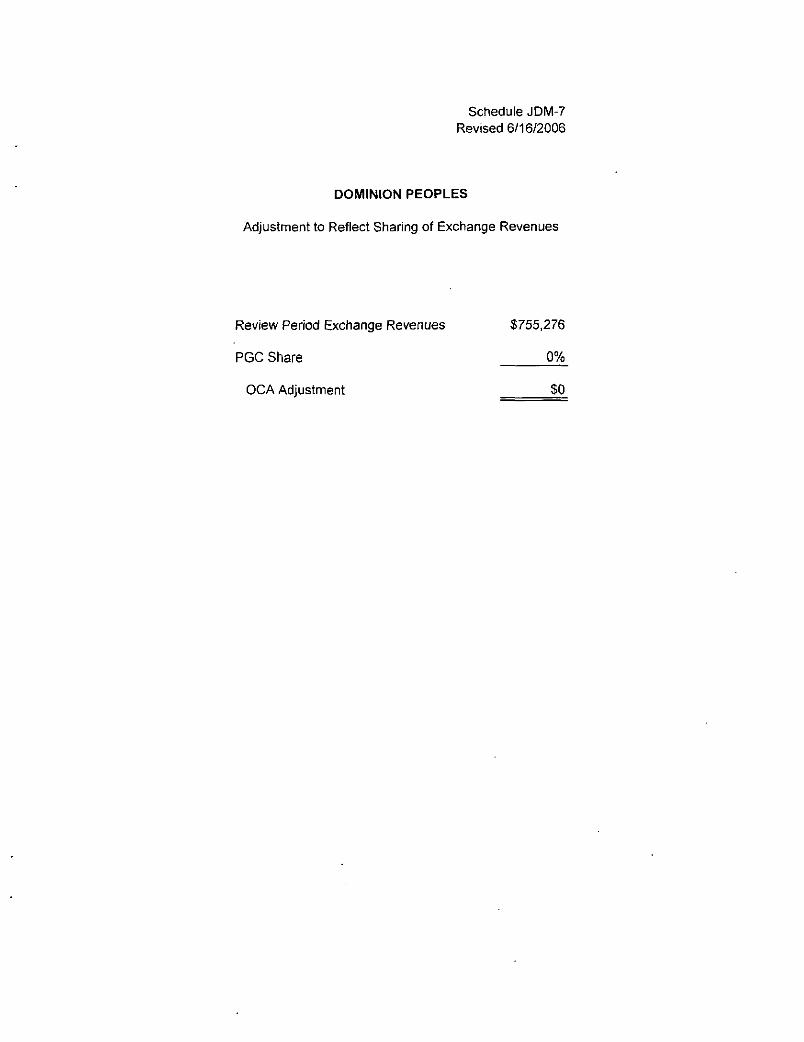
Schedule JDM-7 Revised 6/16/2006
DOMINION PEOPLES
Adjustment to Reflect Sharing of Exchange Revenues
Review Period Exchange Revenues $755,276
PGC Share 0%
OCA Adjustment $0

Schedule JDM-10 Revised 6/16/2006
DOMINION PEOPLES
Adjustment to Storage Loss Claim
Company Claim for Storage Losses $5,710,720
5-Yea r Amortization $1,142,144
PGC Share (Schedule JDM-9) 47.4%
PGC Allocation $541,623
OCA Adjustment $5,169,097
r, Schedule JDM-11
VetfenmsMemorial ffi^fia^
V -: 7 4 j . Rudden- ; -J Associates, Ihe. -
LONG ISLAND LIGHTING COMPANY NATURAL GAS PEAK DAY SENDOUT
EXECUTIVE SUMMARY
TABLE OF CONTENTS
SECTION PAGE
INTRODUCTION 1
Project Overview 1
An Important Issue for a Dynamic Industry 2
KEY ANALYTICAL RESULTS 3
PROJECT PARTICIPANTS 4
PROJECT APPROACH : 6
The "Hockey Stick" Approach to Sendout : 6
Analytical Process • 7
REVIEW OF LILCO'S SENDOUT DATA FOR EVIDENCE OF BEND-OVER . . . . . 8
REVIEW OF MULTIPLE SERVICE TERRITORIES FOR EVIDENCE
OF BEND-OVER 12
REVIEW OF LOCAL WEATHER DATA ON LONG ISLAND 17
R.J. Rudden ZESJAssociates. Inc.
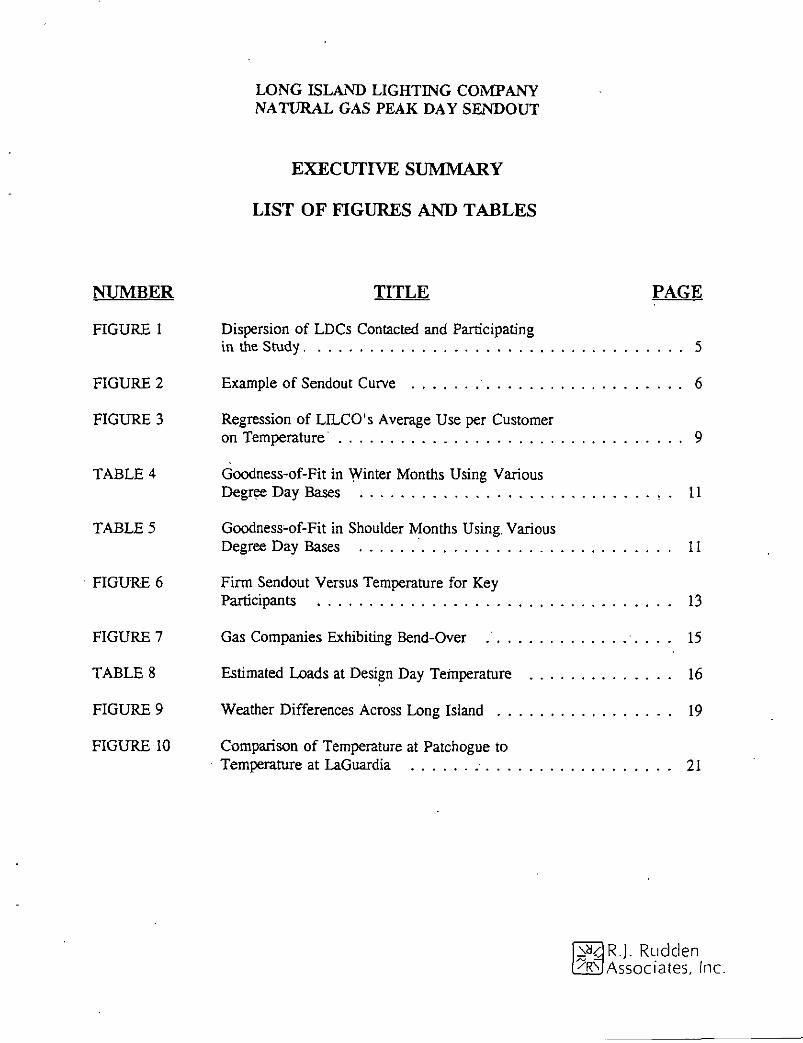
LONG ISLAND LIGHTING COMPANY NATURAL GAS PEAK DAY SENDOUT
E X E C U T I V E SUMMARY
LIST OF FIGURES AND T A B L E S
NUMBER T I T L E PAGE
FIGURE 1 Dispersion of LDCs Contacted and Participating
in the Study 5
FIGURE 2 Example of Sendout Curve 6
FIGURE 3 Regression of LILCO's Average Use per Customer on Temperature 9
TABLE 4 Goodness-of-Fit in Winter Months Using Various Degree Day Bases , . 11
TABLE 5 Goodness-of-Fit in Shoulder Months Using, Various Degree Day Bases 11
FIGURE 6 Firm Sendout Versus Temperature for Key
Participants 13
FIGURE 7 Gas Companies Exhibiting Bend-Over ." 15
TABLE 8 Estimated Loads at Design Day Temperature 16
FIGURE 9 Weather Differences Across Long Island 19
FIGURE 10 Comparison of Temperature at Patchogue to Temperature at LaGuardia 21
JaBRJ. Rudden 2E3A5SOciates, (nc.
LONG ISLAND LIGHTING COMPANY NATURAL GAS PEAK DAY SENDOUT
EXECUTIVE SUMMARY
bend over (verb) 1: to curve downward from a straight line 2: to flatten
INTRODUCTION
The purpose of this project was to establish or refute the existence of bend-over in the
sendout curve for natural gas local distribution companies (LDCs). Bend-over is thought to
occur at extremely low temperatures due to the influence of a number of factors. When a
significant proportion of the heating appliances on an LDCs system are running at their
maximum capacity, they can consume no more gas in response to yet lower outdoor ambient
temperatures. This is the most common justification for bend-over. Historically, the
phenomenon of bend-over has been the subject of speculation in the natural gas utility industry.
To the best of RJRA's knowledge, no definitive conclusions have been reached regarding either
the existence of bend-over or the conditions under which it could occur.
Project Overview
RJ. Rudden Associates Inc. (RJRA) was retained by the Long Island Lighting Company
(LILCO), as part of its Long Island Energy Research & Development Initiative, to develop the
evidence supporting or disproving the bend-over phenomenon for LILCO's service territory. At
the outset of this project, it was agreed between RJRA and LILCO that, should the evidence at
hand fail to definitely establish that bend-over does occur, RJRA would suggest a set of
conditions under which the phenomenon could occur based upon the evidence collected through
this study. In connection with this study, RJRA also investigated the variations in weather
patterns recorded at 11 weather stations across Long Island. This analysis was essential to ensure
^3R.J. Rudden Z^jAssociates, Inc.
proper consideration in the bend-over analysis of significant, systematic weather variations
across different demand areas.
An Important Issue for a Dynamic Industry
With the virtual demise of the merchant function of the natural gas pipeline industry in
the United States under Federal Energy Regulatory Commission (FERC) Order No. 636A and
its predecessor unbundling orders, this project takes on added significance. LDCs are faced with
a potentially bewildering array of decisions affecting gas supplies which previously were handled
by the pipelines. Paramount among these is deciding how much peak day capacity to buy.
LDCs have always faced a risk of under- or over-contracting for supplies. Now, the risk for
LDCs is even greater. The conversion of pipelines to common carrier status appears to subject
LDCs to scrutiny by state regulators on capacity and reliability transactions which previously
were solely in the purview of the FERC as it regulated pipelines in interstate commerce.
The emergence of integrated resource planning (IRP) and demand-side management
(DSM) for natural gas LDCs has also focused greater attention on the estimation of peak day
requirements. Most of the benefits of conservation programs proposed as demand-side resources
involve assumptions about reductions in peak day requirements. The existence of bend-over
would suggest that the benefits of load-reducing DSM measures have generally been overstated,
since most peak day estimates are based upon linear extrapolations of temperature-sensitive usage
onto design day conditions. Bend-over would also suggest that load-building DSM measures may
be more cost-effective because of the overstatement of peak day requirements.
Reliability of gas supply is also receiving greater attention within LDCs as a result of
FERC Order No. 636 and the increasing number of IRP requirements for natural gas LDCs.
Maintaining adequate reserve margins at reasonable costs is a significant factor for gas supply
planning. Both LDCs and their regulators have begun to question and investigate the appropriate
measurement and levels of reserve margin within the context of gas supply planning and IRP.
The existence of bend-over would indicate that the reliability of an LDCs gas supplies is better
^6 R.J. Rudden Associates, Inc.
than previously expected, and that the LDC implicitly has a greater reserve margin than
suggested in most demand forecasts. This is an important consideration for LDC management
since it would also suggest that LDCs are better positioned for new load and growth in the
customer base.
In the IRP process, bend-over would justify less load-reducing measures and more load-
building measures for two reasons. The existence of bend-over would lower the demand-related
avoided costs for the LDC, since most present estimates incorporate overstated design day costs.
Bend-over would also mean that incremental loads place less demand on peak day reserves than
planned for by most LDCs. Overall, the existence of bend-over would change many of the
marketing assumptions that are restricting load growth for natural gas LDCs.
KEY ANALYTICAL RESULTS
By analyzing the sendout and weather data for LDCs throughout North America, RJRA
was able to arrive at the following conclusions:
Bend-over exists, and can be statistically justified, in a number of LDC service territories.
Bend-over becomes evident at temperatures less than 20oF, indicating that even LDCs in the Mid-Atlantic states might need to consider the possibility of bend-over in their design day planning.
LDC forecasting techniques should consider the possibility of, and allow for, "kinks" in the linear demand curve to accommodate the effects of bend-over.
LDC forecasting techniques should avoid or segregate the statistical and operating "noise" that exists in sendout data in the warm temperature ranges between 55 0 F and 65°?, so as not to distort the measurement. of demand in the clearly temperature-sensitive range below 550F.
R.J. Rudden Associates, Inc.
The y-intercept terms from linear sendout forecasts relative to temperatures do not necessarily represent the nonhealing or baseload consumption levels for LDCs; measures of summer consumption appear to provide a better estimate of baseload requirements.
As part of this project, RJRA also completed a comprehensive analysis of weather data
on Long Island. It was determined that temperatures vary significandy across Long Island.
Design day conditions may be several degrees colder at the eastern end of Long Island relative
to temperatures measured at the major airports or Central Park.
PROJECT PARTICIPANTS
RJRA sent letters of solicitation to 37 U.S. and 5 Canadian LDCs inviting them to
participate in this sendout project either by supplying data, or by supplying data and becoming
cofunders. The location of those LDCs solicited ranged from Florida to Wisconsin and
Baltimore to Oregon in the U.S., and from Quebec to British Columbia in Canada. Of those
solicited, 16 U.S. LDCs and 4 Canadian LDCs agreed only to supply data. From the total
participants, five utilities were selected as samples for whom RJRA performed detailed statistical
analyses. The map in Figure 1 shows the location of the LDCs throughout North America which
RJRA solicited for study participation, the actual study participants, and the five utilities used for
the study sample.
JHdR.J. Rudden Associates, Inc,

> 70 u-i ^
CL
n
Figure 1-1
DISPERSION OF LDCs CONTACTED AND PARTICIPATING IN THE STUDY
A LDCs Contacted, But Not Participating ® Study Participants it Sample of Participating LDCs
f 3
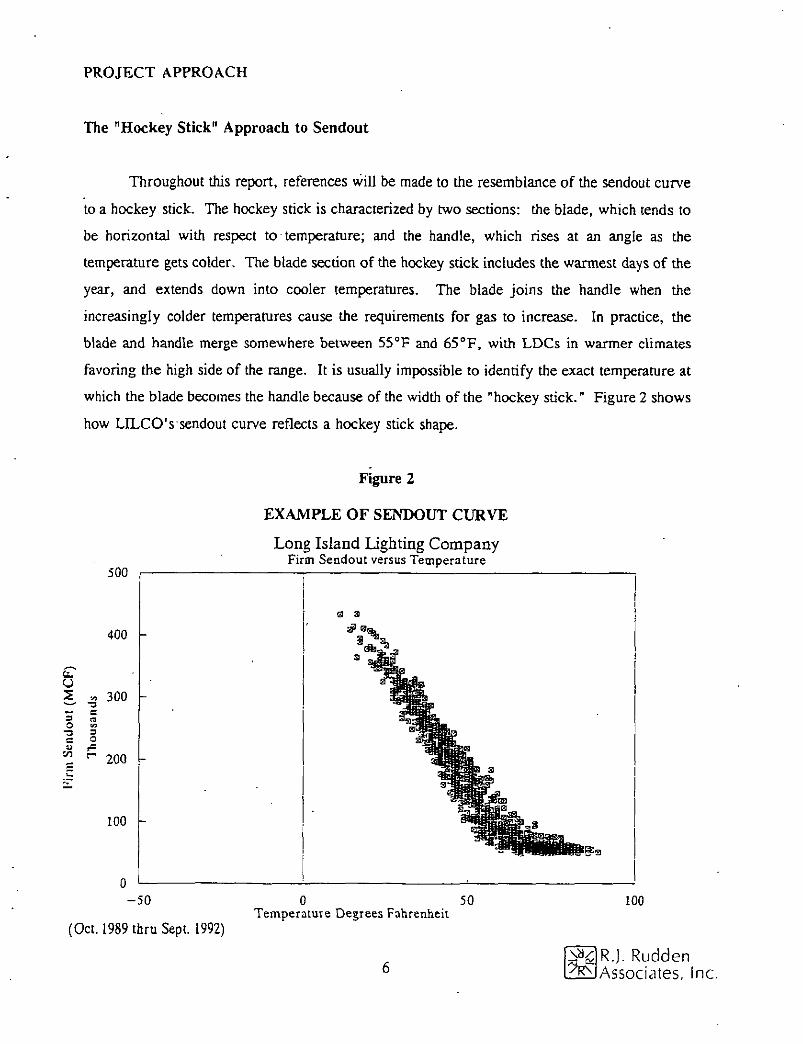
PROJECT APPROACH
The "Hockey Stick" Approach to Sendout
Throughout this report, references will be made to the resemblance of the sendout curve
to a hockey stick. The hockey stick is characterized by two sections: the blade, which tends to
be horizontal with respect to temperature; and the handle, which rises at an angle as the
temperature gets colder. The blade section of the hockey stick includes the warmest days of the
year, and extends down into cooler temperatures. The blade joins the handle when the
increasingly colder temperatures cause the requirements for gas to increase. In practice, the
blade and handle merge somewhere between 550F and 650F, with LDCs in warmer climates
favoring the high side of the range. It is usually impossible to identify the exact temperature at
which the blade becomes the handle because of the width of the "hockey stick." Figure 2 shows
how LILCO's sendout curve reflects a hockey stick shape.
2
3
o "3 C u
CO
"3 = to 3 O
500
400 -
300 -
200 -
100 -
-50
Figure 2
EXAMPLE OF SENDOUT CURVE
Long Island Lighting Company Firm Sendout versus Temperature
(Oct. 1989 thru Sept. 1992)
0 50 Temperature Degrees Fahrenheit
100
RJ.Rudden Associates, Inc.

Analytical Process
RJRA's approach to this project was designed to identify, early on, those participants
whose data appeared to show the strongest indications of bend-over. Data for the most promising
participants were subjected to further statistical analyses. Analyses were also performed on
different measures of weather used by participating LDCs, and/or differences in weather within
LILCO's service territory. The project approach is detailed below:
Obtain sendout and weather data from participants.
Create scatter plots of sendout versus weather for each participant using data for three years.
Rank participants in descending order of perceived degree of possible bend-over.
Select participants with extreme weather and participants with weather similar to LILCO for statistical analysis. This group is referred to as the sample set.
Develop regression statistics across the entire range of data provided for each participant.
Develop regression statistics for each participant in the sample set after excluding the data in the flat, bottom section of the sendout curve.
Develop regression statistics for each participant in the sample set that covers the coldest observations. Temperatures colder than 30oF were included for U.S. LDCs and temperatures colder than 20oF for Canadian LDCs.
Compare regression results across different temperature ranges for evidence of bend-over.
Develop regression statistics using nonlinear curves to investigate alternative bend-over situations.
Compare measures of. weather based upon gas day (8:00 AM to 8:00 AM) and effective weather (e.g., corrected for wind and sun effects) for improved results over raw weather data.
Develop scatter plots and histograms to compare weather at different locations across Long Island and to identify significant, persistent weather differences in LILCO's service territory.
R.J. Rudden Associates, Inc.
Chapters II through V provide the detailed discussions of the results of these analyses.
Chapter n provides an introduction to the project approach and the identification of study
participants. Chapter n i contains the results of analyses performed on LILCO's sendout data.
Chapter IV describes the results of the analyses performed for the other participating LDCs, and
reviews the different measures of weather provided by study participants. Chapter V reports on
the differences in weather across Long Island identified during the study.
REVIEW OF LILCO'S SENDOUT DATA FOR EVIDENCE OF BEND-OVER
In order to establish a baseline for evaluating other service territories, RJRA collected
and reviewed data and information pertaining to LILCO's peak day forecasting techniques. Data
on total daily system sendout, firm sendout and monthly customer totals were collected along
with documentation describing the methodology used by the company to develop LILCO*s
"Summer 1991 Forecast of Gas Sendout, Sales and Peaks - 1991 through 2006" forecast
document.
The data supplied by LILCO was examined in two formats: total firm sendout versus gas
day weather; and average firm sendout per customer per day versus gas day weather. Average
firm sendout per customer per day was used to produce results which properly controlled for
growth in the number of customers during the year. The analysis consisted of visual observation
of scatter plots and data series, and the fitting of a series of different regression model
specifications to the data supplied by LILCO.
A major finding of these analyses was that the simple linear model had almost the best
fit of all the model specifications. The model having a lagged heating degree day (HDD) term
possessed somewhat stronger explanatory capabilities. A quadratic weather term (HDD squared)
and a time trend factor were statistically insignificant when included in the model. These terms
were insignificant for all months in this analysis. Nonlinear models were also specified, using
the Gompertz curve and the Logistic curve. Analysis of the fitted values of sendout revealed that
both nonlinear specifications fit the data poorly, particularly on the peak day of each month.
5B3R.J. Rudden ^ElJAssociates, Inc.
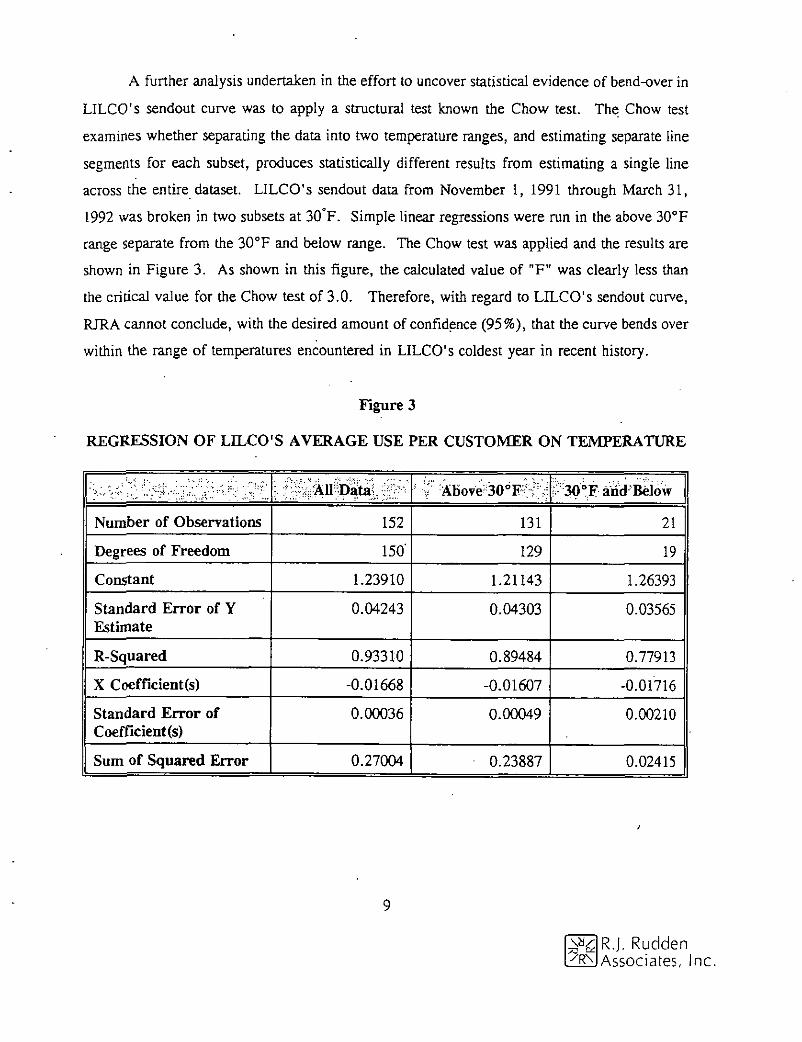
A further analysis undertaken in the effort to uncover statistical evidence of bend-over in
LILCO's sendout curve was to apply a structural test known the Chow test. The Chow test
examines whether separating the data into two temperature ranges, and estimating separate line
segments for each subset, produces statistically different results from estimating a single line
across the entire dataset. LILCO's sendout data from November 1, 1991 through March 31,
1992 was broken in two subsets at 30oF. Simple linear regressions were run in the above 30oF
range separate from the 30oF and below range. The Chow test was applied and the results are
shown in Figure 3. As shown in this figure, the calculated value of "F" was clearly less than
the critical value for the Chow test of 3.0. Therefore, with regard to LILCO's sendout curve,
RJRA cannot conclude, with the desired amount of confidence (95%), that the curve bends over
within the range of temperatures encountered in LILCO's coldest year in recent history.
Figure 3
REGRESSION OF LILCO'S AVERAGE USE PER CUSTOMER ON TEMPERATURE
All Data :: 7 Above 30oF ; r :: • 30 oF and telow
Number of Observations 152 131 21
Degrees of Freedom 150' 129 19
Constant 1.23910 1.21143 1.26393
Standard Error of Y Estimate
0.04243 0.04303 0.03565
R-Squared 0.93310 0.89484 0.77913
X Coefficient(s) -0.01668 -0.01607 -0.01716
Standard Error of Coefficient(s)
0.00036 0.00049 0.00210
Sum of Squared Error 0.27004 0.23887 0.02415
/RN R.J. Rudden Associates, Inc.
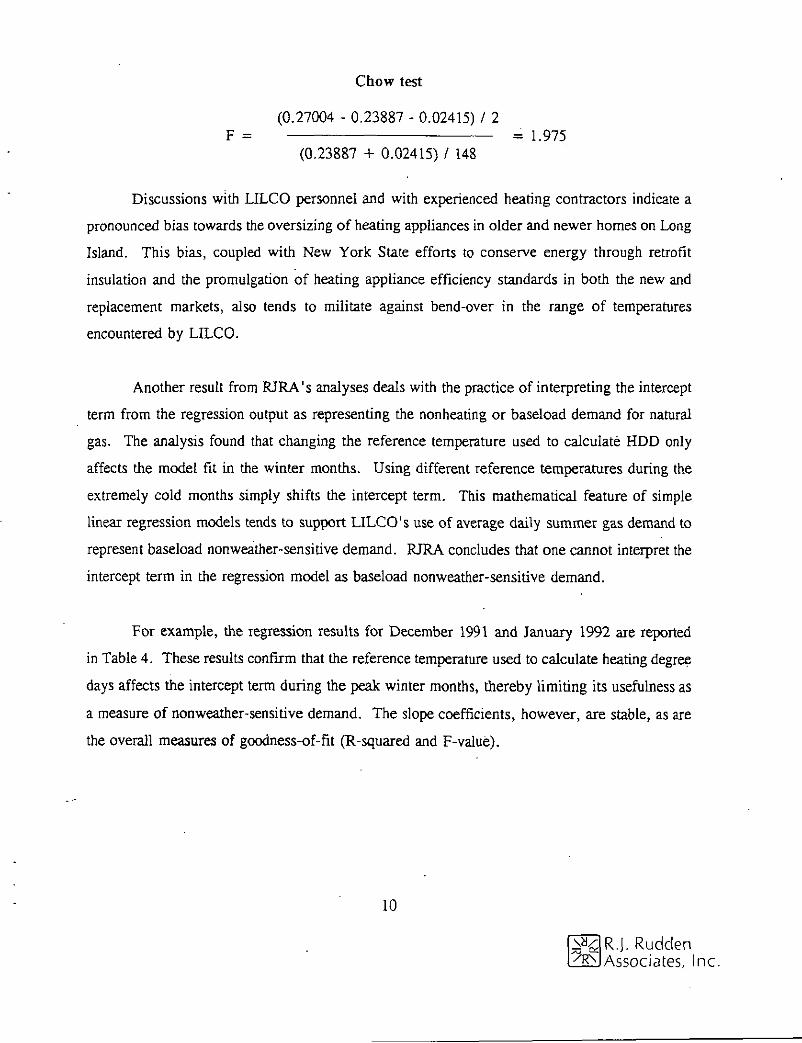
Chow test
(0.27004 - 0.23887 - 0.02415) / 2 F = = 1.975
(0.23887 + 0.02415) / 148
Discussions with LILCO personnel and with experienced heating contractors indicate a
pronounced bias towards the oversizing of heating appliances in older and newer homes on Long
Island. This bias, coupled with New York State efforts to conserve energy through retrofit
insulation and the promulgation of heating appliance efficiency standards in both the new and
replacement markets, also tends to militate against bend-over in the range of temperatures
encountered by LILCO.
Another result from RJRA's analyses deals with the practice of interpreting the intercept
term from the regression output as representing the nonheating or baseload demand for natural
gas. The analysis found that changing the reference temperature used to calculate HDD only
affects the model fit in the winter months. Using different reference temperatures during the
extremely cold months simply shifts the intercept term. This mathematical feature of simple
linear regression models tends to support LILCO's use of average daily summer gas demand to
represent baseload nonweather-sensidve demand. RJRA concludes that one cannot interpret the
intercept term in the regression model as baseload non weather-sensitive demand.
For example, the regression results for December 1991 and January 1992 are reported
in Table 4. These results confirm that the reference temperature used to calculate heating degree
days affects the intercept term during the peak winter months, thereby limiting its usefulness as
a measure of nonweather-sensitive demand. The slope coefficients, however, are stable, as are
the overall measures of goodness-of-fit (R-squared and F-value).
10
R.J. Rudden Associates, Inc.
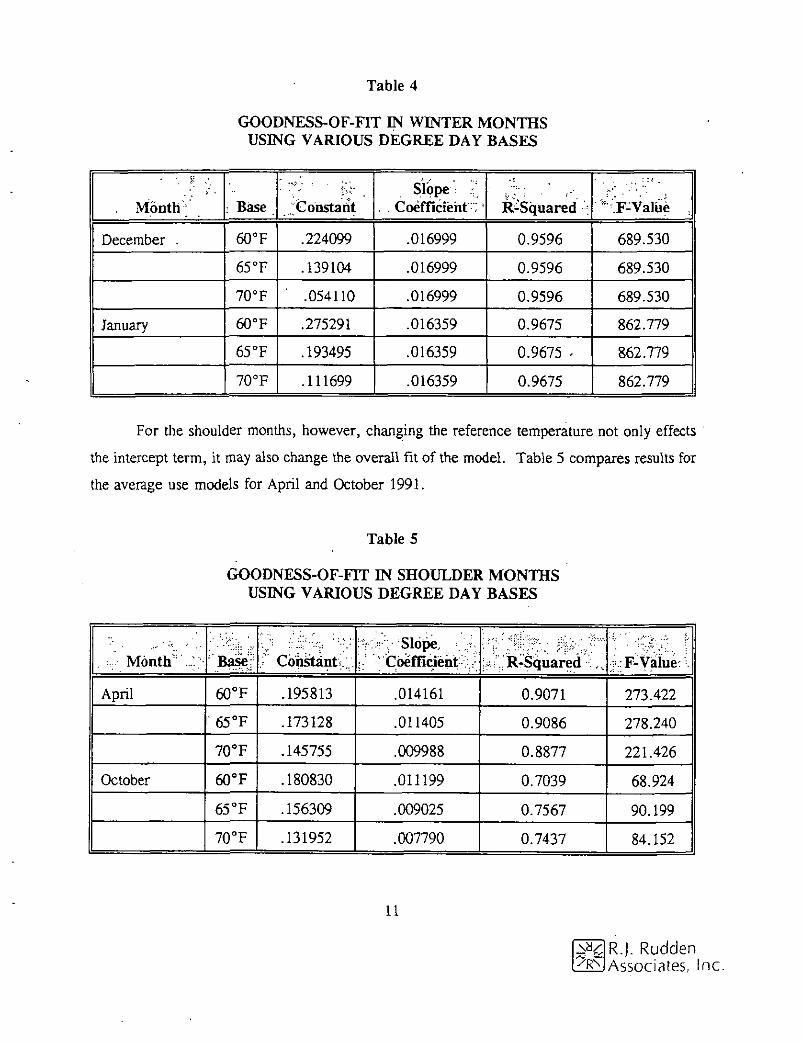
Table 4
GOODNESS-OF-FIT IN WINTER MONTHS USING VARIOUS DEGREE DAY BASES
Month ; Base •v-'" Constant
Slope { . . Coefficient" ;' R-Squared ; F-Value :
December . 60oF .224099 .016999 0.9596 689.530
65 0 F .139104 .016999 0.9596 689.530
70oF .054110 .016999 0.9596 689.530
January 60oF .275291 .016359 0.9675 862.779
65 0 F .193495 .016359 0.9675 - 862.779
70oF .111699 .016359 0.9675 862.779
For the shoulder months, however, changing the reference temperature not only effects
the intercept term, it may also change the overall fit of the model. Table 5 compares results for
the average use models for April and October 1991.
Table 5
GOODNESS-OF-FIT IN SHOULDER MONTHS USING VARIOUS DEGREE DAY BASES
•- Month . 1 Base; Constant.;. ^ y ; - Slope. •.
Coefficient ^ : R-Squared ••:... •p.: F Value ':.
April 60oF .195813 .014161 0.9071 273.422
"650F .173128 .011405 0.9086 278.240
70oF .145755 .009988 0.8877 221.426
October 60oF .180830 .011199 0.7039 68.924
650F .156309 .009025 0.7567 90.199
70oF .131952 .007790 0.7437 84.152
11
R.J. Rudden Associates, inc.
The good ness-of-fit measures across models for each month are fairly close and all
coefficients are statistically significant. Across all months in the sample period, however, 650F
gives the best fit. RJRA views this as confirmation of the conventional measurement of heating
degree days with a 650F reference temperature.
REVIEW OF MULTIPLE SERVICE TERRITORIES FOR EVIDENCE OF BEND-OVER
In order to investigate the possibility of bend-over for a wide range of weather conditions,
RJRA identified potential participants by examining available literature on the use of gas for
space heating and data contained in the A.G.A. Residential Gas Marketing Survey - 1990, as
well as other sources. The final list of potential participants ranges from the Gulf Coast to
Canada and from the East Coast to the West Coast. Upon agreeing to become a study
participant, each LDC received a data request. The data received was examined visually and,
in conjunction with LILCO personnel, the following four LDCs and. LILCO were chosen as a
sample set for analysis:
Baltimore Gas & Electric Company
Centra Gas Company
Elizabethtown Gas Company
Minnegasco
Initial analyses were undertaken using three years of data. These analyses included:
shifting the balance point (i.e., the temperature at which the blade and handle of the sendout
"hockey stick" intersect); examination of sendout versus weather in the coldest part of the
sendout curve; correction of temperature for the effects of wind and sun; and use of gas day
weather in lieu of calendar day weather. Figure 6 includes a scatter plot for each of the LDCs,
except LILCO, in the sample set.
12
^3R.J. Rudden j^E^JAssociates. Inc
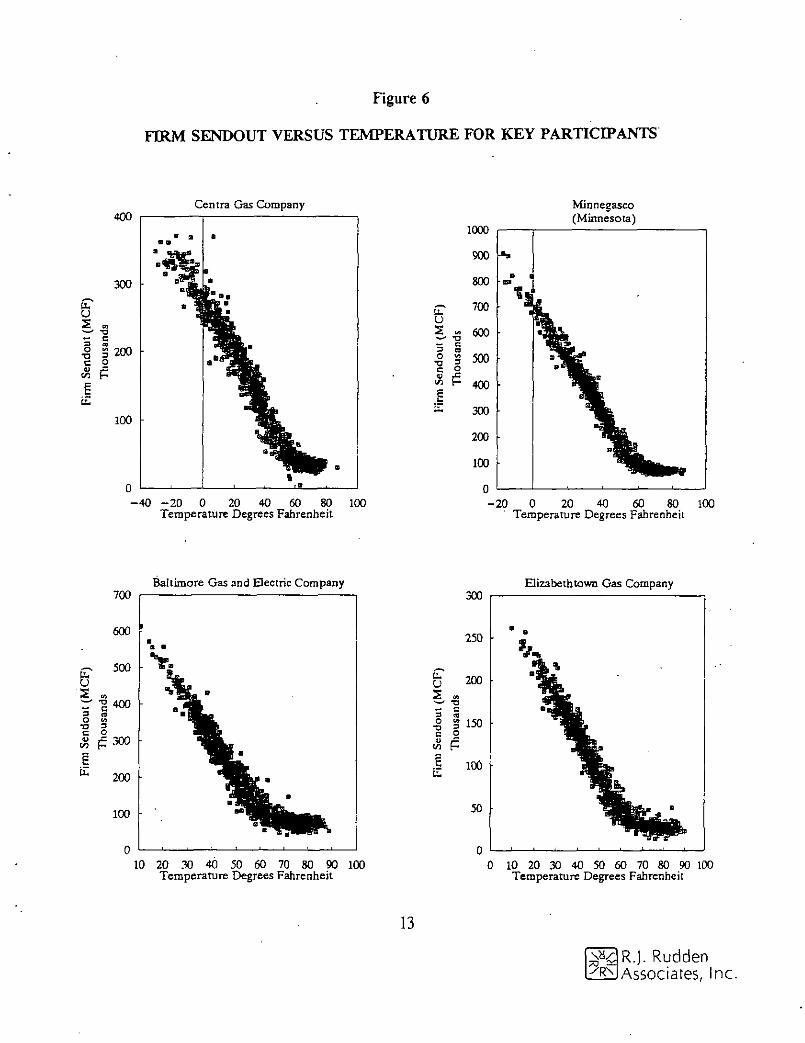
Figure 6
FIRM SENDOUT VERSUS TEMPERATURE FOR KEY PARTICIPANTS
Centra Gas Company Minnegasco (Minnesota)
-40 - 20 0 20 40 60 80 100 Temperature Degrees Fahrenheit
-20 0 20 40 60 80 100 Temperarure Degrees Fahrenheit
Baltimore Gas and Electric Company Elizabethtown Gas Company
10 20 30 40 50 60 70 80 90 100 Temperature Degrees Fahrenheit
0 10 20 30 40 50 60 70 80 90 100 Temperature Degrees Fahrenheit
13
/RN R.J. Rudden Associates, Inc.

RJRA's first conclusion from the analysis of these diverse LDCs is that the accurate
measurement of the temperature-sensitive portion of the sendout curve requires us to move well
below the assumed balance point for the LDC. A strictly linear model will not adequately
address the "noise" that surrounds the intersection of the flat portion with the temperature-
sensitive portion of the sendout curve. To eliminate the impact of the "blade" on the slope of
the regression line, several refinements were performed for each participant in the sample set.
The first refinement for each of these participants eliminated a number of observations
with warm temperatures. By eliminating the data which makes up the flat portion of the curve,
RJRA expected to achieve a better estimate of the effect of temperature change on firm sendout,
which is portrayed by the slope. As expected, the absolute value of the slope coefficient
increases for each LDC, meaning that the measurement of weather sensitivity has increased and
the overall fit of the model improved as well. It also suggests that the sendout curve may contain
several linear sections, each of which should be identified and estimated separately.
Another refinement performed on each sample participant covered a temperature range
between 0 oF and 20oF for the Canadian LDCs, and between 0oF and 30oF for U.S. LDCs. In
each case, RJRA found that the slope was flatter at the colder end of the curve. This initial test
suggests the possibility of bend-over. The Chow test for Centra Gas Company and Minnegasco
confirmed that the bend-over apparent in their sendout curves is statistically significant. Chow
test results for Baltimore Gas & Electric Company and Elizabethtown Gas Company found the
apparent bend-up in the slopes to be statistically insignificant. Figure 7 illustrates the presence
of bend-over in the sendout curves of Centra and Minnegasco.
14
R.J. Rudden Associates, Inc.
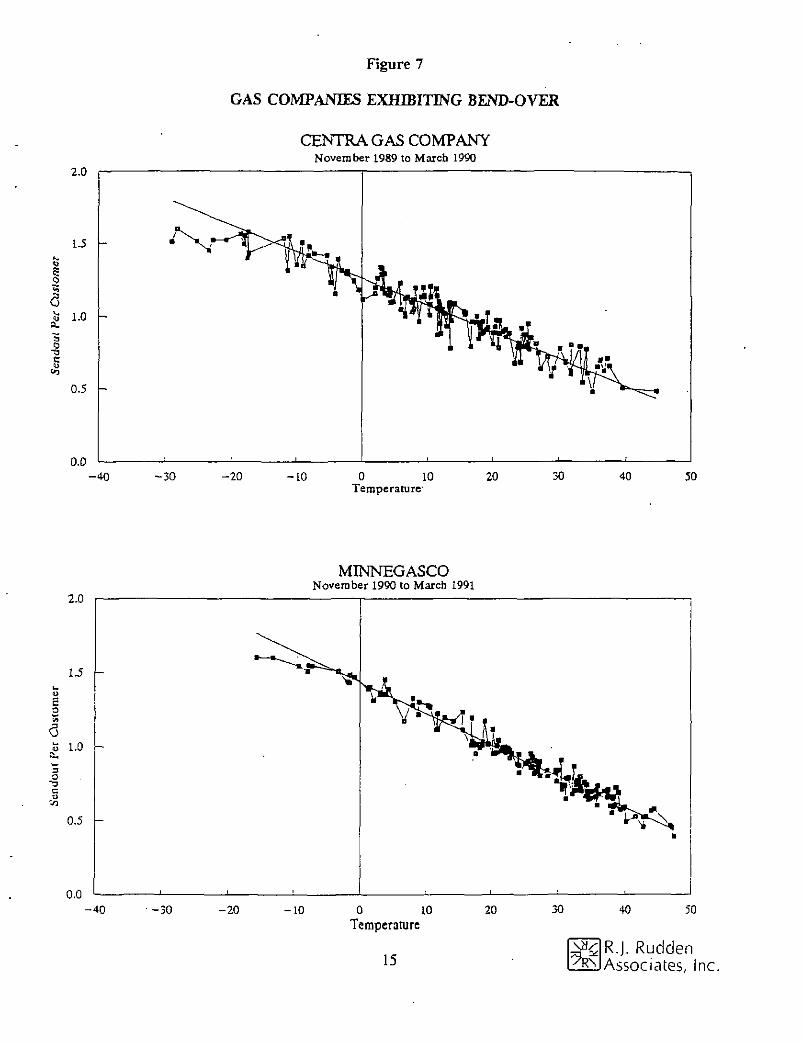
Figure 7
GAS COMPANIES EXHIBITING BEND-OVER
2.0
1.5
1.0
A.
0
5 t o 0.5 -
0.0 -40 -30
CENTRA GAS COMPANY November 1989 to March 1990
-20 -L0 0 10 Temperature
20 30 40 50
o
2.0
1-5
1.0
0.5
0.0 -40 -30 -20
MINNEGASCO November 1990 to March 1991
J 1 ! , p ' i
10 0 10 Temperature
15
20 30 40 50
RJ. Rudden Associates, Inc.
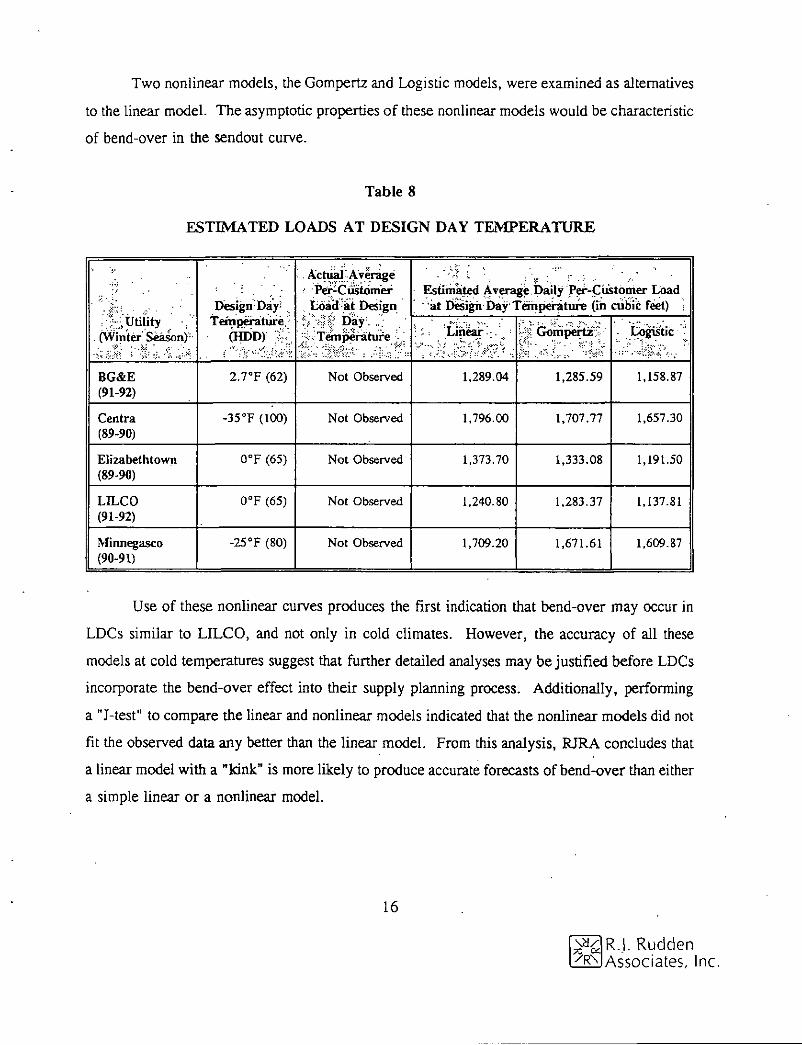
Two nonlinear models, the Gompertz and Logistic models, were examined as alternatives
to the linear model. The asymptotic properties of these nonlinear models would be characteristic
of bend-over in the sendout curve.
Table 8
ESTIMATED LOADS AT DESIGN DAY TEMPERATURE
^ U t i l i t y . (Winter Season)-
Design1 Day-. Temperature.
(HDD) S -. .' 'V' K--.:?'1'
. ActiialAverage i Per-Customer
Load -at Design % M pay . ..: "^.•vTimperatiife
Estimated Average Daily Per-Customer Load at Design Day Temperature (in cubic feet)
^ U t i l i t y . (Winter Season)-
Design1 Day-. Temperature.
(HDD) S -. .' 'V' K--.:?'1'
. ActiialAverage i Per-Customer
Load -at Design % M pay . ..: "^.•vTimperatiife :; = Linear - :. C^mpcHj?^ " Logistic
BG&E (91-92)
2.70F (62) Not Observed 1,289.04 1,285.59 1,158.87
Centra (89-90)
-350F (100) Not Observed 1,796.00 1,707.77 1,657.30
Elizabethtown (89-90)
0 oF (65) Not Observed 1,373.70 1,333.08 1,191.50
LILCO (91-92)
O F (65) Not Observed 1,240.80 1,283.37 1,137.81
Minnegasco (90-91)
-250F (80) Not Observed 1,709.20 1,671.61 1,609.87
Use of these nonlinear curves produces the first indication that bend-over may occur in
LDCs similar to LILCO, and not only in cold climates. However, the accuracy of all these
models at cold temperatures suggest that further detailed analyses may be justified before LDCs
incorporate the bend-over effect into their supply planning process. Additionally, performing
a "J-test" to compare the linear and nonlinear models indicated that the nonlinear models did not
fit the observed data any better than the linear model. From this analysis, RJRA concludes that
a linear model with a "kink" is more likely to produce accurate forecasts of bend-over than either
a simple linear or a nonlinear model.
16
7Z CC R.I. Rudden Associates, Inc.
REVIEW OF LOCAL WEATHER DATA ON LONG ISLAND
In order to accurately estimate the existence of significant, systematic weather variations
across Long Island, RJRA collected and analyzed temperature data from 11 weather stations.
These stations ranged in location from LaGuardia Airport in Queens to Greenport and
Bridgehampton on the north and south forks of Long Island, respectively, RJRA calculated
differences in daily minimum temperatures between LaGuardia Airport and each of the other
stations. Frequency distributions of the temperature differences were plotted and tested for
consistency. This last analysis examined the differences in daily minimum temperatures over the
whole range of winter temperatures. The objective was to determine whether or not the
differentials disappeared at extremely low temperatures.
These analyses were designed to test the concept that peak day sendout requirements
might vary from place to place on Long Island. RJRA also analyzed the difference in degree
days between these same weather stations. This analysis indicated that total heating consumption
also could be expected to vary geographically. A very conservative calculation indicates that as
much as a five percent difference in consumption could be expected between the west end and
the east end of LILCO's service territory. RJRA concluded that further exploration of this issue
could be justified as an extension of this study.
It is a scientific fact that as winter sets in, the temperatures of the ocean and Long Island
Sound are warmer than the temperature of the land. As winter progresses, the water gives up
its heat, warming the air over the land. In spring, the water is colder and shoreline areas have
climatic conditions colder than those inland. This progression can be found in the spring weather
forecasts on Long Island. Cooler weather occurs on the south shore, which is exposed to the
largest sweep of wind and weather over the open sea. Cooler weather also occurs on the south
shore of Connecticut which is exposed to the winds and weather over Long Island Sound. The
north shore of Long Island is generally warmer in the spring.
17
R.j. Rudden Associates, Inc.

The difference between the daily minimum temperature at LaGuardia Airport and the
daily minimum temperature at each of the other ten stations on that same day was calculated for
the winter period November 1 to March 31, in all years for which such data was available.
Figure 9 summarizes the data derived from the frequency distribution tables that were prepared
by RJRA.
18
R.J. Rudden Associates, Inc.
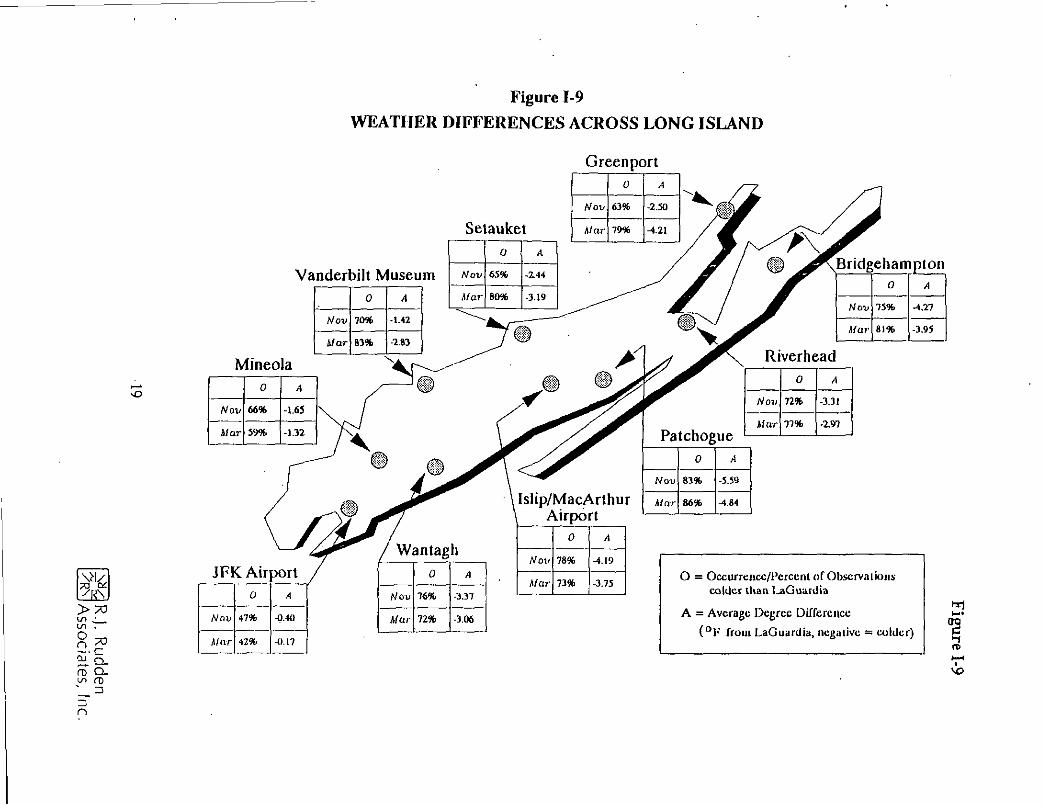
Figure 1-9
WEATHER DIFFERENCES ACROSS LONG ISLAND
i /> •
8?
Greenport
Setauket
Vanderbilt Museum 0 A
Nov 70* •1.42
Mar 83% -2.83
0 A
Nov 65% -2.44
Mar 80% -3.19
0 >1
Nov 63% -2.50
Mar 79% •4.21
Mineola 0 A
Nov 66% -1.65
Mar 59% -1.32
0 A
Nov 47% -0.40
Mar 42% -0.L7
Riverhead
Bridgehampton 0 A
Nov 75% -4.-27
Mar 81% -3.95
0 A
Nov 76% -3.37
Mar 72% -3.06
Islip/MacArthur Airport
Patchogue
0 A
Nov 72% -3.31
Mar 77% -2.97
0 A
Nov 83% -5.59
Mar 86% -(.84
0 A
Nov 78% -U9
Mar 73% -3.75 O = Occurrencc/Fcrccnl of Obscrvalbns
colder tlian I vGuiudia
A = Average Degree Difference
( 0 F from LaGuardia, negaiivc — colder) •S (Tl
n

The figure shows that, in general, the average winter temperatures from Islip MacArthur
Airport to the east end are materially lower than those at LaGuardia Airport, John F. Kennedy
Airport and the Mineola weather station. This suggests that identical residential dwellings would
consume more gas in Greenport than in Mineola. Additionally, these data show that the
frequency of occurrence of these lower temperatures is greater at the east end than in the western
parts of LILCO's service area.
Also, shore locations to the east (Vanderbilt, Setauket, Patchogue, Riverhead,
Bridgehampton and Riverhead) have the greatest frequency of colder temperature during the
month of March. On the other hand, those stations located towards the middle of the island
(Mineola and Islip) have the greatest frequency of colder temperatures in November. This
comports with the change in water temperature from warm in November to cold in March.
RJRA also prepared a scatter plot that has each station's temperature on the vertical axis
and temperature at LaGuardia on the horizontal axis. We drew a 45° line for reference.
Observations below this line represent lower temperatures at the individual station. The scatter
plot for Patchogue in Figure 10 illustrates the point.
20
R.J. Rudden Associates, Inc.
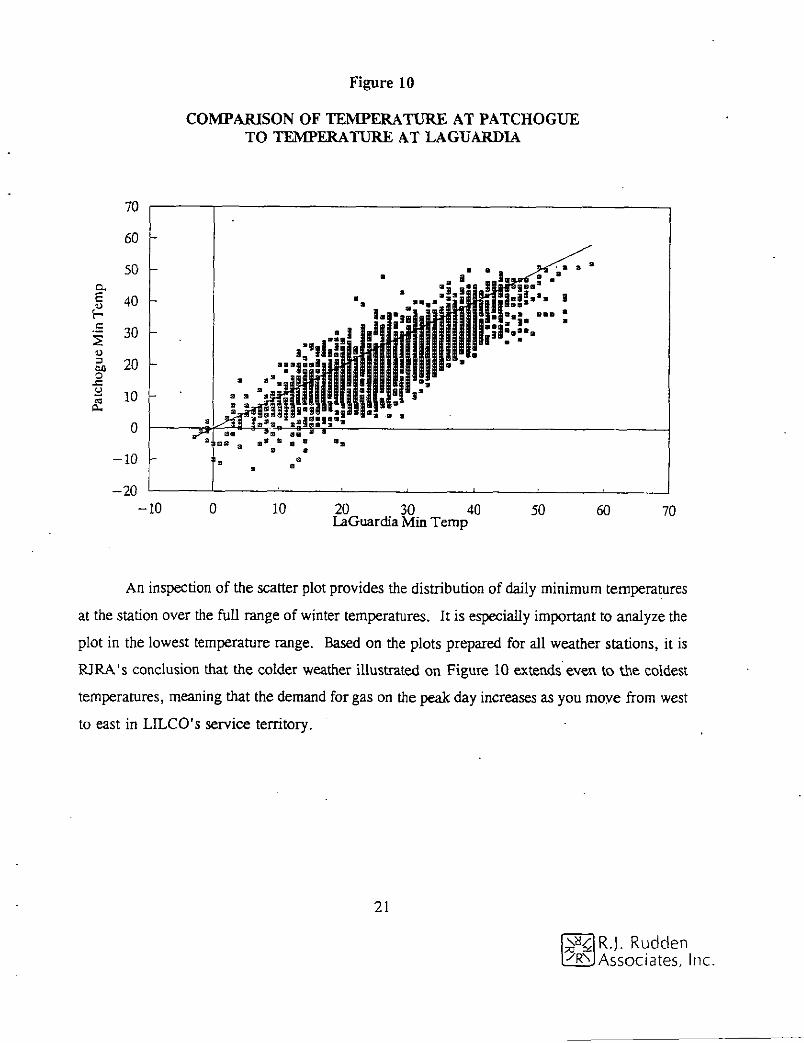
Figure 10
COMPARISON OF TEMPERATURE AT PATCHOGUE TO TEMPERATURE AT LAGUARDIA
70
60 -
50 -Q.
£
| 30 O
ea o
-C CJ S 10 r
40 -
20 -
0
-10
-20 -10 10 20 30 40
LaGuardia Min Temp 50 60 70
An inspection of the scatter plot provides the distribution of daily minimum temperatures
at the station over the full range of winter temperatures. It is especially important to analyze the
plot in the lowest temperature range. Based on the plots prepared for all weather stations, it is
RJRA's conclusion that the colder weather illustrated on Figure 10 extends even to the coldest
temperatures, meaning that the demand for gas on the peak day increases as you moye from west
to east in LILCO's service territory.
21
R.J. Rudden Associates, Inc.
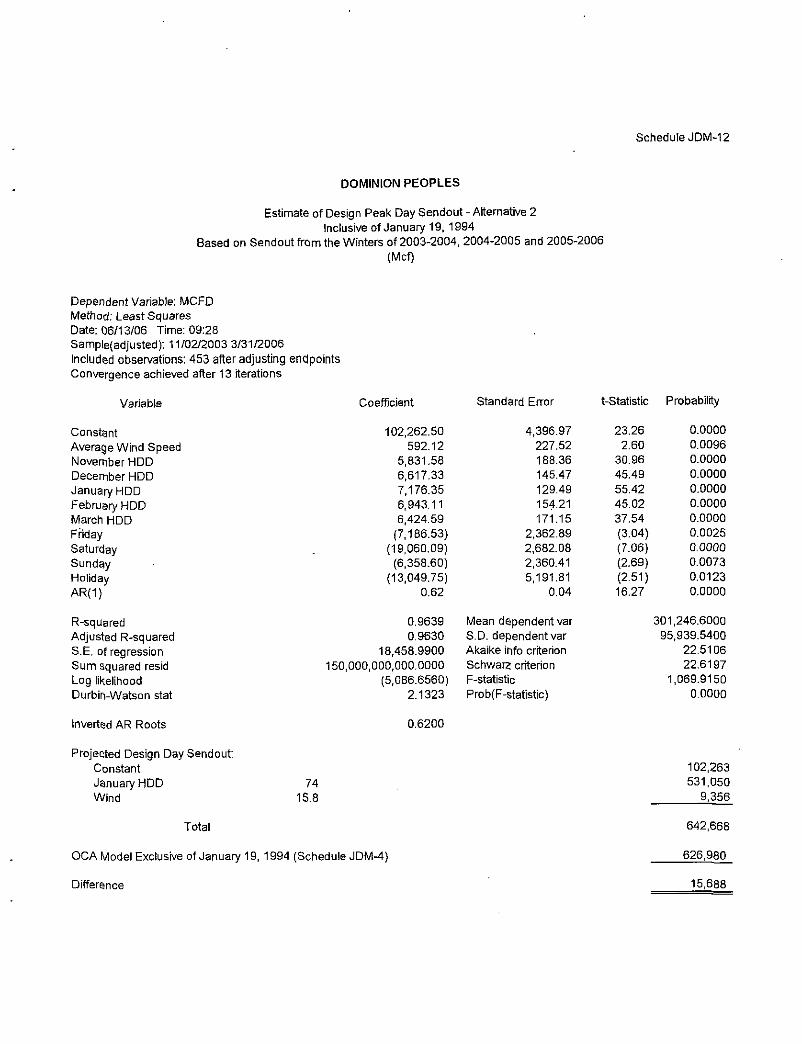
Schedule JDM-12
DOMINION PEOPLES
Estimate of Design Peak Day Sendout - Alternative 2 Inclusive of January 19, 1994
Based on Sendout from the Winters of 2003-2004, 2004-2005 and 2005-2006 (Mcf)
Dependent Variable: MCFD Method: Least Squares Date: 06/13/06 Time: 09:28 Sample(adjusted): 11/02/2003 3/31/2006 Included observations: 453 alter adjusting endpoints Convergence achieved after 13 iterations
Variable Coefficient Standard Error t-Statistic Probability
Constant 102,262.50 4,396.97 23.26 0.0000 Average Wind Speed 592.12 227.52 2.60 0.0096 November HDD 5,831.58 188.36 30.96 0.0000 December HDD 6,617.33 145.47 45.49 0.0000 January HDD 7,176.35 129.49 55.42 0.0000 February HDD 6,943.11 154,21 45.02 0.0000 March HDD 6,424.59 171.15 37.54 0.0000 Friday (7,186.53) 2,362.89 (3.04) 0.0025 Saturday (19,060.09) 2,682.08 (7.06) 0.0000 Sunday (6,358.60) 2,360.41 (2.69) 0.0073 Holiday (13,049.75) 5,191.81 (2.51) 0.0123 AR(1) 0.62 0.04 16.27 0.0000
R-squared 0.9639 Mean dependent var 301,246.6000 Adjusted R-squared 0.9630 S.D. dependent var 95,939.5400 S.E. of regression 18,458.9900 Akaike info criterion 22.5106 Sum squared resid 150,000,000,000.0000 Schwarz criterion 22.6197 Log likelihood (5,086.6560) F-statistic 1,069.9150 Durbin-Watson stat 2.1323 Prob(F-statistic) 0.0000
Inverted AR Roots 0.6200
Projected Design Day Sendout: Constant January HDD Wind
Total
74 15.8
OCA Model Exclusive of January 19, 1994 (Schedule JDM-4)
Difference
102,263 531,050
9,356
642,668
626,980
15,688
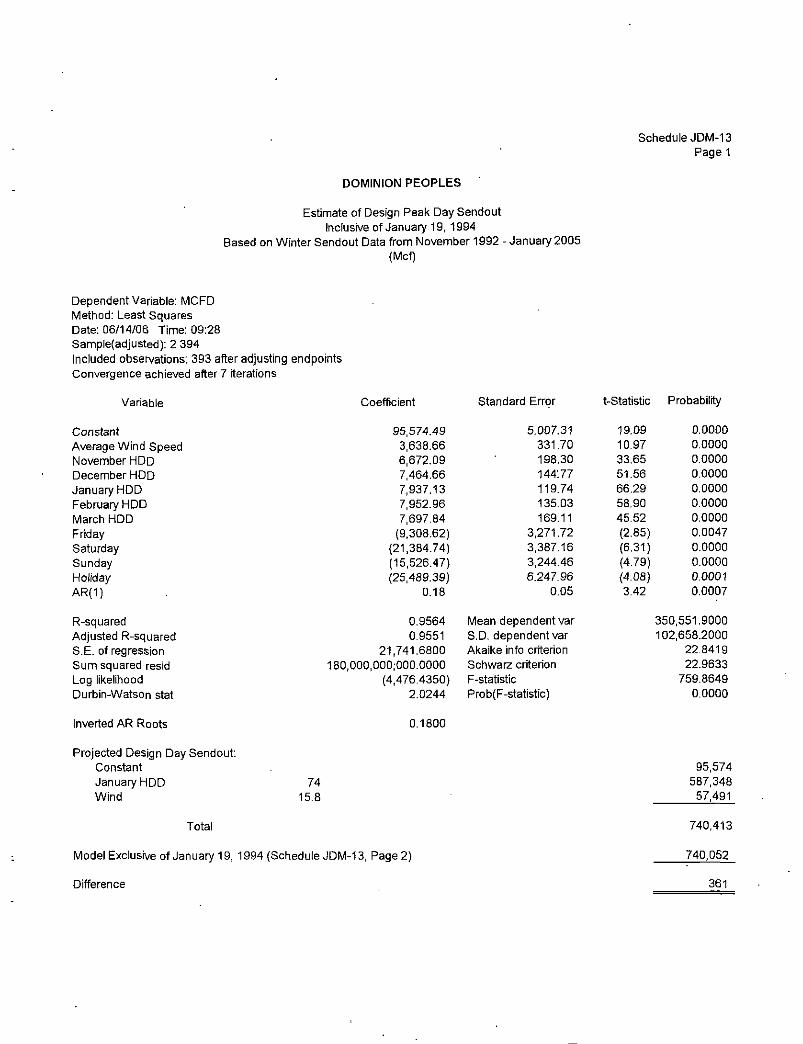
DOMINION PEOPLES
Estimate of Design Peak Day Sendout Inclusive of January 19, 1994
Based on Winter Sendout Data from November 1992 - January 2005 (Mcf)
Schedule JDM-13 Page 1
Dependent Variable: MCFD Method: Least Squares Date: 06/14/06 Time: 09:28 Sample(adjusted): 2 394 Included obseivations: 393 after adjusting endpoints Convergence achieved after 7 iterations
Variable Coefficient Standard Error t-Statistic Probability
Constant 95,574.49 5,007.31 19.09 0.0000 Average Wind Speed 3,638.66 331.70 10.97 0.0000 November HDD 6,672.09 198.30 33.65 0.0000 December HDD 7,464.66 144'.77 51.56 0.0000 January HDD 7,937.13 119.74 66.29 0.0000 February HDD 7,952.96 135.03 58.90 0.0000 March HDD 7,697.84 169.11 45.52 0.0000 Friday (9,308.62) 3,271.72 (2.85) 0.0047 Saturday (21,384.74) 3,387.16 (6.31) 0.0000 Sunday (15,526.47) 3,244.46 (4.79) 0.0000 Holiday (25,489.39) 6,247.96 (4.08) 0.0001 AR(1) 0.18 0.05 3.42 0.0007
R-squared 0.9564 Mean dependent var 350,551.9000 Adjusted R-squared 0.9551 S.D. dependent var 102,658.2000 S.E. of regression 21,741.6800 Akaike info criterion 22.8419 Sum squared resid 180,000,000;000.0000 Schwarz criterion 22.9633 Log likelihood (4,476.4350) F-statistic 759.8649 Durbin-Watson stat 2.0244 Prob( F-statistic) 0.0000
Inverted AR Roots 0.1800
Projected Design Day Sendout: Constant January HDD Wind
Total
74 15.8
Model Exclusive of January 19, 1994 (Schedule JDM-13, Page 2)
Difference
95,574 587,348 57,491
740,413
740,052
361
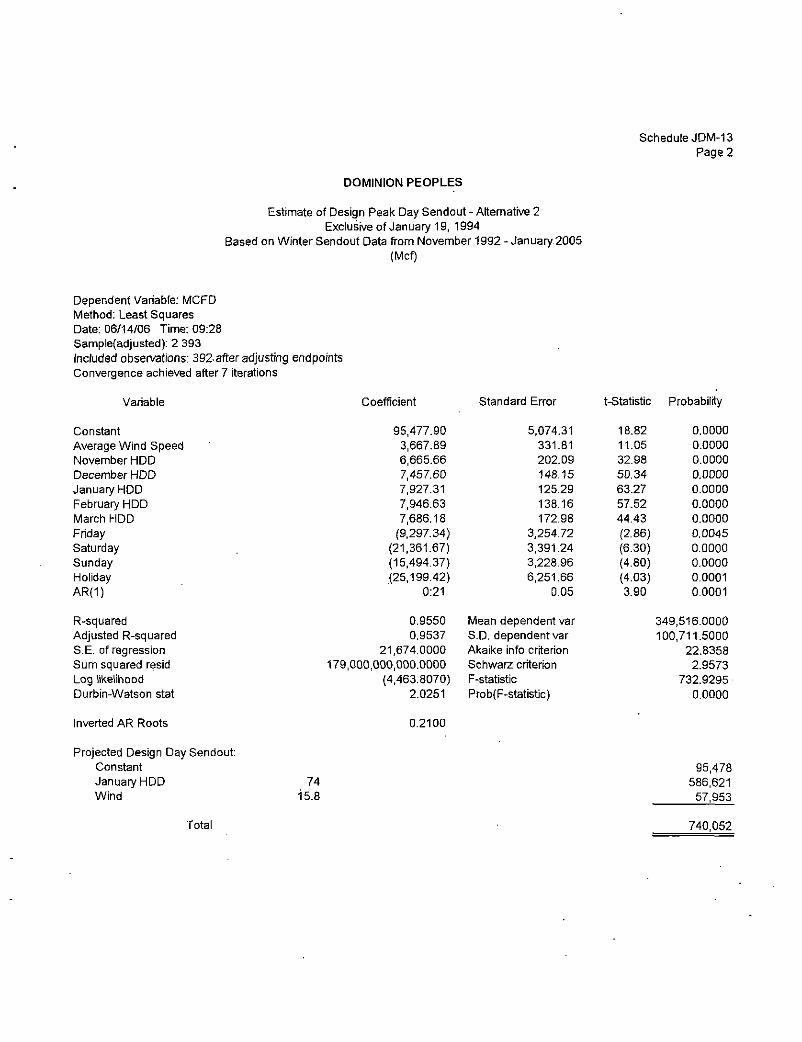
Schedule JDM-13 Page 2
DOMINION PEOPLES
Estimate of Design Peak Day Sendout - Alternative 2 Exclusive of January 19, 1994
Based on Winter Sendout Data from November 1992 - January 2005 (Mcf)
Dependent Variable: MCFD Method: Least Squares Date: 06/14/06 Time: 09:28 Sample(adjusted): 2 393 Included observations: 392-after adjusting endpoints Convergence achieved after 7 iterations
Variable Coefficient Standard Error t-Statistic Probability
Constant 95,477.90 5,074.31 18.82 0.0000 Average Wind Speed 3,667.89 331.81 11.05 0.0000 November HDD 6,665.66 202.09 32.98 0.0000 December HDD 7,457.60 148.15 50.34 0.0000 January HDD 7,927.31 125.29 63.27 0.0000 February HDD 7,946.63 138.16 57.52 0.0000 March HDD 7,686.18 172.98 44.43 0.0000 Friday (9,297.34) 3,254.72 (2.86) 0.0045 Saturday (21,361.67) 3,391.24 (6.30) 0.0000 Sunday (15,494.37) 3,228.96 (4.80) 0.0000 Holiday (25,199.42) 6,251.66 (4.03) 0.0001 AR(1) 0:21 0.05 3.90 0.0001
R-squared 0.9550 Mean dependent var 349,516.0000 Adjusted R-squared 0.9537 S.D. dependent var 100,711.5000 S.E. of regression 21,674.0000 Akaike info criterion 22.8358 Sum squared resid 179,000,000,000.0000 Schwarz criterion 2.9573 Log likelihood (4,463.8070) F-statistic 732.9295 Durbin-Watson stat 2.0251 Prob(F-statistic) 0.0000
Inverted AR Roots 0.2100
Projected Design Day Sendout: Constant January HDD Wind
74 15.8
95,478 586,621
57,953
Total 740,052
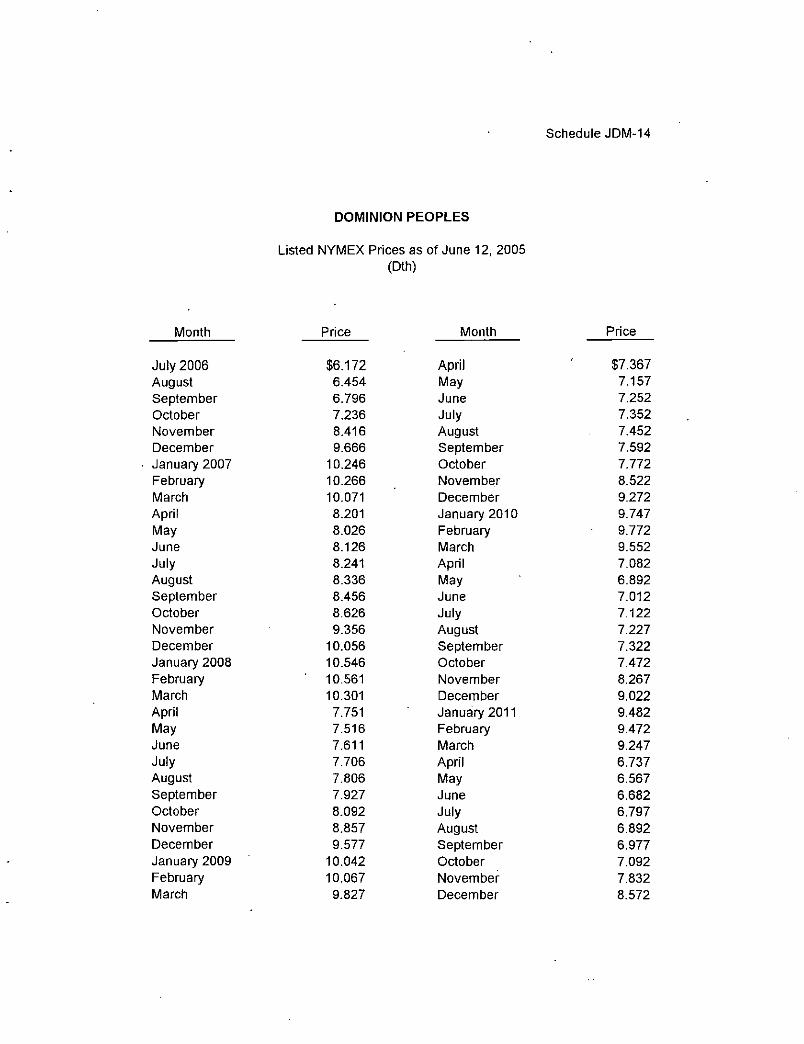
Schedule JDM-14
DOMINION PEOPLES
Listed NYMEX Prices as of June 12, 2005 (Dth)
Month Price Month Price
July 2006 $6,172 April $7,367 August 6.454 May 7.157 September 6.796 June 7.252 October 7.236 July 7.352 November 8.416 August 7.452 December 9.666 September 7.592 January 2007 10.246 October 7.772 February 10.266 November 8.522 March 10.071 December 9.272 April 8.201 January 2010 9.747 May 8.026 February 9.772 June 8.126 March 9.552 July 8.241 April 7.082 August 8.336 May 6.892 September 8.456 June 7.012 October 8.626 July 7.122 November 9.356 August 7.227 December 10.056 September 7.322 January 2008 10.546 October 7.472 February 10.561 November 8.267 March 10.301 December 9.022 April 7.751 January 2011 9.482 May 7.516 February 9.472 June 7.611 March 9.247 July 7.706 April 6.737 August 7.806 May 6.567 September 7.927 June 6.682 October 8.092 July 6.797 November 8.857 August 6.892 December 9.577 September 6.977 January 2009 10.042 October 7.092 February 10.067 November 7.832 March 9.827 December 8.572
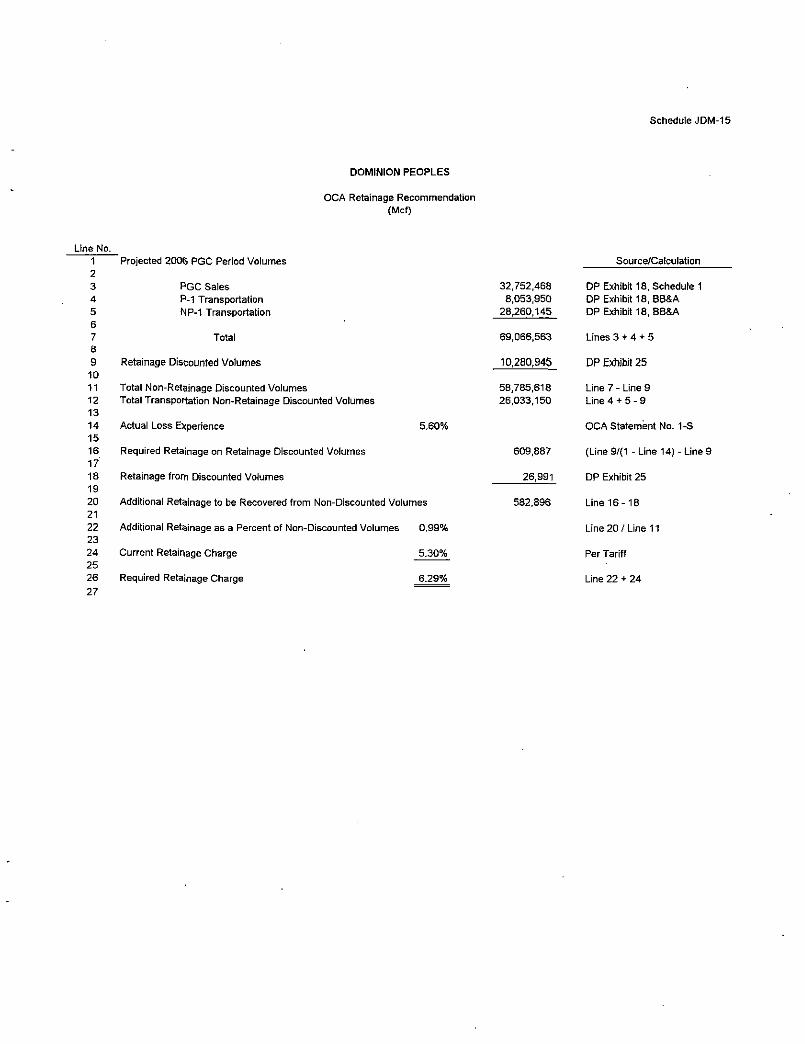
DOMINION PEOPLES
OCA Retainage Recommendation (Mcf)
Schedule JDM-15
Line No. 1 2 3 4 5 6 7 8 9
10 11 12 13 14 15 16 17 18 19 20 21 22 23 24 25 26 27
Projected 2006 PGC Period Volumes
PGC Sales P-1 Transportation NP-1 Transportation
Total
Retainage Discounted Volumes
Total Non-Retainage Discounted Volumes
Total Transportation Non-Retainage Discounted Volumes
Actual Loss Experience 5.60%
Required Retainage on Retainage Discounted Volumes
Retainage from Discounted Volumes
Additional Retainage to be Recovered from Non-Discounted Volumes
Additional Retainage as a Percent of Non-Discounted Volumes 0.99%
Current Retainage Charge 5.30%
Required Retainage Charge 6.29%
Source/Calculation
32,752,468 8,053,950
28,260,145
69,066,563
10,280,945
58,785,618 26,033,150
609,887
26,991
582,896
DP Exhibit 18, Schedule 1 DP Exhibit 18, BB&A DP Exhibit 18, BB&A
Lines 3 + 4 + 5
DP Exhibit 25
Line 7 - Line 9 Line 4 + 5 - 9
OCA Statement No. 1-S
(Line 9/(1 - Line 14) - Line 9
DP Exhibit 25
L ine16- 18
Line 20 / Line 11
Per Tariff
Line 22 + 24
OTS Statement No. 1-R Witness: Joseph Kubas
PENNSYLVANIA PUBLIC UTILITY COMMISSION
v.
THE PEOPLES NATURAL GAS COMPANY 1307(f)
Docket No. R-00061301
Rebuttal Testimony
of
Joseph Kubas
Office of Trial Staff
Concerning:
New Hedging Program Waived Retainage

1 Q. WOULD YOU PLEASE STATE YOUR NAME AND BUSINESS
2 ADDRESS?
3 A. My name is Joseph Kubas. My business address is P.O. Box 3265, Harrisburg,
4 Pennsylvania 17105-3265.
5
6 Q. BY WHOM ARE YOU EMPLOYED AND IN WHAT CAPACITY?
7 A. I am employed by the Pennsylvania Pubic Utility Commission in the Technical
8 Division of the Office of Trial Staff as a Fixed Utility Valuation Engineer.
9
10 Q. PLEASE DESCRIBE THE ROLE OF OTS IN RATE PROCEEDINGS.
11 A. OTS was established by the legislature and is responsible for protecting the public
12 interest in rate proceedings. The OTS analysis in this proceeding is based on its
13 responsibility to represent the public interest. This responsibility requires the
14 balancing of the interests of ratepayers and the Company.
15
16 Q. WHAT IS YOUR EDUCATIONAL AND PROFESSIONAL
17 BACKGROUND?
18 A. Attached to my testimony as Appendix A is a statement which describes my
19 educational background and employment experience.

1 Q. WHAT IS THE PURPOSE OF YOUR REBUTTAL TESTIMONY?
2 A. The purpose of my rebuttal testimony in this proceeding is to address the direct
3 testimony of Jerome D. Mierzwa submitted on behalf of the Office of Consumer
4 Advocate (OCA) concerning The Peoples Natural Gas Company's d/b/a Dominion
5 Peoples (Peoples or Company) new financial hedging program. I will also address
6 the OTS position with respect to waived retainage.
7
8 Q. WHAT IS HEDGING?
9 A. Hedging refers to the purchase or contract to purchase gas for future delivery to
10 customers. It is usually done to reduce price volatility and improve system
11 reliability by having gas available on days of peak usage.
12
13 Q. WHAT TYPES OF HEDGING ARE UTILIZED BY THE COMPANY?
14 A. As described by the Company, it utilizes three basic forms of hedging; placing the
15 gas into storage for future delivery; long term contracts at a fixed price; and the
16 purchasing of futures contracts.

1 Q. WHAT DID THE COMPANY PROPOSE IN ITS 2004 1307(F) CASE IN
2 ORDER TO UTILIZE GAS OBTAINED THROUGH FUTURES
3 CONTRACTS?
4 A. In order to utilize futures contracts and mitigate price spikes, the Company
5 proposed a two year financial hedging pilot program to hedge 18 percent of
6 summer sales in its 2004 1307(f) proceeding. Under this program, the Company
7 proposed to purchase two 10,000 Dth NYMEX future contracts, one on September
8 30 and a second one on October 29 of each year. The gas is to be delivered in the
9 following summer of each year.
10
11 Q. IS THE COMPANY PROPOSING A NEW FINANCIAL HEDGING
12 PROGRAM IN THIS 1307(F) PROCEEDING?
13 A. Yes. In this 1307(f) proceeding, the Company is proposing a new financial
14 hedging program that would increase both the amount of gas hedged and the
15 number of hedges obtained each year compared to the two year financial hedging
16 pilot program. In the new financial hedging program, the Company is proposing
17 to hedge 25 percent of its monthly purchases and expand the number of purchases
18 to twelve per year. One important aspect of the new program limits the quantity of
19 gas hedged to no more than the quantity of gas the Company projects it can use
20 (Peoples St. No. 1 pp. 62-63).

1 Q. HAS OCA WITNESS MIERZWA PROPOSED A MODIFICATION TO
2 THE COMPANY'S NEW FINANCIAL HEDGING PROGRAM?
3 A. Yes. OCA witness Mierzwa has proposed one modification to the Company's
4 financial hedging program. He recommends that 50 percent of the volumes should
5 be hedged two seasons prior to delivery. For example, he proposes that 50 percent
6 of the volumes to be delivered in the summer of 2007 be hedged during the
7 summer of 2006 and 50 percent should be hedged during the winter of 2006-
8 2007(OCASt. l ,p 15).
9
3 0 Q. DO YOU AGREE WITH MR. MIERZWA'S PROPOSAL?
11 A. No.
12
13 Q. WHAT IS YOU RECOMMENDATION?
14 A. I recommend that the Company's financial hedging program be approved as filed.
15
16 Q. WHY DO YOU DISAGREE WITH MR. MIERZWA'S PROPOSAL?
17 A. I believe that the 50 percent targets proposed by the OCA would be
18 micromanaging the operations ofthe Company and would leave it with little
19 discretion to purchase futures contracts, which is not in the public interest. Such a
20 threshold could force the Company to purchase gas during times of price spikes
21 that occurred last fall as a result ofthe hurricane season. OCA's proposal could

1 also cause the Company to purchase gas at a higher price than is available from
2 other sources.
3
4 Q. WHY IS IT NECESSARY FOR THE COMPANY TO HAVE MORE
5 DISCRETION WHEN PURCHASING FUTURES CONTRACTS?
6 A. As described by the Company, on October 28, 2005, the predetermined original
7 date for the last hedge of 2005, the Company observed that the high cost of the
8 futures for delivery in the summer of 2006 was at unprecedented levels. The
9 Company believed that it would be imprudent to purchase the futures contract at
10 that time. Therefore, the Company contacted the other parties to the 1307(f)
11 settlement and the other parties agreed to allow the Company the flexibility to
12 postpone purchasing the last futures contract until November 30, 2005 (Peoples St.
13 No. Ip . 61).
14
15 Q. WHAT DOES THIS SERIES OF EVENTS INDICATE?
16 A. This series of events indicates the Company's purchase of futures contracts should
17 be as flexible as possible. It also shows that an outside party micromanaging the
18 Company's plans by predetermining dates to purchase future contracts does not
19 give the Company the needed discretion to pursue a least cost procurement
20 strategy. In addition, in the case of the other forms of hedging, the Company is
21 not required to purchase by a specific date or obtain permission from the other
22 1307(f) parties before it changes the amount of gas withdrawn or injected into

1 storage or the amount of gas purchased from local supplies. Considering the
2 flexibility the Company has with regard the these purchases, the OCA's proposal
3 to mandate a specific percentage be hedged by specific date is too restrictive and
4 should be rejected.
5
6 Retainage
7 Q. WHAT IS RETAINAGE?
8 A. Retainage refers to the gas necessary to compensate the Company for lost and
9 unaccounted for gas. It is usually stated as a percentage of gas delivered into the
10 distribution system.
11
12 Q. WHY IS IT NECESSARY TO ACCOUNT FOR RETAINAGE?
13 A. Generally, all distribution systems leak. Therefore, regardless of whether the gas
14 is purchased by the Company for firm sales or the Company transports the gas for
15 transportation customers, some gas is generally lost in the distribution system.
16
17 Q. IS THE COMPANY PERMITTED TO WAIVE RETAINAGE FOR
18 TRANSPORTATION CUSTOMERS?
19 A. Yes. According to the Company's tariff, the Company may charge a retainage fee
20 of up to 5.3%. Therefore, this provision also allows the Company to waive all
21 retainage for any transportation customer with a competitive alternative (Peoples
22 Gas P.U.C. No. 43, Page 42).
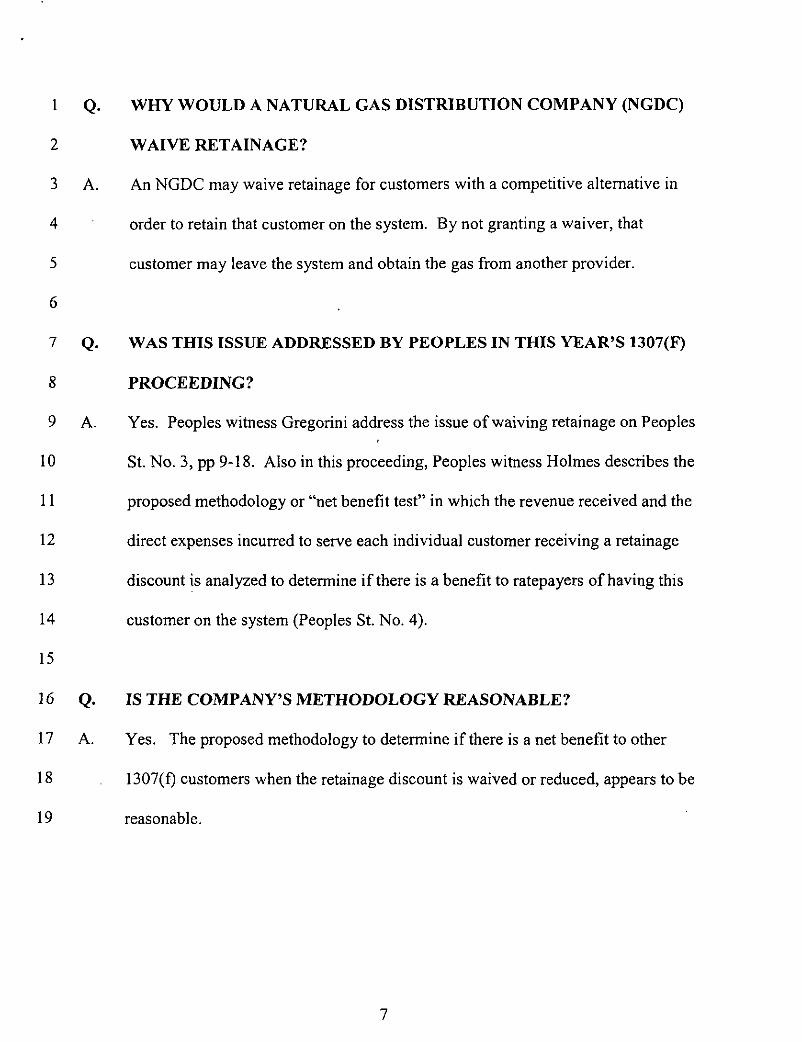
1 Q. WHY WOULD A NATURAL GAS DISTRIBUTION COMPANY (NGDC)
2 WAIVE RETAINAGE?
3 A. An NGDC may waive retainage for customers with a competitive alternative in
4 order to retain that customer on the system. By not granting a waiver, that
5 customer may leave the system and obtain the gas from another provider.
6
7 Q. WAS THIS ISSUE ADDRESSED BY PEOPLES IN THIS YEAR'S 1307(F)
8 PROCEEDING?
9 A. Yes. Peoples witness Gregorini address the issue of waiving retainage on Peoples
10 St. No. 3, pp 9-18. Also in this proceeding, Peoples witness Holmes describes the
11 proposed methodology or "net benefit test" in which the revenue received and the
12 direct expenses incurred to serve each individual customer receiving a retainage
13 discount is analyzed to determine i f there is a benefit to ratepayers of having this
14 customer on the system (Peoples St. No. 4).
15
16 Q. IS THE COMPANY'S METHODOLOGY REASONABLE?
17 A. Yes. The proposed methodology to determine i f there is a net benefit to other
18 1307(f) customers when the retainage discount is waived or reduced, appears to be
19 reasonable.
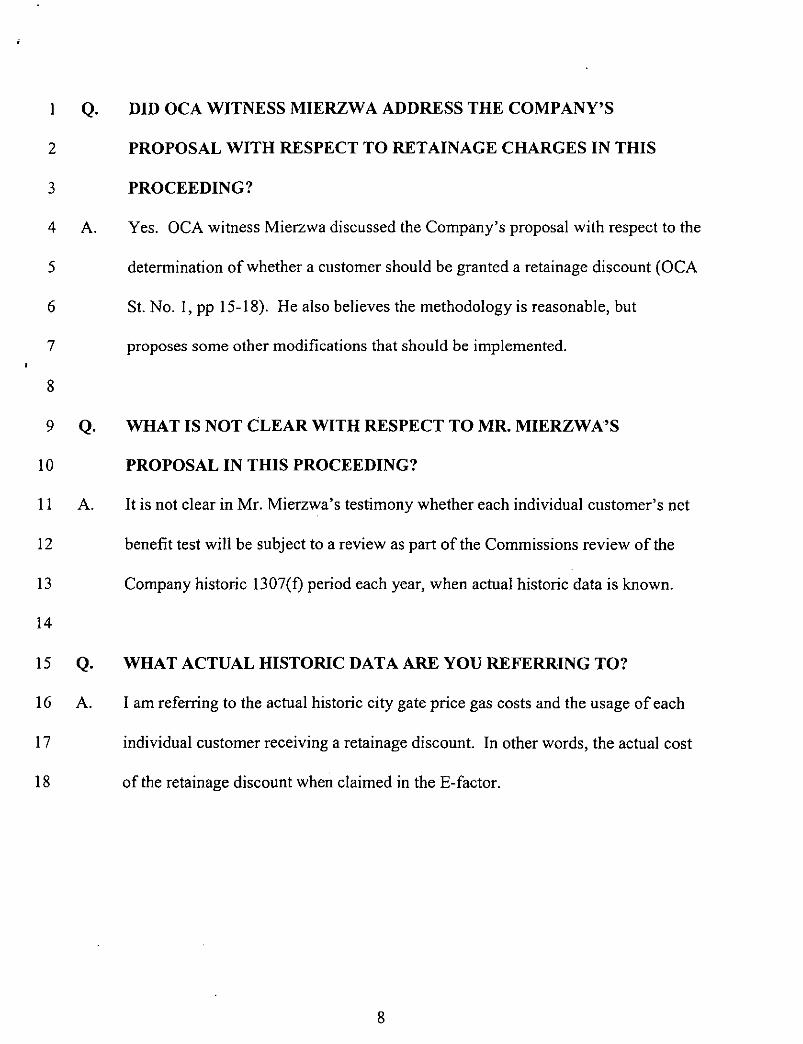
1 Q. DID OCA WITNESS MIERZWA ADDRESS THE COMPANY'S
2 PROPOSAL WITH RESPECT TO RETAINAGE CHARGES IN THIS
3 PROCEEDING?
4 A. Yes. OCA witness Mierzwa discussed the Company's proposal with respect to the
5 determination of whether a customer should be granted a retainage discount (OCA
6 St. No. 1, pp 15-18). He also believes the methodology is reasonable, but
7 proposes some other modifications that should be implemented.
8
9 Q. WHAT IS NOT CLEAR WITH RESPECT TO MR. MIERZWA'S
10 PROPOSAL IN THIS PROCEEDING?
11 A. It is not clear in Mr. Mierzwa's testimony whether each individual customer's net
12 benefit test will be subject to a review as part of the Commissions review of the
13 Company historic 1307(f) period each year, when actual historic data is known.
14
15 Q. WHAT ACTUAL HISTORIC DATA ARE YOU REFERRING TO?
16 A. I am referring to the actual historic city gate price gas costs and the usage of each
17 individual customer receiving a retainage discount. In other words, the actual cost
18 of the retainage discount when claimed in the E-factor.
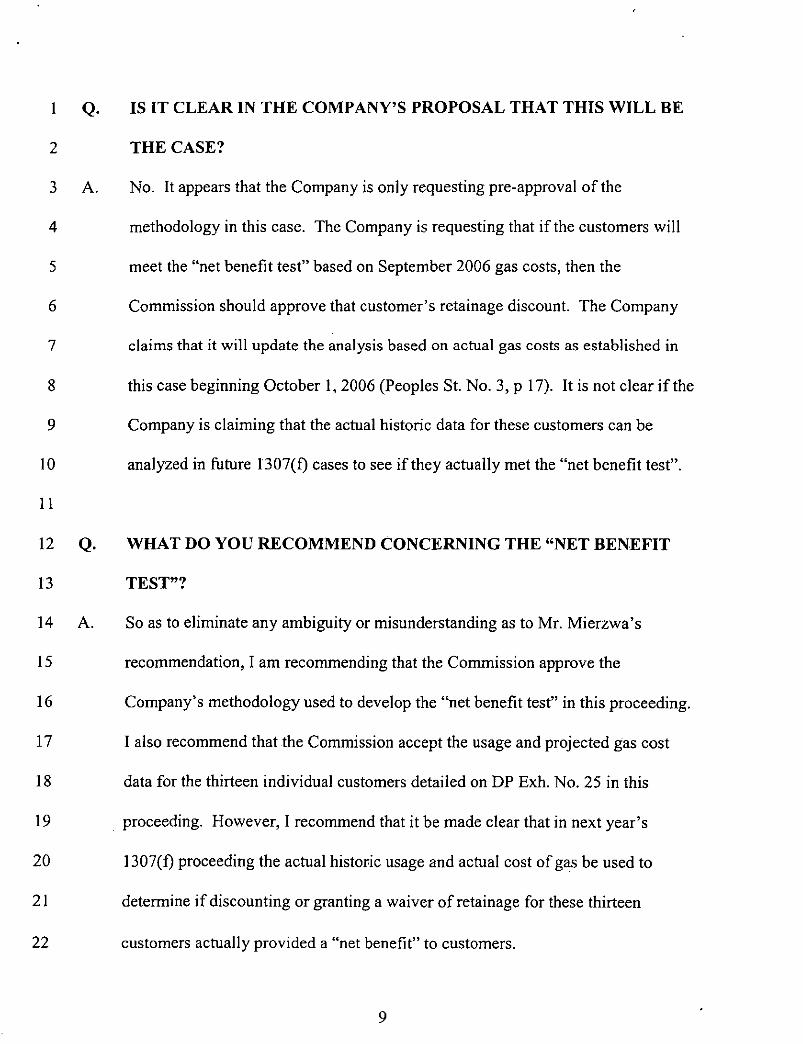
1 Q. IS I T C L E A R IN T H E COMPANY'S PROPOSAL THAT THIS W I L L B E
2 T H E CASE?
3 A. No. It appears that the Company is only requesting pre-approval of the
4 methodology in this case. The Company is requesting that i f the customers will
5 meet the "net benefit test" based on September 2006 gas costs, then the
6 Commission should approve that customer's retainage discount. The Company
7 claims that it will update the analysis based on actual gas costs as established in
8 this case beginning October 1, 2006 (Peoples St. No. 3, p 17). It is not clear i f the
9 Company is claiming that the actual historic data for these customers can be
10 analyzed in ftiture 1307(f) cases to see i f they actually met the "net benefit test".
11
12 Q. WHAT DO Y O U RECOMMEND CONCERNING T H E "NET B E N E F I T
13 TEST"?
14 A. So as to eliminate any ambiguity or misunderstanding as to Mr. Mierzwa's
15 recommendation, I am recommending that the Commission approve the
16 Company's methodology used to develop the "net benefit test" in this proceeding.
17 I also recommend that the Commission accept the usage and projected gas cost
18 data for the thirteen individual customers detailed on DP Exh. No. 25 in this
19 proceeding. However, I recommend that it be made clear that in next year's
20 1307(f) proceeding the actual historic usage and actual cost of gas be used to
21 determine i f discounting or granting a waiver of retainage for these thirteen
22 customers actually provided a "net benefit" to customers.
1 Q. WHY DO YOU RECOMMEND THAT ACTUAL USAGE AND GAS
2 COSTS BE USED TO DETERMINE IF THESE INDIVIDUAL
3 CUSTOMERS MET THE "NET BENEFIT TEST"
4 A. Obviously, the actual historic data for these customers will not be known until the
5 projected period in this proceeding has passed. Therefore, a historic review, as is
6 customarily done in 1307(f) proceedings will indicate if having these thirteen
7 individual customers on the system actually benefited other 1307(f) customers. As
8 with all projections, the Commission has the authority to review projects as well as
9 actual historic data to determine if a Company's rates are reasonable.
10
11 Q. WHAT WOULD HAPPEN IF ONE OR MORE OF THE CUSTOMER
12 THAT WERE PROJECTED TO MEET THE "NET BENEFIT TEST"
13 BASED ON PROJECTED DATA DID NOT MEET THE "NET BENEFIT
14 TEST" BASED ON ACTUAL DATA?
15 A. If this occurs, the "net benefit" would become a "net cost" and the "net cost" of
16 having this customer on the system would be bome by the Company.
17
18 Q. DOES THIS CONCLUDE YOUR REBUTTAL TESTIMONY?
19 A. Yes.
10
Appendix A
JOSEPH KUBAS
PENNSYLVANIA PUBLIC UTILITY COMMISSION
PO BOX 3265
HARRISBURG, PA 17105-3265
Education:
Continuing Education:
Professional Exams:
Bachelor of Science in Civil Engineering Technology, 1985, University of Pittsburgh at Johnstown, Johnstown, PA.
Legal Principles and Practices of Surveying at the University of Maryland. Economics, Accounting, Lotus, at the Howard Community College. 33 Credit hours of accounting at the University of Pittsburgh at Johnstown. Managing Multiple Priorities at the Pennsylvania State University. Various PA-PUC and Utility Company Seminars.
Engineer In Training, 1985, Uniform Certified Public Accounting Exam, 1993.
Experience:
Duties:
FIXED UTILITY VALUATION ENGINEER III December 1999 - Present
Pennsylvania Public Utility Commission Office of Trial Staff
Perform the duties of a Fixed Utility Valuation Engineer III in the Office of Trial Staff (OTS).
Analyze and review valuation engineering, and rate structure data submitted by Water, Sewer, Telephone, Gas and Steam Heat utilities to justify utility service rates or alternative forms of regulation, by researching, analyzing, and reviewing rate case filings, tariff filings, acquisitions and investigations. Participate in on-site inspections of utility properties to determine the used and usefulness of the plant-in service and make recommendations. Prepare interrogatories in the areas of rate base, rate structure, revenue and quality of service in order to obtain additional information regarding a utility's filing.
Analyze present revenue, proposed revenue, rate structure and tariff issues. Recommend adjustments to rate base, depreciation, revenue and rate structure and other issues concerning utilities. Prepare testimony and exhibits for the purpose of establishing the OTS positions in formal and informal proceedings before the Commission. Participate in Commission consultative report proceedings and collaboratives undertaken by the Commission.
Experience: FIXED UTILITY VALUATION ENGINEER II April 1996 - December 1999
Pennsylvania Public Utility Commission Office of Trial Staff and Bureau of Fixed Utility Services
Duties: Perform the duties of a Fixed Utility Valuation Engineer II in the Office of Trail Staff (OTS) and Bureau of Fixed Utility Services.
Experience: FIXED UTILITY VALUATION ENGINEER TRAINEE, I & I I May 1993 -March 1996 .
Pennsylvania Public Utility Commission Office of Trial Staff Telecommunications and Water Division
Duties: Perform the duties of a Fixed Utility Valuation Engineer II in the Rate Structure/Engineering Section of the Telecommunications and Water Division ofthe Office of Trial Staff (OTS).
Experience: CIVTL ENGINEER May 1985-January 1991
Duties:
Clark Finefrock & Sackett Inc. 7135 Minstrel Way Columbia, MD 21045
Engineering, Surveying, Computer, and Field Inspection work related to land development projects in Maryland.
Testimonv Before the Pennsvlvania Public Utility Commission
1. National Utilities Inc. (Water) R-00953416 April 1996 2. Consumer Pennsylvania Water
Company - Roaring Creek Division R-00973869 May 1997 3. Philadelphia Suburban Water Company R-00973952 August 1997 4. Bell Atlantic - Pennsylvania Inc. P-00971307 March 1998 5. City of Bethlehem- Bureau of Water R-00984375 September 1998 6. Pennsylvania Telephone Association -
Chapter 30 Plan P-00981425 December 1998 7. GTE North Inc. Telephone
Chapter 30 Plan P-00981449 February 1999 8. Pennsylvania American Water Co. R-00994638 August 1999 9. Philadelphia Suburban Water Co. R-00994868 February 2000 10. PG Energy (Gas) R-00005119 June 2000 11. Pennsylvania American Water -
Coatesville Acquisition A-2I2285-F07201 July 2000 12. T. W Phillips Gas and Oil Company R-00005459 October 2000 13. Verizon North - Chapter 30 Plan P-00001854 January 2001 14. Philadelphia Gas Works R-00006042 April 2001 15. PFG Gas Inc. & Penn Fuels Gas Co. R-00013679 July 2001 16. Pennsylvania American Water Co. R-00016339 August 2001 17. Philadelphia Suburban Water Co. R-00016750 February 2002 18. Philadelphia Gas Works R-00017034 May 2002 19. PFG Gas Inc. & Penn Fuels Gas Co R-00027389 July 2002 20. Verizon - Pennsylvania, Inc. P-00021973 September 2002 21. Verizon - Pennsylvania, Inc. P-00937105-F0002 January 2003 22. Pennsylvania American Water Co. R-00027982 April 2003 23. Dominion Peoples 1307(f) R-00038170 May 2003 24. Verizon PA / Verizon North C-20027195 July 2003 25. National Fuel Gas Distribution, Inc. R-00038168 July 2003 26. Aqua Pennsylvania Inc. R-00038805 February 2004 27. Dominion Peoples 1307 (f) R-00049153 May 2004 28. PPL Electric Utilities R-00049255 June 2004 29. National Fuel Gas Distribution, Inc. R-00049656 December 2004 30. City of Lancaster - Sewer R-00049862 March 2005 31. Dominion Peoples 1307(f) R-00050267 May 2005 32. Verizon PA / Verizon North C-20027195 June 2005 33. PPL Gas Utilites Inc. 1307(f) R-00050540 July 2005 34. United Telephone A-313200-F0007 February 2006 35. Aqua Pa R-00051030 February 2006 36. T.W. Phillips 1307(0 R-00051134 March 2006 37. City of Dubois R-00050671 May 2006 38. T.W. Phillips R-00051178 May 2006