oscillation. chafik, l. (2012) , 64: 18423 access to the
TRANSCRIPT

http://www.diva-portal.org
This is the published version of a paper published in Tellus. Series A, Dynamic meteorology andoceanography.
Citation for the original published paper (version of record):
Chafik, L. (2012)
The Response of the Circulation in the Faroe-Shetland Channel to the North Atlantic
Oscillation.
Tellus. Series A, Dynamic meteorology and oceanography, 64: 18423
http://dx.doi.org/10.3402/tellusa.v64i0.18423
Access to the published version may require subscription.
N.B. When citing this work, cite the original published paper.
Permanent link to this version:http://urn.kb.se/resolve?urn=urn:nbn:se:su:diva-82082

The response of the circulation in the Faroe-Shetland
Channel to the North Atlantic Oscillation
By LEON CHAFIK*, Department of Meteorology/Physical Oceanography, Stockholm University,
SE-10691, Stockholm, Sweden
(Manuscript received 26 March 2012; in final form 27 September 2012)
ABSTRACT
This study, based on satellite-derived sea-surface heights and temperatures as well as hydrographic data,
attempts to shed some light on the role of the extreme phases of the North Atlantic Oscillation (NAO) for the
local dynamics of the Faroe-Shetland Channel (FSC). During the low-NAO event 2009�10 the Shetland-slope
current showed a significant deflection from its usual path above the maximal gradient of the bathymetry,
ultimately resulting in an anticyclone. This led to an accumulation of North Atlantic Water (NAW) over the
deeper parts of the channel, manifested as a pronounced deepening of the halocline. Leading this deflection of
the slope current by around 2 weeks, a cyclonic eddy associated with a doming of the halocline and originating
from north of the Faroes (and hence constituted by Modified North Atlantic Waters) had moved southwards
in the channel, coming to rest at its southern entrance. Assessing the influence of the NAO on these regional
dynamics using 1992�2010 altimetric data, it was found that for positive phases of the NAO, the surface
circulation tended to be strongly bathymetrically constrained and thus resembles the mean regional circulation.
The negative phases of the NAO are associated with a regional weakening of the wind-stress curl, which leads
to a contraction of the Norwegian-Sea gyre and a linked northward migration of the FSC recirculation
involving a deflected path of the Shetland-slope current. This change in the circulation under negative NAO
conditions may have an impact on the regional ocean climate through the accumulation of saline NAW in the
channel.
Keywords: satellite altimetry, slope current, North Atlantic Oscillation, mesoscale dynamics, Norwegian-Sea
gyre, topographic control
1. Introduction
The Faroe-Shetland Channel (FSC), shown in Fig. 1, is
delimited to the east by the Shetland shelf and to the west
by the Faroe plateau. It is an important choke-point for the
global thermohaline circulation since this is a region of
significant inflow of warm Atlantic surface waters to the
Norwegian Sea and towards the Arctic as well as of the
return outflow of cold deep waters. The FSC is one of
the best surveyed areas in the world, regular hydrographic
work here having commenced as far back as the 1880s.
Helland-Hansen and Nansen (1909) noted that this passage
is an area of intense dynamic activity, a feature that later
has been confirmed by, for example, Tait (1957) and
Poulain et al. (1996). This is ultimately due to the
North Atlantic current and its two-branch extension in
the Faroe region. One of these branches, composed of
North Atlantic Water (NAW; T�9.5 8C, S�35.3 psu),
crosses the Wyville-Thomson ridge (WTR) and continues
along the eastern slope of the FSC. The other enters the
Norwegian Sea via the Iceland-Faroe gap and partially
merges with the Norwegian-Sea gyre and hence moves
eastwards before discharging Modified North Atlantic
Waters (MNAW; 7BTB9 8C, 35.1BSB35.3 psu) south-
wards along the Faroe Plateau. These waters recirculate in
the FSC and join the Shetland-slope current.
Most recently, the internal dynamics of the FSC recircu-
lation have been investigated by Sherwin and co-workers
in two important papers primarily focused on mesoscale
eddies within the passage (Sherwin et al., 1999, 2006). A key
point in the first of these studies was the identification of an
eddy-induced 70 km deflection offshore of the Shetland-
slope current. In the subsequent paper, this mesoscale
variability was explained in terms of baroclinic instability,
although it should be noted that this mechanism cannot
explain the specific locations of the highly energetic eddies.*Correspondence
email: [email protected]
Tellus A 2012. # 2012 Leon Chafik. This is an Open Access article distributed under the terms of the Creative Commons Attribution-Noncommercial 3.0
Unported License (http://creativecommons.org/licenses/by-nc/3.0/), permitting all non-commercial use, distribution, and reproduction in any medium, provided
the original work is properly cited.
1
Citation: Tellus A 2012, 64, 18423, http://dx.doi.org/10.3402/tellusa.v64i0.18423
P U B L I S H E D B Y T H E I N T E R N A T I O N A L M E T E O R O L O G I C A L I N S T I T U T E I N S T O C K H O L M
SERIES ADYNAMICMETEOROLOGYAND OCEANOGRAPHY
(page number not for citation purpose)

Otto and Van Aken (1996) noted that a drifter that had
crossed the Iceland-Faeroe Ridge and moved eastwards
north of the Faroes hereafter was trapped for 2 months
by a cyclonic eddy in the northern deep part of the FSC.
In a model study of the FSC, Oey (1998) confirmed the
energetics of the eddies in the passage and that these induced
the Shetland-slope current to assume a wave-like structure,
a feature that was attributed to ageostrophic dynamics,
consonant with previous results of Spall (1997).
A deeper understanding of the internal dynamics of the
FSC requires an analysis of its response to atmospheric
forcing. In this context, it is, as will be recognised, useful to
let the perspective encompass the entire North Atlantic.
Westerly winds are of particular interest, their strength
frequently measured in terms of the meridional sea-level
pressure difference between the Icelandic low and the
Azores high, an approach pioneered by Walker (1924).
This pressure dipole is regarded as one of the large-scale
modes of climate variability and is, in one or another of the
forms whereby it can be quantified as an index, commonly
referred to as the North Atlantic Oscillation (NAO). When
it is in its positive or negative phase, westerly winds over
the North Atlantic are stronger or weaker, respectively,
than normally is the case. This evidently affects the
dynamics of the FSC, not least via the European con-
tinental-shelf slope current extending from well south of
Ireland into the Norwegian Sea towards the Arctic
(Skagseth, 2004).
Consequently, the present study will deal with the
following question: How do the local dynamics in the
FSC respond to the atmospheric forcing as mirrored by
the NAO? This has, to the best of our knowledge, not yet
been investigated, but, as to be demonstrated here, taking
into account this putative linkage may cast new light on the
physical regime characterising the passage. Since it was
found that the most striking changes from the well-known
mean circulation in the Faroe region (see Fig. 1) take place
during periods of negative NAO indices, the study is
initiated by examining the autumn�winter event in 2009�10 (DJF) which occurred for a record-low NAO index
of �5.1 (see e.g. http://www.cgd.ucar.edu/cas/jhurrell/
indices.html). The study is commenced by examining
observational data and hereafter takes a broader approach
in order to assess the influence of the two different NAO
regimes on conditions in the FSC. The present investigation
could serve as a guideline for the FSC dynamic activity to
be expected during extreme NAO periods, which should be
seen in the light of previous NAO-related investigations
primarily limited to how the magnitude of the Atlantic-
water inflow in the FSC is affected by the NAO (see Nilsen
et al., 2003).
2. Data and methodology
The global satellite-altimetric sea-surface height (SSH) data
in weekly form utilised in this study are merged from a
Norw
ay
Iceland
Faroes
Shetland
NF
Norwegian Sea gyre
NAW
M NAW
WTR
70˚N
68˚N
66˚N
64˚N
62˚N
60˚N
58˚N24˚W 18˚W 12˚W 6˚W 0˚ 6˚W
Fig. 1. Map of the Faroe-Shetland Channel (FSC) region including bathymetry and a schematic representation of the large-scale surface
currents. South of the Norwegian-Sea gyre, the inflow from the Atlantic is seen to have two main branches: one, constituted by Modified
North Atlantic Waters (MNAW), which crosses the Iceland-Faroe Ridge west of the Faroes, and an eastern branch traversing the Wyville-
Thomson Ridge (WTR) which transports North Atlantic Waters (NAW). Green squares show the hydrographic stations of the Nolsoy-
Flugga (NF) section; temperature�salinity diagrams are based on the station in magenta. The black line in the middle of the channel is used
for time-latitude diagram analysis.
2 LEON CHAFIK
number of satellite missions (Ducet et al., 2000), a method
that significantly improves the estimates of mesoscale
signals (Pascual et al., 2006). This 1/38 Mercator-projected
gridded data set, denoted SSALTO/DUACS (multimission
ground Segment for ALTimetry, Orbitography and pre-
cise localisation/Developing Use of Altimetry for Climate
Studies), was obtained courtesy of the French archive
AVISO (Archiving, Validation and Interpretation of
Satellite Oceanographic Data, http://www.aviso.oceanobs.
com). Geophysical corrections pertaining to tidal, inverse
barometric and dry/wet tropospheric effects have been
applied to the data set. The period under investigation
stretches from 14 October 1992 to 29 December 2010.
Gridded (1/38�1/38) maps of the absolute dynamic
topography (ADT), determined as the sum of the of sea-
level anomalies (SLA) and the mean dynamic topography,
viz the SSHs with respect to the marine geoid (Rio and
Hernandez, 2004), are used to determine geostrophic
velocities based on finite-difference approximations:
ug ¼ �g
f
@ADT
@y; (1)
vg ¼g
f
@ADT
@x: (2)
Here ug and vg are the zonal and meridional absolute
geostrophic velocities, g the gravitational acceleration and f
the Coriolis parameter. Additionally, geostrophic velocity
anomalies calculated from the SLAs are used to determine
the eddy kinetic energy (EKE):
EKE ¼ 1
2ðu02g þ v02g Þ; (3)
where
u0g ¼ �g
f
@SLA
@y; (4)
v0g ¼g
f
@SLA
@x: (5)
To investigate the response of conditions in the FSC to the
NAO, composites of the ADT-, EKE-, and flow fields have
been assembled for situations with extremely positive (]3)
and negative (5�3) NAO indices (henceforth referred to
as high/low NAO). Based on weekly averages of daily
NAO indices (Li and Wang, 2003), 33 and 32 altimetric-
data weeks from the years 1992�2010 were found to fall
within these extreme categories. Note that this NAO index
encompasses the entire North Atlantic sector, 808W to
308E and between 358N and 658N, and hence does justice
to the large-scale features of the NAO.
The hydrographic data to be analysed originate from the
Nolsoy-Flugga section extending from the Shetland shelf to
the Faroe plateau (green squares in Fig. 1). This transect is
jointly monitored by the Scottish Fisheries Services and the
Faroese Marine Laboratory. The salinity distributions
across the entire section on two different occasions are
shown. Temperature�salinity (T�S) diagrams are calcu-
lated from a single, centrally located station, see the
magenta square in Fig. 1. The conductivity-temperature-
depth (CTD) data, obtained by courtesy of Barbara Berx at
the Fisheries Research Services, have been manually de-
spiked and subsequently low-pass filtered before being
averaged into 1m depth bins. The altimetric and hydro-
graphic data are complemented by satellite-derived com-
posites of NEODAAS sea-surface temperatures (SSTs)
from the last months of 2009.
3. Observational results
In this section, results based on altimetric observations and
hydrographic surveys of the 2009�10 winter event are
presented as well as some illustrations of the NAO-
dependence of the physical regime characterising the
channel.
3.1. The spatial and temporal evolution of the
2009�10 event
Figure 2 shows the evolution of the SSH and the associated
geostrophic velocities in the FSC region during autumn
and winter of 2009�10. North of the Faroes, the interior of
the Norwegian Sea is characterised by the large-scale
depressed ADT, whereas to the south polewards-moving
warm Atlantic water is constantly present. Their resulting
interaction is one of the dominating features giving rise to
the complex dynamics of the FSC. On 14 October, an
isolated cyclonic eddy moved southwards into the channel
and is visible east of the Faroes. This vortex is characterised
by a depressed sea-surface in contrast to the higher levels
surrounding it. Around 1 month later, 25 November, the
cyclonic eddy moved slightly southwards, while enveloped
by slope water of Atlantic origin that intrudes over the
central parts of the passage. On 30 December, the slope
current is seen to have made an excursion over the deeper
parts of the FSC. Subsequently, an anticyclonic eddy is
formed, and distinct ADT gradients between the counter-
rotating eddies dominate the interior of the channel. This
dipole structure persists until 17 February, see Fig. 2d
which shows that the cyclonic vortex has deepened and
become more elongated in the along-channel direction,
a shape that appears to have adapted to the channel
morphology. This cyclonic eddy is located over a topo-
graphic rise (note the break of the 1000m isobaths),
a feature which appears to be essential for the stabilisation
of the eddy. The ADT levels of the anticylonic eddy have
ON FSC RESPONSE TO THE NAO 3

now decreased, indicating its diminishing strength asso-
ciated with the damping stage, but it should be noted that
its high ADT level is still visible. These counteracting
eddies undergo different stages, in the case under con-
sideration here having a life cycle of around 5 months, but
once having reached a pronounced dipole pattern, their
existence is prolonged.
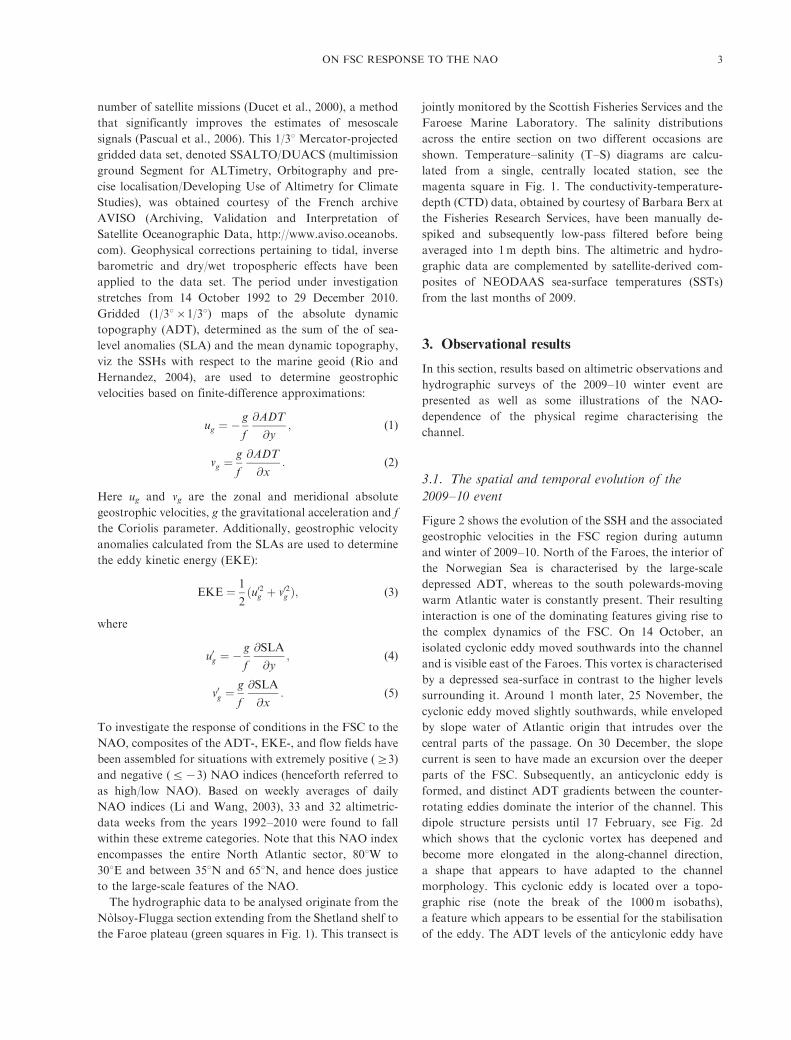
From Fig. 3 it is recognised that the largest geostrophic
velocities are found along the edge of the deflected slope
current. During the early phase of the deflection, the
overall speeds are low compared to those during the later
stages. On 25 November, a significant increase of the
velocities is clearly seen, and the greatest speeds (around
40 cm s�1) are found on the eastern side of the southern
entrance to the FSC. It appears likely that these high speeds
are caused by the cyclonic-eddy ADT gradients reinforced
by the confluence of the isobaths, which appears to locally
enhance the inflow of Atlantic water into the FSC, see
Skagseth et al. (2004). It should be noted that even though
the path of the slope current is deformed in the channel,
a continuation to the Norwegian Sea is discernible.
This large-scale feature is interrupted when the counter-
acting eddies have organised themselves during December
and the current instead follows a highly convoluted track
within the channel. Even though the overall evolution
seems to comprise different stages, some common traits can
be distinguished. Thus the November and December
situations show the Faroe and Shetland-slope currents as
not interacting, whereas during October and February they
are linked to one another, viz. a return to the classical
picture of the FSC recirculation given in Fig. 1.
The time-latitude (Hovmøller) diagram in Fig. 4 shows
the along-channel gradient of the ADT from the beginning
of September 2009 until the end of March 2010. The section
used to construct this graph runs down the middle of
the passage; hence, the diagram does not show the initial
stages of the cyclonic vortex on the Faroe slope. From the
Hovmøller diagram, it can, however, be inferred that a
negative ADT gradient has moved south-westwards down
the passage. In particular, two features are worthy of
highlighting: First, it is clearly visible that the occurrence of
the minima and maxima of the eddy-associated ADT
65˚N
64˚N
63˚N
62˚N
61˚N
60˚N
10˚W 8˚W 6˚W 4˚W 2˚W 0˚
20091014(a)
(c) (d)
(b)
−30
−25
−20
−15
−10
−5
0
65˚N
64˚N
63˚N
62˚N
61˚N
60˚N
10˚W 8˚W 6˚W 4˚W 2˚W 0˚
20091125
−30
−25
−20
−15
−10
−5
0
65˚N
64˚N
63˚N
62˚N
61˚N
60˚N
10˚W 8˚W 6˚W 4˚W 2˚W 0˚
20091230
−30
−25
−20
−15
−10
−5
0
−30
−25
−20
−15
−10
−5
0
65˚N
64˚N
63˚N
62˚N
61˚N
60˚N
10˚W 8˚W 6˚W 4˚W 2˚W 0˚
20100217
Fig. 2. Suite of absolute dynamic topographies (cm) and associated geostrophic-velocity vectors from November 2009 to February 2010.
Black lines represent isobaths with 500m spacing down to 1500m. The diagram illustrates the sequence of events associated with the
deflection of the Shetland-slope current.
4 LEON CHAFIK
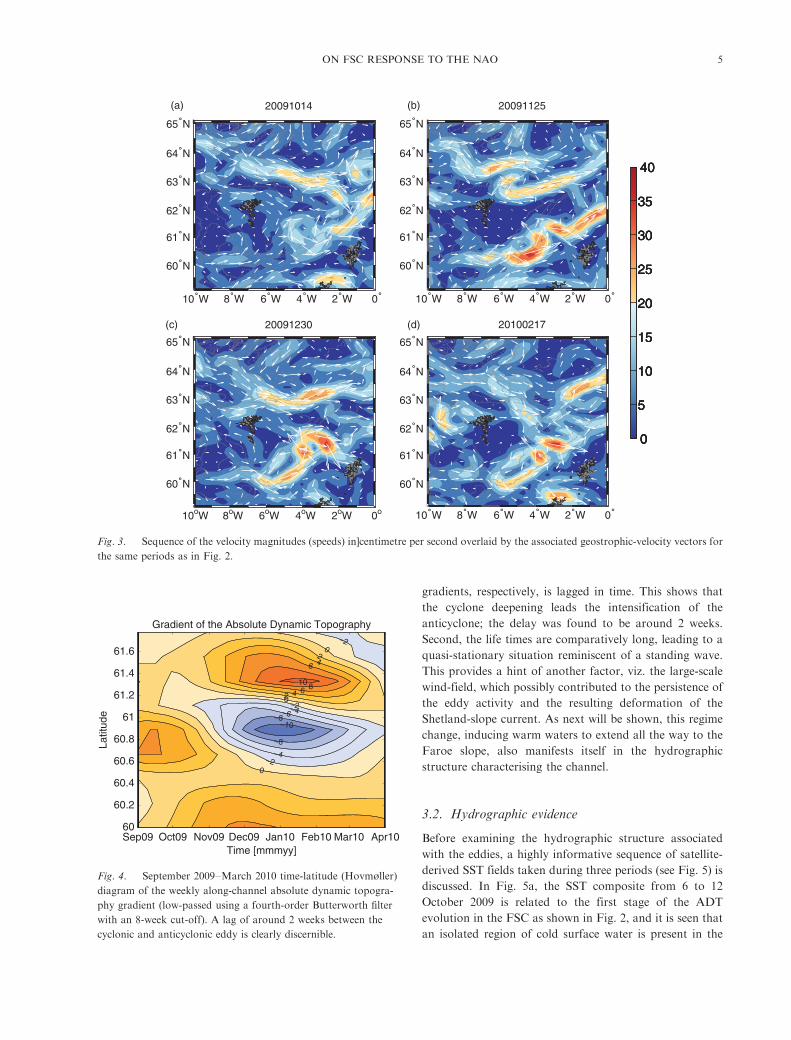
gradients, respectively, is lagged in time. This shows that
the cyclone deepening leads the intensification of the
anticyclone; the delay was found to be around 2 weeks.
Second, the life times are comparatively long, leading to a
quasi-stationary situation reminiscent of a standing wave.
This provides a hint of another factor, viz. the large-scale
wind-field, which possibly contributed to the persistence of
the eddy activity and the resulting deformation of the
Shetland-slope current. As next will be shown, this regime
change, inducing warm waters to extend all the way to the
Faroe slope, also manifests itself in the hydrographic
structure characterising the channel.
3.2. Hydrographic evidence
Before examining the hydrographic structure associated
with the eddies, a highly informative sequence of satellite-
derived SST fields taken during three periods (see Fig. 5) is
discussed. In Fig. 5a, the SST composite from 6 to 12
October 2009 is related to the first stage of the ADT
evolution in the FSC as shown in Fig. 2, and it is seen that
an isolated region of cold surface water is present in the
0
5
10
15
20
25
30
35
40
0
5
10
15
20
25
30
35
40
0
5
10
15
20
25
30
35
40
0
5
10
15
20
25
30
35
40
20091230
10oW 8oW 6oW 4oW 2oW 0o
65˚N
64˚N
63˚N
62˚N
61˚N
60˚N
20091014
65˚N
64˚N
63˚N
62˚N
61˚N
60˚N
10˚W 8˚W 6˚W 4˚W 2˚W 0˚
20091125
65˚N
64˚N
63˚N
62˚N
61˚N
60˚N
10˚W 8˚W 6˚W 4˚W 2˚W 0˚
20100217
65˚N
64˚N
63˚N
62˚N
61˚N
60˚N
10˚W 8˚W 6˚W 4˚W 2˚W 0˚
(a)
(c) (d)
(b)
Fig. 3. Sequence of the velocity magnitudes (speeds) in]centimetre per second overlaid by the associated geostrophic-velocity vectors for
the same periods as in Fig. 2.
Time [mmmyy]
Latit
ude
Gradient of the Absolute Dynamic Topography
10
−10
86420−2−4−6−8
−8−4
−20
6 42
0−2
Sep09 Oct09 Nov09 Dec09 Jan10 Feb10 Mar10 Apr1060
60.2
60.4
60.6
60.8
61
61.2
61.4
61.6
Fig. 4. September 2009�March 2010 time-latitude (Hovmøller)
diagram of the weekly along-channel absolute dynamic topogra-
phy gradient (low-passed using a fourth-order Butterworth filter
with an 8-week cut-off). A lag of around 2 weeks between the
cyclonic and anticyclonic eddy is clearly discernible.
ON FSC RESPONSE TO THE NAO 5

passage. Since water of this type is also found North and
Northwest of the Faroes (Hansen and Østerhus, 2000),
this similarity indicates that the cyclonic eddy has been cut
off from the main body of Norwegian-Sea water and has
moved southwards in the FSC, that is, the cold-core vortex
was not generated locally. In Fig. 5b, the composite from
19 to 25 November (second stage) shows a major deforma-
tion of the Shetland-slope current. Consonant with the
ADT results reported in Fig. 2, it also seen how the warm
filaments of the slope current gradually envelop the
cyclonic vortex in a counter-clockwise direction, and in
Fig. 5c a fully developed SST dipole pattern is in clear
evidence.
This eddy activity exerts a pronounced influence on the
hydrography in the FSC, as evidenced by substantial
changes in its vertical structure. In Fig. 6a, a pronounced
doming of the isohalines is seen to characterise the Faroe
slope, with low salinities extending upwards and affecting
the entire water column. Note that this doming is
associated with the initial stage of the cyclonic vortex
seen in Fig. 2a. This linkage is even more visible from the
minimum of the cross-channel SLA distribution, which is
S
F
(a) (b) (c)
F
S S
F
Fig. 5. Composites of satellite-derived sea surface temperatures around the Faroe-Shetland Channel (F�Faroes; S�Shetland) from 6
to 12 October, 19 to 25 November, and 3 to 9 December 2009 showing the evolution of the cold-core eddy and the deflection of the warm
Shetland-slope current. (Courtesy of NEODAAS.)
0
10
20
30
SLA
[cm
]
20091012
0
10
20
30
SLA
[cm
]
20091208
−6 −5 −4 −3 −2 −1
900
800
700
600
500
400
300
200
100
Longitude
Dep
th [m
]
−6 −5 −4 −3 −2 −1
900
800
700
600
500
400
300
200
100
Longitude
Dep
th [m
]
Salinity
34.8
34.9
35
35.1
35.2
35.3
35.4
(a) (b)
Fig. 6. Salinity distribution across the Nolsoy-Flugga section on 12 October and 8 December 2009. These surveys are chosen to show the
effects of cyclonic and anticyclonic surface-water motion, respectively. The blue 35 psu contours highlight the shoaling and deepening of the
halocline. Black 35.4 psu contours delimit the warm cores of the northward-directed slope current. The cross-channel SLA distributions
from the same days as the hydrography are also included on top of the diagrams.
6 LEON CHAFIK

seen to be located squarely above the dome. These
altimetric results are also included in Fig. 6 and were
obtained on the same days as the hydrography. Fig. 6b
analogously demonstrates the impact of the surface anti-
cyclone (note the location of the SLA maximum), and how
it effectively deepens the halocline. The blue 35 psu con-
tours superimposed on these two hydrographic sections
serve as an indication of major shoaling/deepening of the
halocline, in this case comprising a few hundred meters
during a period of 2 months. The black 35.4 psu contours
are intended to highlight the inflow core of the NAW,
where a pronounced difference between the two situations
is evident. In Fig. 6a, the area of the maximum salinity is
generally smaller and shallower than in Fig. 6b, where
several maxima can be identified. Moreover, it should
be noted that this hydrographic structure associated with
the anticyclonic eddy is characterised by an accumulation
of NAW, which has spread all over the section. This
feature signifies a deviation of the slope current from
its natural path above the maximal gradient of the
bathymetry and its strong impact over the deeper parts of
the channel.
Figure 7 shows T�S relationships pertaining to the two
different situations exemplified in Fig. 6. That in blue
shows a profile associated with the cyclonic eddy and hence
the doming; it is evident that the eddy originates from
north of the Faroes since it is constituted by MNAW. The
T�S results in red from December show a signature clearly
dominated by NAW. The separation between the two T�Sprofiles is related to the shoaling and deepening of the
halocline.
3.3. Influence of the NAO
The quasi-persistent eddy-related structure illustrated by
Fig. 2 coincided with the period in 2009�10 of an extremely
low NAO regime, which is suggested as a possible driving
agent for the long-lasting eddy behaviour. This presumed
linkage has been investigated by generating composites of
the ADT and its associated geostrophic velocities for high
and low NAO weeks (Fig. 8).
During a high phase of the NAO, the area of depressed
SSH dominating the interior of the Norwegian Sea (which
can be perceived as a large-scale gyre, see Fig. 1) expands
and reaches the southern parts of the FSC. Furthermore,
the Ekman transports associated with more active south-
westerly winds lead to an increased level of the sea surface
over the Shetland shelf, thus further strengthening the SSH
gradient across the FSC. This reinforces the tendency
of the Shetland-slope current (with its associated NAW
properties) to adhere to its natural route along the
bathymetric contours. Consequently, the conditions in
the FSC during high NAO phases resemble the mean
circulation presented in Fig. 1.
However, periods of low NAO causes the Norwegian-
Sea gyre to contract, cf. Fig. 8. This not only leads to a
northward migration of the FSC recirculation but also
results in a sharpened front north of the Faroes, which in
turn could create instabilities that potentially pinch off
and advect southwards along the eastern Faroe slope with
the mean flow. During this phase of the NAO, the large-
scale atmospheric conditions over the region are further-
more dominated by northerly winds; hence, the Ekman
transports under these circumstances tend to weaken the
cross-channel SSH gradient. In conjunction with the
abovementioned northward retreat of the FSC recircula-
tion, this coincides with the observed deflection of the
Shetland-slope current, which ultimately leads to the over-
all situation seen in Figs. 2 and 5.
In order to provide further support for the considera-
tions above, the altimetric data have also been used to
construct ensembles of weekly observed �30 and �10 cm
SSH isolines originating from the Norwegian Sea and the
North Atlantic, respectively. (These isolines are intimately
related to the geostrophic streamlines.) This has been done
for the previously specified conditions of high and low
NAO, see Fig. 9. The general picture that emerges is that
27.127.6
28
.10
Tem
oera
ture
(˚C
)
–1
0
34.8 34.9 35 35.1 35.2 35.3 35.4 35.5
1
2
3
4
5
6
7
8
9NAWMNAW
NSDW
Fig. 7. Temperature�salinity profiles from a centrally located
station on the Nolsoy-Flugga section (magenta in Fig. 1) from
the same surveys as represented in Fig. 6. The blue profile (12
October) shows the presence of low-saline Modified North
Atlantic water (MNAW) related to the cyclonic circulation; the
red profile (8 December) comprises North Atlantic water (NAW)
of higher salinity due to the deflection of the Shetland-slope
current and the resulting anticyclonic circulation. The cold
Norwegian-Sea deep water (NSDW) is also shown.
ON FSC RESPONSE TO THE NAO 7

during periods of high NAO, both ensembles are relatively
coherent. The isolines show a tendency to be bathymetri-
cally constrained, viz. those originating in the Norwegian
Sea adhere to the Faroe slope, cross the FSC and hereafter
are orientated north-eastwards along the Shetland
slope, where also the isolines of Atlantic origin are con-
centrated. These well-organised clusters indicate that the
flow during periods of high NAO is topographically steered
in the Faroe region. During periods of low NAO, however,
the SSH isolines originating from the Norwegian Sea have
shifted northwards and no longer form a distinct part
of a FSC recirculation extending to the southern reaches
of the passage. Instead, closed contours of the �30 cm
isolines are seen to dominate the interior of the passage
under low-NAO conditions. Concurrently, the geostrophic
contours originating in the Atlantic generally deviate
from the topographically constrained location of the Shet-
land-slope current as recognised from their disordered
pattern.
In direct analogy with the mode of presentation utilised
for Fig. 8, the composite EKE fields during the two phases
of the NAO have also been calculated, see Fig. 10.
A significant difference between the two sets of results is
that for a high NAO, the overall magnitude of the EKE is
in general smaller than that during low-NAO conditions
(149 vs. 199 cm2 s�2). In the former case, local EKE
maxima are found at the southern entrance of the FSC and
on the eastern side of its northern exit, possibly due to the
large bathymetric gradients in these areas. In the low-NAO
case, the direct effect of the bathymetry appears less evident
as the highest EKE values occur above the deeper parts of
the channel.
4. Discussion
As shown in Fig. 2, a quasi-persistent, coherent eddy
structure was detected in the FSC on the basis of satellite-
altimetric observations. Although bearing a superficial
resemblance to features previously observed in the passage
by Sherwin et al. (2006), it differs from the meandering
mesoscale (�65 km) eddies analysed by these authors.
These short-lived structures (with growth times of days)
were ascribed to baroclinic instability and furthermore
linked to the ‘backward breaking wave’ phenomenon as
investigated by Griffiths and Linden (1981) � these two
researchers simulated an unstable boundary current by
continuously releasing a buoyant fluid into an anticycloni-
cally rotating tank. Closed cyclonic eddies developed
behind the clockwise meandering boundary current; hence,
a suite of asymmetric dipoles arose. Figures 2 and 5 show,
however, that the evolution of the slope-current meander
examined here differs from the scenario given by Sherwin
et al. (2006) in that the deflection is not initiated by
instabilities of the buoyant Shetland-slope current. Instead,
it is preceded by the propagation southwards along the
Faroe-slope of a cold-core eddy of Norwegian-Sea origin.
Once this has reached the southern part of the passage,
a deflection of the slope current takes place, ultimately
resulting in the flow pattern most clearly visible in Figs. 2c
and 5c, respectively. The Hovmøller diagram (Fig. 4) based
on the along-channel gradient of the SSH demonstrates a
2-week lag between the arrival of the cold-core eddy and
the deflection of the slope current. It is consequently
suggested that well-organised leakage of MNAW into the
FSC in the form of a cold-core eddy may play a role for the
onset of the slope-current deflection. It should, however, be
High NAO
−30
−25
−20
−15
−10
−5
0
−30
−25
−20
−15
−10
−5
0
Low NAO
65˚N
64˚N
63˚N
62˚N
61˚N
60˚N
65˚N
64˚N
63˚N
62˚N
61˚N
60˚N
10˚W 8˚W 6˚W 4˚W 2˚W 0˚ 10˚W 8˚W 6˚W 4˚W 2˚W 0˚
(b)(a)
Fig. 8. Composites of observed ADT distributions and their associated velocity vectors for extremely high (]3) and low (5�3) NAO-
index weeks. During conditions of high NAO the sea-surface height (SSH) field is depressed and the associated flow pattern resembles the
‘standard’ circulation illustrated in Fig. 1. For low NAO, the depressed SSH has retreated northwards and a prominent bulge intrudes over
the deeper parts of the Faroe-Shetland Channel.
8 LEON CHAFIK

emphasised that this progression of events does not provide
a ready answer to the intriguing question of what causes
the comparative longevity of the flow pattern seen in Fig. 2.
A rigorous investigation of this matter is beyond the scope
of the present study, but, as outlined below, the pace of the
evolution of the NAO index with its attendant conse-
quences for the Norwegian-Sea gyre may underlie the
persistence of the observed eddy structure. A large-scale
mechanism of this type could be further reinforced by the
local small-scale processes leading to the ultimate break-
down of the slope-current deflection acting in so slow
manner that the life-time of the eddy system is prolonged.
The behaviour of the SSH isolines for high- and low-
NAO conditions shown in Fig. 9 clearly underlines the
importance of the large-scale wind-field for the degree of
topographic control exerted on the flow in the Faroe
region. For a high NAO, the isolines originating from the
Norwegian Sea extend far southwards in the FSC before
recirculating and joining those of Atlantic origin. This
stronger topographical steering in phases of high NAO is
consistent with the anticipated increase of the wind-driven
barotropic flow along the closed f/H contours (H being the
depth) in the Nordic Seas (Isachsen et al., 2003; Nøst and
Isachsen, 2003).
(a) High NAO (−30 cm)
10°W 8°W 6°W 4°W 2°W 0°
10°W 8°W 6°W 4°W 2°W 0° 10°W 8°W 6°W 4°W 2°W 0°
10°W 8°W 6°W 4°W 2°W 0°
64°N
62°N
60°N
64°N
62°N
60°N
64°N
62°N
60°N
64°N
62°N
60°N
(b) Low NAO (−30 cm)
(c) High NAO (−10 cm) (d) Low NAO (−10 cm)
Fig. 9. Absolute dynamic topography isolines originating from the Nordic Seas (�30 cm) and from the North Atlantic (�10 cm) for the
same high- and low-NAO-index weeks used when constructing the composites shown in Fig. 8. Black lines with a spacing of 500m pertain
to the bathymetry. The diagrams are aimed at clarifying the degree of topographic control exerted on the flow during high and low phases
of the NAO.
ON FSC RESPONSE TO THE NAO 9

For a low NAO, however, it is seen how the �30 cm
isolines from the Norwegian Sea shift northwards and link
more-or-less directly with the Norwegian slope current
instead of partaking in the FSC recirculation. Most likely,
this behaviour is due to the weakened wind-stress curl
inducing a contraction of the Norwegian-Sea gyre with
attendant consequences for the geostrophic streamlines. An
analogous low-NAO relaxation of the bathymetrical
constraints on the flow manifests itself in the behaviour of
the geostrophic streamlines originating from the Atlantic
proper, which in Fig. 9d are seen to pursue deformed
paths through the FSC consonant with the observed bulge
of the slope current. This irregular behaviour led to the
increased level of eddy activity in the passage visible in
Fig. 10b.
The disruption of the slope current visible in the cluster
of isolines originating from the North Atlantic (Fig. 9d)
occurred during extreme negative states of the NAO. This
raises the question of to which extent the large-scale low-
NAO conditions in the Eastern North Atlantic contribute
to the anomalous flow and hydrographic patterns in the
FSC. Hakkinen et al. (2011) most recently pointed out
that a negative NAO phase with its associated decrease of
the wind-stress curl leads to weakening of the subpolar
gyre, which in turn permits more saline subtropical
waters to penetrate northwards. Sarafanov (2009) had
previously presented the schematic picture that when the
NAO is in its positive/negative mode, the subpolar gyre
tends to expand/contract, in turn leading to a retreat/
advance of the subtropical waters. It thus appears likely
that the physical regime as well as the water-mass
properties in the FSC also is influenced by this variability
of the North-Atlantic wind-driven gyres governed by
the NAO-associated wind shifts. Elucidating the precise
details of the underlying mechanisms is, however, beyond
the scope of the present study.
5. Summary and conclusions
It has been found that the dominant North-Atlantic
atmospheric regime, especially when in its low-NAO
mode, has a large impact on the local dynamics of the
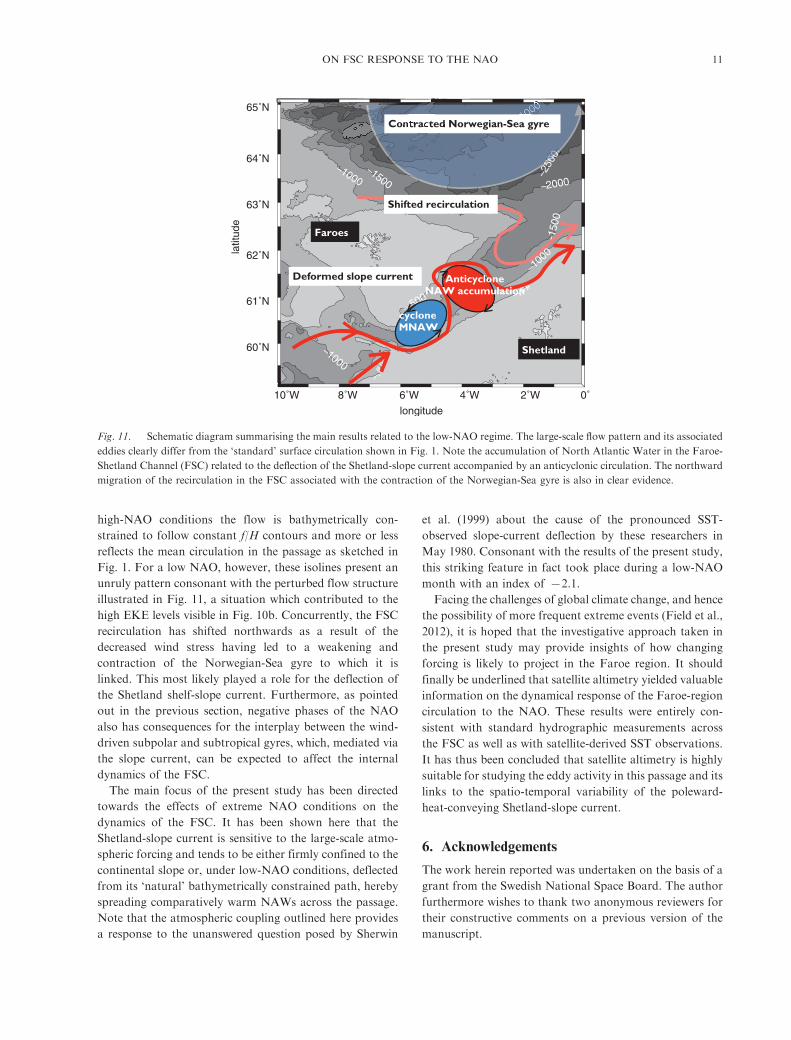
FSC. In Fig. 11, the major effects related to this NAO state
are summarised. An analysis, based on satellite-derived
SSH and SST data, of the spatial and temporal evolution of
conditions in this passage during the autumn and winter
2009�10 (characterised by extreme negative values of
the NAO index) showed a cyclonic eddy propagating
southwards in the passage from north of the Faroes.
This preceded a distortion of the Shetland-slope current,
leading, around 2 weeks later, to the emergence of an
anticyclonic circulation concomitant with a striking in-
crease of the slope-current speeds in the channel. The cross-
passage hydrography was strongly influenced by this eddy
activity, as seen from the pronounced shoaling and
deepening of the halocline associated with the cyclonic
and anticyclonic eddies, respectively, which were also
clearly visible in the cross-channel SLA transects from
the same days as the hydrographic surveys. T�S diagrams
from a centrally located station (Fig. 7) further underlined
that flow-pattern changes of the type represented by
Fig. 11 affect the FSC water-mass characteristics by
transporting and hence accumulating comparatively warm
shelf�slope-current NAW over the deeper parts of the
passage.
The ADT composites (Fig. 8) as well as the immediate
response of the geostrophic streamlines to extreme phases
of the atmospheric forcing (Fig. 9) showed that during
High NAO
0
50
100
150
200
0
50
100
150
200
Low NAO
65˚N
64˚N
63˚N
62˚N
61˚N
60˚N
65˚N
64˚N
63˚N
62˚N
61˚N
60˚N
10˚W 8˚W 6˚W 4˚W 2˚W 0˚ 10˚W 8˚W 6˚W 4˚W 2˚W 0˚
(a) (b)
Fig. 10. Composites of the eddy kinetic energy (EKE) distributions for high (]3) and low (5�3) NAO-index weeks, see Fig. 8. The
overall EKE values in the high-NAO case are smaller than for a low NAO. Furthermore, the locations of the maxima do not correspond,
indicating qualitatively different flow fields.
10 LEON CHAFIK
high-NAO conditions the flow is bathymetrically con-
strained to follow constant f/H contours and more or less
reflects the mean circulation in the passage as sketched in
Fig. 1. For a low NAO, however, these isolines present an
unruly pattern consonant with the perturbed flow structure
illustrated in Fig. 11, a situation which contributed to the
high EKE levels visible in Fig. 10b. Concurrently, the FSC
recirculation has shifted northwards as a result of the
decreased wind stress having led to a weakening and
contraction of the Norwegian-Sea gyre to which it is
linked. This most likely played a role for the deflection of
the Shetland shelf-slope current. Furthermore, as pointed
out in the previous section, negative phases of the NAO
also has consequences for the interplay between the wind-
driven subpolar and subtropical gyres, which, mediated via
the slope current, can be expected to affect the internal
dynamics of the FSC.
The main focus of the present study has been directed
towards the effects of extreme NAO conditions on the
dynamics of the FSC. It has been shown here that the
Shetland-slope current is sensitive to the large-scale atmo-
spheric forcing and tends to be either firmly confined to the
continental slope or, under low-NAO conditions, deflected
from its ‘natural’ bathymetrically constrained path, hereby
spreading comparatively warm NAWs across the passage.
Note that the atmospheric coupling outlined here provides
a response to the unanswered question posed by Sherwin
et al. (1999) about the cause of the pronounced SST-
observed slope-current deflection by these researchers in
May 1980. Consonant with the results of the present study,
this striking feature in fact took place during a low-NAO
month with an index of �2.1.
Facing the challenges of global climate change, and hence
the possibility of more frequent extreme events (Field et al.,
2012), it is hoped that the investigative approach taken in
the present study may provide insights of how changing
forcing is likely to project in the Faroe region. It should
finally be underlined that satellite altimetry yielded valuable
information on the dynamical response of the Faroe-region
circulation to the NAO. These results were entirely con-
sistent with standard hydrographic measurements across
the FSC as well as with satellite-derived SST observations.
It has thus been concluded that satellite altimetry is highly
suitable for studying the eddy activity in this passage and its
links to the spatio-temporal variability of the poleward-
heat-conveying Shetland-slope current.
6. Acknowledgements
The work herein reported was undertaken on the basis of a
grant from the Swedish National Space Board. The author
furthermore wishes to thank two anonymous reviewers for
their constructive comments on a previous version of the
manuscript.
−,##
−100
0
−150
0
−,500
−1000−,
##
−250
0
−2000−1500
−1000
500
500
500
2500500
500
AnticycloneNAW accumulation
Shifted recirculation
Deformed slope current
Contracted Norwegian-Sea gyre
cycloneMNAW
Shetland
Faroes
65˚N
64˚N
63˚N
62˚Nlatit
ude
61˚N
60˚N
10˚W 8˚W 6˚W
longitude
4˚W 2˚W 0˚
Fig. 11. Schematic diagram summarising the main results related to the low-NAO regime. The large-scale flow pattern and its associated
eddies clearly differ from the ‘standard’ surface circulation shown in Fig. 1. Note the accumulation of North Atlantic Water in the Faroe-
Shetland Channel (FSC) related to the deflection of the Shetland-slope current accompanied by an anticyclonic circulation. The northward
migration of the recirculation in the FSC associated with the contraction of the Norwegian-Sea gyre is also in clear evidence.
ON FSC RESPONSE TO THE NAO 11

References
Ducet, N., Le Traon, P. Y. and Reverdin, G. 2000. Global
high-resolution mapping of ocean circulation from the combi-
nation of T/P and ERS-1/2. J. Geophys. Res. 105, 19477�19498.Field, C. B., Barros, T. F., Stocker, T. F., Qin, D., Dokken, D. J.
and co-authors. 2012. Summary for policymakers. In: Managing
the Risks of Extreme Events and Disasters to Advance Climate
Change Adaptation. Cambridge University, Cambridge, UK, pp.
1�19.Griffiths, R. W. and Linden, P. F. 1981. The stability of buoyancy
driven coastal currents. Dyn. Atmos. Oceans. 5, 281�306.Hakkinen, S., Rhines, P. B. and Worthen, D. L. 2011. Warm and
saline events embedded in the meridional circulation of the
northern North Atlantic. J. Geophys. Res. 116, C03006. DOI:
10.1029/2010JC006275.
Hansen, B. and Østerhus, S. 2000. North Atlantic-Nordic Seas
exchanges. Prog. Oceanogr. 45, 109�208.Helland-Hansen, B. and Nansen, F. 1909. The Norwegian Sea,
its physical oceanography based on the Norwegian researches
1900�1904. Rep. Norweg. Fish. Mar. Investig. 2(2), 1�359.Isachsen, P. E., LaCasce, J. H., Mauritzen, C. and Hakkinen, S.
2003. Wind-driven variability of the large-scale recirculating
flow in the Nordic Seas and Arctic Ocean. J. Phys. Oceanogr. 33,
2534�2550.Li, J. and Wang, J. 2003. A new North Atlantic Oscillation index
and its variability. Adv. Atmos. Sci. 20(5), 661�676.Nilsen, J. E. Ø., Gao, Y., Drange, H., Furevik, T. and Bentsen, M.
2003. Simulated North Atlantic-Nordic Seas water mass
exchanges in an isopycnic coordinate OGCM. Geophys. Res.
Lett. 30(10), 1536�1539.Nøst, O. A. and Isachsen, P. E. 2003. The large-scale time-mean
ocean circulation in the Nordic Seas and Arctic Ocean estimated
from simplified dynamics. J. Mar. Res. 61, 175�210.Oey, L.-Y. 1998. Eddy energetics in the Faroe-Shetland
Channel: a model resolution study. Cont. Shelf. Res. 17(15),
1929�1944.Otto, L. and Van Aken, H. M. 1996. Surface circulation in the
northeast Atlantic as observed with drifters. Deep Sea Res. 43,
467�499.
Pascual, A., Faugere, Y., Larnicol, G. and Le Traon, P. Y. 2006.
Improved description of the ocean mesoscale variability by
combining four satellite altimeters. Geophys. Res. Lett. 33,
L02611. DOI: 10.1029/2005GL024633.
Poulain, P. M., Warn-Varnas, A. and Niiler, P. 1996. Near-surface
circulation of the Nordic seas as measured by Lagrangian
drifters. J. Geophys. Res. 101, 18237�18258.Rio, M.-H. and Hernandez, F. 2004. A mean dynamic topography
computed over the world ocean from altimetry, in situ measure-
ments, and a geoid model. J. Geophys. Res. 109, C12032. DOI:
10.1029/2003JC002226.
Sarafanov, A. 2009. On the effect of the North Atlantic Oscillation
on temperature and salinity of the subpolar North Atlantic
intermediate and deep waters. ICES J. Mar. Sci. 66(7),
1448�1454.Sherwin, T. J., Turrell, W. R., Jeans, D. R. G. and Dye, S. 1999.
Eddies and a mesoscale deflection of the slope current
in the Faroe-Shetland Channel. Deep Sea Res. I. 46(3), 415�428.Sherwin, T. J., Williams, M. O., Turrell, W. R., Hughes, S. L. and
Miller, P. I. 2006. A description and analysis of mesoscale
variability in the Froe-Shetland Channel. J. Geophys. Res. 111,
C03003. DOI: 10.1029/2005JC002867.
Skagseth, Ø. 2004. Monthly to annual variability of the Norwegian
Atlantic slope current: connection between the northern
North Atlantic and the Norwegian Sea. Deep Sea Res. 51,
349�366.Skagseth, Ø., Orvik, K. A. and Furevik, T. 2004. Coherent
variability of the Norwegian Atlantic slope current derived
from TOPEX/ERS altimeter data. Geophys. Res. Lett. 31,
L14304. DOI: 10.1029/2004GL020057.
Spall, M. A. 1997. Baroclinic jets in confluent flow. J. Phys.
Oceanogr. 27(6), 1054�1071.Tait, J. B. 1957. Hydrography of the Faroe-Shetland Channel
1927�1952. Scot. Home Depart. Mar. Res. 2, 1�309.Walker, G. T. 1924. Correlation in seasonal variation of weather,
IX. Mem. Indian. Meteor. Dep. 24, 275�332.
12 LEON CHAFIK