oscillatory signatures of crossmodal congruence effects ... 3! 1. introduction ! multimodal...
TRANSCRIPT

1
Oscillatory signatures of crossmodal congruence effects:
An EEG investigation employing a visual-tactile pattern
matching paradigm
Florian Göschla★, Uwe Friesea, Jonathan Daumea, Peter Königa,b, and Andreas K. Engela
a Department of Neurophysiology and Pathophysiology,
University Medical Center Hamburg-Eppendorf,
Martinistr. 52, 20246 Hamburg, Germany
b Institute of Cognitive Science, University of Osnabrück,
Albrechtstr. 28, 49069 Osnabrück
★ Correspondence address: Florian Göschl, Department of Neurophysiology and
Pathophysiology, University Medical Center Hamburg-Eppendorf, Martinistr. 52, 20246
Hamburg, Germany.
E-mail: [email protected]
not peer-reviewed) is the author/funder. All rights reserved. No reuse allowed without permission. The copyright holder for this preprint (which was. http://dx.doi.org/10.1101/014092doi: bioRxiv preprint first posted online Jan. 22, 2015;

2
Abstract
Coherent percepts emerge from the accurate combination of inputs from the different sensory
systems. There is ongoing debate about the neurophysiological implementation of crossmodal
interactions in the brain, and it has been proposed that transient synchronization of neurons
might be of central importance. Specifically, oscillatory activity in lower frequency ranges (<
30 Hz) has been implicated in mediating long-range communication as typically studied in
multisensory research. In the current study, we recorded high-density electroencephalograms
(EEG) while human participants were engaged in a visual-tactile pattern matching paradigm.
Employing the same physical stimulation, separate tasks of the experiment either required the
detection of predefined targets in visual and tactile modalities or the explicit evaluation of
crossmodal stimulus congruence. Analysis of the behavioral data showed benefits for
congruent visual-tactile stimulus combinations. Differences in oscillatory dynamics within the
two tasks related to crossmodal congruence involved effects in the theta- (2-7 Hz), alpha- (8-
13 Hz) and beta-band (13-25 Hz). Contrasting neuronal activity between the two tasks
revealed differences in pre-stimulus alpha- and beta-band power, as well as differences in
post-stimulus theta-band activity. Source reconstruction for these effects showed prominent
involvement of superior temporal, parietal and prefrontal cortices – regions commonly
implicated in multisensory integration. These results add to the increasing evidence that low
frequency oscillations are well suited for studying integration in distributed brain networks, as
demonstrated for crossmodal interactions in visual-tactile pattern matching in the current
study. Additionally, neuronal activity at theta-, alpha- and beta-frequencies might subserve
distinct processes relevant for multisensory integration, such as multisensory gating and
crossmodal perceptual decision making.
Keywords: cortical oscillations, multisensory integration, visual-tactile, pattern matching,
crossmodal congruence
not peer-reviewed) is the author/funder. All rights reserved. No reuse allowed without permission. The copyright holder for this preprint (which was. http://dx.doi.org/10.1101/014092doi: bioRxiv preprint first posted online Jan. 22, 2015;

3
1. Introduction
Multimodal processing and the integration of information from different sensory systems are
crucial for adaptive behavior. Crossmodal interactions have been shown to impact perception
(sometimes also resulting in illusory percepts, McGurk and McDonald, 1976) as well as a
broad range of cognitive processes (Doermann and Naumer, 2005; Driver and Spence, 2000;
Macaluso and Driver, 2005; Stein, 2012). Behavioral benefits resulting from the successful
combination of inputs from different modalities are well documented, including
improvements in target detection, discrimination or localization performance and faster
response latencies (Diederich and Colonius, 2007; Forster et al., 2002; Frassinetti et al., 2002;
Gillmeister and Eimer, 2007; McDonald et al., 2000; Molholm et al., 2004; Murray et al.,
2001).
The question of how interactions between different sensory and other regions of the brain are
implemented neurophysiologically remains a matter of dispute. Yet, it is evident that in order
to quickly adapt to the environment fast changes of functional architecture of the brain
network are essential (Jensen and Mazaheri, 2010). One mechanism that has been proposed to
face the challenge of integration in distributed networks is transient synchronization of
neurons (Singer and Gray, 1995; Engel et al., 2001; Varela et al., 2001; Womelsdorf et al.,
2007). Only recently, synchronized oscillatory activity has also been linked to the integration
of object features across sensory modalities (e.g. Lakatos et al., 2007; Kayser et al., 2008; for
a review see Senkowski et al., 2008). Experimental support for a major role of neuronal
oscillations in multisensory integration involves activity below 30 Hz in the theta-, alpha- and
beta-bands (Doesburg et al., 2009; Gleiss and Kayser, 2014a; Hummel and Gerloff, 2005;
Senkowski et al., 2006) as well as high frequency activity above 30 Hz (the gamma-band, see
for example Bauer et al., 2009; Doesburg et al., 2008; Schneider et al., 2008; Schneider et al.,
2011). Explicitly advocating different roles of high and low frequency activity in the
not peer-reviewed) is the author/funder. All rights reserved. No reuse allowed without permission. The copyright holder for this preprint (which was. http://dx.doi.org/10.1101/014092doi: bioRxiv preprint first posted online Jan. 22, 2015;

4
integration of distributed information, van Ackeren and colleagues (2014) have demonstrated
for lexical-semantic stimulus material that linking modality-specific feature words to a target
word is associated with enhanced gamma-band activity between 80 and 120 Hz, whereas
integration of features from different modalities is mirrored in low-frequency power increases
between 2 and 8 Hz. This matches results by von Stein et al. (2000) reporting synchronization
in the gamma-band for monosynptically connected cortical areas and lower frequency
synchronization for large-scale networks. Thus, Ackeren et al. (2014) position their findings
within a framework proposed by Donner and Siegel (2011), arguing that low-frequency
oscillatory activity is involved in the coordination of distributed neuronal populations, while
local encoding happens within higher frequency ranges.
In order to study the multisensory interplay between vision and touch – a well-suited model
for long-range communication in the brain – we employed a matching paradigm requiring the
identification of concurrently presented visual and tactile dot patterns. In a behavioral study
examining the interdependency of crossmodal stimulus congruence and attention (Göschl et
al., 2014), we found that congruent as compared to incongruent visual-tactile stimulation
reliably led to improved behavioral performance, mirrored in higher accuracies and shortened
reaction times. In the present study, we used a similar paradigm and additionally recorded
high-density electroencephalograms (EEG) to investigate the neurophysiological correlates of
these congruence effects. Following the idea described earlier that integrative functions
involving long-range interactions are predominantly mediated by lower frequencies (Donner
and Siegel, 2011; von Stein et al. 2000; see also Hipp et al., 2011) we focused on oscillatory
activity below 30 Hz in our analysis.
The visual-tactile matching paradigm used here involved two different tasks. In different
blocks of the experiment, participants were either asked to (1) detect predefined target
patterns that could appear in both sensory modalities (detection task) or, (2) explicitly
evaluate the relationship between the two patterns and report whether they were the same or
not peer-reviewed) is the author/funder. All rights reserved. No reuse allowed without permission. The copyright holder for this preprint (which was. http://dx.doi.org/10.1101/014092doi: bioRxiv preprint first posted online Jan. 22, 2015;

5
not (congruence evaluation task). Keeping the physical stimulation exactly the same in both
tasks, this design was highly suited determining inter-task differences associated with distinct
cognitive demands of detection and congruence evaluation (including comparisons of pre-
stimulus neuronal activity), as well as intra-task comparisons related to visual-tactile stimulus
congruence. On the one hand, we expected modulations in preparatory neuronal activity
related to task requirements, especially in alpha- and beta-frequencies (Mazaheri et al., 2014;
van Ede et al., 2011; van Ede et al., 2014). On the other hand and in line with previous studies
on crossmodal interactions and low frequency modulations (Barutchu et al., 2013; Doesburg
et al., 2009; Gleiss and Kayser, 2014a; Gleiss and Kayser, 2014b; Hummel and Gerloff, 2005;
van Ackeren et al., 2014; van Driel et al., 2014), we expected post-stimulus modulations in
different frequency bands below 30 Hz, possibly reflecting different constituent factors of the
complex process of multisensory integration. In order to further differentiate between
subcomponents of visual-tactile interactions on a spatial scale, we reconstructed neuronal
sources of frequency-band specific power using non-adaptive linear spatial filters
(eLORETA).
not peer-reviewed) is the author/funder. All rights reserved. No reuse allowed without permission. The copyright holder for this preprint (which was. http://dx.doi.org/10.1101/014092doi: bioRxiv preprint first posted online Jan. 22, 2015;

6
2. Methods
2.1 Participants
Sixteen right-handed volunteers (12 female, mean age 25.4, range 21-33) were monetarily
compensated for their participation in the study. All participants had normal or corrected to
normal vision, and reported no history of neurological or psychiatric illness. The Ethics
Committee of the Medical Association Hamburg approved the current study, and participants
provided written informed consent prior to the recordings.
2.2 Task design
The experimental setup outlined in the following is similar to a previous behavioral study
(Göschl et al., 2014), using only a subset of the visual-tactile matching paradigm described in
detail ibidem (see Figure 1 for an overview of events and timing of the current experiment).
Four spatial patterns, each of them formed by three dots, constituted the stimulus set (Figure
1A). Stimuli were presented visually on a computer monitor, appearing left of a central
fixation cross, embedded in a noisy background. Concurrently, dot patterns were delivered
haptically to participants’ right index fingertip via a Braille stimulator (QuaeroSys Medical
Devices, Schotten, Germany). Stimulus duration was 300 ms for both patterns.
Prior to the actual experiment, we conducted a delayed-match-to-sample training task to
familiarize participants with the tactile patterns. In this training task, participants were asked
to judge whether a sample stimulus (duration 300 ms) and a 1000 ms later on presented probe
stimulus (also of 300 ms duration) were identical or not. Responses were given with the left
hand via button press on a response box (Cedrus, RB-420 Model, San Pedro, USA) and visual
feedback (a green ‘+’ or a red ‘–’) informed participants about the correctness of their
response. After a minimum of five training blocks (each consisting of 16 trials) and a
not peer-reviewed) is the author/funder. All rights reserved. No reuse allowed without permission. The copyright holder for this preprint (which was. http://dx.doi.org/10.1101/014092doi: bioRxiv preprint first posted online Jan. 22, 2015;

7
matching performance of at least 80%, participants could proceed to the actual experiment.
One participant not meeting this criterion was excluded after the training procedure.
The experimental session incorporated two different tasks (performed in separate blocks of
the experiment), which both required the identification of concurrently presented visual and
tactile patterns. In the detection task, participants were instructed to detect target stimuli that
could appear in both modalities. In each experimental block, one out of the four dot patterns
was defined as target (the other three patterns were non-targets, respectively) and introduced
to the participants at the start of the block by simultaneously presenting it on the computer
screen and by means of the Braille stimulator (four times). In the following experimental
trials, targets could appear in the visual or the tactile modality alone, in both or in neither of
the two. Participants had to decide whether the presented patterns matched the previously
defined target stimulus or not and press one of two response buttons accordingly. In the
congruence evaluation task, participants were asked to compare patterns across sensory
modalities and report whether they were the same (congruent) or not. Again, responses were
given via button press.
The timing was identical for the detection and the congruence evaluation task and is
displayed in Figure 1B. The major difference compared to the experimental design realized in
our earlier study is the wait interval of 1200 ms between stimulus presentation and response.
This interval was chosen to prevent contamination of the EEG signal by activity resulting
from response execution.
Each participant performed 1536 trials over two sessions recorded on separate days (with the
two sessions happening within three days). The experimental design was counterbalanced in
the presentation of congruent and incongruent stimulus pairs, target definitions and
presentation frequencies of each of the four patterns across trials (for details see Göschl et al.,
2014). We pooled data from the two recording sessions and grouped trials as follows: visual
targets alone (a visual target appearing with a tactile non-target; labeled incongruent V in the
not peer-reviewed) is the author/funder. All rights reserved. No reuse allowed without permission. The copyright holder for this preprint (which was. http://dx.doi.org/10.1101/014092doi: bioRxiv preprint first posted online Jan. 22, 2015;

8
following), tactile targets alone (a tactile target presented with a visual non-target;
incongruent T), and visual-tactile targets (congruent VT) as well as non-target congruent
stimulus pairs and non-target incongruent pairs for the detection task (five conditions); for the
congruence evaluation task we split trials in congruent and incongruent visual-tactile stimulus
pairs, respectively. This procedure left us with a total of 192 trials for each condition (only the
non-target incongruent pairs appeared 384 times to balance tactile and visual target trials). In
the following, we focus on correctly detected (incongruent V, incongruent T and congruent
VT) targets for the detection task and accurately identified congruent and incongruent
stimulus pairs for the congruence evaluation task.
Key mapping (for ‘target’ and ‘non-target’-, as well as ‘congruent’ and ‘incongruent’-buttons)
was counterbalanced across participants and sessions. To mask sounds associated with pin
movement in the Braille cells, participants were presented with pink noise administered via
foam-protected air tube earphones at 75 dB sound pressure level (Eartone, EAR Auditory
Systems, AearoCompany). We used Presentation software (Neurobehavioral Systems, version
16.3) to control stimulus presentation and to record participants’ response times (RT) and
accuracies.
not peer-reviewed) is the author/funder. All rights reserved. No reuse allowed without permission. The copyright holder for this preprint (which was. http://dx.doi.org/10.1101/014092doi: bioRxiv preprint first posted online Jan. 22, 2015;

9
Figure 1. Schematic representation of the visual-tactile matching task. (A) The four pattern stimuli used in our experiment. (B) The trial sequence. After a pre-stimulus interval of 1500 ms, visual and tactile stimuli were presented simultaneously for 300 ms, followed by a wait interval of 1200 ms. After that, a question mark appeared on the screen indicating that responses could be given. After button press, every trial ended with visual feedback (1000 ms).
2.3 EEG recordings
EEG data were acquired from 126 scalp sites using Ag/AgCl ring electrodes mounted into an
elastic cap (EASYCAP, Herrsching, Germany). Additionally, two electrodes were placed
below the eyes to record the electrooculogram. EEG data were recorded with a passband of
0.016-250 Hz and digitized with a sampling rate of 1000 Hz using BrainAmp amplifiers
(BrainProducts, Munich, Germany). The tip of the nose served as a reference during the
recordings but subsequently we re-referenced the data to common average. Analysis of the
EEG data was carried out in Matlab 8.0 (MathWorks, Natick, MA) using custom-made
scripts, as well as routines incorporated in EEGLAB 11.0 (Delorme and Makeig, 2004;
B
A
1 2 43
300 msvisual & tactile
stimulation
until response
1500 mspre-stimulus
1000 msfeedback+
+
+?
+
1200 ms wait
not peer-reviewed) is the author/funder. All rights reserved. No reuse allowed without permission. The copyright holder for this preprint (which was. http://dx.doi.org/10.1101/014092doi: bioRxiv preprint first posted online Jan. 22, 2015;

10
http://sccn.ucsd.edu/eeglab/) and FieldTrip (Oostenveld et al., 2011;
http://fieldtrip.fcdonders.nl). Offline, the data were band-pass filtered (0.3-180 Hz),
downsampled to 500 Hz and epoched from – 400 to + 1400 ms around the onset of the
simultaneously presented visual and tactile stimuli. All trials were inspected visually, and
those containing EMG artifacts were rejected. Afterwards we applied an independent
component analysis (ICA) approach to remove artifacts related to eyeblinks, horizontal eye
movements and electrocardiographic activity. To control for miniature saccadic artifacts, we
employed the COSTRAP algorithm (correction of saccade-related transient potentials;
Hassler et al., 2011) that has been used to suppress ocular sources of high frequency signals
(e.g. Friese et al., 2013; Hassler et al., 2013). With this multilevel artifact correction
procedure, 88% of all recorded trials (range: 75% to 95%) were retained.
2.3.1 Spectral analysis
We derived time-frequency representations (TFRs) of the data via wavelet convolution in the
frequency domain. Power spectra of the EEG signal were obtained from fast Fourier
transforms and multiplied by the power spectrum of the complex Morlet wavelets [!!!!"# !!!
!
!!!;
t represents time, f is frequency which increased in 30 logarithmic steps from 2 to 100 Hz, and
σ defines the width of each frequency band, set according to n/(2πf), where n stands for the
number of wavelet cycles which increased from 3 to 10 in logarithmic steps (Cohen and
Donner, 2013; Cohen, 2014)]. Then, the inverse fast Fourier transform was taken. All
frequency transformations were done at the single-trial level before averaging. Power
estimates for specific frequencies at each time point were defined as the squared magnitude of
the complex convolution result {real[z(t)]2 + imaginary[z(t)2]}. To compute the relative signal
change, power data were normalized with respect to a pre-stimulus baseline window. The
not peer-reviewed) is the author/funder. All rights reserved. No reuse allowed without permission. The copyright holder for this preprint (which was. http://dx.doi.org/10.1101/014092doi: bioRxiv preprint first posted online Jan. 22, 2015;

11
baseline power was calculated as the average from – 250 ms pre-stimulus to 0 (stimulus
onset).
To obtain the induced, non-phase-locked part of the signal power, we computed the event-
related potential (ERP) and subtracted it from the time domain signal on each trial (Kalcher
and Pfurtscheller, 1995). This procedure was carried out for each condition, electrode and
subject separately. Afterwards, the time-frequency decomposition was conducted as described
in the previous paragraph. Analysis was done for both, total and induced power with results
being highly comparable. For reasons of clarity, we focus on the analysis of induced power in
the following.
Based on visual inspection of the baseline corrected TFR averaged across all sensors,
experimental conditions (also including the non-target conditions for the detection task) and
participants, we selected five time-frequency windows of interest. For the detection (Figure
2A) as well as the congruence evaluation task (Figure 2B), we defined two theta-band
windows (2 to 7 Hz), an early one from 0 to 750 ms post-stimulus, and a late one from 750 to
1250 ms, an alpha-band (decrease) window (8 to 13 Hz) from 250 to 750 ms, a beta-band
(decrease) window (13 to 25 Hz) from 250 to 750 ms and a second beta-band (rebound)
window (13 to 25 Hz) from 750 to 1250 ms after pattern presentation. Within these time-
frequency windows, we investigated stimulus-congruence related intra-task differences,
separately for the detection and the congruence evaluation task. Activity at frequencies above
30 Hz was analyzed as well but did not show reliable modulation in response to visual-tactile
stimulation.
To assess global differences in oscillatory dynamics related to different cognitive demands of
the two tasks (inter-task differences), we compared neuronal activity directly preceding the
presentation of the visual and tactile stimuli (in a time window from – 250 ms to 0) in alpha-
and beta-frequencies. Additionally, we checked for task effects by comparing responses to
congruent pairs of stimuli between the two tasks. Using the time-frequency windows
not peer-reviewed) is the author/funder. All rights reserved. No reuse allowed without permission. The copyright holder for this preprint (which was. http://dx.doi.org/10.1101/014092doi: bioRxiv preprint first posted online Jan. 22, 2015;

12
described above, we contrasted responses to congruent VT targets of the detection task and
matching stimulus pairs of the congruence evaluation task, i.e. two conditions employing
identical physical stimulation and both requiring a positive detection response.
For the statistical analysis of sensor level power data, we applied a cluster level
randomization approach (Maris and Oostenveld, 2007) as implemented in FieldTrip
(Oostenveld et al., 2011). This procedure has been used previously (see for example Jokisch
and Jensen, 2007; Nieuwenhuis et al., 2008 and Mazaheri et al., 2014) and controls for Type I
errors involving multiple comparisons (in our case over multiple sensors). First, data were
averaged for the time and frequency window of interest and a t-statistic was computed for
every sensor. Then, contiguous sensors falling below a p-value of 0.05 were grouped in
clusters, with the sum of t-values in a given cluster being used in the cluster-level test
statistics. Subsequently, the Monte Carlo estimate of the permutation p-value of the cluster
was obtained by evaluating the cluster-level test statistic under the randomization null
distribution assuming no condition difference. This distribution was created by randomly
reassigning the data to the conditions across participants 1000 times and computing the
maximum cluster-level test statistic. Analysis was carried out separately for all time-
frequency windows defined in the preceding paragraph.
Figure 2. Grand average time-frequency representations (TFRs) for the two tasks. (A) TFR for the detection task, and (B) the congruence evaluation task with time-frequency windows of interest. Power data were averaged across all sensors, experimental conditions and subjects and are shown as % change to baseline.
0 200 600400 800 1000 12002
3.4
5.9
10.1
17.3
29.7
Time (ms)
Freq
uenc
y (H
z)
0 200 600400 800 1000 1200
Time (ms)
A B
%
50
-50
not peer-reviewed) is the author/funder. All rights reserved. No reuse allowed without permission. The copyright holder for this preprint (which was. http://dx.doi.org/10.1101/014092doi: bioRxiv preprint first posted online Jan. 22, 2015;
13
2.3.2 Source estimation of frequency-specific activity
Neuronal sources of frequency-band specific activity were reconstructed using eLORETA
(exact low-resolution brain electromagnetic tomography). eLORETA is a non-adaptive linear
spatial filter with the property that single dipoles without additional noise can be localized
exactly (for technical details see for example Pascual-Marqui, 2007). We calculated cross-
spectral density (CSD) matrices between all 126 scalp EEG channels (excluding the EOG
channels) in every frequency (2 to 100 Hz in 30 logarithmic steps) for six time windows of
equal length. The time windows were: – 250 ms to 0, 0 to 250 ms, 250 to 500 ms, 500 to 750
ms, 750 to 1000 ms and 1000 to 1250 ms. Calculation of cross spectra was done separately
for every participant and experimental condition in each trial. To derive the source estimates,
we multiplied the real part of the frequency domain data (the real part of the cross spectrum)
with the real-valued filter. We took the largest eigenvalue of the reduced 3 x 3 cross spectrum
as a power estimate for each grid point. eLORETA computations were made in a realistic 3-
shell head model based on the MNI152 template brain (Montreal Neurological Institute;
http://www.mni.mcgill.ca). Source activity was estimated within a continuous grid of 3000
voxels and leadfields were calculated as described in Nolte and Dassios (2005). Source data
were baseline corrected as well, with respect to an interval from – 250 ms to 0 (corresponding
to the first time window of our CSD matrix calculation).
Across participants, paired t-tests were calculated analogous to the sensor level comparisons
described above with the corresponding t-values being reported uncorrected. Anatomical
labeling was done using the NFRI functions (Singh, Okamoto et al., 2005;
http://www.jichi.ac.jp/brainlab/tools.html). MNI coordinates of maximal statistical
differences at the source level are displayed in Table 2.
not peer-reviewed) is the author/funder. All rights reserved. No reuse allowed without permission. The copyright holder for this preprint (which was. http://dx.doi.org/10.1101/014092doi: bioRxiv preprint first posted online Jan. 22, 2015;
14
3. Results
3.1 Behavioral data
To determine whether behavioral performance within the detection task differed depending on
visual-tactile stimulus congruence, we subjected accuracy and reaction time data for
congruent VT, incongruent V and incongruent T targets to 1 x 3 repeated measures ANOVAs
with Congruence as the within-subject factor. We found a significant effect of Congruence
(F1, 15 = 23.28, p < 0.01), with congruent VT targets being associated with the highest
detection rate, followed by incongruent V targets and incongruent T targets (see Table 1 for
mean accuracies of the different conditions). To further elucidate stimulus-congruence related
effects, post hoc t-tests were conducted showing that congruent stimulation (VT targets) led to
superior detection as compared to incongruent V targets (t15 = 4.37, p < 0.01) and incongruent
T targets alone (t15 = 6.58, p < 0.01; paired sample t-tests). Mean reaction times (note that
responses could only be given after a forced wait interval of 1200 ms after stimulus
presentation) for the detection of congruent VT, incongruent V and incongruent T targets are
also displayed in Table 1. Again, a repeated measures ANOVA revealed a significant effect of
Congruence (F1, 15 = 6.59, p < 0.01). Post hoc comparisons (paired sample t-tests) showed that
reactions were fastest for the detection of congruent VT targets with a significant difference to
incongruent T targets (t15 = 3. 11, p < 0.01) but only trended to significance for congruent VT
targets and incongruent V targets (t15 = 1.91, p = 0.08). Thus, we did not observe a speed
accuracy tradeoff; instead bimodal stimulation achieved consistently higher performance.
In order to compare behavioral performance on matching and non-matching visual-tactile
pairs of stimuli in the congruence evaluation task, we employed paired sample t-tests. Across
subjects, congruent pattern combinations trended to be associated with higher accuracy (t15 =
2.07, p = 0.06; see Table 1 for mean accuracies and reaction times). This is compatible with a
not peer-reviewed) is the author/funder. All rights reserved. No reuse allowed without permission. The copyright holder for this preprint (which was. http://dx.doi.org/10.1101/014092doi: bioRxiv preprint first posted online Jan. 22, 2015;

15
response bias ‘in doubt towards congruence’. The analogous comparison for reaction times
yielded no significant result.
Global differences in behavioral performance between the detection and the congruence
evaluation task were assessed by calculating mean accuracies and reaction times within the
two tasks (including non-target conditions for the detection task) and contrasting values
between them (paired sample t-tests, two-tailed). Behavioral metrics were comparable (no
significant differences found). In addition, we analyzed performance on congruent VT targets
of the detection task and matching pairs of the congruence evaluation. Contrasting these two
conditions employing the same physical stimulation with different task demands, we found
the former to be associated with significantly higher accuracies (t15 = 5.42, p < 0.01, paired
sample t-test) and lower reaction times (t15 = 2.33, p < 0.05).
Table 1. Behavioral data of the visual-tactile matching paradigm. Mean accuracies (ACC,
shown in percent) and response times (RT, shown in ms), with standard deviations (SD) for
the detection and the congruence evaluation task as well as the comparison of the two tasks.
ACC (SD) RT (SD)
Detection task
Congruent VT targets 96.2 (3.6) 376 (193)
Incongruent V targets 88.5 (9.2) 390 (194)
Incongruent T targets 71 (16.3) 411 (193)
Congruence evaluation task
Matching stimulus pairs 87.5 (7.6) 406 (200)
Non-matching stimulus pairs 80.4 (16.3) 417 (195)
Comparison between detection (also including non-targets) and congruence evaluation task
Detection 82.9 (7.3) 410 (203)
Congruence evaluation 83.9 (10.8) 412 (197)
not peer-reviewed) is the author/funder. All rights reserved. No reuse allowed without permission. The copyright holder for this preprint (which was. http://dx.doi.org/10.1101/014092doi: bioRxiv preprint first posted online Jan. 22, 2015;

16
3.2 EEG data
The following section on results of our EEG sensor and source level analysis is subdivided in
three parts: (1) stimulus-congruence related effects in the detection task, (2) differences
between matching and non-matching stimulus pairs in the congruence evaluation task and, (3)
a comparison of the two tasks. MNI coordinates and uncorrected t-values of maximal source
level differences are displayed in Table 2.
3.2.1 Detection task
To analyze frequency-specific differences related to crossmodal stimulus congruence in the
detection task, we compared responses to congruent VT and incongruent V targets as well as
congruent VT and incongruent T targets separately in our time-frequency windows of interest
(see above). Additionally, we reconstructed sources of neuronal activity for the different
conditions as well as the maxima of condition differences. In the following, only statistically
significant comparisons between conditions are reported.
Alpha-band power between 250 and 750 ms after stimulus presentation was reduced
compared to baseline for congruent VT, incongruent V and incongruent T target cases (see
condition topographies in Figure 3A). Comparing responses between conditions using cluster-
based randomization tests yielded significant stimulus congruence-related differences.
Decreases in alpha-band power were more pronounced for congruent VT targets compared to
incongruent V targets as well as incongruent T targets. Topographical distributions of these
differences as displayed in Figure 3B and 3D show significant clusters in right central and left
posterior scalp regions (p < 0.05 for both clusters, tested two-sided).
not peer-reviewed) is the author/funder. All rights reserved. No reuse allowed without permission. The copyright holder for this preprint (which was. http://dx.doi.org/10.1101/014092doi: bioRxiv preprint first posted online Jan. 22, 2015;

17
Figure 3. Comparison of alpha-band responses in the detection task. (A) Alpha-band power for frequencies between 8 and 13 Hz and a time window of 250 to 750 ms after stimulation plotted for the different conditions as relative change (%) to baseline. (B) Topography of the difference (shown in t-values) in alpha-band power between congruent VT and incongruent V target trials. A significant cluster (p<0.05) is apparent spanning from right central to left posterior scalp locations. (C) Statistical differences for the source level comparison of alpha-band responses between 250 and 750 ms in congruent VT and incongruent V target trials (tested two-sided with only negative, uncorrected t-values below the fifth percentile displayed here). For MNI coordinates of maxima see Table 2A. (D-E) Comparison of alpha-band responses on congruent VT and incongruent T trials. Presentation of results is analogous to the comparison in B-C. The cluster in (D) is significant with p<0.05.
Alpha-band power decreases across conditions between 250 and 750 ms after stimulation
were maximal in right-hemispheric primary and secondary somatosensory cortices as well as
premotor areas. Comparing responses to congruent VT and incongruent V targets revealed the
strongest modulations to be located in prefrontal areas and left supramarginal gyrus (Figure
3C; see Table 2A for the respective MNI coordinates). Please note that statistical differences
for all source level analyses are displayed in uncorrected t-values. Maxima for differences
between alpha-band decreases to congruent VT and incongruent T targets on the other hand
were predominantly located to the right hemisphere and found in premotor areas,
supramarginal gyrus, somatosensory association cortex and superior frontal gyrus (Figure
3E).
Beta-band power also decreased in the 250-750 ms time window (see Figure 2A), without
showing differences between conditions. As can be seen in Figure 4A for the different target
B C
incongruent V
incongruent T
congruent VT
A
D Econgruent VT - incongruent V
congruent VT - incongruent T%
0
-40
4
-4t-stat
0
-5t-stat
not peer-reviewed) is the author/funder. All rights reserved. No reuse allowed without permission. The copyright holder for this preprint (which was. http://dx.doi.org/10.1101/014092doi: bioRxiv preprint first posted online Jan. 22, 2015;

18
cases, beta-band activity over left-hemispheric regions exceeded baseline level in an interval
of 750 to 1250 ms after stimulation. Cluster statistics revealed differences between beta-band
responses to congruent and incongruent visual-tactile stimulation. Figure 4B shows a cluster
(not reaching significance, p = 0.1) located in right-hemispheric central-posterior scalp
regions for the difference of congruent VT compared to incongruent V targets, and Figure 4D
a significant, centrally distributed cluster (p < 0.05) for the comparison of congruent VT and
incongruent T targets. Having a closer look at condition wise activity patterns of beta-
frequencies in the time window 750-1250 ms, it becomes evident that the difference between
congruent VT targets and incongruent T targets is due to differences in right-hemispheric
power decreases between conditions as well as beta-band rebound phenomena that are
restricted to left-hemispheric regions.
Figure 4. Comparison of beta-band responses in the detection task. (A) Beta-band power for frequencies between 13 and 25 Hz and a time window of 750 to 1250 ms after stimulation plotted for the different conditions as relative change (%) to baseline. (B) Topography of the difference (shown in t-values) in beta-band power between congruent VT and incongruent V targets in the same time window. A cluster (not reaching statistical significance, p = 0.1) in right central-posterior locations is apparent. (C) Statistical differences for the source level comparison of beta-band responses between 750 and 1250 ms in congruent VT and incongruent V target trials (tested two-sided with only positive, uncorrected t-values above the 95th percentile shown, see Table 2A for MNI coordinates). (D-E) Comparison of beta-band responses on congruent VT and incongruent T target trials. Presentation of results is analogous to B-C. The cluster in (D) is significant with p<0.05.
B C
incongruent V
incongruent T
congruent VT
A
D
congruent VT - incongruent T
congruent VT - incongruent V
E
%40
-20
4
-4t-stat
5
0
t-stat
not peer-reviewed) is the author/funder. All rights reserved. No reuse allowed without permission. The copyright holder for this preprint (which was. http://dx.doi.org/10.1101/014092doi: bioRxiv preprint first posted online Jan. 22, 2015;
19
Beta-band increases between 750 and 1250 ms post-stimulus compared to baseline activity
were limited to left-hemispheric areas and maximal in premotor cortex. Right-hemispheric
decreases in the same time and frequency window also peaked in premotor areas. The
strongest differences between congruent VT and incongruent V targets in the late beta-range
were found in areas of right somatosensory association and premotor cortex (Figure 4C) with
power decreases being more pronounced for incongruent V target cases. Differences for the
comparison of congruent VT and incongruent T targets were located in prefrontal areas, right
premotor cortex and left somatosensory and premotor cortices (Figure 4F).
3.2.2 Congruence evaluation task
Time-frequency windows were defined based on the grand average TFR (Figure 2B) in the
same way as for the detection task. Only statistically significant comparisons between
frequency-specific responses to matching and non-matching stimulus pairs in the congruence
evaluation task and their corresponding source reconstructions are covered in the following.
Theta-band power at later processing stages (between 750 and 1250 ms after stimulation) was
augmented compared to baseline at central scalp sites and locations overlying the temporal
areas, whereas it was moderately reduced at right posterior sites (Figure 5A). Differences
between congruent and incongruent pairs were mirrored in a significant positive cluster (p <
0.05) with broad right-hemispheric distribution (Figure 5B). Hence, congruent visual-tactile
stimulus pairs were associated with higher theta-band power values.
not peer-reviewed) is the author/funder. All rights reserved. No reuse allowed without permission. The copyright holder for this preprint (which was. http://dx.doi.org/10.1101/014092doi: bioRxiv preprint first posted online Jan. 22, 2015;
20
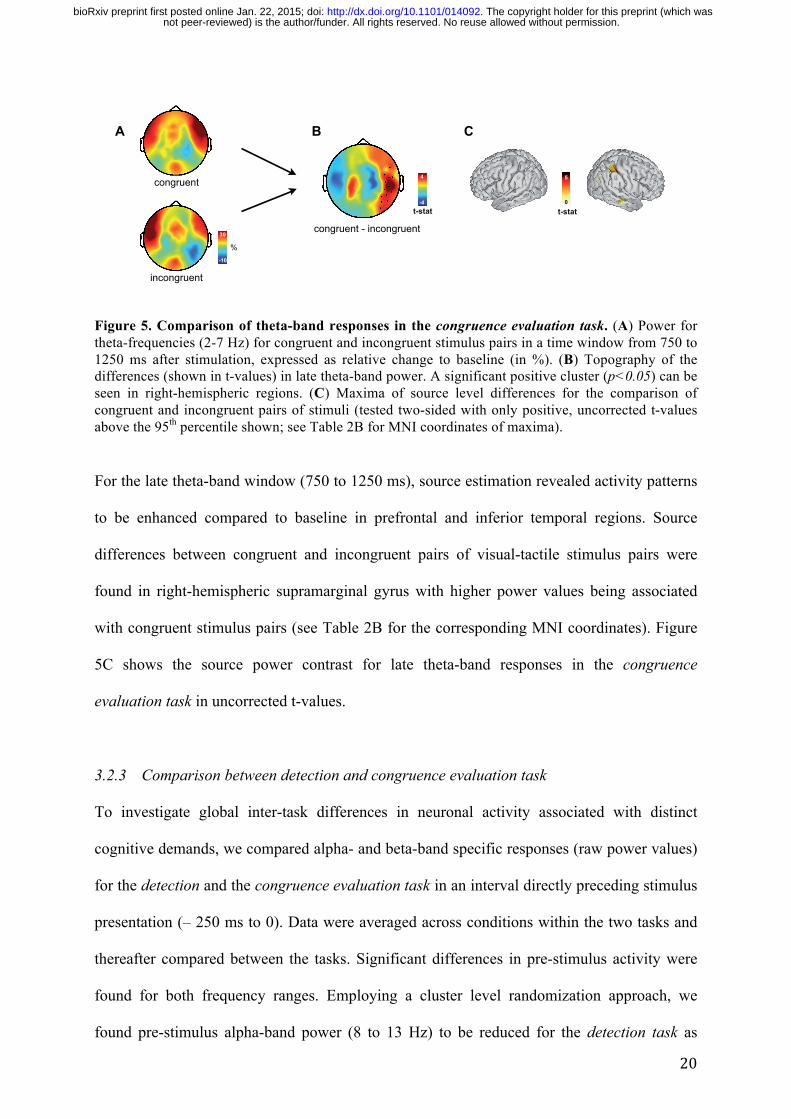
Figure 5. Comparison of theta-band responses in the congruence evaluation task. (A) Power for theta-frequencies (2-7 Hz) for congruent and incongruent stimulus pairs in a time window from 750 to 1250 ms after stimulation, expressed as relative change to baseline (in %). (B) Topography of the differences (shown in t-values) in late theta-band power. A significant positive cluster (p<0.05) can be seen in right-hemispheric regions. (C) Maxima of source level differences for the comparison of congruent and incongruent pairs of stimuli (tested two-sided with only positive, uncorrected t-values above the 95th percentile shown; see Table 2B for MNI coordinates of maxima).
For the late theta-band window (750 to 1250 ms), source estimation revealed activity patterns
to be enhanced compared to baseline in prefrontal and inferior temporal regions. Source
differences between congruent and incongruent pairs of visual-tactile stimulus pairs were
found in right-hemispheric supramarginal gyrus with higher power values being associated
with congruent stimulus pairs (see Table 2B for the corresponding MNI coordinates). Figure
5C shows the source power contrast for late theta-band responses in the congruence
evaluation task in uncorrected t-values.
3.2.3 Comparison between detection and congruence evaluation task
To investigate global inter-task differences in neuronal activity associated with distinct
cognitive demands, we compared alpha- and beta-band specific responses (raw power values)
for the detection and the congruence evaluation task in an interval directly preceding stimulus
presentation (– 250 ms to 0). Data were averaged across conditions within the two tasks and
thereafter compared between the tasks. Significant differences in pre-stimulus activity were
found for both frequency ranges. Employing a cluster level randomization approach, we
found pre-stimulus alpha-band power (8 to 13 Hz) to be reduced for the detection task as
B C
congruent
incongruent
A
congruent - incongruent
%30
-10
4
-4t-stat
5
0
t-stat
not peer-reviewed) is the author/funder. All rights reserved. No reuse allowed without permission. The copyright holder for this preprint (which was. http://dx.doi.org/10.1101/014092doi: bioRxiv preprint first posted online Jan. 22, 2015;

21
compared to the congruence evaluation task, resulting in a negative cluster (p < 0.01)
apparent in right-hemispheric central regions and a second one in left posterior scalp locations
(p < 0.05, Figure 6A).
Figure 6. Comparison of alpha-band pre-stimulus activity between the detection and the congruence evaluation task. (A) Topography of the differences (shown in t-values) in alpha-band power (8-13 Hz) in a time interval from – 250 ms to 0 (onset of the visual and tactile stimuli). A significant negative cluster (p<0.01) is apparent in right-central scalp regions. A second cluster at left-posterior locations is significant with p<0.05. (B) Maxima of source level differences for the comparison of anticipatory alpha-band power between the two tasks (tested two-sided with only negative, uncorrected t-values below the fifth percentile displayed here). For MNI coordinates of maxima see Table 2C.
Pre-stimulus alpha-band power was maximal in higher visual areas (V3) for both tasks.
Differences in anticipatory alpha-band activity were mainly located in posterior cingulate
cortex, right-hemispheric superior temporal and supramarginal gyrus (Figure 6B; see Table
2C for MNI coordinates of maximal differences).
Contrasting pre-stimulus beta-band responses (13 to 25 Hz) between the two tasks also
resulted in a negative cluster (p < 0.01), the spatial distribution being more extended and
slightly more central (Figure 7A). Also in the beta-frequency range, anticipatory neuronal
activity was more pronounced for the congruence evaluation task.
A B
detection - evaluation
4
-4t-stat
0
-5t-stat
4
not peer-reviewed) is the author/funder. All rights reserved. No reuse allowed without permission. The copyright holder for this preprint (which was. http://dx.doi.org/10.1101/014092doi: bioRxiv preprint first posted online Jan. 22, 2015;

22
Figure 7. Comparison of beta-band pre-stimulus activity between the detection and the congruence evaluation task. (A) Topography of the differences (shown in t-values) in beta-band power (13-25 Hz) in a time interval from – 250 ms to 0 (onset of the visual and tactile stimuli). A significant negative cluster (p<0.01) spanning from central to right lateral regions is apparent. (B) Maxima of source level differences for the comparison of anticipatory beta-band power between the two tasks (tested two-sided with only negative, uncorrected t-values below the fifth percentile displayed here). For MNI coordinates of maxima see Table 2C.
Pre-stimulus beta-band activity was maximal in visual cortex (V2 and V3) and in inferior
temporal gyrus. Contrasting pre-stimulus beta-band activity between the two tasks yielded
maximal differences in right angular gyrus, supramarginal gyrus and bihemispheric
somatosensory association cortex (Figure 7B).
In a second step, we checked for differences in frequency-specific responses related to task
demands by comparing responses to congruent VT targets of the detection task and matching
stimulus pairs of the congruence evaluation task (two conditions employing identical physical
stimulation) within the time-frequency windows of interest. The windows chosen for our
analysis are reported in the Methods section (see also Figure 2A and 2B). Again, we report on
statistically significant comparisons only.
Descriptively, theta-band power in a time window from 0 to 750 ms was augmented as
compared to baseline level across the whole scalp, with the maxima being located at fronto-
central, right-lateral and right-posterior locations for both, congruent VT targets of the
detection task and matching stimulus pairs of the congruence evaluation (see Figure 8A).
Comparing theta-band power between these conditions yielded significant differences. Theta-
A B
detection - evaluation
4
-4t-stat
0
-5t-stat
4
not peer-reviewed) is the author/funder. All rights reserved. No reuse allowed without permission. The copyright holder for this preprint (which was. http://dx.doi.org/10.1101/014092doi: bioRxiv preprint first posted online Jan. 22, 2015;
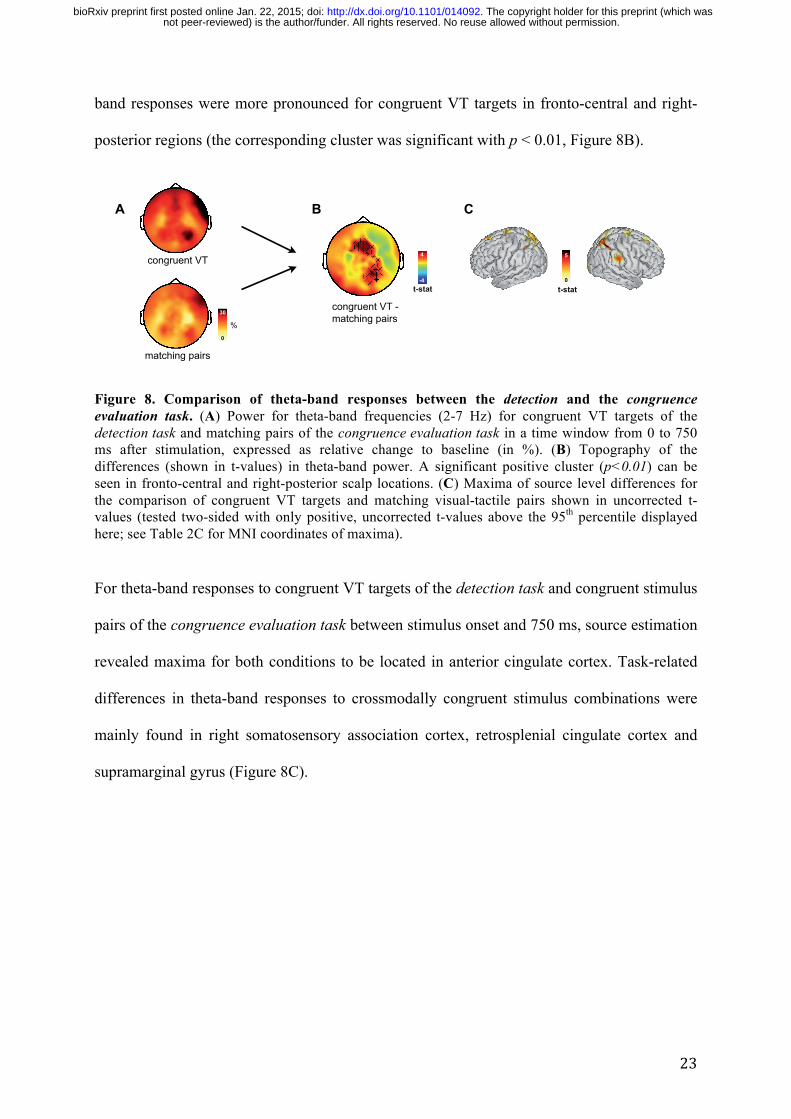
23
band responses were more pronounced for congruent VT targets in fronto-central and right-
posterior regions (the corresponding cluster was significant with p < 0.01, Figure 8B).
Figure 8. Comparison of theta-band responses between the detection and the congruence evaluation task. (A) Power for theta-band frequencies (2-7 Hz) for congruent VT targets of the detection task and matching pairs of the congruence evaluation task in a time window from 0 to 750 ms after stimulation, expressed as relative change to baseline (in %). (B) Topography of the differences (shown in t-values) in theta-band power. A significant positive cluster (p<0.01) can be seen in fronto-central and right-posterior scalp locations. (C) Maxima of source level differences for the comparison of congruent VT targets and matching visual-tactile pairs shown in uncorrected t-values (tested two-sided with only positive, uncorrected t-values above the 95th percentile displayed here; see Table 2C for MNI coordinates of maxima).
For theta-band responses to congruent VT targets of the detection task and congruent stimulus
pairs of the congruence evaluation task between stimulus onset and 750 ms, source estimation
revealed maxima for both conditions to be located in anterior cingulate cortex. Task-related
differences in theta-band responses to crossmodally congruent stimulus combinations were
mainly found in right somatosensory association cortex, retrosplenial cingulate cortex and
supramarginal gyrus (Figure 8C).
B C
congruent VT
matching pairs
A
congruent VT - matching pairs
%30
0
4
-4t-stat
5
0
t-stat
not peer-reviewed) is the author/funder. All rights reserved. No reuse allowed without permission. The copyright holder for this preprint (which was. http://dx.doi.org/10.1101/014092doi: bioRxiv preprint first posted online Jan. 22, 2015;

24
Table 2. MNI coordinates and uncorrected t-values of the voxels showing maximal
statistical difference between conditions respectively tasks. Results are shown for source
estimates of frequency-band specific condition differences within the detection and the
congruence evaluation task, as well as the comparison between the two tasks.
A Detection task
Region X Y Z t-value
Alpha-band responses for congruent VT vs. incongruent V targets (250-750 ms)
Prefrontal cortex (right) 44 51 – 4 – 6.9
Supramarginal gyrus (left) – 64 – 49 35 – 3.9
Alpha-band responses for congruent VT vs. incongruent T targets (250-750 ms)
Premotor cortex (right) 43 – 19 65 – 4.3
Supramarginal gyrus (right) 58 – 45 25 – 3.9
Somatosensory association cortex (right) 6 – 69 63 – 3.8
Superior frontal gyrus (right) 24 58 32 – 3.5
Beta-band responses for congruent VT vs. incongruent V targets (750-1250 ms)
Somatosensory association cortex (right) 29 – 39 51 5.2
Premotor cortex (right) 57 5 46 3.7
Beta-band responses for congruent VT vs. incongruent T targets (750-1250 ms)
Prefrontal cortex (left) – 8 73 11 5.8
Premotor cortex (right) 18 – 28 77 4
Somatosensory association cortex (left) –13 – 50 79 3.6
Premotor cortex (left) –56 4 48 3.1
B Congruence evaluation task
Region X Y Z t-value
Theta-band responses for matching vs. non-matching stimulus pairs (750-1250 ms)
Supramarginal gyrus (right) 31 – 47 44 3.8
not peer-reviewed) is the author/funder. All rights reserved. No reuse allowed without permission. The copyright holder for this preprint (which was. http://dx.doi.org/10.1101/014092doi: bioRxiv preprint first posted online Jan. 22, 2015;

25
C Comparison between detection task and congruence evaluation task
Region X Y Z t-value
Pre-stimulus alpha-band responses for detection vs. congruence evaluation task (– 250-0 ms)
Posterior cingulate cortex (left) – 18 – 58 10 – 3.3
Superior temporal gyrus (right) 61 – 42 13 – 3.3
Supramarginal gyrus (right) 43 – 46 66 – 3.1
Pre-stimulus beta-band responses for detection vs. congruence evaluation task (– 250-0 ms)
Angular gyrus (right) 43 – 79 33 – 4.4
Supramarginal gyrus (right) 44 – 48 56 – 3.8
Somatosensory association cortex (left) – 18 – 66 68 – 3.8
Somatosensory association cortex (right) 37 – 58 64 – 3.6
Theta-band responses for congruent VT targets vs. matching pairs (0-750 ms)
Somatosensory association cortex (right) 25 – 60 58 5.9
Retrosplenial cingulate cortex (right) 5 – 41 39 5.1
Supramarginal gyrus (right) 63 – 34 41 4.3
not peer-reviewed) is the author/funder. All rights reserved. No reuse allowed without permission. The copyright holder for this preprint (which was. http://dx.doi.org/10.1101/014092doi: bioRxiv preprint first posted online Jan. 22, 2015;

26
4. Discussion
In the present study we investigated behavioral and oscillatory signatures of visual-tactile
stimulus congruence effects by means of a crossmodal pattern matching paradigm involving
two different tasks. On a behavioral level, we found evidence for stimulus-congruence related
enhancement in performance, replicating our previous findings (Göschl et al., 2014). Within
the detection and the congruence evaluation task, differences in oscillatory dynamics
associated with pattern congruence were manifold and involved theta- (2-7 Hz), alpha- (8-13
Hz) and beta-band (13-25 Hz) frequencies, possibly pertaining to different subcomponents of
multisensory integration.
Comparing the detection and the congruence evaluation task, differences in anticipatory
neuronal activity were apparent in alpha- and beta-frequency ranges showing power values to
be less pronounced for the detection task. Additionally, task-related differences were
represented in theta-band power, showing stronger modulation in an early time window for
congruent stimulus pairs of the detection task as compared to matching pairs of the
congruence evaluation task.
In the following, we discuss stimulus congruence-related as well as task-related effects in our
visual-tactile matching paradigm in detail.
4.1 Detection task
Using stimulus material comparable to our study, the relevance of oscillatory brain activity in
mediating multisensory interactions has been shown before (Bauer et al., 2009; Bauer et al.,
2012; Kanayama and Ohira, 2009; Kanayama et al., 2012). Here, we add to the existing
literature by showing that the crossmodal relation of stimuli presented in two sensory
modalities is critical for performance and that congruence-related behavioral gains are
not peer-reviewed) is the author/funder. All rights reserved. No reuse allowed without permission. The copyright holder for this preprint (which was. http://dx.doi.org/10.1101/014092doi: bioRxiv preprint first posted online Jan. 22, 2015;
27
mediated by low frequency oscillatory activity. For the simultaneous detection of visual and
tactile targets, we find alpha-band decreases to be more pronounced for congruent targets as
compared to either incongruent target case. We suggest that this is indicative of strengthened
bottom-up stimulus processing related to crossmodal congruence. It has been proposed
recently that information transfer in the human brain is organized by inhibiting task-irrelevant
regions and that this functional inhibition is reflected in oscillatory activity in the alpha-band
(“gating by inhibition”, Jensen and Mazaheri, 2010; Jensen et al., 2014). In the current study,
alpha-band decreases found to be more prominent for congruent targets might be due to an
enhanced release from inhibition, mainly apparent in right central and left posterior scalp
areas. Using a navigation paradigm to investigate integration of vestibular and kinesthetic
information, alpha suppression in occipital, parietal and temporal clusters was strongest in
incongruent conditions, when different sensory modalities did not match (Ehinger et al.
2014). In that paradigm incongruent trials led to conflicting information, which should be
integrated by default. In the current task, however, targets had to be detected in either
modality, which is equivalent to a logical OR, and incongruent trials still had a well-defined
required response. Thus, given the proposed ties of alpha-band activity and attentional
processes (Jensen and Mazaheri, 2010; Klimesch, 2012; Palva and Palva, 2007), the stronger
alpha-band suppression found here might also be due to more attentional capture of congruent
stimulus pairs and subsequently lead to enhanced processing. Source estimation revealed
maxima for alpha-band differences to be located in prefrontal areas and parietal cortex
(supramarginal gyrus and somatosensory association cortex) which might point to enhanced
processing for congruent stimulus combinations in areas linked to multisensory integration
(Calvert, 2001; Ghazanfar and Schroeder, 2006).
Beta-band activity in a time interval directly preceding participants’ response on the task
differed significantly between congruent and incongruent visual-tactile stimulus pairs. There
is evidence that beta-band activity is related to multisensory processing (e.g. Senkowski et al.,
not peer-reviewed) is the author/funder. All rights reserved. No reuse allowed without permission. The copyright holder for this preprint (which was. http://dx.doi.org/10.1101/014092doi: bioRxiv preprint first posted online Jan. 22, 2015;

28
2006; Schepers et al., 2013) but its role in mediating crossmodal congruence effects is
unclear. Differences in late beta-band power found in the current experiment show maxima in
prefrontal areas, premotor and somatosensory association cortex. Therefore, we hypothesize
that processes of perceptual decision making may be reflected in these activation differences.
Recent work by Donner and colleagues (2007, 2009) has linked beta-band activity to choice
behavior in a visual motion detection task and stated that performance-predictive activity is
expressed in posterior parietal and prefrontal cortices. Given the match of differences in
behavioral performance for congruent VT targets, incongruent V and incongruent T targets
and late beta-band power for the different conditions, we speculate that beta-band power is
linked to decision making also in the current study. In this sense, congruent visual-tactile
stimulus pairs as compared to either incongruent target case might be viewed as stronger
sensory evidence for an upcoming decision and the corresponding motor response (press the
‘target’ button). This choice-related activity could be reflected in beta-band power (Donner et
al., 2007; Donner et al., 2009).
4.2 Congruence evaluation task
Within the congruence evaluation task, differences in oscillatory dynamics between matching
and non-matching visual-tactile pairs were restricted to late responses in the theta-range. In
general, the modulation of theta-frequencies in the integration of features across sensory
modalities is in agreement with previous reports (van Ackeren et al., 2014). For the
comparison of congruent and incongruent stimulation, theta-band power has been shown to be
more pronounced for the incongruent case which in turn has been linked to processes of
conflict monitoring and conflict resolution, respectively (Cohen and Donner, 2013; Cohen
and Ridderinkhof, 2013; Kanayama and Ohira, 2009). Here, we find theta-band power to be
stronger for congruent stimulus pairs and this effect is located in supramarginal gyrus, an area
of secondary somatosensory representation linked to a broad range of cognitive functions,
not peer-reviewed) is the author/funder. All rights reserved. No reuse allowed without permission. The copyright holder for this preprint (which was. http://dx.doi.org/10.1101/014092doi: bioRxiv preprint first posted online Jan. 22, 2015;

29
including texture and pattern discrimination (e.g. Hegner et al., 2010). Given the differences
in the definition of congruence between our study and related work (where congruence mostly
refers to spatial proximity) and the temporal structure of the observed effects, we suggest that
power increases found here may reflect inter-sensory facilitation effects in pattern
discrimination resulting from visual-tactile congruence. Nevertheless, one might speculate
that the centrally distributed negative cluster (though not reaching statistical significance)
apparent in Figure 5B relates to processes of conflict monitoring associated with response
selection.
4.3 Comparison between detection and congruence evaluation task
Direct comparison of neuronal activity between the detection and the congruence evaluation
task was limited by the different designs of the two tasks, which is why we focused on pre-
stimulus activity contrasts on the one hand and a comparison of oscillatory signatures
between congruent pairs of stimuli for the detection and the congruence evaluation task on
the other hand.
As suggested by the concept of functional inhibition by alpha-oscillations (Jensen and
Mazaheri, 2010; Jensen et al., 2014; see also Klimesch et al., 2007), we hypothesized that
differences in cognitive demands imposed by the two tasks would modulate preparatory
oscillatory activity differentially in alpha-/beta-frequencies (see also Mazaheri et al., 2014).
Contrasting alpha-band activity before stimulus onset for detection versus congruence
evaluation indeed yielded significant differences showing a power decrease in right-central
scalp locations. At the source level, maxima of these differences were located in posterior
cingulate cortex, superior temporal and supramarginal gyrus. Interpreted in the context of
multisensory perceptual gating this finding could point to a higher contribution of areas
related to multisensory processing (mainly the superior temporal gyrus; see Doermann and
Naumer, 2005; Ghazanfar and Schroeder, 2006) for the detection task. Alternatively, but
not peer-reviewed) is the author/funder. All rights reserved. No reuse allowed without permission. The copyright holder for this preprint (which was. http://dx.doi.org/10.1101/014092doi: bioRxiv preprint first posted online Jan. 22, 2015;

30
within the same framework of gating by inhibition, one could argue that the task difference
found here reflects processes related to working memory. The posterior cingulate cortex has
been linked to memory processes (Nielsen et al., 2005) and decreases in this area found in our
study possibly relate to either the maintenance of the target pattern in working memory or
preparatory activity for memory matching that are specific for the detection task.
Similarly, differences in beta-band power before stimulus onset between detection and
congruence evaluation task were mapped to a negative cluster in mainly right-hemispheric
regions. The spatial distribution was somewhat more extended, additionally containing
regions of angular gyrus and somatosensory association cortex. Again, decreased activity
could be interpreted in terms of higher engagement of these regions in the detection task.
Comparing the involvement of somatosensory association cortex between the tasks, we
propose that beta-band decreases for the detection task could also signal preparatory processes
of motor decision making. For the congruence evaluation task, these processes might be
delayed due to additional processing effort linked to explicitly evaluating the relation between
the visual and the tactile pattern. Support for this idea can be found in our previous study
(Göschl et al., 2014) reporting larger response latencies for the congruence evaluation task.
The interpretation of pre-stimulus differences in oscillatory alpha-band activity in the context
of working memory function is also compatible with the finding of increased theta-band
power in response to congruent visual-tactile stimulus pairs of the detection task as compared
to matching pairs of the congruence evaluation task. We propose that theta-band modulations
are indicative of working memory processes (concordant with recent work, see for example
Benchenane et al., 2011; Hsieh and Ranganath, 2014; Sauseng et al., 2010), which are more
relevant in the target detection than the congruence evaluation task. Beside somatosensory
association cortex and supramarginal gyrus, source estimation revealed difference maxima in
retrosplenial cortex, a region implicated in memory function (Vann et al., 2009), which
supports this interpretation.
not peer-reviewed) is the author/funder. All rights reserved. No reuse allowed without permission. The copyright holder for this preprint (which was. http://dx.doi.org/10.1101/014092doi: bioRxiv preprint first posted online Jan. 22, 2015;

31
Source reconstruction showed prominent involvement of parietal and superior temporal cortex
– brain regions traditionally implicated in multisensory integration – for both tasks of the
current study. Interestingly, we found evidence for more engagement of these regions in the
detection rather than the congruence evaluation task. Whereas stimulus congruence only
implicitly plays a role in the former task, the latter demands to explicitly evaluate the
crossmodal relation of the two stimuli. Future work needs to further determine the relation of
task demands and bottom-up stimulus congruence and their reflection in neuronal oscillations.
The lateralized stimulus setup realized in the current experiment permits to study inter-
hemispheric synchronization as a measure for multimodal interactions. The question whether
the observed cortical activations result from lateralized stimulation or rather from cortical
asymmetry goes beyond the scope of the current work and remains to be clarified in future
studies. However, the pronounced involvement of right-hemispheric cortical regions for the
spatial pattern matching task used here is well compatible with experimental evidence on a
dominant role of the right hemisphere in spatial processing (see for example Hegner et al.,
2010).
4.4 Conclusions
The current study adds to increasing evidence that neuronal oscillations are involved in
multisensory interactions. Specifically, oscillatory activity in lower frequency ranges (below
30 Hz) seems to be able to mediate long-range communication that is crucial for crossmodal
processing. Here we studied visual-tactile interactions as a model for integration in distributed
networks und found differences in oscillatory dynamics related to crossmodal congruence in
theta-, alpha- and beta-frequency ranges. We propose that these differences relate to distinct
subcomponents of multisensory integration, for instance processes of attentional capture,
multisensory gating and perceptual decision making.
not peer-reviewed) is the author/funder. All rights reserved. No reuse allowed without permission. The copyright holder for this preprint (which was. http://dx.doi.org/10.1101/014092doi: bioRxiv preprint first posted online Jan. 22, 2015;

32
5. Acknowledgments
This research was supported by grants from the German Research Foundation (SFB
936/A3/B6) and the European Union (ERC-2010-AdG-269716) awarded to A.K.E. and P.K.
The authors thank Julia Diestel for assistance in data recording, Till Schneider for helpful
discussions on previous versions of the manuscript and Guido Nolte as well as Arne Ewald
for methodological counseling.
not peer-reviewed) is the author/funder. All rights reserved. No reuse allowed without permission. The copyright holder for this preprint (which was. http://dx.doi.org/10.1101/014092doi: bioRxiv preprint first posted online Jan. 22, 2015;

33
6. References
Barutchu, A., Freestone, D. R., Innes-Brown, H., Crewther, D. P., & Crewther, S. G. (2013).
Evidence for Enhanced Multisensory Facilitation with Stimulus Relevance: An Electrophysiological Investigation. PLoS One, 8(1). doi:10.1371/journal.pone.0052978
Bauer, M., Kennett, S., & Driver, J. (2012). Attentional selection of location and modality in vision and touch modulates low-frequency activity in associated sensory cortices. Journal of Neurophysiology, 107(9), 2342–2351. doi:10.1152/jn.00973.2011
Bauer, M., Oostenveld, R., & Fries, P. (2009). Tactile stimulation accelerates behavioral responses to visual stimuli through enhancement of occipital gamma-band activity. Vision Research, 49(9), 931–942. doi:10.1016/j.visres.2009.03.014
Benchenane, K., Tiesinga, P. H., & Battaglia, F. P. (2011). Oscillations in the prefrontal cortex: a gateway to memory and attention. Current Opinion in Neurobiology, 21(3), 475–485. doi:10.1016/j.conb.2011.01.004
Calvert, G. A. (2001). Crossmodal Processing in the Human Brain: Insights from Functional Neuroimaging Studies. Cerebral Cortex, 11(12), 1110–1123. doi:10.1093/cercor/11.12.1110
Cohen, M. X. (2014). Analyzing Neural Time Series Data: Theory and Practice. MIT Press. Cohen, M. X., & Donner, T. H. (2013). Midfrontal conflict-related theta-band power reflects
neural oscillations that predict behavior. Journal of Neurophysiology, 110(12), 2752–2763. doi:10.1152/jn.00479.2013
Cohen, M. X., & Ridderinkhof, K. R. (2013). EEG source reconstruction reveals frontal-parietal dynamics of spatial conflict processing. PLoS One, 8(2), e57293. doi:10.1371/journal.pone.0057293
Delorme, A., & Makeig, S. (2004). EEGLAB: an open source toolbox for analysis of single-trial EEG dynamics including independent component analysis. Journal of Neuroscience Methods, 134(1), 9–21. doi:10.1016/j.jneumeth.2003.10.009
Diederich, A., & Colonius, H. (2007). Modeling spatial effects in visual-tactile saccadic reaction time. Perception & Psychophysics, 69(1), 56–67.
Doehrmann, O., & Naumer, M. J. (2008). Semantics and the multisensory brain: How meaning modulates processes of audio-visual integration. Brain Research, 1242, 136–150. doi:10.1016/j.brainres.2008.03.071
Doesburg, S. M., Emberson, L. L., Rahi, A., Cameron, D., & Ward, L. M. (2008). Asynchrony from synchrony: long-range gamma-band neural synchrony accompanies perception of audiovisual speech asynchrony. Experimental Brain Research, 185(1), 11–20. doi:10.1007/s00221-007-1127-5
Doesburg, S. M., Green, J. J., McDonald, J. J., & Ward, L. M. (2009). From local inhibition to long-range integration: A functional dissociation of alpha-band synchronization across cortical scales in visuospatial attention. Brain Research, 1303, 97–110. doi:10.1016/j.brainres.2009.09.069
Donner, T. H., & Siegel, M. (2011). A framework for local cortical oscillation patterns. Trends in Cognitive Sciences, 15(5), 191–199. doi:10.1016/j.tics.2011.03.007
Donner, T. H., Siegel, M., Fries, P., & Engel, A. K. (2009). Buildup of Choice-Predictive Activity in Human Motor Cortex during Perceptual Decision Making. Current Biology, 19(18), 1581–1585. doi:10.1016/j.cub.2009.07.066
Donner, T. H., Siegel, M., Oostenveld, R., Fries, P., Bauer, M., & Engel, A. K. (2007). Population Activity in the Human Dorsal Pathway Predicts the Accuracy of Visual Motion Detection. Journal of Neurophysiology, 98(1), 345–359. doi:10.1152/jn.01141.2006
Driver, J., & Spence, C. (2000). Multisensory perception: beyond modularity and convergence. Current Biology: CB, 10(20), R731–735.
not peer-reviewed) is the author/funder. All rights reserved. No reuse allowed without permission. The copyright holder for this preprint (which was. http://dx.doi.org/10.1101/014092doi: bioRxiv preprint first posted online Jan. 22, 2015;
34
Ehinger, B.V., Fischer, P., Gert, A.L., Kaufhold, L., Weber, F., Pipa, G., & König, P. (2014). Kinesthetic and vestibular information modulate alpha activity during spatial navigation: A mobile EEG study. Frontiers in Human Neuroscience, 8: 71. doi: 10.3389/fnhum.2014.00071
Engel, A. K., Fries, P., & Singer, W. (2001). Dynamic predictions: Oscillations and synchrony in top-down processing. Nature Reviews Neuroscience, 2(10), 704–716. doi:10.1038/35094565
Forster, B., Cavina-Pratesi, C., Aglioti, S. M., & Berlucchi, G. (2002). Redundant target effect and intersensory facilitation from visual-tactile interactions in simple reaction time. Experimental Brain Research, 143(4), 480–487. doi:10.1007/s00221-002-1017-9
Frassinetti, F., Bolognini, N., & Làdavas, E. (2002). Enhancement of visual perception by crossmodal visuo-auditory interaction. Experimental Brain Research, 147(3), 332–343. doi:10.1007/s00221-002-1262-y
Friese, U., Köster, M., Hassler, U., Martens, U., Trujillo-Barreto, N., & Gruber, T. (2013). Successful memory encoding is associated with increased cross-frequency coupling between frontal theta and posterior gamma oscillations in human scalp-recorded EEG. NeuroImage, 66, 642–647. doi:10.1016/j.neuroimage.2012.11.002
Ghazanfar, A. A., & Schroeder, C. E. (2006). Is neocortex essentially multisensory? Trends in Cognitive Sciences, 10(6), 278–285. doi:10.1016/j.tics.2006.04.008
Gillmeister, H., & Eimer, M. (2007). Tactile enhancement of auditory detection and perceived loudness. Brain Research, 1160, 58–68. doi:10.1016/j.brainres.2007.03.041
Gleiss, S., & Kayser, C. (2014a). Oscillatory mechanisms underlying the enhancement of visual motion perception by multisensory congruency. Neuropsychologia. doi:10.1016/j.neuropsychologia.2013.11.005
Gleiss, S., & Kayser, C. (2014b). Acoustic Noise Improves Visual Perception and Modulates Occipital Oscillatory States. Journal of Cognitive Neuroscience, 26(4), 699–711. doi:10.1162/jocn_a_00524
Göschl, F., Engel, A. K., & Friese, U. (2014). Attention modulates visual-tactile interaction in spatial pattern matching. PLoS One, 9(9), e106896. doi:10.1371/journal.pone.0106896
Hassler, U., Friese, U., Martens, U., Trujillo-Barreto, N., & Gruber, T. (2013). Repetition priming effects dissociate between miniature eye movements and induced gamma-band responses in the human electroencephalogram. European Journal of Neuroscience, 38(3), 2425–2433. doi:10.1111/ejn.12244
Hassler, U., Trujillo Barreto, N., & Gruber, T. (2011). Induced gamma band responses in human EEG after the control of miniature saccadic artifacts. NeuroImage, 57(4), 1411–1421. doi:10.1016/j.neuroimage.2011.05.062
Hegner, Y. L., Lee, Y., Grodd, W., & Braun, C. (2010). Comparing Tactile Pattern and Vibrotactile Frequency Discrimination: A Human fMRI Study. Journal of Neurophysiology, 103(6), 3115–3122. doi:10.1152/jn.00940.2009
Hipp, J. F., Engel, A. K., & Siegel, M. (2011). Oscillatory Synchronization in Large-Scale Cortical Networks Predicts Perception. Neuron, 69(2), 387–396. doi:10.1016/j.neuron.2010.12.027
Hsieh, L.-T., & Ranganath, C. (2014). Frontal midline theta oscillations during working memory maintenance and episodic encoding and retrieval. NeuroImage, 85, Part 2, 721–729. doi:10.1016/j.neuroimage.2013.08.003
Hummel, F., & Gerloff, C. (2005). Larger Interregional Synchrony is Associated with Greater Behavioral Success in a Complex Sensory Integration Task in Humans. Cerebral Cortex, 15(5), 670–678. doi:10.1093/cercor/bhh170
Jensen, O., & Mazaheri, A. (2010). Shaping functional architecture by oscillatory alpha activity: gating by inhibition. Frontiers in Human Neuroscience, 4, 186. doi:10.3389/fnhum.2010.00186
Jensen, O., Gips, B., Bergmann, T. O., & Bonnefond, M. (2014). Temporal coding organized by coupled alpha and gamma oscillations prioritize visual processing. Trends in Neurosciences, 37(7), 357–369. doi:10.1016/j.tins.2014.04.001
not peer-reviewed) is the author/funder. All rights reserved. No reuse allowed without permission. The copyright holder for this preprint (which was. http://dx.doi.org/10.1101/014092doi: bioRxiv preprint first posted online Jan. 22, 2015;

35
Jokisch, D., & Jensen, O. (2007). Modulation of Gamma and Alpha Activity during a Working Memory Task Engaging the Dorsal or Ventral Stream. The Journal of Neuroscience, 27(12), 3244–3251. doi:10.1523/JNEUROSCI.5399-06.2007
Kalcher, J., & Pfurtscheller, G. (1995). Discrimination between phase-locked and non-phase-locked event-related EEG activity. Electroencephalography and Clinical Neurophysiology, 94(5), 381–384.
Kanayama, N., & Ohira, H. (2009). Multisensory processing and neural oscillatory responses: separation of visuotactile congruency effect and corresponding electroencephalogram activities. Neuroreport, 20(3), 289–293. doi:10.1097/WNR.0b013e328322ca63
Kanayama, N., Tamè, L., Ohira, H., & Pavani, F. (2012). Top down influence on visuo-tactile interaction modulates neural oscillatory responses. NeuroImage, 59(4), 3406–3417. doi:10.1016/j.neuroimage.2011.11.076
Kayser, C., Petkov, C. I., & Logothetis, N. K. (2008). Visual Modulation of Neurons in Auditory Cortex. Cerebral Cortex, 18(7), 1560–1574. doi:10.1093/cercor/bhm187
Klimesch, W. (2012). Alpha-band oscillations, attention, and controlled access to stored information. Trends in Cognitive Sciences, 16(12), 606–617. doi:10.1016/j.tics.2012.10.007
Klimesch, W., Sauseng, P., & Hanslmayr, S. (2007). EEG alpha oscillations: The inhibition–timing hypothesis. Brain Research Reviews, 53(1), 63–88. doi:10.1016/j.brainresrev.2006.06.003
Lakatos, P., Chen, C. M., O’Connell, M. N., Mills, A., & Schroeder, C. E. (2007). Neuronal Oscillations and Multisensory Interaction in Primary Auditory Cortex. Neuron, 53(2), 279–292. doi:10.1016/j.neuron.2006.12.011
Macaluso, E., & Driver, J. (2005). Multisensory spatial interactions: a window onto functional integration in the human brain. Trends in Neurosciences, 28(5), 264–271. doi:10.1016/j.tins.2005.03.008
Maris, E., & Oostenveld, R. (2007). Nonparametric statistical testing of EEG- and MEG-data. Journal of Neuroscience Methods, 164(1), 177–190. doi:10.1016/j.jneumeth.2007.03.024
Mazaheri, A., van Schouwenburg, M. R., Dimitrijevic, A., Denys, D., Cools, R., & Jensen, O. (2014). Region-specific modulations in oscillatory alpha activity serve to facilitate processing in the visual and auditory modalities. NeuroImage, 87, 356–362. doi:10.1016/j.neuroimage.2013.10.052
McDonald, J. J., Teder-Sälejärvi, W. A., & Hillyard, S. A. (2000). Involuntary orienting to sound improves visual perception. Nature, 407(6806), 906–908. doi:10.1038/35038085
McGurk, H., & MacDonald, J. (1976). Hearing lips and seeing voices. Nature, 264(5588), 746–748.
Molholm, S., Ritter, W., Javitt, D. C., & Foxe, J. J. (2004). Multisensory Visual–Auditory Object Recognition in Humans: a High-density Electrical Mapping Study. Cerebral Cortex, 14(4), 452–465. doi:10.1093/cercor/bhh007
Murray, M. M., Foxe, J. J., Higgins, B. A., Javitt, D. C., & Schroeder, C. E. (2001). Visuo-spatial neural response interactions in early cortical processing during a simple reaction time task: a high-density electrical mapping study. Neuropsychologia, 39(8), 828–844. doi:10.1016/S0028-3932(01)00004-5
Nielsen, F. Å., Balslev, D., & Hansen, L. K. (2005). Mining the posterior cingulate: Segregation between memory and pain components. NeuroImage, 27(3), 520–532. doi:10.1016/j.neuroimage.2005.04.034
Nieuwenhuis, I. L. C., Takashima, A., Oostenveld, R., Fernández, G., & Jensen, O. (2008). Visual areas become less engaged in associative recall following memory stabilization. NeuroImage, 40(3), 1319–1327. doi:10.1016/j.neuroimage.2007.12.052
Nolte, G., & Dassios, G. (2005). Analytic expansion of the EEG lead field for realistic volume conductors. Physics in Medicine and Biology, 50(16), 3807–3823. doi:10.1088/0031-9155/50/16/010
not peer-reviewed) is the author/funder. All rights reserved. No reuse allowed without permission. The copyright holder for this preprint (which was. http://dx.doi.org/10.1101/014092doi: bioRxiv preprint first posted online Jan. 22, 2015;

36
Oostenveld, R., Fries, P., Maris, E., & Schoffelen, J.-M. (2011). FieldTrip: Open Source Software for Advanced Analysis of MEG, EEG, and Invasive Electrophysiological Data. Computational Intelligence and Neuroscience, 2011. doi:10.1155/2011/156869
Palva, S., & Palva, J. M. (2007). New vistas for α-frequency band oscillations. Trends in Neurosciences, 30(4), 150–158. doi:10.1016/j.tins.2007.02.001
Pascual-Marqui, R.D., 2007. Discrete, 3D distributed, linear imaging methods of electric neuronal activity. Part 1: Exact, Zero Error Localization, (arXiv:0710.3341 [math-ph], October 17, available: http://arxiv.org/abs/0710.3341)
Sauseng, P., Griesmayr, B., Freunberger, R., & Klimesch, W. (2010). Control mechanisms in working memory: A possible function of EEG theta oscillations. Neuroscience & Biobehavioral Reviews, 34(7), 1015–1022. doi:10.1016/j.neubiorev.2009.12.006
Schepers, I. M., Schneider, T. R., Hipp, J. F., Engel, A. K., & Senkowski, D. (2013). Noise alters beta-band activity in superior temporal cortex during audiovisual speech processing. NeuroImage, 70, 101–112. doi:10.1016/j.neuroimage.2012.11.066
Schneider, T. R., Engel, A. K., & Debener, S. (2008). Multisensory identification of natural objects in a two-way crossmodal priming paradigm. Experimental Psychology, 55(2), 121–132.
Schneider, T. R., Lorenz, S., Senkowski, D., & Engel, A. K. (2011). Gamma-Band Activity as a Signature for Cross-Modal Priming of Auditory Object Recognition by Active Haptic Exploration. The Journal of Neuroscience, 31(7), 2502–2510. doi:10.1523/JNEUROSCI.6447-09.2011
Senkowski, D., Molholm, S., Gomez-Ramirez, M., & Foxe, J. J. (2006). Oscillatory Beta Activity Predicts Response Speed during a Multisensory Audiovisual Reaction Time Task: A High-Density Electrical Mapping Study. Cerebral Cortex, 16(11), 1556–1565. doi:10.1093/cercor/bhj091
Senkowski, D., Schneider, T. R., Foxe, J. J., & Engel, A. K. (2008). Crossmodal binding through neural coherence: implications for multisensory processing. Trends in Neurosciences, 31(8), 401–409. doi:10.1016/j.tins.2008.05.002
Singer, W., & Gray, C. M. (1995). Visual Feature Integration and the Temporal Correlation Hypothesis. Annual Review of Neuroscience, 18(1), 555–586. doi:10.1146/annurev.ne.18.030195.003011
Singh, A. K., Okamoto, M., Dan, H., Jurcak, V., & Dan, I. (2005). Spatial registration of multichannel multi-subject fNIRS data to MNI space without MRI. NeuroImage, 27(4), 842–851. doi:10.1016/j.neuroimage.2005.05.019
Stein, B. E. (2012). The New Handbook of Multisensory Processing. Mit Press. Van Ackeren, M. J., Schneider, T. R., Müsch, K., & Rueschemeyer, S.-A. (2014). Oscillatory
Neuronal Activity Reflects Lexical-Semantic Feature Integration within and across Sensory Modalities in Distributed Cortical Networks. The Journal of Neuroscience, 34(43), 14318–14323. doi:10.1523/JNEUROSCI.0958-14.2014
Van Driel, J., Knapen, T., van Es, D. M., & Cohen, M. X. (2014). Interregional alpha-band synchrony supports temporal cross-modal integration. NeuroImage, 101, 404–415. doi:10.1016/j.neuroimage.2014.07.022
Van Ede, F, Lange, F. de, Jensen, O., & Maris, E. (2011). Orienting Attention to an Upcoming Tactile Event Involves a Spatially and Temporally Specific Modulation of Sensorimotor Alpha- and Beta-Band Oscillations. The Journal of Neuroscience, 31(6), 2016–2024. doi:10.1523/JNEUROSCI.5630-10.2011
Van Ede, F., Szebényi, S., & Maris, E. (2014). Attentional modulations of somatosensory alpha, beta and gamma oscillations dissociate between anticipation and stimulus processing. NeuroImage, 97, 134–141. doi:10.1016/j.neuroimage.2014.04.047
Vann, S. D., Aggleton, J. P., & Maguire, E. A. (2009). What does the retrosplenial cortex do? Nature Reviews Neuroscience, 10(11), 792–802. doi:10.1038/nrn2733
not peer-reviewed) is the author/funder. All rights reserved. No reuse allowed without permission. The copyright holder for this preprint (which was. http://dx.doi.org/10.1101/014092doi: bioRxiv preprint first posted online Jan. 22, 2015;

37
Varela, F., Lachaux, J.-P., Rodriguez, E., & Martinerie, J. (2001). The brainweb: Phase synchronization and large-scale integration. Nature Reviews Neuroscience, 2(4), 229–239. doi:10.1038/35067550
Von Stein, A., Chiang, C., & König, P. (2000). Top-down processing mediated by inter-areal synchronization. Proc Natl Acad Sci USA, 97, 14748-14753. doi:10.1073/pnas.97.26.14748
Womelsdorf, T., Schoffelen, J.-M., Oostenveld, R., Singer, W., Desimone, R., Engel, A. K., & Fries, P. (2007). Modulation of Neuronal Interactions Through Neuronal Synchronization. Science, 316(5831), 1609–1612. doi:10.1126/science.1139597
not peer-reviewed) is the author/funder. All rights reserved. No reuse allowed without permission. The copyright holder for this preprint (which was. http://dx.doi.org/10.1101/014092doi: bioRxiv preprint first posted online Jan. 22, 2015;