osiris observations...
TRANSCRIPT
Astronomy & Astrophysics manuscript no. cg_bright c©ESO 2015June 3, 2015
OSIRIS observations of meter-sized exposures of H2O ice at thesurface of 67P/Churyumov-Gerasimenko and interpretation using
laboratory experimentsA. Pommerol1, N. Thomas1, M. R. El-Maarry1, M. Pajola2, O. Groussin3, A. -T. Auger3, N. Oklay4, S. Fornasier5, C.
Feller5, B. Davidsson6, A. Gracia-Berná1, B. Jost1, R. Marschall1, O. Poch1, M. A. Barucci5, J. -L. Bertaux7, F. LaForgia8, H. U. Keller9, 10, E. Kührt9, S. C. Lowry11, S. Mottola9, G. Naletto2, 12, 13, H. Sierks4, C. Barbieri8, P. L.
Lamy3, R. Rodrigo14, 15, D. Koschny16, H. Rickman6, 17, J. Agarwal4, M. F. A’Hearn18, I. Bertini2, S. Boudreault4, G.Cremonese19, V. Da Deppo13, M. De Cecco20, S. Debei21, C. Güttler4, M. Fulle22, P. J. Gutierrez22, S. F. Hviid9, W. -H.
Ip24, L. Jorda3, J. Knollenberg9, G. Kovacs4, J. -R. Kramm4, E. Küppers25, L. Lara23, M. Lazzarin8, J. L. LopezMoreno23, F. Marzari8, H. Michalik26, F. Preusker9, F. Scholten9, C. Tubiana4, and J. -B. Vincent4
(Affiliations can be found after the references)
Received February 27, 2015; accepted Mai 15, 2015
ABSTRACT
Since OSIRIS started acquiring high-resolution observations of the surface of the nucleus of comet 67P/Churyumov-Gerasimenko,over one hundred meter-sized bright spots have been identified in numerous types of geomorphologic regions, but mostly located inareas receiving low insolation. The bright spots are either clustered, in debris fields close to decameter-high cliffs, or isolated withoutstructural relation to the surrounding terrain. They can be up to ten times brighter than the average surface of the comet at visiblewavelengths and display a significantly bluer spectrum. They do not exhibit significant changes over a period of a few weeks. All theseobservations are consistent with exposure of water ice at the surface of boulders produced by dislocation of the weakly consolidatedlayers that cover large areas of the nucleus. Laboratory experiments show that under simulated comet surface conditions, analogsamples acquire a vertical stratification with an uppermost porous mantle of refractory dust overlaying a layer of hard ice formed byrecondensation or sintering under the insulating dust mantle. The evolution of the visible spectrophotometric properties of samplesduring sublimation is consistent with the contrasts of brightness and color seen at the surface of the nucleus. Clustered bright spotsare formed by the collapse of overhangs that is triggered by mass wasting of deeper layers. Isolated spots might be the result of theemission of boulders at low velocity that are redepositioned in other regions.
Key words. comets: general – techniques: image processing – methods: laboratory: solid state
1. Introduction
All cometary nuclei observed so far from spacecraft or ground-based telescopes show a very low visible albedo, in the range of2 to 5 percent (Lamy et al. 2004; Barucci et al. 2011). Althoughthe close subsurface of the nucleus must be rich in ices to ac-count for the observed gas emissions as the nucleus comes intothe vicinity of the Sun, the volatile component is strongly de-pleted at the surface due to sublimation. As a result, the upper-most layer of the nucleus, which interacts with solar radiation,is essentially composed of refractory organic and mineral mat-ter. Two mechanisms can be involved in the production of thissurface mantle: persistence of a sublimation lag after the ice hassublimated and/or accumulation of dust lifted up from the sur-face by gas drag that was then redeposited at a distant location(Thomas et al. 2015; Davidsson et al. this issue; Thomas et al.this issue).
Although the surfaces of the comet nuclei visited so far arerelatively homogeneous, some of them still show some signif-icant variability in their surface albedo and spectral properties.This is the case in particular of the nucleus of comet 9P/Tempel1, which displays regions about 30% brighter than surroundingareas at visible wavelengths (Li et al. 2007, 2013). Correlation
of visible images and infrared spectra obtained by the imagersand spectrometers of the Deep Impact spacecraft showed thatthe brighter areas also display subtle spectral signatures of H2Oice at 1.5 and 2.0µm. Modeling of these absorptions indicates 3to 6% of H2O ice agglomerates at the surface with diameters be-tween 10 and 50µm (Sunshine et al. 2006). Observations of thenucleus of comet 103P/Hartley 2 by the same instruments alsorevealed regions of the nucleus with a reflectance of about twicethe average reflectance of the surface, associated with a bluervisible slope (Li et al. 2013). By comparison with what has beenobserved on 9P/Tempel 1, these observations are also indicativeof the presence of H2O ice at the surface in these regions (Sun-shine et al. 2012).
Until the recent in situ investigations of the surface of67P/Churyumov-Gerasimenko (hereafter 67P) by the Philae lan-der of the Rosetta mission, the physical properties of the upperdesiccated layer that covers most of the nucleus surface couldonly be inferred indirectly by interpreting remote-sensing dataor from experimental results and theoretical considerations. Ex-periments in space simulators using analog material, in partic-ular those performed at the Deutsches Zentrum für Luft- undRaumfahrt (DLR) of Cologne in the 1980s (“Kometensimula-tion” KOSI program; Gruen et al. (1991)) and at the Institut für
Article number, page 1 of 16
Article published by EDP Sciences, to be cited as http://dx.doi.org/10.1051/0004-6361/201525977
A&A proofs: manuscript no. cg_bright
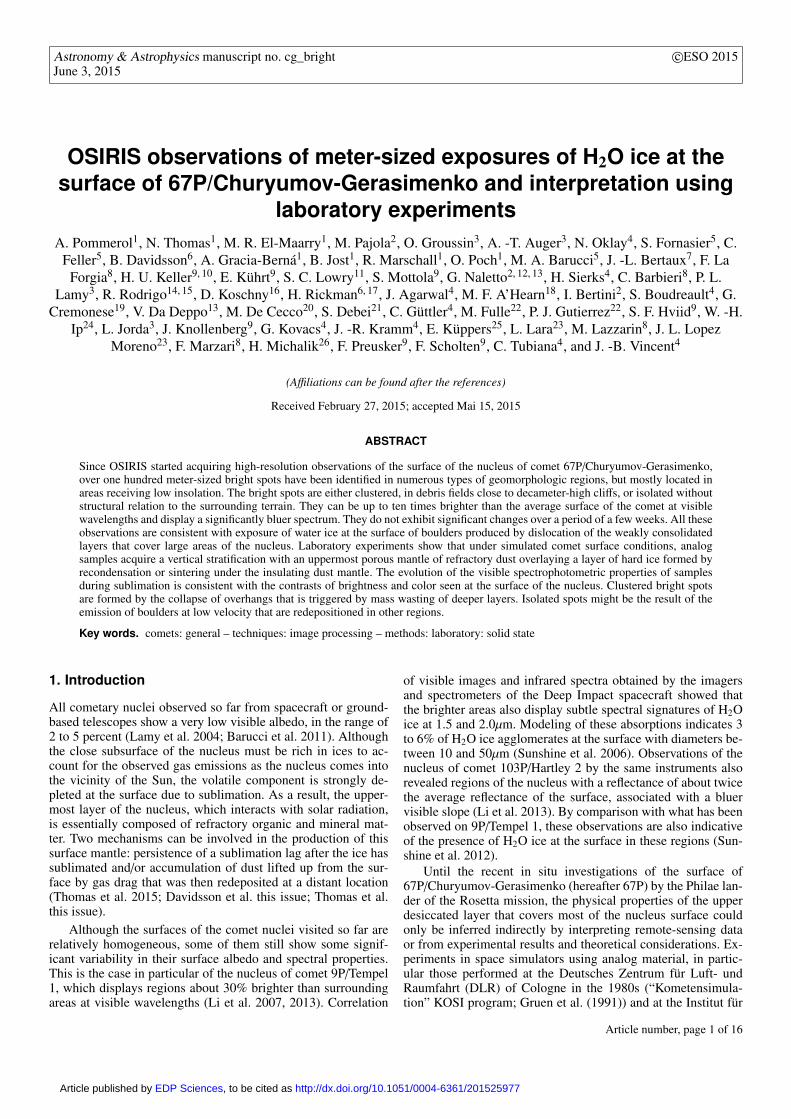
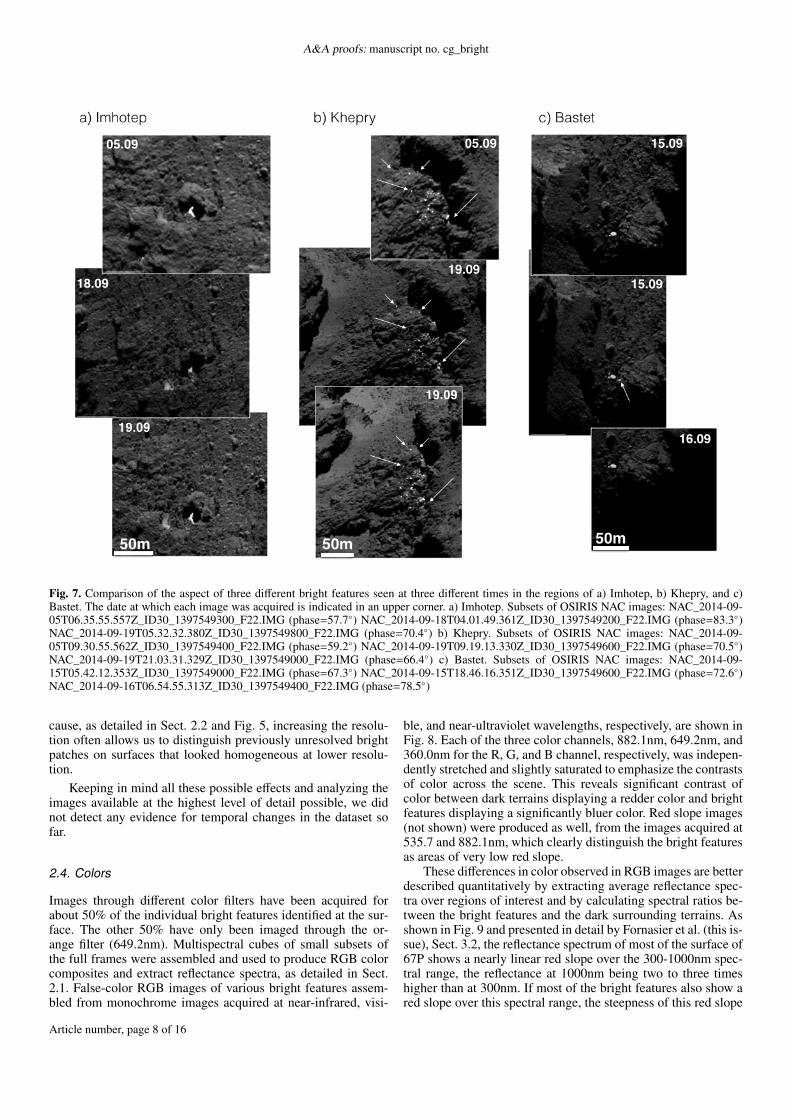
Fig. 1. Examples of clusters of bright spots observed in four different regions of the comet: a) Khepry, b) Imhotep, c)Ash, and d) Anouket. Clusters of bright spots are frequently observed in debris fields in the vicinity of decameter-highcliffs. They are generally found in areas receiving low insulation, as suggested by the amount of shadow in the images.a) Khepry. Subset of OSIRIS NAC image: NAC_2014-09-30T04.43.14.587Z_ID30_1397549100_F22.IMG b) Imhotep. Sub-set of OSIRIS NAC image: NAC_2014-09-30T01.23.46.579Z_ID30_1397549100_F22.IMG c) Ash. Subset of OSIRIS NAC im-age: NAC_2014-09-19T18.34.00.344Z_ID30_1397549800_F22.IMG d) Anouket. Subset of OSIRIS NAC image: NAC_2014-09-16T09.43.48.370Z_ID30_1397549200_F22.IMG
Weltraumforschung (IWF) of Graz in the 1990s (Kömle et al.1996) have provided quantities of information on the structureof the uppermost layer of the nucleus and the physical processesthat affect this layer. Exposed to vacuum and low temperature,mixtures of volatiles and refractory dust evolve rapidly to formstratified samples with a fully desiccated uppermost layer fromwhich grains are regularly ejected, overlaying an ice-rich inte-rior in which the ice has evolved by recondensation and sinter-ing. These evolutions have strong effects on the mechanical, ther-mal, and spectrophotometric properties of the samples. However,as explained by Keller & Markiewicz (1991), performing a realsimulation of a comet surface on Earth is impossible, and the ap-plication of laboratory results to the case of a real comet is neverstraightforward.
More recently, a few groups have initiated new experimentsin which analogs for cometary material are exposed to low-temperature and low-pressure environments, focusing on a fewparticular points that were not directly or fully addressed in pre-
vious experiment campaigns. Gundlach et al. (2011) studied theeffect of mineral dust on the sublimation to derive the subli-mation coefficient of water ice in the presence of impurities.Kossacki & Leliwa-Kopystynski (2014) showed that even smallamounts of dissolved minerals mixed within the ice affect thetemperature dependence of its sublimation coefficient. Brownet al. (2012) and Moores et al. (2012) studied how contaminantsin the water ice affect the isotopic composition of the water vaporemitted from dusty samples during long-duration (up to 35 days)sublimation experiments. The Laboratory for Outflow Studies ofSublimating materials (LOSSy) has been set up at the Universityof Bern with the aim to characterize the visible spectrophoto-metric properties of analogs of solar system icy surfaces with aspecial emphasis on comets (Pommerol et al. 2011, 2015; Pochet al. submitted). New sublimation experiments have been under-taken using modern digital imaging techniques to characterizesimultaneously and in situ the evolution of the texture and spec-trophotometric properties of the surface of various samples ex-
Article number, page 2 of 16
A. Pommerol et al.: OSIRIS observations of metre-size exposures of H2O ice
a)
b)
c)
d)
e)
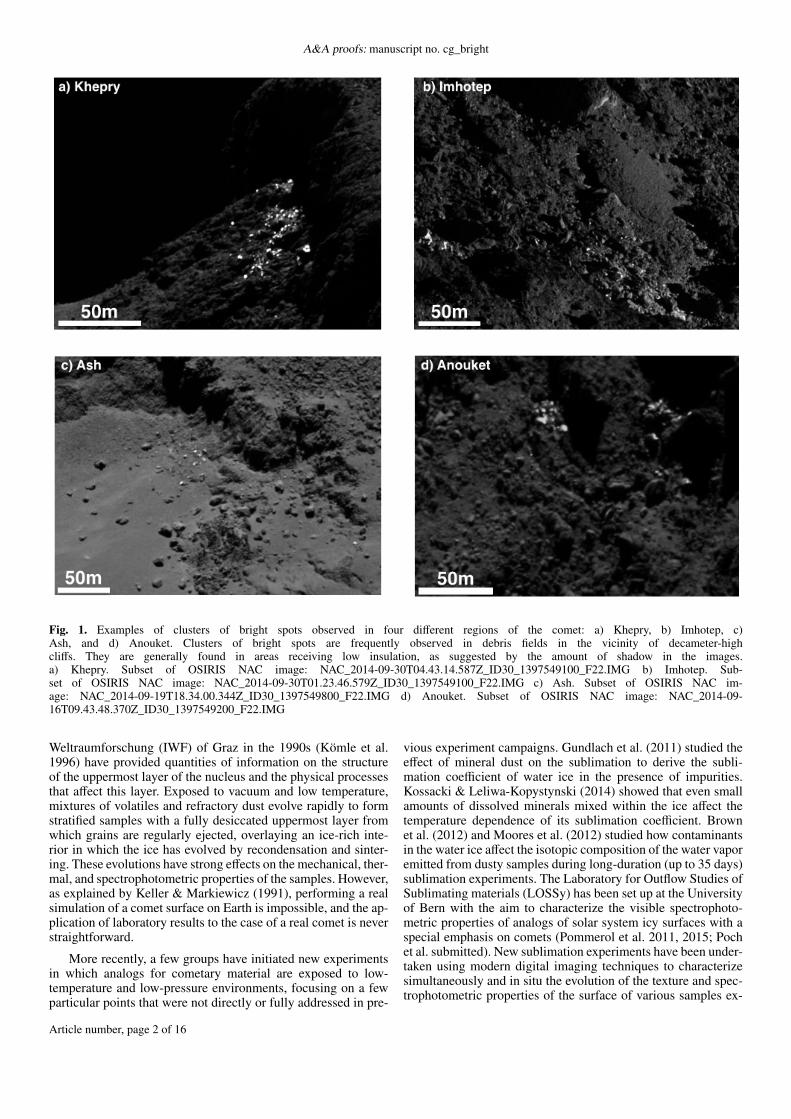
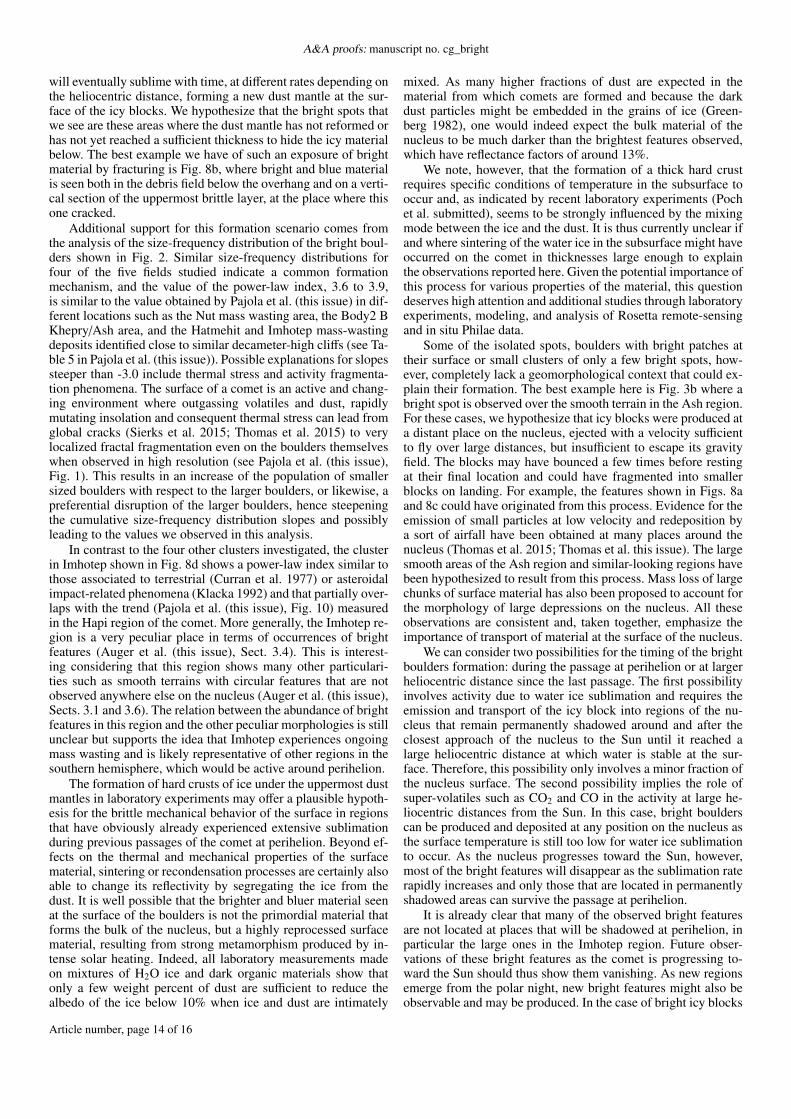
Fig. 2. Cumulative size-frequency distributions for five clusters of bright features. Boulders with a dimension greater than one to two meters havebeen considered for these distributions, depending on the resolution of these images. The index of the power-law distribution fitted on the data isindicated in each plot.
posed to vacuum and low temperature for durations of a few tensof hours. The results of these various experiments are used hereto interpret some of the most intriguing observations of comet67P by the scientific camera onboard Rosetta.
Since the acquisition of the first resolved image of the nu-cleus of comet 67P in June 2014, the Optical, Spectroscopic,and Infrared Remote Imaging System (OSIRIS), the Narrow An-gle Camera (NAC), and the Wide Angle Camera (WAC) on-board ESA’s Rosetta spacecraft (Keller et al. 2007) have scru-tinized the surface under changing illumination conditions, vari-able spatial resolution, and in different wavelength bands, pro-ducing the most detailed atlas yet of a comet nucleus surface.Global color images of the nucleus reveal a generally dark (ge-ometric albedo of 5.9% at 550nm, Sierks et al. (2015)), red (redslope of 11%/(100nm) at 1.3◦ phase angle), and homogeneoussurface with the exception of the Hapi region, which displaysa slightly higher reflectance (by 16%) and is notably bluer (redslope 50% less steep) than the rest of the surface (Fornasier et al.(this issue), Fig. 6). Similarities with the bright and blue H2Oice-bearing regions on Tempel 1 and Hartey 2 might indicatethe possible presence of a small fraction of H2O ice mixed withrefractory material at the surface of Hapi, an interpretation ten-tatively confirmed by the Visual, Infrared and Thermal Imag-ing Spectrometer (VIRTIS) (Capaccioni et al. 2015). The surfaceis strongly backscattering (i.e., the surface reflectance decreasesnonlinearly by a factor of 5 as the phase angle increases from 0to 60◦) and shows a significant phase reddening (i.e., the visiblered slope increases from 11 to 16%/(100nm) as the phase angleincreases from 0 to 60◦) (Fornasier et al. (this issue), Sect. 3.3).
At a small scale however, the surface is much more hetero-geneous. As the spatial resolution of the images was increas-ing from June to October 2014, more and more variability atthe smallest resolved scale could be observed in the form ofisolated or clustered bright spots with a strong contrast of the
albedo compared to the surrounding surfaces and a distinctivebluer color. In this article, we analyze the properties of thesesmall bright features as observed by OSIRIS until early Novem-ber 2014, before Philae separation and landing, and we interpretthem by means of comparisons with the results of past and recentlaboratory experiments.
Section 2 is devoted to the description of the bright features,as they appear in OSIRIS NAC images. They are classified ac-cording to their morphology and the regions of the nucleus inwhich they are observed. We compare images of given featuresacquired at different times to assess their potential temporal vari-ability. Their relative reflectance through the different NAC fil-ters is derived, and false-color images and reflectance spectraare generated. We conclude that the bright spots are exposuresof dirty H2O ice. Section 3 presents interpretations of the resultsof recent comet laboratory experiments (Pommerol et al. 2015;Poch et al. submitted) as well as a summary of past results, whichare particularly relevant for the understanding of the nature andorigin of the bright features observed at the surface of the nu-cleus of 67P. The comparison between the OSIRIS observationsand results of laboratory experiments is further detailed in Sect. 4where implications regarding the nature and origin of the brightspots observed at the surface of 67P are proposed. Section 5 sum-marizes this discussion and lists our main conclusions.
2. OSIRIS observations
2.1. Data and methods
As most of the features studied in this article are only a fewmeters wide, we have restricted our analysis to the data of theNarrow Angle Camera (NAC), a framing camera of 2048x2048pixels with 18.6 µrad/pixel angular resolution and a 2.2◦ field ofview (Keller et al. 2007). Two filter wheels in front of the detec-tor are used to switch between bandpass filters and acquire series
Article number, page 3 of 16
A&A proofs: manuscript no. cg_bright
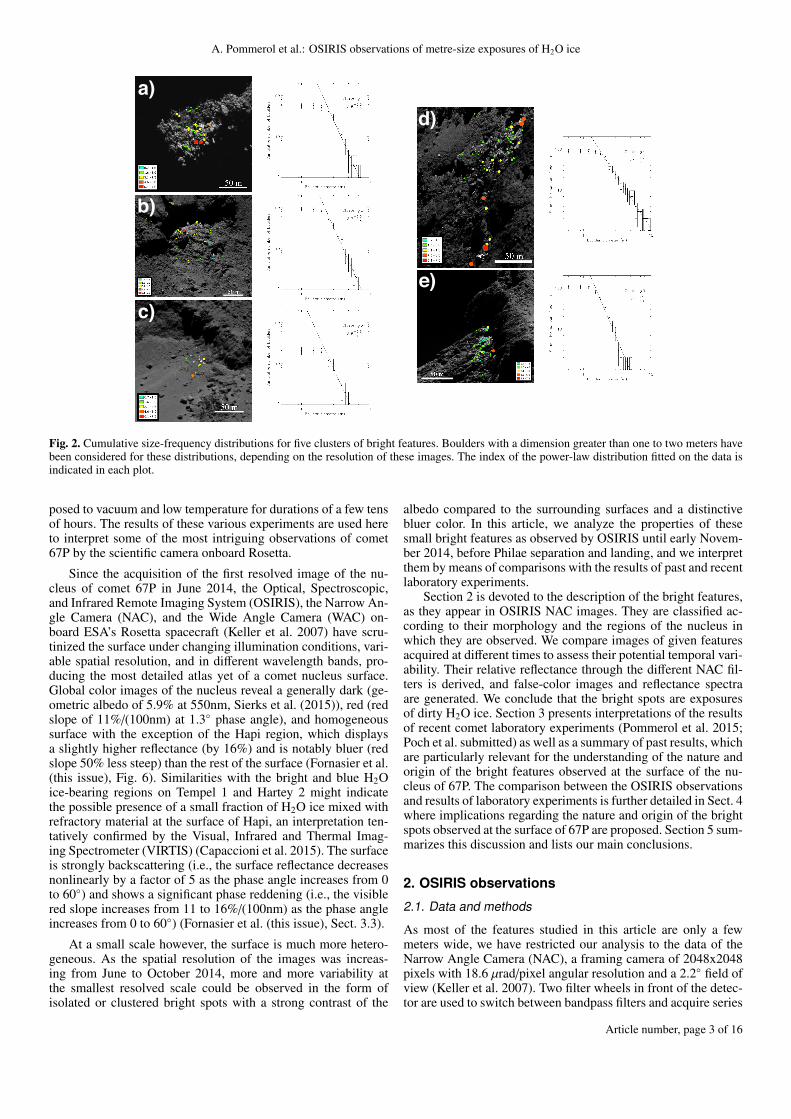
Fig. 3. Examples of isolated bright spots observed in four different regions of the comet: a) Boundary between Ma’at and Maftet, b)Ash, and c) Atum, d) boundary between Hatmehit and Bastet. While the examples shown in a), c), and d) are all inside regions con-sisting of consolidated material, b) shows the example of an isolated bright spot lying in the smooth dusty terrain that covers the regionof Ash. a) Ma’at-Maftet. Subset of OSIRIS NAC image: NAC_2014-10-05T23.54.02.593Z_ID30_1397549500_F22.IMG b) Ash. Subset ofOSIRIS NAC image: NAC_2014-10-03T23.22.22.559Z_ID30_1397549500_F22.IMG c) Atum. Subset of OSIRIS NAC image: NAC_2014-10-04T19.16.24.527Z_ID30_1397549500_F22.IMG d) Hatmehit-Bastet: NAC_2014-10-04T19.16.24.527Z_ID30_1397549500_F22.IMG
of monochrome images in up to 11 different wavelengths fromthe ultraviolet (269nm) to the near-infrared (989nm). Because ofthe time needed to switch filters and trigger a new image acqui-sition, the different images of a color series are taken at intervalsof time of about 15 seconds. As the comet rotates and the space-craft moves onto its trajectory during this time, it is necessary tofirst coregister the images acquired through the different filtersto produce a multispectral cube from which color images can beproduced and reflectance spectra extracted.
We used images acquired between the beginning of August2014 (arrival of Rosetta at the comet) and the beginning ofNovember 2014 (release of Philae). The average distance fromthe spacecraft to the surface decreased by steps from 125km inAugust to 10km in October. As a result, the resolution of theimages varies from about 2 meters to 0.17m/pixel. The helio-centric distance decreased from 3.6 to 3.0 AU during this pe-
riod of time. The coverage of the surface during this mappingphase is not homogeneous, some regions having been imagedmore frequently than others. The illumination conditions alsoshow extreme variations across the surface, of which 30% wasstill permanently shadowed and had never been observed dur-ing the mapping phase. A high-resolution and accurate digitalterrain model (DTM) is thus crucial to retrieve absolute valuesof reflectance from the images. The phase angle is also highlyvariable among images; it varies between 35◦ and 115◦ for thesubset of the NAC dataset used in this work. Data were calibratedthrough the standard OSIRIS calibration pipeline (Tubiana et al.this issue). We used here the level 3 images, calibrated into spec-tral radiance units [W m−2 Sr−1 nm−1].
To establish a catalog of the bright features at the surface ofthe nucleus, we have visually inspected all NAC images acquiredthrough the orange filter (649.2nm), which is the filter most of-
Article number, page 4 of 16

A. Pommerol et al.: OSIRIS observations of metre-size exposures of H2O ice
Fig. 4. Examples of boulders displaying bright patches on their surface in four different regions of the comet: a) Boundary be-tween Ma’at and Maftet, b) Atum, c) boundary between Serqet and Anuket, d) Hatmehit. These boulders are about 10 meterslong. The bright spots are typically one to two meters in diameter. The bright stripes in images a) and b) are also about oneto two meters wide. a) Ma’at-Maftet. Subset of OSIRIS NAC image: NAC_2014-10-05T23.54.02.593Z_ID30_1397549500_F22.IMG b)Atum. Subset of OSIRIS NAC image: NAC_2014-11-03T12.17.55.805Z_ID30_1397549000_F22.IMG c) Serqet-Anuket. Subset of OSIRISNAC image: NAC_2014-09-29T07.12.53.553Z_ID30_1397549400_F22.IMG d) Hatmehit. Subset of OSIRIS NAC image: NAC_2014-09-30T20.44.47.569Z_ID30_1397549300_F22.IMG
ten used for surface mapping. We looked for small features withhigh brightness that could not obviously be explained by localtopography and illumination effects. The main difficulty at thisstage was to distinguish small bright features at the surface fromthe effect of cosmic rays hitting the detector. We adopted a two-step process, in which we first selected all bright features regard-less of their possible origin, and in a second step identified thefeatures that certainly were surface features. This distinction wasmade on the basis of multiple observations of the same featuresin different images, observation of the shape and brightness ofthe bright feature at full scale, and/or identification of the fea-ture in the different color frames in the case where images wereacquired through different filters.
In the absence of a global coordinate system for the mappingof the surface of 67P, we recorded the locations of the bright fea-tures by saving the pixel coordinates of rectangular sub-framesand systematically identified the regions in which the featureswere observed, following the up-to-date definitions of El-Maarryet al. (this issue). The pixel scales of all images were calculated
using the SPICE toolkit and mission kernels provided by ESA.We note that these pixel scales are estimated for a calculated dis-tance of the spacecraft to the center of the comet and do not takeinto account the distance of the surface to the center. Therefore,a relative uncertainty in the range of a few percent for the mostdistant observations and up to 20% for the closest observationsmust be considered for all scale bars shown in this article.
The heliocentric distance of 67P at the time of imaging wascalculated with the SPICE toolkit as well. This value was usedto compute the surface reflectance by scaling the reference solarspectral irradiance measured at the top of Earth’s atmosphere tothe current heliocentric distance. A major difficulty in derivingthe reflectance factor of small surface features is the determi-nation of the local incidence angle, which requires an accurateDTM. We used here the most resolved DTM available withinthe OSIRIS team at the time of this analysis, which contains5899067 vertices with an average resolution of 2 meters/pixel.Using this DTM together with orbit information from SPICE anda 3D visualization engine, we calculated maps of the incidence
Article number, page 5 of 16
A&A proofs: manuscript no. cg_bright
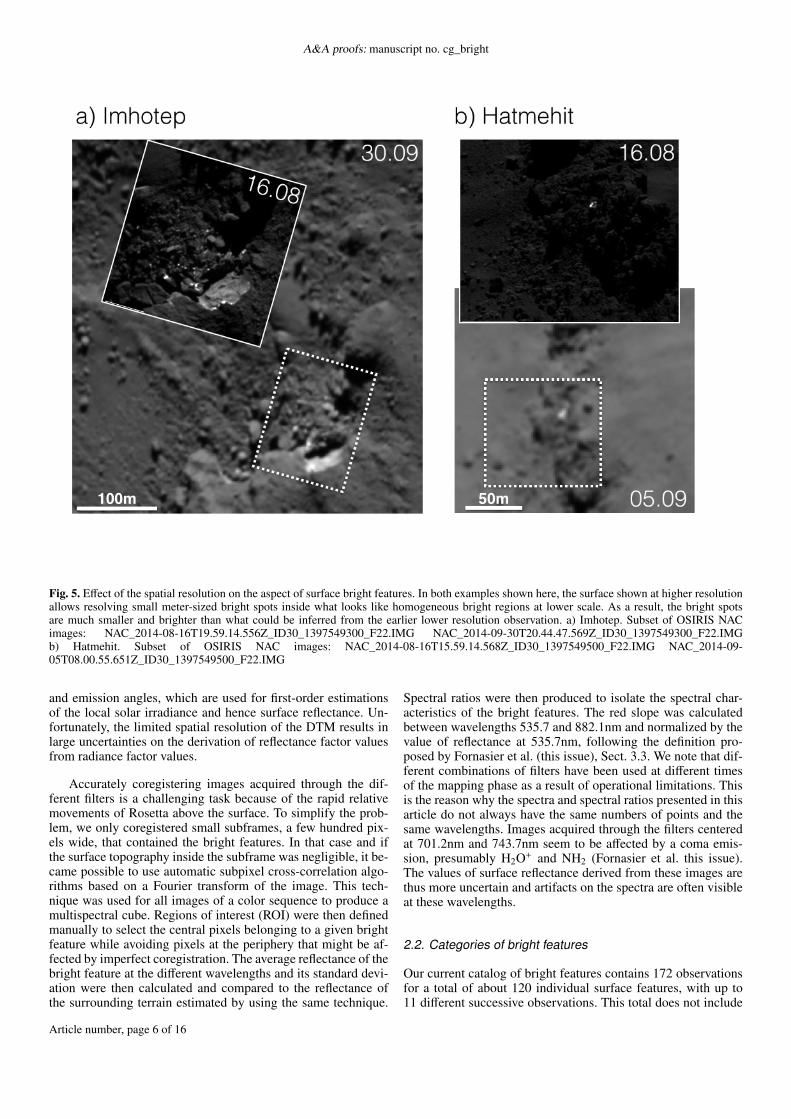
Fig. 5. Effect of the spatial resolution on the aspect of surface bright features. In both examples shown here, the surface shown at higher resolutionallows resolving small meter-sized bright spots inside what looks like homogeneous bright regions at lower scale. As a result, the bright spotsare much smaller and brighter than what could be inferred from the earlier lower resolution observation. a) Imhotep. Subset of OSIRIS NACimages: NAC_2014-08-16T19.59.14.556Z_ID30_1397549300_F22.IMG NAC_2014-09-30T20.44.47.569Z_ID30_1397549300_F22.IMGb) Hatmehit. Subset of OSIRIS NAC images: NAC_2014-08-16T15.59.14.568Z_ID30_1397549500_F22.IMG NAC_2014-09-05T08.00.55.651Z_ID30_1397549500_F22.IMG
and emission angles, which are used for first-order estimationsof the local solar irradiance and hence surface reflectance. Un-fortunately, the limited spatial resolution of the DTM results inlarge uncertainties on the derivation of reflectance factor valuesfrom radiance factor values.
Accurately coregistering images acquired through the dif-ferent filters is a challenging task because of the rapid relativemovements of Rosetta above the surface. To simplify the prob-lem, we only coregistered small subframes, a few hundred pix-els wide, that contained the bright features. In that case and ifthe surface topography inside the subframe was negligible, it be-came possible to use automatic subpixel cross-correlation algo-rithms based on a Fourier transform of the image. This tech-nique was used for all images of a color sequence to produce amultispectral cube. Regions of interest (ROI) were then definedmanually to select the central pixels belonging to a given brightfeature while avoiding pixels at the periphery that might be af-fected by imperfect coregistration. The average reflectance of thebright feature at the different wavelengths and its standard devi-ation were then calculated and compared to the reflectance ofthe surrounding terrain estimated by using the same technique.
Spectral ratios were then produced to isolate the spectral char-acteristics of the bright features. The red slope was calculatedbetween wavelengths 535.7 and 882.1nm and normalized by thevalue of reflectance at 535.7nm, following the definition pro-posed by Fornasier et al. (this issue), Sect. 3.3. We note that dif-ferent combinations of filters have been used at different timesof the mapping phase as a result of operational limitations. Thisis the reason why the spectra and spectral ratios presented in thisarticle do not always have the same numbers of points and thesame wavelengths. Images acquired through the filters centeredat 701.2nm and 743.7nm seem to be affected by a coma emis-sion, presumably H2O+ and NH2 (Fornasier et al. this issue).The values of surface reflectance derived from these images arethus more uncertain and artifacts on the spectra are often visibleat these wavelengths.
2.2. Categories of bright features
Our current catalog of bright features contains 172 observationsfor a total of about 120 individual surface features, with up to11 different successive observations. This total does not include
Article number, page 6 of 16
A. Pommerol et al.: OSIRIS observations of metre-size exposures of H2O ice
the cases of some imaging sequences where the features wererapidly imaged at intervals of time of only a few minutes. Be-cause of the very similar resolution, illumination, and observa-tional conditions, they were considered as single observations.
We classified the observed bright features into three cate-gories: clusters of bright features (more than three bright spots,Fig. 1, 2), isolated bright features (up to three individuals in closevicinity, Fig. 3), and boulders displaying bright patches at theirsurface (Fig. 4). The four examples of clusters of bright featuresshown in Fig. 1 are representative of the 18 clusters currentlyidentified at the surface of the nucleus. They consist of up to afew tens of meter-sized boulders spread over a few decameters.They are often observed in the immediate vicinity of decameter-high cliffs in the regions consisting of brittle material (Thomaset al. (2015),El-Maarry et al. (this issue), Table 1). Some of theclusters of bright features observed here seem to be a particularcase of boulder clusters identified at many places over the nu-cleus and studied in detail by Pajola et al. (this issue). The largemajority of these boulder clusters do not show any contrast ofbrightness with the surrounding terrains; bright clusters seem tobe an exception.
For five of the about twenty bright clusters identified at thesurface of the nucleus, we counted and measured the diametersof the bright spots following the definitions and methods pre-sented in detail by Pajola et al. (this issue), Sect. 3, to derivetheir cumulative size-frequency distribution. The main goal ofthis statistical analysis is to compare the diameter distributions ofthe bright boulders with those derived for the numerous boulderclusters located across the surface of 67P, which do not displayany particular color or brightness variability.
The specific areas analyzed are presented together with theboulder classification and location in Fig. 2. Clusters 1, 2, 3,and 5 are all located in the immediate vicinity of decameter-high cliffs, whereas cluster 4 is located in a different geomor-phologic setting, on the wall of a cliff. For each of the clus-ters, we computed the cumulative size-frequency distribution bytaking into consideration only the boulder diameters that satisfythe three-pixel sampling rule to be quite sure of their extraction(Pajola et al. (this issue), Sect. 3). Depending on the resolutionof the images, these values are between 1 and 2 m. Neverthe-less, Fig. 2 shows that even smaller boulders with dimensionsbetween 0.7 and 1.5 m have been identified, thanks to shadowson the surface favored by the phase angle of the observations.However, these bright boulders have not been taken into accountin the power-law fit since they are not statistically significant.
The power-law indices derived from the fits are shown in Fig.2. Clusters 1, 2, 3, and 5 (Fig. 2a,b,c, and e) display similar trendsand are entirely superimposed when the measured error bars aretaken into consideration; in contrast, cluster 4 (Fig. 2d) can beconsidered as an outlier, since the measured slope is differentfrom that of the others. The meaning of the power-law indicesderived here and their general behavior are discussed in detail inSect. 4.
Isolated bright spots can be observed in all types of regions.Figures 3a, c, and d all show bright spots over the consolidatedfractured material observed in many other regions of the nucleus,whereas Fig. 3b shows an example of a bright spot lying at thesurface of the smooth dust unit that covers large areas of the Ashregion. The relation between these bright spots and the surround-ing terrain is generally unclear. In some cases, such as Fig. 3d,the bright spot seems to be part of the unit over which it appears.In other cases, such as Fig. 3b, there is no evidence of a structuralrelation between the bright particle and the local unit.
Boulders displaying bright patches at their surface (Fig. 4)are observed both as clusters and isolated. The shape of thebright patches visible on their surfaces is relatively variable, of-ten consisting of some circular bright spots and/or stripes, gen-erally around the periphery (Figs. 4a,b, and c). In general, mostof the surface shows a reflectance similar to the surrounding ter-rain, and the bright fraction only occupies a minor part of theboulder’s surface. As illustrated in Fig. 5, it seems that many ofthe clustered and isolated bright spots seen at low resolution alsoconsist of boulders with bright patches when observed at higherresolution. It is thus possible that this is a general characteristicsof all the bright spots, although this cannot be proven becauseof the limited resolution of some observations. In that case, thetypical size of the bright spots determined from the highest reso-lution observations would be of about one to two meters, smallerby a factor of five than what could be inferred from the initiallower resolution observations.
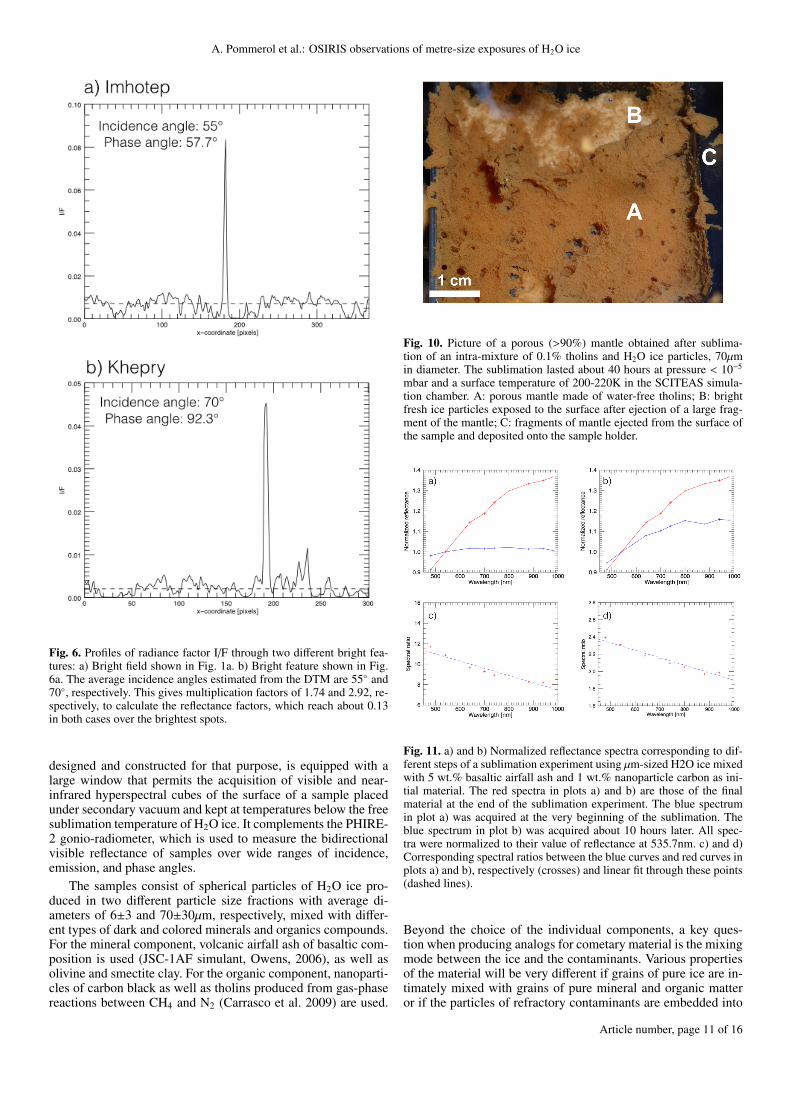
Profiles of the radiance factor at 649.2nm extracted from theimages show that the bright spots can be up to ten times brighterthan the average reflectance of the surrounding terrains, as illus-trated in Fig. 6 for the cases of features shown in Figs. 1a and 7a.First-order conversion to reflectance factor using local incidenceangles calculated from the DTM indicates a reflectance of about0.13 for the bright spots in both cases, whereas the reflectancefactor of the dark surrounding terrain is in the 0.01 to 0.02 range.These images have been acquired at high phase angles, 57.7◦ and92.3◦, respectively, and the reflectance factors obtained here aremuch lower than the values of I/F derived from observations atnear-0◦ phase angle because of the steepness of the surface phasecurve (Fornasier et al. (this issue), Sect. 3.1).
2.3. Temporal evolution of the bright regions
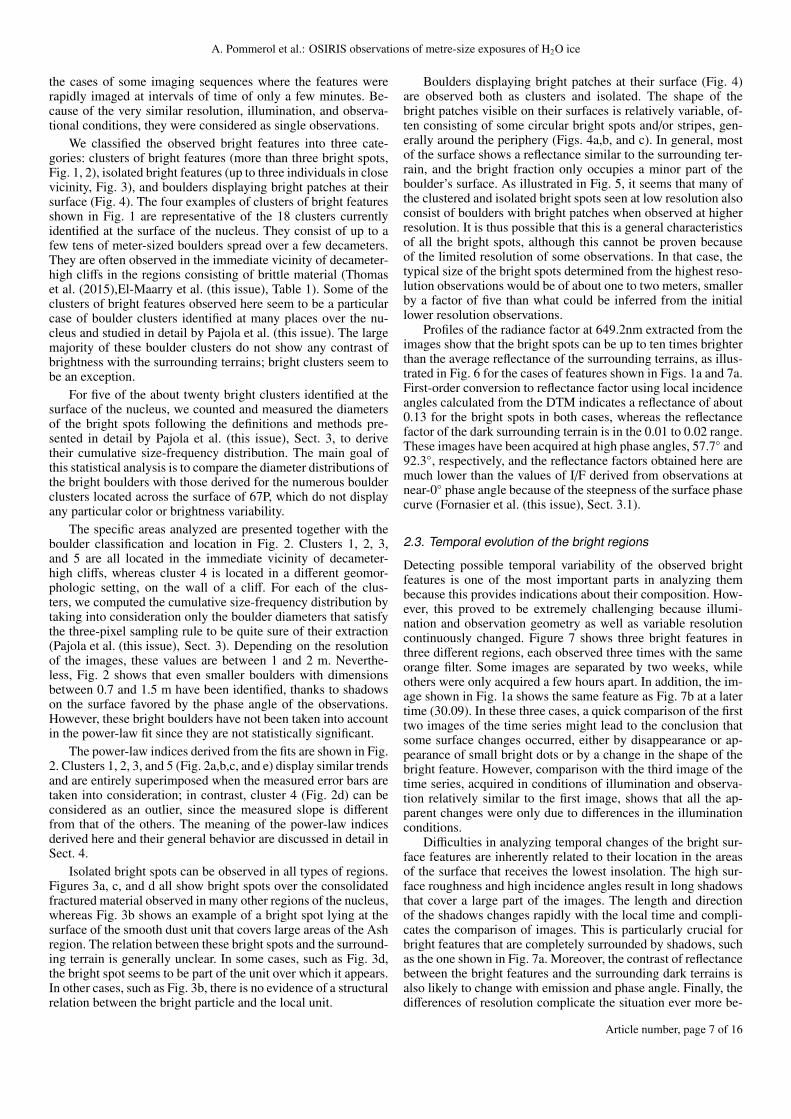
Detecting possible temporal variability of the observed brightfeatures is one of the most important parts in analyzing thembecause this provides indications about their composition. How-ever, this proved to be extremely challenging because illumi-nation and observation geometry as well as variable resolutioncontinuously changed. Figure 7 shows three bright features inthree different regions, each observed three times with the sameorange filter. Some images are separated by two weeks, whileothers were only acquired a few hours apart. In addition, the im-age shown in Fig. 1a shows the same feature as Fig. 7b at a latertime (30.09). In these three cases, a quick comparison of the firsttwo images of the time series might lead to the conclusion thatsome surface changes occurred, either by disappearance or ap-pearance of small bright dots or by a change in the shape of thebright feature. However, comparison with the third image of thetime series, acquired in conditions of illumination and observa-tion relatively similar to the first image, shows that all the ap-parent changes were only due to differences in the illuminationconditions.
Difficulties in analyzing temporal changes of the bright sur-face features are inherently related to their location in the areasof the surface that receives the lowest insolation. The high sur-face roughness and high incidence angles result in long shadowsthat cover a large part of the images. The length and directionof the shadows changes rapidly with the local time and compli-cates the comparison of images. This is particularly crucial forbright features that are completely surrounded by shadows, suchas the one shown in Fig. 7a. Moreover, the contrast of reflectancebetween the bright features and the surrounding dark terrains isalso likely to change with emission and phase angle. Finally, thedifferences of resolution complicate the situation ever more be-
Article number, page 7 of 16
A&A proofs: manuscript no. cg_bright
Fig. 7. Comparison of the aspect of three different bright features seen at three different times in the regions of a) Imhotep, b) Khepry, and c)Bastet. The date at which each image was acquired is indicated in an upper corner. a) Imhotep. Subsets of OSIRIS NAC images: NAC_2014-09-05T06.35.55.557Z_ID30_1397549300_F22.IMG (phase=57.7◦) NAC_2014-09-18T04.01.49.361Z_ID30_1397549200_F22.IMG (phase=83.3◦)NAC_2014-09-19T05.32.32.380Z_ID30_1397549800_F22.IMG (phase=70.4◦) b) Khepry. Subsets of OSIRIS NAC images: NAC_2014-09-05T09.30.55.562Z_ID30_1397549400_F22.IMG (phase=59.2◦) NAC_2014-09-19T09.19.13.330Z_ID30_1397549600_F22.IMG (phase=70.5◦)NAC_2014-09-19T21.03.31.329Z_ID30_1397549000_F22.IMG (phase=66.4◦) c) Bastet. Subsets of OSIRIS NAC images: NAC_2014-09-15T05.42.12.353Z_ID30_1397549000_F22.IMG (phase=67.3◦) NAC_2014-09-15T18.46.16.351Z_ID30_1397549600_F22.IMG (phase=72.6◦)NAC_2014-09-16T06.54.55.313Z_ID30_1397549400_F22.IMG (phase=78.5◦)
cause, as detailed in Sect. 2.2 and Fig. 5, increasing the resolu-tion often allows us to distinguish previously unresolved brightpatches on surfaces that looked homogeneous at lower resolu-tion.
Keeping in mind all these possible effects and analyzing theimages available at the highest level of detail possible, we didnot detect any evidence for temporal changes in the dataset sofar.
2.4. Colors
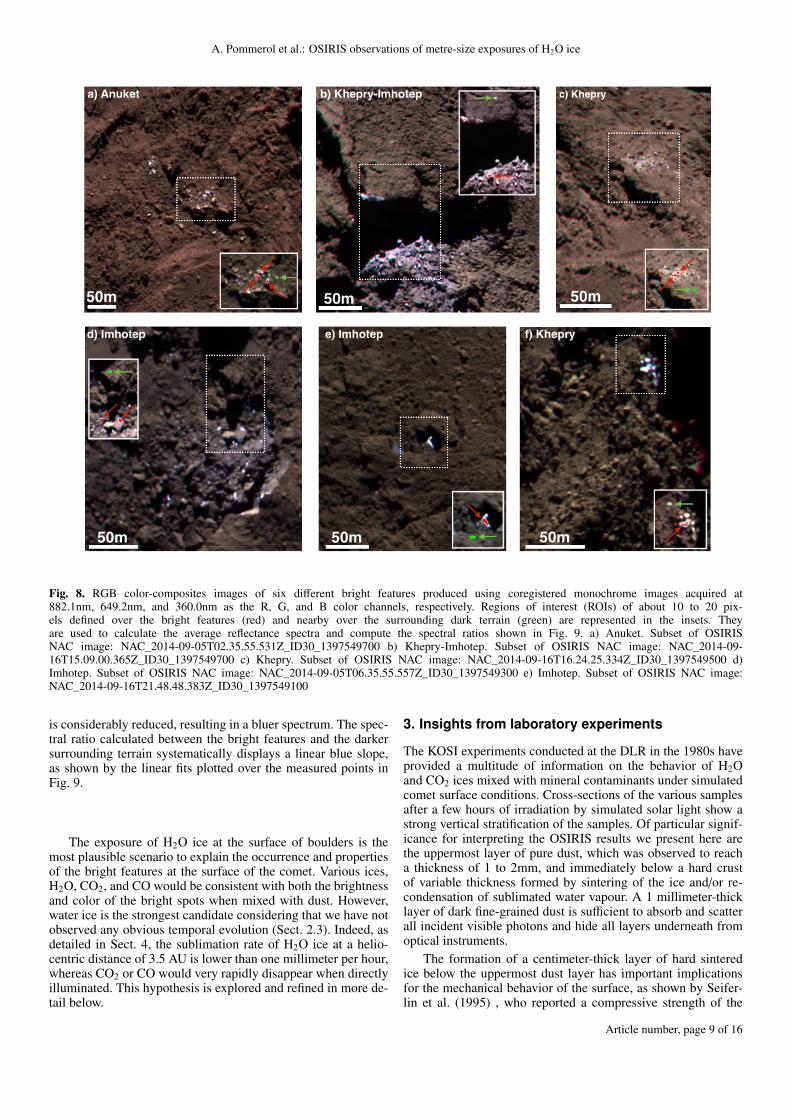
Images through different color filters have been acquired forabout 50% of the individual bright features identified at the sur-face. The other 50% have only been imaged through the or-ange filter (649.2nm). Multispectral cubes of small subsets ofthe full frames were assembled and used to produce RGB colorcomposites and extract reflectance spectra, as detailed in Sect.2.1. False-color RGB images of various bright features assem-bled from monochrome images acquired at near-infrared, visi-
ble, and near-ultraviolet wavelengths, respectively, are shown inFig. 8. Each of the three color channels, 882.1nm, 649.2nm, and360.0nm for the R, G, and B channel, respectively, was indepen-dently stretched and slightly saturated to emphasize the contrastsof color across the scene. This reveals significant contrast ofcolor between dark terrains displaying a redder color and brightfeatures displaying a significantly bluer color. Red slope images(not shown) were produced as well, from the images acquired at535.7 and 882.1nm, which clearly distinguish the bright featuresas areas of very low red slope.
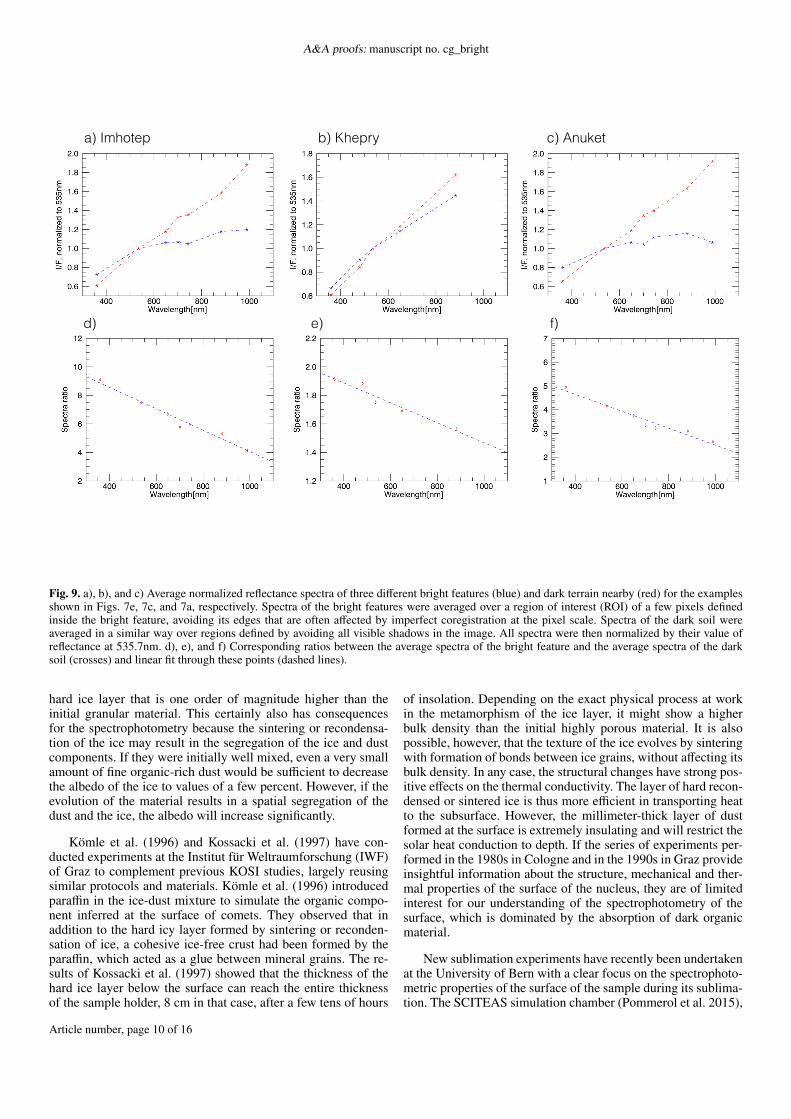
These differences in color observed in RGB images are betterdescribed quantitatively by extracting average reflectance spec-tra over regions of interest and by calculating spectral ratios be-tween the bright features and the dark surrounding terrains. Asshown in Fig. 9 and presented in detail by Fornasier et al. (this is-sue), Sect. 3.2, the reflectance spectrum of most of the surface of67P shows a nearly linear red slope over the 300-1000nm spec-tral range, the reflectance at 1000nm being two to three timeshigher than at 300nm. If most of the bright features also show ared slope over this spectral range, the steepness of this red slope
Article number, page 8 of 16
A. Pommerol et al.: OSIRIS observations of metre-size exposures of H2O ice
Fig. 8. RGB color-composites images of six different bright features produced using coregistered monochrome images acquired at882.1nm, 649.2nm, and 360.0nm as the R, G, and B color channels, respectively. Regions of interest (ROIs) of about 10 to 20 pix-els defined over the bright features (red) and nearby over the surrounding dark terrain (green) are represented in the insets. Theyare used to calculate the average reflectance spectra and compute the spectral ratios shown in Fig. 9. a) Anuket. Subset of OSIRISNAC image: NAC_2014-09-05T02.35.55.531Z_ID30_1397549700 b) Khepry-Imhotep. Subset of OSIRIS NAC image: NAC_2014-09-16T15.09.00.365Z_ID30_1397549700 c) Khepry. Subset of OSIRIS NAC image: NAC_2014-09-16T16.24.25.334Z_ID30_1397549500 d)Imhotep. Subset of OSIRIS NAC image: NAC_2014-09-05T06.35.55.557Z_ID30_1397549300 e) Imhotep. Subset of OSIRIS NAC image:NAC_2014-09-16T21.48.48.383Z_ID30_1397549100
is considerably reduced, resulting in a bluer spectrum. The spec-tral ratio calculated between the bright features and the darkersurrounding terrain systematically displays a linear blue slope,as shown by the linear fits plotted over the measured points inFig. 9.
The exposure of H2O ice at the surface of boulders is themost plausible scenario to explain the occurrence and propertiesof the bright features at the surface of the comet. Various ices,H2O, CO2, and CO would be consistent with both the brightnessand color of the bright spots when mixed with dust. However,water ice is the strongest candidate considering that we have notobserved any obvious temporal evolution (Sect. 2.3). Indeed, asdetailed in Sect. 4, the sublimation rate of H2O ice at a helio-centric distance of 3.5 AU is lower than one millimeter per hour,whereas CO2 or CO would very rapidly disappear when directlyilluminated. This hypothesis is explored and refined in more de-tail below.
3. Insights from laboratory experiments
The KOSI experiments conducted at the DLR in the 1980s haveprovided a multitude of information on the behavior of H2Oand CO2 ices mixed with mineral contaminants under simulatedcomet surface conditions. Cross-sections of the various samplesafter a few hours of irradiation by simulated solar light show astrong vertical stratification of the samples. Of particular signif-icance for interpreting the OSIRIS results we present here arethe uppermost layer of pure dust, which was observed to reacha thickness of 1 to 2mm, and immediately below a hard crustof variable thickness formed by sintering of the ice and/or re-condensation of sublimated water vapour. A 1 millimeter-thicklayer of dark fine-grained dust is sufficient to absorb and scatterall incident visible photons and hide all layers underneath fromoptical instruments.
The formation of a centimeter-thick layer of hard sinteredice below the uppermost dust layer has important implicationsfor the mechanical behavior of the surface, as shown by Seifer-lin et al. (1995) , who reported a compressive strength of the
Article number, page 9 of 16
A&A proofs: manuscript no. cg_bright
a) Imhotep b) Khepry c) Anuket
d) e) f)
Fig. 9. a), b), and c) Average normalized reflectance spectra of three different bright features (blue) and dark terrain nearby (red) for the examplesshown in Figs. 7e, 7c, and 7a, respectively. Spectra of the bright features were averaged over a region of interest (ROI) of a few pixels definedinside the bright feature, avoiding its edges that are often affected by imperfect coregistration at the pixel scale. Spectra of the dark soil wereaveraged in a similar way over regions defined by avoiding all visible shadows in the image. All spectra were then normalized by their value ofreflectance at 535.7nm. d), e), and f) Corresponding ratios between the average spectra of the bright feature and the average spectra of the darksoil (crosses) and linear fit through these points (dashed lines).
hard ice layer that is one order of magnitude higher than theinitial granular material. This certainly also has consequencesfor the spectrophotometry because the sintering or recondensa-tion of the ice may result in the segregation of the ice and dustcomponents. If they were initially well mixed, even a very smallamount of fine organic-rich dust would be sufficient to decreasethe albedo of the ice to values of a few percent. However, if theevolution of the material results in a spatial segregation of thedust and the ice, the albedo will increase significantly.
Kömle et al. (1996) and Kossacki et al. (1997) have con-ducted experiments at the Institut für Weltraumforschung (IWF)of Graz to complement previous KOSI studies, largely reusingsimilar protocols and materials. Kömle et al. (1996) introducedparaffin in the ice-dust mixture to simulate the organic compo-nent inferred at the surface of comets. They observed that inaddition to the hard icy layer formed by sintering or reconden-sation of ice, a cohesive ice-free crust had been formed by theparaffin, which acted as a glue between mineral grains. The re-sults of Kossacki et al. (1997) showed that the thickness of thehard ice layer below the surface can reach the entire thicknessof the sample holder, 8 cm in that case, after a few tens of hours
of insolation. Depending on the exact physical process at workin the metamorphism of the ice layer, it might show a higherbulk density than the initial highly porous material. It is alsopossible, however, that the texture of the ice evolves by sinteringwith formation of bonds between ice grains, without affecting itsbulk density. In any case, the structural changes have strong pos-itive effects on the thermal conductivity. The layer of hard recon-densed or sintered ice is thus more efficient in transporting heatto the subsurface. However, the millimeter-thick layer of dustformed at the surface is extremely insulating and will restrict thesolar heat conduction to depth. If the series of experiments per-formed in the 1980s in Cologne and in the 1990s in Graz provideinsightful information about the structure, mechanical and ther-mal properties of the surface of the nucleus, they are of limitedinterest for our understanding of the spectrophotometry of thesurface, which is dominated by the absorption of dark organicmaterial.
New sublimation experiments have recently been undertakenat the University of Bern with a clear focus on the spectrophoto-metric properties of the surface of the sample during its sublima-tion. The SCITEAS simulation chamber (Pommerol et al. 2015),
Article number, page 10 of 16
A. Pommerol et al.: OSIRIS observations of metre-size exposures of H2O ice
Fig. 6. Profiles of radiance factor I/F through two different bright fea-tures: a) Bright field shown in Fig. 1a. b) Bright feature shown in Fig.6a. The average incidence angles estimated from the DTM are 55◦ and70◦, respectively. This gives multiplication factors of 1.74 and 2.92, re-spectively, to calculate the reflectance factors, which reach about 0.13in both cases over the brightest spots.
designed and constructed for that purpose, is equipped with alarge window that permits the acquisition of visible and near-infrared hyperspectral cubes of the surface of a sample placedunder secondary vacuum and kept at temperatures below the freesublimation temperature of H2O ice. It complements the PHIRE-2 gonio-radiometer, which is used to measure the bidirectionalvisible reflectance of samples over wide ranges of incidence,emission, and phase angles.
The samples consist of spherical particles of H2O ice pro-duced in two different particle size fractions with average di-ameters of 6±3 and 70±30µm, respectively, mixed with differ-ent types of dark and colored minerals and organics compounds.For the mineral component, volcanic airfall ash of basaltic com-position is used (JSC-1AF simulant, Owens, 2006), as well asolivine and smectite clay. For the organic component, nanoparti-cles of carbon black as well as tholins produced from gas-phasereactions between CH4 and N2 (Carrasco et al. 2009) are used.
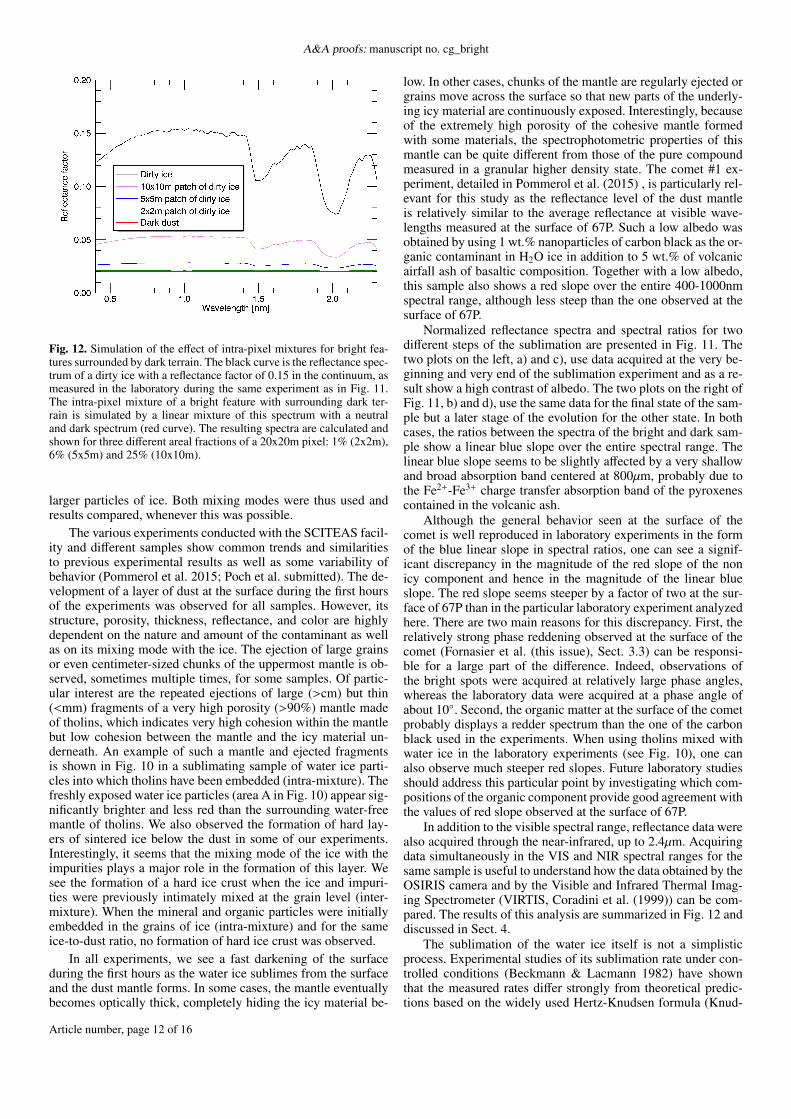
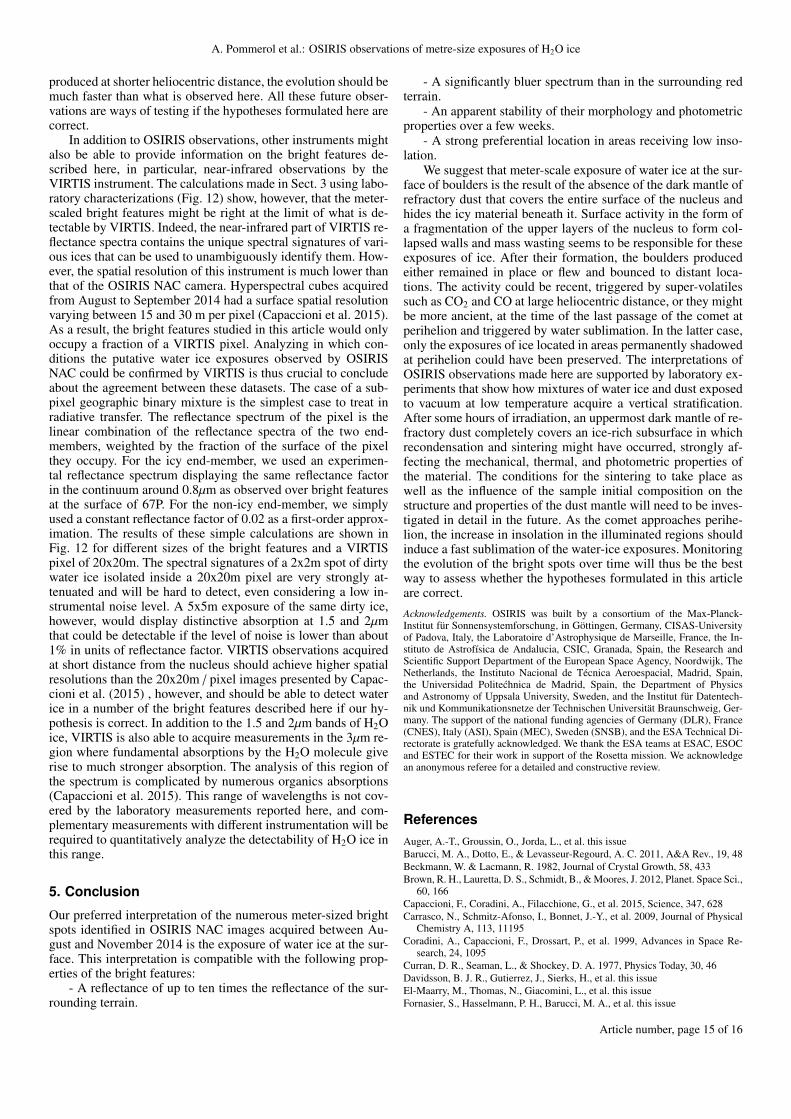
Fig. 10. Picture of a porous (>90%) mantle obtained after sublima-tion of an intra-mixture of 0.1% tholins and H2O ice particles, 70µmin diameter. The sublimation lasted about 40 hours at pressure < 10−5
mbar and a surface temperature of 200-220K in the SCITEAS simula-tion chamber. A: porous mantle made of water-free tholins; B: brightfresh ice particles exposed to the surface after ejection of a large frag-ment of the mantle; C: fragments of mantle ejected from the surface ofthe sample and deposited onto the sample holder.
Fig. 11. a) and b) Normalized reflectance spectra corresponding to dif-ferent steps of a sublimation experiment using µm-sized H2O ice mixedwith 5 wt.% basaltic airfall ash and 1 wt.% nanoparticle carbon as ini-tial material. The red spectra in plots a) and b) are those of the finalmaterial at the end of the sublimation experiment. The blue spectrumin plot a) was acquired at the very beginning of the sublimation. Theblue spectrum in plot b) was acquired about 10 hours later. All spec-tra were normalized to their value of reflectance at 535.7nm. c) and d)Corresponding spectral ratios between the blue curves and red curves inplots a) and b), respectively (crosses) and linear fit through these points(dashed lines).
Beyond the choice of the individual components, a key ques-tion when producing analogs for cometary material is the mixingmode between the ice and the contaminants. Various propertiesof the material will be very different if grains of pure ice are in-timately mixed with grains of pure mineral and organic matteror if the particles of refractory contaminants are embedded into
Article number, page 11 of 16
A&A proofs: manuscript no. cg_bright
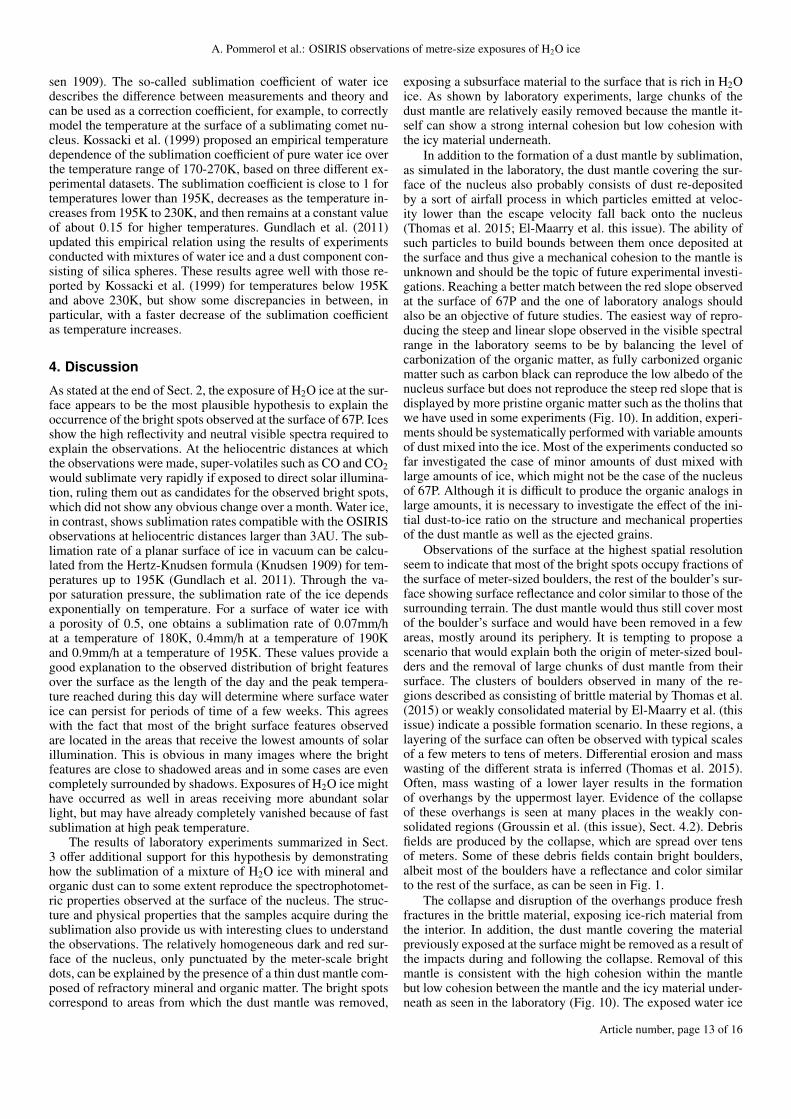
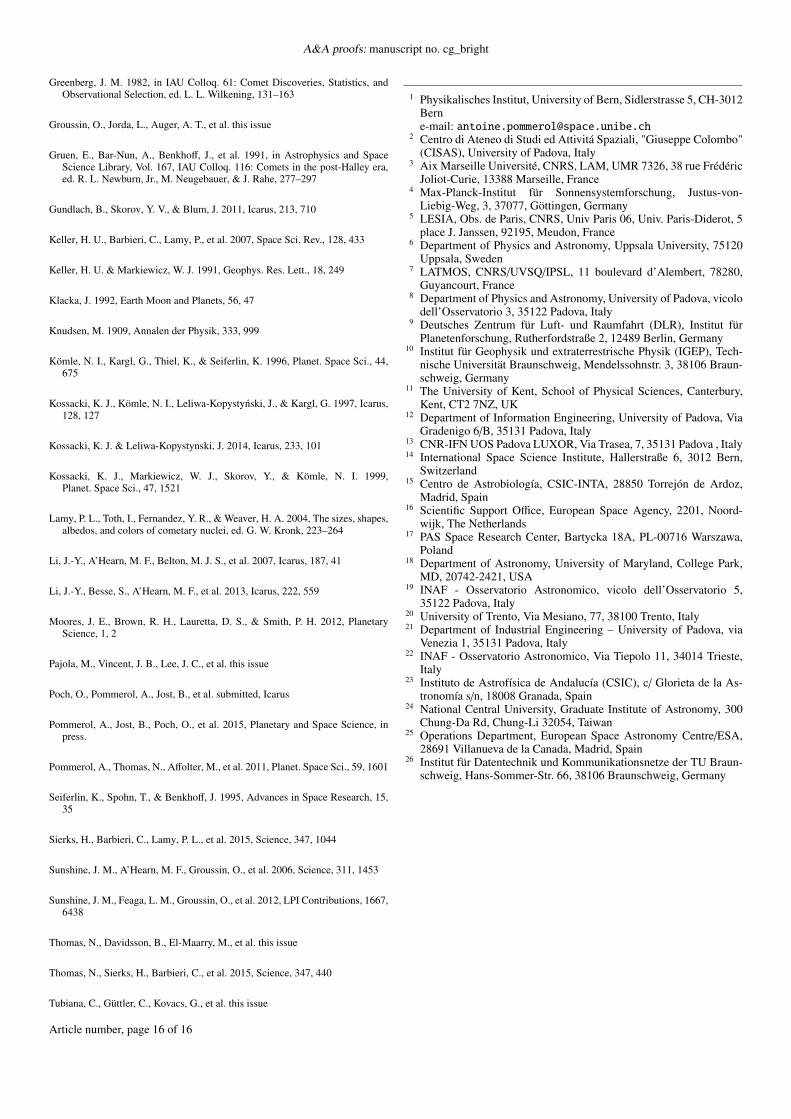
Fig. 12. Simulation of the effect of intra-pixel mixtures for bright fea-tures surrounded by dark terrain. The black curve is the reflectance spec-trum of a dirty ice with a reflectance factor of 0.15 in the continuum, asmeasured in the laboratory during the same experiment as in Fig. 11.The intra-pixel mixture of a bright feature with surrounding dark ter-rain is simulated by a linear mixture of this spectrum with a neutraland dark spectrum (red curve). The resulting spectra are calculated andshown for three different areal fractions of a 20x20m pixel: 1% (2x2m),6% (5x5m) and 25% (10x10m).
larger particles of ice. Both mixing modes were thus used andresults compared, whenever this was possible.
The various experiments conducted with the SCITEAS facil-ity and different samples show common trends and similaritiesto previous experimental results as well as some variability ofbehavior (Pommerol et al. 2015; Poch et al. submitted). The de-velopment of a layer of dust at the surface during the first hoursof the experiments was observed for all samples. However, itsstructure, porosity, thickness, reflectance, and color are highlydependent on the nature and amount of the contaminant as wellas on its mixing mode with the ice. The ejection of large grainsor even centimeter-sized chunks of the uppermost mantle is ob-served, sometimes multiple times, for some samples. Of partic-ular interest are the repeated ejections of large (>cm) but thin(<mm) fragments of a very high porosity (>90%) mantle madeof tholins, which indicates very high cohesion within the mantlebut low cohesion between the mantle and the icy material un-derneath. An example of such a mantle and ejected fragmentsis shown in Fig. 10 in a sublimating sample of water ice parti-cles into which tholins have been embedded (intra-mixture). Thefreshly exposed water ice particles (area A in Fig. 10) appear sig-nificantly brighter and less red than the surrounding water-freemantle of tholins. We also observed the formation of hard lay-ers of sintered ice below the dust in some of our experiments.Interestingly, it seems that the mixing mode of the ice with theimpurities plays a major role in the formation of this layer. Wesee the formation of a hard ice crust when the ice and impuri-ties were previously intimately mixed at the grain level (inter-mixture). When the mineral and organic particles were initiallyembedded in the grains of ice (intra-mixture) and for the sameice-to-dust ratio, no formation of hard ice crust was observed.
In all experiments, we see a fast darkening of the surfaceduring the first hours as the water ice sublimes from the surfaceand the dust mantle forms. In some cases, the mantle eventuallybecomes optically thick, completely hiding the icy material be-
low. In other cases, chunks of the mantle are regularly ejected orgrains move across the surface so that new parts of the underly-ing icy material are continuously exposed. Interestingly, becauseof the extremely high porosity of the cohesive mantle formedwith some materials, the spectrophotometric properties of thismantle can be quite different from those of the pure compoundmeasured in a granular higher density state. The comet #1 ex-periment, detailed in Pommerol et al. (2015) , is particularly rel-evant for this study as the reflectance level of the dust mantleis relatively similar to the average reflectance at visible wave-lengths measured at the surface of 67P. Such a low albedo wasobtained by using 1 wt.% nanoparticles of carbon black as the or-ganic contaminant in H2O ice in addition to 5 wt.% of volcanicairfall ash of basaltic composition. Together with a low albedo,this sample also shows a red slope over the entire 400-1000nmspectral range, although less steep than the one observed at thesurface of 67P.
Normalized reflectance spectra and spectral ratios for twodifferent steps of the sublimation are presented in Fig. 11. Thetwo plots on the left, a) and c), use data acquired at the very be-ginning and very end of the sublimation experiment and as a re-sult show a high contrast of albedo. The two plots on the right ofFig. 11, b) and d), use the same data for the final state of the sam-ple but a later stage of the evolution for the other state. In bothcases, the ratios between the spectra of the bright and dark sam-ple show a linear blue slope over the entire spectral range. Thelinear blue slope seems to be slightly affected by a very shallowand broad absorption band centered at 800µm, probably due tothe Fe2+-Fe3+ charge transfer absorption band of the pyroxenescontained in the volcanic ash.
Although the general behavior seen at the surface of thecomet is well reproduced in laboratory experiments in the formof the blue linear slope in spectral ratios, one can see a signif-icant discrepancy in the magnitude of the red slope of the nonicy component and hence in the magnitude of the linear blueslope. The red slope seems steeper by a factor of two at the sur-face of 67P than in the particular laboratory experiment analyzedhere. There are two main reasons for this discrepancy. First, therelatively strong phase reddening observed at the surface of thecomet (Fornasier et al. (this issue), Sect. 3.3) can be responsi-ble for a large part of the difference. Indeed, observations ofthe bright spots were acquired at relatively large phase angles,whereas the laboratory data were acquired at a phase angle ofabout 10◦. Second, the organic matter at the surface of the cometprobably displays a redder spectrum than the one of the carbonblack used in the experiments. When using tholins mixed withwater ice in the laboratory experiments (see Fig. 10), one canalso observe much steeper red slopes. Future laboratory studiesshould address this particular point by investigating which com-positions of the organic component provide good agreement withthe values of red slope observed at the surface of 67P.
In addition to the visible spectral range, reflectance data werealso acquired through the near-infrared, up to 2.4µm. Acquiringdata simultaneously in the VIS and NIR spectral ranges for thesame sample is useful to understand how the data obtained by theOSIRIS camera and by the Visible and Infrared Thermal Imag-ing Spectrometer (VIRTIS, Coradini et al. (1999)) can be com-pared. The results of this analysis are summarized in Fig. 12 anddiscussed in Sect. 4.
The sublimation of the water ice itself is not a simplisticprocess. Experimental studies of its sublimation rate under con-trolled conditions (Beckmann & Lacmann 1982) have shownthat the measured rates differ strongly from theoretical predic-tions based on the widely used Hertz-Knudsen formula (Knud-
Article number, page 12 of 16
A. Pommerol et al.: OSIRIS observations of metre-size exposures of H2O ice
sen 1909). The so-called sublimation coefficient of water icedescribes the difference between measurements and theory andcan be used as a correction coefficient, for example, to correctlymodel the temperature at the surface of a sublimating comet nu-cleus. Kossacki et al. (1999) proposed an empirical temperaturedependence of the sublimation coefficient of pure water ice overthe temperature range of 170-270K, based on three different ex-perimental datasets. The sublimation coefficient is close to 1 fortemperatures lower than 195K, decreases as the temperature in-creases from 195K to 230K, and then remains at a constant valueof about 0.15 for higher temperatures. Gundlach et al. (2011)updated this empirical relation using the results of experimentsconducted with mixtures of water ice and a dust component con-sisting of silica spheres. These results agree well with those re-ported by Kossacki et al. (1999) for temperatures below 195Kand above 230K, but show some discrepancies in between, inparticular, with a faster decrease of the sublimation coefficientas temperature increases.
4. Discussion
As stated at the end of Sect. 2, the exposure of H2O ice at the sur-face appears to be the most plausible hypothesis to explain theoccurrence of the bright spots observed at the surface of 67P. Icesshow the high reflectivity and neutral visible spectra required toexplain the observations. At the heliocentric distances at whichthe observations were made, super-volatiles such as CO and CO2would sublimate very rapidly if exposed to direct solar illumina-tion, ruling them out as candidates for the observed bright spots,which did not show any obvious change over a month. Water ice,in contrast, shows sublimation rates compatible with the OSIRISobservations at heliocentric distances larger than 3AU. The sub-limation rate of a planar surface of ice in vacuum can be calcu-lated from the Hertz-Knudsen formula (Knudsen 1909) for tem-peratures up to 195K (Gundlach et al. 2011). Through the va-por saturation pressure, the sublimation rate of the ice dependsexponentially on temperature. For a surface of water ice witha porosity of 0.5, one obtains a sublimation rate of 0.07mm/hat a temperature of 180K, 0.4mm/h at a temperature of 190Kand 0.9mm/h at a temperature of 195K. These values provide agood explanation to the observed distribution of bright featuresover the surface as the length of the day and the peak tempera-ture reached during this day will determine where surface waterice can persist for periods of time of a few weeks. This agreeswith the fact that most of the bright surface features observedare located in the areas that receive the lowest amounts of solarillumination. This is obvious in many images where the brightfeatures are close to shadowed areas and in some cases are evencompletely surrounded by shadows. Exposures of H2O ice mighthave occurred as well in areas receiving more abundant solarlight, but may have already completely vanished because of fastsublimation at high peak temperature.
The results of laboratory experiments summarized in Sect.3 offer additional support for this hypothesis by demonstratinghow the sublimation of a mixture of H2O ice with mineral andorganic dust can to some extent reproduce the spectrophotomet-ric properties observed at the surface of the nucleus. The struc-ture and physical properties that the samples acquire during thesublimation also provide us with interesting clues to understandthe observations. The relatively homogeneous dark and red sur-face of the nucleus, only punctuated by the meter-scale brightdots, can be explained by the presence of a thin dust mantle com-posed of refractory mineral and organic matter. The bright spotscorrespond to areas from which the dust mantle was removed,
exposing a subsurface material to the surface that is rich in H2Oice. As shown by laboratory experiments, large chunks of thedust mantle are relatively easily removed because the mantle it-self can show a strong internal cohesion but low cohesion withthe icy material underneath.
In addition to the formation of a dust mantle by sublimation,as simulated in the laboratory, the dust mantle covering the sur-face of the nucleus also probably consists of dust re-depositedby a sort of airfall process in which particles emitted at veloc-ity lower than the escape velocity fall back onto the nucleus(Thomas et al. 2015; El-Maarry et al. this issue). The ability ofsuch particles to build bounds between them once deposited atthe surface and thus give a mechanical cohesion to the mantle isunknown and should be the topic of future experimental investi-gations. Reaching a better match between the red slope observedat the surface of 67P and the one of laboratory analogs shouldalso be an objective of future studies. The easiest way of repro-ducing the steep and linear slope observed in the visible spectralrange in the laboratory seems to be by balancing the level ofcarbonization of the organic matter, as fully carbonized organicmatter such as carbon black can reproduce the low albedo of thenucleus surface but does not reproduce the steep red slope that isdisplayed by more pristine organic matter such as the tholins thatwe have used in some experiments (Fig. 10). In addition, experi-ments should be systematically performed with variable amountsof dust mixed into the ice. Most of the experiments conducted sofar investigated the case of minor amounts of dust mixed withlarge amounts of ice, which might not be the case of the nucleusof 67P. Although it is difficult to produce the organic analogs inlarge amounts, it is necessary to investigate the effect of the ini-tial dust-to-ice ratio on the structure and mechanical propertiesof the dust mantle as well as the ejected grains.
Observations of the surface at the highest spatial resolutionseem to indicate that most of the bright spots occupy fractions ofthe surface of meter-sized boulders, the rest of the boulder’s sur-face showing surface reflectance and color similar to those of thesurrounding terrain. The dust mantle would thus still cover mostof the boulder’s surface and would have been removed in a fewareas, mostly around its periphery. It is tempting to propose ascenario that would explain both the origin of meter-sized boul-ders and the removal of large chunks of dust mantle from theirsurface. The clusters of boulders observed in many of the re-gions described as consisting of brittle material by Thomas et al.(2015) or weakly consolidated material by El-Maarry et al. (thisissue) indicate a possible formation scenario. In these regions, alayering of the surface can often be observed with typical scalesof a few meters to tens of meters. Differential erosion and masswasting of the different strata is inferred (Thomas et al. 2015).Often, mass wasting of a lower layer results in the formationof overhangs by the uppermost layer. Evidence of the collapseof these overhangs is seen at many places in the weakly con-solidated regions (Groussin et al. (this issue), Sect. 4.2). Debrisfields are produced by the collapse, which are spread over tensof meters. Some of these debris fields contain bright boulders,albeit most of the boulders have a reflectance and color similarto the rest of the surface, as can be seen in Fig. 1.
The collapse and disruption of the overhangs produce freshfractures in the brittle material, exposing ice-rich material fromthe interior. In addition, the dust mantle covering the materialpreviously exposed at the surface might be removed as a result ofthe impacts during and following the collapse. Removal of thismantle is consistent with the high cohesion within the mantlebut low cohesion between the mantle and the icy material under-neath as seen in the laboratory (Fig. 10). The exposed water ice
Article number, page 13 of 16
A&A proofs: manuscript no. cg_bright
will eventually sublime with time, at different rates depending onthe heliocentric distance, forming a new dust mantle at the sur-face of the icy blocks. We hypothesize that the bright spots thatwe see are these areas where the dust mantle has not reformed orhas not yet reached a sufficient thickness to hide the icy materialbelow. The best example we have of such an exposure of brightmaterial by fracturing is Fig. 8b, where bright and blue materialis seen both in the debris field below the overhang and on a verti-cal section of the uppermost brittle layer, at the place where thisone cracked.
Additional support for this formation scenario comes fromthe analysis of the size-frequency distribution of the bright boul-ders shown in Fig. 2. Similar size-frequency distributions forfour of the five fields studied indicate a common formationmechanism, and the value of the power-law index, 3.6 to 3.9,is similar to the value obtained by Pajola et al. (this issue) in dif-ferent locations such as the Nut mass wasting area, the Body2 BKhepry/Ash area, and the Hatmehit and Imhotep mass-wastingdeposits identified close to similar decameter-high cliffs (see Ta-ble 5 in Pajola et al. (this issue)). Possible explanations for slopessteeper than -3.0 include thermal stress and activity fragmenta-tion phenomena. The surface of a comet is an active and chang-ing environment where outgassing volatiles and dust, rapidlymutating insolation and consequent thermal stress can lead fromglobal cracks (Sierks et al. 2015; Thomas et al. 2015) to verylocalized fractal fragmentation even on the boulders themselveswhen observed in high resolution (see Pajola et al. (this issue),Fig. 1). This results in an increase of the population of smallersized boulders with respect to the larger boulders, or likewise, apreferential disruption of the larger boulders, hence steepeningthe cumulative size-frequency distribution slopes and possiblyleading to the values we observed in this analysis.
In contrast to the four other clusters investigated, the clusterin Imhotep shown in Fig. 8d shows a power-law index similar tothose associated to terrestrial (Curran et al. 1977) or asteroidalimpact-related phenomena (Klacka 1992) and that partially over-laps with the trend (Pajola et al. (this issue), Fig. 10) measuredin the Hapi region of the comet. More generally, the Imhotep re-gion is a very peculiar place in terms of occurrences of brightfeatures (Auger et al. (this issue), Sect. 3.4). This is interest-ing considering that this region shows many other particulari-ties such as smooth terrains with circular features that are notobserved anywhere else on the nucleus (Auger et al. (this issue),Sects. 3.1 and 3.6). The relation between the abundance of brightfeatures in this region and the other peculiar morphologies is stillunclear but supports the idea that Imhotep experiences ongoingmass wasting and is likely representative of other regions in thesouthern hemisphere, which would be active around perihelion.
The formation of hard crusts of ice under the uppermost dustmantles in laboratory experiments may offer a plausible hypoth-esis for the brittle mechanical behavior of the surface in regionsthat have obviously already experienced extensive sublimationduring previous passages of the comet at perihelion. Beyond ef-fects on the thermal and mechanical properties of the surfacematerial, sintering or recondensation processes are certainly alsoable to change its reflectivity by segregating the ice from thedust. It is well possible that the brighter and bluer material seenat the surface of the boulders is not the primordial material thatforms the bulk of the nucleus, but a highly reprocessed surfacematerial, resulting from strong metamorphism produced by in-tense solar heating. Indeed, all laboratory measurements madeon mixtures of H2O ice and dark organic materials show thatonly a few weight percent of dust are sufficient to reduce thealbedo of the ice below 10% when ice and dust are intimately
mixed. As many higher fractions of dust are expected in thematerial from which comets are formed and because the darkdust particles might be embedded in the grains of ice (Green-berg 1982), one would indeed expect the bulk material of thenucleus to be much darker than the brightest features observed,which have reflectance factors of around 13%.
We note, however, that the formation of a thick hard crustrequires specific conditions of temperature in the subsurface tooccur and, as indicated by recent laboratory experiments (Pochet al. submitted), seems to be strongly influenced by the mixingmode between the ice and the dust. It is thus currently unclear ifand where sintering of the water ice in the subsurface might haveoccurred on the comet in thicknesses large enough to explainthe observations reported here. Given the potential importance ofthis process for various properties of the material, this questiondeserves high attention and additional studies through laboratoryexperiments, modeling, and analysis of Rosetta remote-sensingand in situ Philae data.
Some of the isolated spots, boulders with bright patches attheir surface or small clusters of only a few bright spots, how-ever, completely lack a geomorphological context that could ex-plain their formation. The best example here is Fig. 3b where abright spot is observed over the smooth terrain in the Ash region.For these cases, we hypothesize that icy blocks were produced ata distant place on the nucleus, ejected with a velocity sufficientto fly over large distances, but insufficient to escape its gravityfield. The blocks may have bounced a few times before restingat their final location and could have fragmented into smallerblocks on landing. For example, the features shown in Figs. 8aand 8c could have originated from this process. Evidence for theemission of small particles at low velocity and redeposition bya sort of airfall have been obtained at many places around thenucleus (Thomas et al. 2015; Thomas et al. this issue). The largesmooth areas of the Ash region and similar-looking regions havebeen hypothesized to result from this process. Mass loss of largechunks of surface material has also been proposed to account forthe morphology of large depressions on the nucleus. All theseobservations are consistent and, taken together, emphasize theimportance of transport of material at the surface of the nucleus.
We can consider two possibilities for the timing of the brightboulders formation: during the passage at perihelion or at largerheliocentric distance since the last passage. The first possibilityinvolves activity due to water ice sublimation and requires theemission and transport of the icy block into regions of the nu-cleus that remain permanently shadowed around and after theclosest approach of the nucleus to the Sun until it reached alarge heliocentric distance at which water is stable at the sur-face. Therefore, this possibility only involves a minor fraction ofthe nucleus surface. The second possibility implies the role ofsuper-volatiles such as CO2 and CO in the activity at large he-liocentric distances from the Sun. In this case, bright boulderscan be produced and deposited at any position on the nucleus asthe surface temperature is still too low for water ice sublimationto occur. As the nucleus progresses toward the Sun, however,most of the bright features will disappear as the sublimation raterapidly increases and only those that are located in permanentlyshadowed areas can survive the passage at perihelion.
It is already clear that many of the observed bright featuresare not located at places that will be shadowed at perihelion, inparticular the large ones in the Imhotep region. Future obser-vations of these bright features as the comet is progressing to-ward the Sun should thus show them vanishing. As new regionsemerge from the polar night, new bright features might also beobservable and may be produced. In the case of bright icy blocks
Article number, page 14 of 16
A. Pommerol et al.: OSIRIS observations of metre-size exposures of H2O ice
produced at shorter heliocentric distance, the evolution should bemuch faster than what is observed here. All these future obser-vations are ways of testing if the hypotheses formulated here arecorrect.
In addition to OSIRIS observations, other instruments mightalso be able to provide information on the bright features de-scribed here, in particular, near-infrared observations by theVIRTIS instrument. The calculations made in Sect. 3 using labo-ratory characterizations (Fig. 12) show, however, that the meter-scaled bright features might be right at the limit of what is de-tectable by VIRTIS. Indeed, the near-infrared part of VIRTIS re-flectance spectra contains the unique spectral signatures of vari-ous ices that can be used to unambiguously identify them. How-ever, the spatial resolution of this instrument is much lower thanthat of the OSIRIS NAC camera. Hyperspectral cubes acquiredfrom August to September 2014 had a surface spatial resolutionvarying between 15 and 30 m per pixel (Capaccioni et al. 2015).As a result, the bright features studied in this article would onlyoccupy a fraction of a VIRTIS pixel. Analyzing in which con-ditions the putative water ice exposures observed by OSIRISNAC could be confirmed by VIRTIS is thus crucial to concludeabout the agreement between these datasets. The case of a sub-pixel geographic binary mixture is the simplest case to treat inradiative transfer. The reflectance spectrum of the pixel is thelinear combination of the reflectance spectra of the two end-members, weighted by the fraction of the surface of the pixelthey occupy. For the icy end-member, we used an experimen-tal reflectance spectrum displaying the same reflectance factorin the continuum around 0.8µm as observed over bright featuresat the surface of 67P. For the non-icy end-member, we simplyused a constant reflectance factor of 0.02 as a first-order approx-imation. The results of these simple calculations are shown inFig. 12 for different sizes of the bright features and a VIRTISpixel of 20x20m. The spectral signatures of a 2x2m spot of dirtywater ice isolated inside a 20x20m pixel are very strongly at-tenuated and will be hard to detect, even considering a low in-strumental noise level. A 5x5m exposure of the same dirty ice,however, would display distinctive absorption at 1.5 and 2µmthat could be detectable if the level of noise is lower than about1% in units of reflectance factor. VIRTIS observations acquiredat short distance from the nucleus should achieve higher spatialresolutions than the 20x20m / pixel images presented by Capac-cioni et al. (2015) , however, and should be able to detect waterice in a number of the bright features described here if our hy-pothesis is correct. In addition to the 1.5 and 2µm bands of H2Oice, VIRTIS is also able to acquire measurements in the 3µm re-gion where fundamental absorptions by the H2O molecule giverise to much stronger absorption. The analysis of this region ofthe spectrum is complicated by numerous organics absorptions(Capaccioni et al. 2015). This range of wavelengths is not cov-ered by the laboratory measurements reported here, and com-plementary measurements with different instrumentation will berequired to quantitatively analyze the detectability of H2O ice inthis range.
5. Conclusion
Our preferred interpretation of the numerous meter-sized brightspots identified in OSIRIS NAC images acquired between Au-gust and November 2014 is the exposure of water ice at the sur-face. This interpretation is compatible with the following prop-erties of the bright features:
- A reflectance of up to ten times the reflectance of the sur-rounding terrain.
- A significantly bluer spectrum than in the surrounding redterrain.
- An apparent stability of their morphology and photometricproperties over a few weeks.
- A strong preferential location in areas receiving low inso-lation.
We suggest that meter-scale exposure of water ice at the sur-face of boulders is the result of the absence of the dark mantle ofrefractory dust that covers the entire surface of the nucleus andhides the icy material beneath it. Surface activity in the form ofa fragmentation of the upper layers of the nucleus to form col-lapsed walls and mass wasting seems to be responsible for theseexposures of ice. After their formation, the boulders producedeither remained in place or flew and bounced to distant loca-tions. The activity could be recent, triggered by super-volatilessuch as CO2 and CO at large heliocentric distance, or they mightbe more ancient, at the time of the last passage of the comet atperihelion and triggered by water sublimation. In the latter case,only the exposures of ice located in areas permanently shadowedat perihelion could have been preserved. The interpretations ofOSIRIS observations made here are supported by laboratory ex-periments that show how mixtures of water ice and dust exposedto vacuum at low temperature acquire a vertical stratification.After some hours of irradiation, an uppermost dark mantle of re-fractory dust completely covers an ice-rich subsurface in whichrecondensation and sintering might have occurred, strongly af-fecting the mechanical, thermal, and photometric properties ofthe material. The conditions for the sintering to take place aswell as the influence of the sample initial composition on thestructure and properties of the dust mantle will need to be inves-tigated in detail in the future. As the comet approaches perihe-lion, the increase in insolation in the illuminated regions shouldinduce a fast sublimation of the water-ice exposures. Monitoringthe evolution of the bright spots over time will thus be the bestway to assess whether the hypotheses formulated in this articleare correct.
Acknowledgements. OSIRIS was built by a consortium of the Max-Planck-Institut für Sonnensystemforschung, in Göttingen, Germany, CISAS-Universityof Padova, Italy, the Laboratoire d’Astrophysique de Marseille, France, the In-stituto de Astrofísica de Andalucia, CSIC, Granada, Spain, the Research andScientific Support Department of the European Space Agency, Noordwijk, TheNetherlands, the Instituto Nacional de Técnica Aeroespacial, Madrid, Spain,the Universidad Politechnica de Madrid, Spain, the Department of Physicsand Astronomy of Uppsala University, Sweden, and the Institut für Datentech-nik und Kommunikationsnetze der Technischen Universität Braunschweig, Ger-many. The support of the national funding agencies of Germany (DLR), France(CNES), Italy (ASI), Spain (MEC), Sweden (SNSB), and the ESA Technical Di-rectorate is gratefully acknowledged. We thank the ESA teams at ESAC, ESOCand ESTEC for their work in support of the Rosetta mission. We acknowledgean anonymous referee for a detailed and constructive review.
ReferencesAuger, A.-T., Groussin, O., Jorda, L., et al. this issueBarucci, M. A., Dotto, E., & Levasseur-Regourd, A. C. 2011, A&A Rev., 19, 48Beckmann, W. & Lacmann, R. 1982, Journal of Crystal Growth, 58, 433Brown, R. H., Lauretta, D. S., Schmidt, B., & Moores, J. 2012, Planet. Space Sci.,
60, 166Capaccioni, F., Coradini, A., Filacchione, G., et al. 2015, Science, 347, 628Carrasco, N., Schmitz-Afonso, I., Bonnet, J.-Y., et al. 2009, Journal of Physical
Chemistry A, 113, 11195Coradini, A., Capaccioni, F., Drossart, P., et al. 1999, Advances in Space Re-
search, 24, 1095Curran, D. R., Seaman, L., & Shockey, D. A. 1977, Physics Today, 30, 46Davidsson, B. J. R., Gutierrez, J., Sierks, H., et al. this issueEl-Maarry, M., Thomas, N., Giacomini, L., et al. this issueFornasier, S., Hasselmann, P. H., Barucci, M. A., et al. this issue
Article number, page 15 of 16
A&A proofs: manuscript no. cg_bright
Greenberg, J. M. 1982, in IAU Colloq. 61: Comet Discoveries, Statistics, andObservational Selection, ed. L. L. Wilkening, 131–163
Groussin, O., Jorda, L., Auger, A. T., et al. this issue
Gruen, E., Bar-Nun, A., Benkhoff, J., et al. 1991, in Astrophysics and SpaceScience Library, Vol. 167, IAU Colloq. 116: Comets in the post-Halley era,ed. R. L. Newburn, Jr., M. Neugebauer, & J. Rahe, 277–297
Gundlach, B., Skorov, Y. V., & Blum, J. 2011, Icarus, 213, 710
Keller, H. U., Barbieri, C., Lamy, P., et al. 2007, Space Sci. Rev., 128, 433
Keller, H. U. & Markiewicz, W. J. 1991, Geophys. Res. Lett., 18, 249
Klacka, J. 1992, Earth Moon and Planets, 56, 47
Knudsen, M. 1909, Annalen der Physik, 333, 999
Kömle, N. I., Kargl, G., Thiel, K., & Seiferlin, K. 1996, Planet. Space Sci., 44,675
Kossacki, K. J., Kömle, N. I., Leliwa-Kopystynski, J., & Kargl, G. 1997, Icarus,128, 127
Kossacki, K. J. & Leliwa-Kopystynski, J. 2014, Icarus, 233, 101
Kossacki, K. J., Markiewicz, W. J., Skorov, Y., & Kömle, N. I. 1999,Planet. Space Sci., 47, 1521
Lamy, P. L., Toth, I., Fernandez, Y. R., & Weaver, H. A. 2004, The sizes, shapes,albedos, and colors of cometary nuclei, ed. G. W. Kronk, 223–264
Li, J.-Y., A’Hearn, M. F., Belton, M. J. S., et al. 2007, Icarus, 187, 41
Li, J.-Y., Besse, S., A’Hearn, M. F., et al. 2013, Icarus, 222, 559
Moores, J. E., Brown, R. H., Lauretta, D. S., & Smith, P. H. 2012, PlanetaryScience, 1, 2
Pajola, M., Vincent, J. B., Lee, J. C., et al. this issue
Poch, O., Pommerol, A., Jost, B., et al. submitted, Icarus
Pommerol, A., Jost, B., Poch, O., et al. 2015, Planetary and Space Science, inpress.
Pommerol, A., Thomas, N., Affolter, M., et al. 2011, Planet. Space Sci., 59, 1601
Seiferlin, K., Spohn, T., & Benkhoff, J. 1995, Advances in Space Research, 15,35
Sierks, H., Barbieri, C., Lamy, P. L., et al. 2015, Science, 347, 1044
Sunshine, J. M., A’Hearn, M. F., Groussin, O., et al. 2006, Science, 311, 1453
Sunshine, J. M., Feaga, L. M., Groussin, O., et al. 2012, LPI Contributions, 1667,6438
Thomas, N., Davidsson, B., El-Maarry, M., et al. this issue
Thomas, N., Sierks, H., Barbieri, C., et al. 2015, Science, 347, 440
Tubiana, C., Güttler, C., Kovacs, G., et al. this issue
1 Physikalisches Institut, University of Bern, Sidlerstrasse 5, CH-3012Berne-mail: [email protected]
2 Centro di Ateneo di Studi ed Attivitá Spaziali, "Giuseppe Colombo"(CISAS), University of Padova, Italy
3 Aix Marseille Université, CNRS, LAM, UMR 7326, 38 rue FrédéricJoliot-Curie, 13388 Marseille, France
4 Max-Planck-Institut für Sonnensystemforschung, Justus-von-Liebig-Weg, 3, 37077, Göttingen, Germany
5 LESIA, Obs. de Paris, CNRS, Univ Paris 06, Univ. Paris-Diderot, 5place J. Janssen, 92195, Meudon, France
6 Department of Physics and Astronomy, Uppsala University, 75120Uppsala, Sweden
7 LATMOS, CNRS/UVSQ/IPSL, 11 boulevard d’Alembert, 78280,Guyancourt, France
8 Department of Physics and Astronomy, University of Padova, vicolodell’Osservatorio 3, 35122 Padova, Italy
9 Deutsches Zentrum für Luft- und Raumfahrt (DLR), Institut fürPlanetenforschung, Rutherfordstraße 2, 12489 Berlin, Germany
10 Institut für Geophysik und extraterrestrische Physik (IGEP), Tech-nische Universität Braunschweig, Mendelssohnstr. 3, 38106 Braun-schweig, Germany
11 The University of Kent, School of Physical Sciences, Canterbury,Kent, CT2 7NZ, UK
12 Department of Information Engineering, University of Padova, ViaGradenigo 6/B, 35131 Padova, Italy
13 CNR-IFN UOS Padova LUXOR, Via Trasea, 7, 35131 Padova , Italy14 International Space Science Institute, Hallerstraße 6, 3012 Bern,
Switzerland15 Centro de Astrobiología, CSIC-INTA, 28850 Torrejón de Ardoz,
Madrid, Spain16 Scientific Support Office, European Space Agency, 2201, Noord-
wijk, The Netherlands17 PAS Space Research Center, Bartycka 18A, PL-00716 Warszawa,
Poland18 Department of Astronomy, University of Maryland, College Park,
MD, 20742-2421, USA19 INAF - Osservatorio Astronomico, vicolo dell’Osservatorio 5,
35122 Padova, Italy20 University of Trento, Via Mesiano, 77, 38100 Trento, Italy21 Department of Industrial Engineering – University of Padova, via
Venezia 1, 35131 Padova, Italy22 INAF - Osservatorio Astronomico, Via Tiepolo 11, 34014 Trieste,
Italy23 Instituto de Astrofísica de Andalucía (CSIC), c/ Glorieta de la As-
tronomía s/n, 18008 Granada, Spain24 National Central University, Graduate Institute of Astronomy, 300
Chung-Da Rd, Chung-Li 32054, Taiwan25 Operations Department, European Space Astronomy Centre/ESA,
28691 Villanueva de la Canada, Madrid, Spain26 Institut für Datentechnik und Kommunikationsnetze der TU Braun-
schweig, Hans-Sommer-Str. 66, 38106 Braunschweig, Germany
Article number, page 16 of 16