otabor - data and information gathering: lessons learned ... · data and information gathering:...
TRANSCRIPT
District of Columbia
Data and Information Gathering: Lessons Learned in Developing D.C.’s First Tax Expenditure Evaluation
Report
Charlotte Otabor and Lori Metcalf, Fiscal Analysts Federation of Tax Administrators Conference
October 18, 2016
*The information provided in this presentation does not represent the views of the Office of the Chief Financial Officer nor the District of Columbia. They are my personal views on the topic presented.
District of Columbia
Outline
n D. C. tax expenditure report review
§ Overview
n Information and data gathering § Housing provisions overview § Housing goals § Methodology § Example: homestead deduction
n Lessons learned
n Report recommendations
2

District of Columbia
3
Tax Expenditure Review Requirement
• D.C. Law 20-155, “FY15 Budget Support Act of 2014,” requires CFO review of all local tax preferences (abatements, credits, and exemptions) on a five-year cycle
• Among other things, the review should: • Be published annually • Analyze and report Individual preferences in groupings of similarly purposed
preferences, focusing on the collective effects or trends that emerge • State the purpose of the tax preferences within the groupings • Include the amount of lost revenue due to the tax preferences • Include recommendations on how to improve similar preferences in the future

District of Columbia
Tax Expenditure Report: Policy Areas
Program Area Total aggregate estimated revenue loss
# (# of provisions) ($ millions)
1 Housing (28) 116.5
2 Environment (6) 5.7 3 Public Safety (2) 3.6 4 Transportation (3) 11.9 5 Tax Administration (10) 87.8
6 Economic Development (25) 366.8
7 Education (5) 108.2
8 Health (7) 31.4 9 Employment (3) .453
10 Social Policy (14) 234.3 11 Income Security (12) 96.5 12 General Law (9)
4

District of Columbia
FY2015 All District Tax Expenditures, by Policy Area
5
16%
10%
5%
5%
4% 4%
1% 1%
0.26% 0.17% 0.02%
53.98%
Economic Development
Social Policy
Housing
Education
Income Security
Tax Administration
Health
Transportation
Environment
Public Safety
Employment
General Law
General Law: $1.2 billion
Total= $2.6 billion

District of ColumbiaFY2015 Local District Tax Expenditures, by Policy
Area
6
Source: ORA Analysis of 2014 District of Columbia Tax Expenditure Report. Housing total updated to reflect updated estimates as of June 2015.
Note: Does not include certain tax expenditures that are not assigned to a policy area. Further, summing tax expenditures does not take into account possible interactions among individual tax expenditures so does not produce an exact estimate of the revenue that would be gained were any specific provision removed. Some evidence suggests that interaction effects generally increase the overall size of federal tax expenditures since eliminating tax expenditures would push many into higher tax brackets.
34%
22% 11%
11%
9% 8% 3% 1%
Economic Development
Social Policy
Housing Education
Income Security
Tax Administration
Health
Transportation
Environment
Public Safety
Employment
Total = $1.04 billion
Housing Tax Expenditures = $117 million

District of Columbia
Information and Data Gathering : Housing Overview
7
The District’s Housing Policy Goals
n Homeownership and protecting homeowners from sharp property tax increases Ø Homestead deduction and assessment increase cap
n Affordable Housing

District of ColumbiaInformation and Data Gathering: Housing Overview
8
DC still has the third lowest homeownership rate (42 percent) of major US cities, behind New York and Los Angeles. This trend does not follow the US average; the country as a whole had a homeownership rate from 2009-2013 of nearly 65 percent
DC Homeownership Rates 2000-2013
39
40
41
42
43
44
45
46
47
48
2000 2001 2002 2003 2004 2005 2006 2007 2008 2009 2010 2011 2012 2013
Rates (%)

District of ColumbiaInformation and Data Gathering: Housing Overview
9
Percentage of Rent Distribution as a Share of Income in DC, 2009 and 2013
0%
5%
10%
15%
20%
25%
30%
> 10% 10 - 14.9% 15 - 19.9% 20 - 24.9% 25 - 29.9% 30 - 34.9% 35 - 39.9% 40 - 49.9% 50+ %
% o
f pop
ulat
ion
% of income paid toward rent
2009 2013

District of ColumbiaTypes of Housing Tax Provisions
§ 28 Categorical provisions generally support four activities: – assist low-income homeownership (9); – protect low-income and seniors/disabled from tax increases (7); – increase supply of affordable housing (7); – and encourage revitalization and new development (4)
§ 31 Individual provisions largely intended to promote affordable (20 have
affordability measures) and mixed income housing
10
District of Columbia
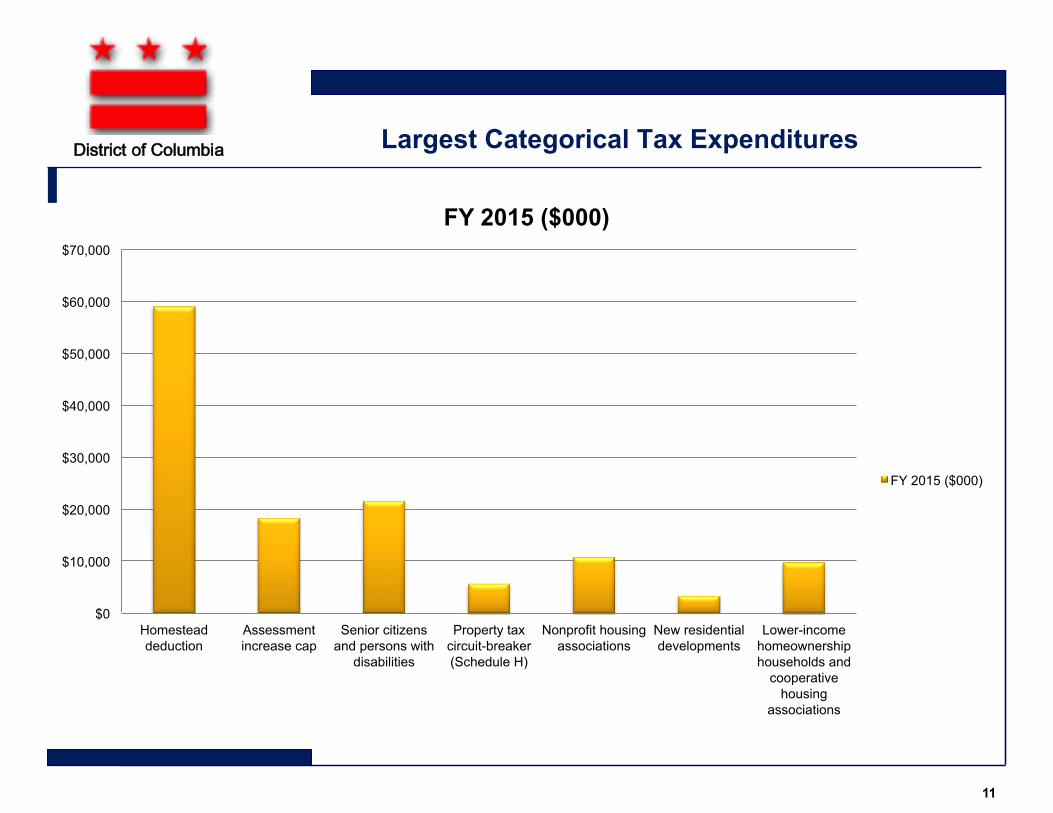
Largest Categorical Tax Expenditures
11
$0
$10,000
$20,000
$30,000
$40,000
$50,000
$60,000
$70,000
Homestead deduction
Assessment increase cap
Senior citizens and persons with
disabilities
Property tax circuit-breaker (Schedule H)
Nonprofit housing associations
New residential developments
Lower-income homeownership households and
cooperative housing
associations
FY 2015 ($000)
FY 2015 ($000)

District of Columbia Report Methodology
12

District of ColumbiaData Sources
Within the OCFO: § Office of Revenue Analysis (ORA) § Office of Tax and Revenue (OTR)
Other agencies: § Department of Housing and Community Development (DHCD) § Office of the Deputy Mayor for Planning and Development (DMPED) § Pew Trust § Center for Nonprofit Housing and Economic Development (CNHED)
Data: § Real Property Tax data (RPT) and Income Tax Data § Fiscal Impact Statements and Tax Abatement Financial Analysis § Tax Expenditure Reports and other relevant ORA reports, such as Tax Facts, for
information or data § Exempt Property Use Report (Form FP 161)-Full exemptions (and from 2012
abatements) § Aggregated data from DMPED § DC Code and Municipal Regulations
Data we would have liked to add:
§ Monitoring Reports from different government agencies
13

District of Columbia
Categorical Provision- Homestead Deduction
14
Homestead Deduction
The Need: The purpose of the homestead deduction is to encourage individuals to own and occupy homes in the District of Columbia and to provide tax relief to resident homeowners.
Resources/Inputs: Residents owning and living in their residence for the entire year may deduct $71,400 (in 2015) from the value of their home before calculating property taxes owed. It is categorized as an exemption. The revenue foregone was estimated to be $59,334,000 in FY15.
Outputs: From 2010 to 2014, an average of 95,336 residents took the homestead deduction per year. In 2014, the average tax savings for each resident was $600.
Expected Benefits (changes in short, medium, or long term measures)
Short-term: In TY14, 45% of the district’s taxable residential property, or 6,142 acres with a total value of $49.7 billion, was allowed the homestead deduction in order to promote homeownership.
Medium-term: The rate of homeownership in the District rises as more residents choose to stay in their homes than might otherwise do so without the deduction, while new residents may also see the tax benefit as a reason to move into the District.
Long-term: Various positive benefits for both long-term residents and the city. The city benefits because home ownership strengthens neighborhoods as homeowners have stake in community; more diverse city/neighborhoods; building a middle class tax base for economic and tax base stability.
Assumptions: Homestead Exemptions encourage homeownership, which, at least to a certain degree, promotes staying in DC versus moving out of the city.

District of Columbia
Categorical Provision- Homestead Deduction
15
10,396 10,243
16,094 16,335
13,454 14,326
9,769
5,167
19,395
26,468
27,832
22,902 22,006
26,396
18,637
11,894
54% 39%
58% 71%
61% 54%
52%
43%
0
5,000
10,000
15,000
20,000
25,000
30,000
1 2 3 4 5 6 7 8 Ward
Total # of Homesteads Total # Residen=al proper=es

District of Columbia
Categorical Provision- Homestead Deduction
16

District of Columbia
Categorical Provision- Homestead Deduction
Cities Median House Value
Homestead Deduction Amount
Homestead Deduction as a Percent of House value
Washington, DC $373,500 $ 69,100 19%
Baltimore, MD $270,000 N/A 0%
New York, NY $392,700 $ 30,000 8%
Los Angeles, CA $453,500 $7,000 2%
San Francisco, CA $602,800 $7,000 1%
Chicago, IL $206,300 $7,000 3%
Philadelphia, PA $233,600 N/A 0%
17
Source: ORA, 2013 Tax Rates and Tax Burdens: median house value from Census ACS.

District of ColumbiaFindings-Lesson Learned
§ Housing Provisions are complicated!
§ Financing of a property sometimes require the cooperation from various government agencies
§ Figuring out who to talk to
§ Who monitors whom? § Vagueness of some legislation
§ Data collected on the provisions must be mapped to the way they are defined in the statute, is legislative definition do not line up with data storage
§ The code for a lot properties that receive an exemption because they provide housing is actually a "Miscellaneous" code
§ Some nonprofits housing providers could be coded as “charities” instead of housing providers
18
District of ColumbiaFindings-Lesson Learned
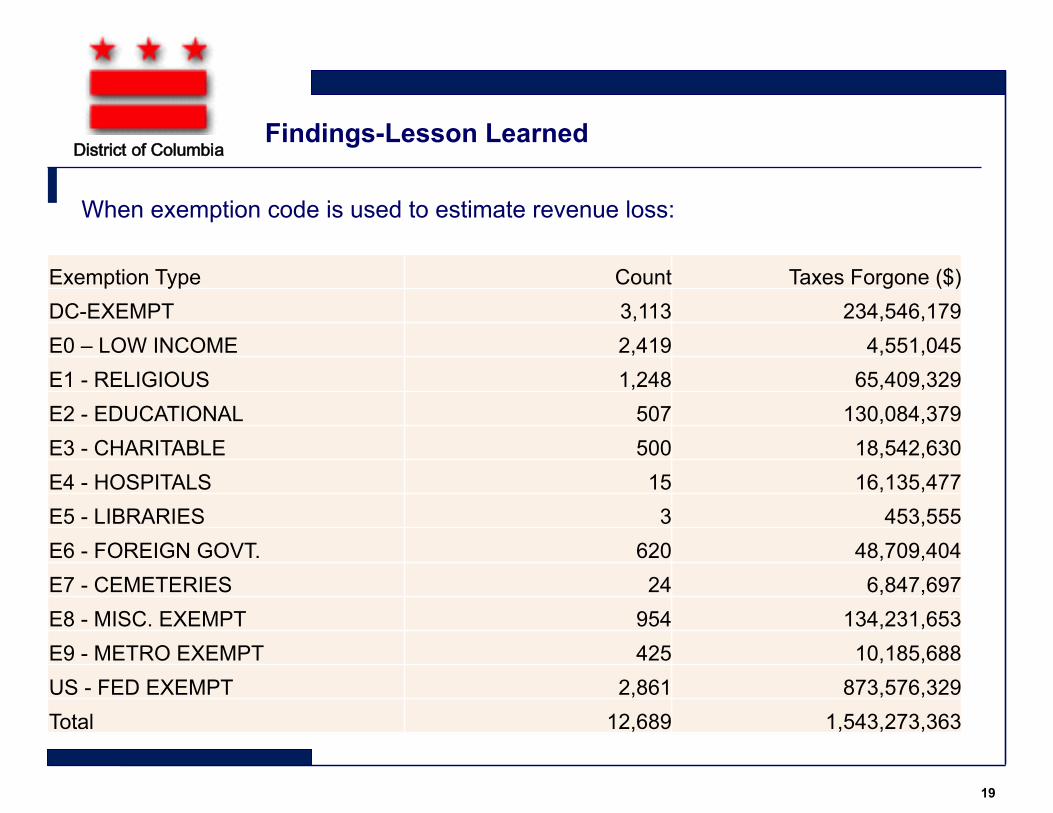
Exemption Type Count Taxes Forgone ($) DC-EXEMPT 3,113 234,546,179 E0 – LOW INCOME 2,419 4,551,045 E1 - RELIGIOUS 1,248 65,409,329 E2 - EDUCATIONAL 507 130,084,379 E3 - CHARITABLE 500 18,542,630 E4 - HOSPITALS 15 16,135,477 E5 - LIBRARIES 3 453,555 E6 - FOREIGN GOVT. 620 48,709,404 E7 - CEMETERIES 24 6,847,697 E8 - MISC. EXEMPT 954 134,231,653 E9 - METRO EXEMPT 425 10,185,688 US - FED EXEMPT 2,861 873,576,329 Total 12,689 1,543,273,363
19
When exemption code is used to estimate revenue loss:

District of ColumbiaFindings-Lesson Learned
§ How can tax revenues forgone be estimated?
§ Incomplete information
§ Using assessment values?
§ Time consuming o SSL (geographic location code) change overtime
20

District of Columbia
Self-Monitoring: Exempt Property Use Report (Form FP-161)
3. Was any building, structure, or grounds, or any portion thereof used by the institution or
organization, or the occupant thereof, to secure direct, indirect, or in-kind rent or income
during the year? Yes No
If yes, give details. Please refer to enclosed instructions, number 7 ______________________________
_____________________________________________________________________
State the square footage of the space provided, the tenant’s name, the period of time the space was used to
secure rent or income, and the amount of rent. _________________________________________________
_____________________________________________________________________
_____________________________________________________________________
4. Since last year has the use of any building or grounds, or any portion thereof, changed? Yes No
If yes, give details. _____________________________________________________________________
_____________________________________________________________________
_____________________________________________________________________
_____________________________________________________________________
21

District of Columbia
Report Recommendations
1. Standardize affordability requirements across housing tax preferences;
2. Clarify which agency is responsible for monitoring compliance with tax expenditure terms and assign a third party body to oversee the monitoring of District housing tax incentives;
3. Require recipients of tax expenditures to remain in compliance with the original terms in order to keep receiving the tax preference; include claw backs if they do not;
4. Require all entities receiving tax preferences to submit an annual report, proving they remain in compliance. Where possible, make this data publicly available; and
5. Use more granular or specific codes for data on tax expenditure recipients in OTR’s ITS system.
22

District of Columbia
Lessons Learned and Concluding Thoughts
§ Reviewing and evaluating tax expenditures is a long-term process. The new requirement in DC has highlighted some ways that data collection and organization can be improved.
§ The first review of each policy area’s tax expenditures will be very exploratory as we learn what data are available, who (if anyone) is collecting data, whether we can obtain it, and how it is organized.
§ With more output data, more thorough reviews and evaluations may be performed. This could take a couple of cycles of review.
23

District of Columbia
Thank you! and Questions??
24