ott mf pro manual
TRANSCRIPT

DOC026.53.80211
OTT MF pro07/2012, Edition 3
Operating Instructions


Table of ContentsSpecifications ..............................................................................................................3
Sensor specifications...................................................................................................3Portable meter specifications.......................................................................................3User interface specifications........................................................................................4General specifications.................................................................................................4
General information ..................................................................................................4Safety information........................................................................................................5
Use of hazard information....................................................................................5Precautionary labels .............................................................................................5Certification...........................................................................................................5
Product overview.........................................................................................................6System overview..................................................................................................6Sensor overview...................................................................................................7Meter overview.....................................................................................................8Product components .............................................................................................8
Installation .....................................................................................................................9Installation with optional accessories ...........................................................................9Install the sensor on the universal sensor mount ........................................................9Connect the sensor to the meter ...............................................................................10Attach the lanyard......................................................................................................10Attach the velcro strap...............................................................................................11
User interface and navigation ............................................................................11Keypad and key functions..........................................................................................11Status bar ..................................................................................................................12Navigation and Main Menu .......................................................................................13
Startup and self-test ...............................................................................................17Sleep mode................................................................................................................17
Operation .....................................................................................................................18Stream profiles ...........................................................................................................18
Stations and station spacing...............................................................................18Measure velocity .................................................................................................18
Measure velocities in a cross-section.......................................................... 19Insert or delete a station..............................................................................21
Conduit profiles ..........................................................................................................220.9 x Vmax measurement method......................................................................220.2/0.4/0.8 method..............................................................................................23Velocity/Level Integration measurement method...............................................232D measurement method...................................................................................24
Download data...........................................................................................................25Delete data files ..................................................................................................25
Maintenance ...............................................................................................................25Download the PVM utility ...........................................................................................25Update the firmware..................................................................................................25Clean the sensor ........................................................................................................26Clean the meter .........................................................................................................27
1

Install or replace the battery ......................................................................................27Charge the battery .....................................................................................................28
Troubleshooting .......................................................................................................28Diagnostics ................................................................................................................28Troubleshoot errors ...................................................................................................29
Replacement parts and accessories ...............................................................29
Appendix ......................................................................................................................30Mean-section and Mid-section methods....................................................................30Profiles and measurements .......................................................................................32Site selection.............................................................................................................33Do a velocity calibration.............................................................................................33Wet/Dry threshold ......................................................................................................33
Table of Contents
2

SpecificationsSpecifications are subject to change without notice.
Sensor specificationsSpecification Details
Velocity measurement
Method Electromagnetic
Range 0 to 6.09 m/s (0 to 20 ft/s)
Minimum water depth 3.18 cm (1.25 in.)
Accuracy ±2% of reading ±0.015 m/s (±0.05 ft/s) 0 to 3.04 m/s (0 to 10 ft/s); ± 4% of reading from3.04 to 4.87 m/s (10 to 16 ft/s)
Resolution 0.01 value < 100; 0.1 value < 1000; 1.0 value ≥ 1000
Zero stability ±0.015 m/s (±0.05 ft/s)
Material ABS, glass filled
Enclosure rating IP68
Dimensions (L x W x H) 11.9 x 4.3 x 6.3 cm (4.7 x 1.7 x 2.5 in.)
Cable material Polyurethane jacketed
Cable lengths 1.5, 6.1, 12.2 and 30.5 m (5, 20, 40 and 100 ft)
Depth measurement
Method Diaphragm type: absolute pressure with single point calibration
Accuracy (static) The larger of ± 2% of reading or ± 0.015 m (± 0.504 inches). Steady state temperatureand static non-flowing water.
Range 3.05 m (0-10 ft)
Resolution 0.01 value < 100; 0.1 value < 1000; 1.0 value ≥ 1000
Portable meter specificationsSpecification Details
Pollution degree 2
Protection class II
Charging temperature 0 to 40 ºC (32 to 104 ºF)
Operating temperature –20 to 55 ºC (-4 to 131 ºF)
Storage temperature –20 to 60 ºC (-4 to 140 ºF )
Enclosure rating IP67
Battery life gauge Five-segment bar graph
Battery type Rechargeable lithium ion, 3.7 V, 4.2 Ah
Battery life 18 hours heavy typical day use1; 20 ºC (68 ºF)
Battery charger External Class III power adapter 100–240 VAC, 50–60 Hz, 0.3 A input; 12 VDC, 1.0 Aoutput
Dimensions (L x W x H) 21.8 x 9.3 x 5.3 cm (8.6 x 3.7 x 2.1 in.)
English 3

Specification Details
USB connector Type Mini-B, 5-pin, rated to IP67 when capped
Material Polycarbonate with a thermoplastic elastomer (TPE) overmold
1 Defined as 30 minutes of set up, six 1-hour periods of continuous use with an active sensor and the display atmaximum brightness and 30 minutes of sleep mode between use periods, data download and power off.
User interface specificationsSpecification Details
Graphics display Color, LCD 3.5" QVGA transflective (readable in direct sunlight)
Measurement resolution 0.01 value < 100; 0.1 value < 1000; 1.0 value ≥ 1000
Keypad Alpha-numeric
Operating modes Real time, profiling
Profile types Stream, conduit
Conduit shapes Circular, rectangular, trapezoidal, 2/3 egg, inverted 2/3 egg
Stream entries Fixed, non-fixed stations
Noise rejection User-selectable, 50 Hz or 60 Hz
Units of measure Velocity: ft/s, m/s, cm/s, mm/s
Flow: ft3/sec, million gal/day, gal/day, gal/min, m3/s, m3/min, m3/hour, m3/day, liters/s,liters/min
Depth: in., ft, m, cm, mm
Stream flow calculation Mean-section or mid-section method
Diagnostics Self test, keypad, display, event log
Conduit profiling methods 0.9 x Vmax, 0.2/0.4/0.8, velocity and level integrator, 2D
Stream profiling methods 1, 2, 3, 5 and 6 point (velocity method - USGS and ISO)
File types Real-time, profiling, event log
Languages English, French, Spanish, German, Italian, Dutch, Danish, Swedish, Chinese, Polish,Japanese, Korean, Portuguese, Slovak, Russian, Hungarian, Bulgarian, Romanian,Czech, Turkish, Finnish, Greek
General specificationsSpecification Details
Profiles Data storage for up to 10 profiles with 32 stations per profile
Maximum number of real-time files Three each with up to 75 readings captured by the user.
Firmware The sensor and portable meter are field upgradeable via USB
General informationIn no event will the manufacturer be liable for direct, indirect, special, incidental or consequentialdamages resulting from any defect or omission in this manual. The manufacturer reserves the right tomake changes in this manual and the products it describes at any time, without notice or obligation.Revised editions are found on the manufacturer’s website.
4 English
Safety informationN O T I C E
The manufacturer is not responsible for any damages due to misapplication or misuse of this product including,without limitation, direct, incidental and consequential damages, and disclaims such damages to the full extentpermitted under applicable law. The user is solely responsible to identify critical application risks and installappropriate mechanisms to protect processes during a possible equipment malfunction.
Please read this entire manual before unpacking, setting up or operating this equipment. Payattention to all danger and caution statements. Failure to do so could result in serious injury to theoperator or damage to the equipment.Make sure that the protection provided by this equipment is not impaired. Do not use or install thisequipment in any manner other than that specified in this manual.
Use of hazard information
D A N G E R Indicates a potentially or imminently hazardous situation which, if not avoided, will result in death or serious injury.
W A R N I N G Indicates a potentially or imminently hazardous situation which, if not avoided, could result in death or seriousinjury.
C A U T I O N Indicates a potentially hazardous situation that may result in minor or moderate injury.
N O T I C E Indicates a situation which, if not avoided, may cause damage to the instrument. Information that requires specialemphasis.
Precautionary labels
This symbol, if noted on the instrument, references the instruction manual for operation and/or safetyinformation.
This symbol indicates the presence of devices sensitive to Electro-static Discharge (ESD) andindicated that care must be taken to prevent damage with the equipment.
Electrical equipment marked with this symbol may not be disposed of in European public disposalsystems after 12 August of 2005. In conformity with European local and national regulations (EUDirective 2002/96/EC), European electrical equipment users must now return old or end-of-lifeequipment to the Producer for disposal at no charge to the user.Note: For return for recycling, please contact the equipment producer or supplier for instructions on how to return end-of-life equipment, producer-supplied electrical accessories, and all auxiliary items for proper disposal.
CertificationCanadian Radio Interference-Causing Equipment Regulation, IECS-003, Class A:Supporting test records reside with the manufacturer.This Class A digital apparatus meets all requirements of the Canadian Interference-CausingEquipment Regulations.Cet appareil numèrique de la classe A respecte toutes les exigences du Rëglement sur le matérielbrouilleur du Canada.FCC Part 15, Class "A" LimitsSupporting test records reside with the manufacturer. The device complies with Part 15 of the FCCRules. Operation is subject to the following conditions:
English 5

1. The equipment may not cause harmful interference.2. The equipment must accept any interference received, including interference that may cause
undesired operation.
Changes or modifications to this equipment not expressly approved by the party responsible forcompliance could void the user's authority to operate the equipment. This equipment has been testedand found to comply with the limits for a Class A digital device, pursuant to Part 15 of the FCC rules.These limits are designed to provide reasonable protection against harmful interference when theequipment is operated in a commercial environment. This equipment generates, uses and canradiate radio frequency energy and, if not installed and used in accordance with the instructionmanual, may cause harmful interference to radio communications. Operation of this equipment in aresidential area is likely to cause harmful interference, in which case the user will be required tocorrect the interference at their expense. The following techniques can be used to reduceinterference problems:
1. Disconnect the equipment from its power source to verify that it is or is not the source of theinterference.
2. If the equipment is connected to the same outlet as the device experiencing interference, connectthe equipment to a different outlet.
3. Move the equipment away from the device receiving the interference.4. Reposition the receiving antenna for the device receiving the interference.5. Try combinations of the above.
Product overviewThe portable velocity system is used in the field, laboratory and municipalities. Turbulent, noisy andlow flows can be measured with this system.When the sensor is placed in flowing water, a magnetic field around the sensor creates a voltageproportional to the flow velocity. This voltage amplitude, which represents the rate of water flowaround the sensor, is detected by electrodes in the sensor and processed by the sensormicroprocessor. The processed signal is digitally transmitted through the sensor cable to the portablemeter and the information is shown on the meter display. The system includes a portable meter,sensor with cable and accessories.The meter and sensor get velocity information in conduits and streams. These measurements areimportant for calibration in municipal wastewater industries, as well as for developing and maintainingstage discharge relationship curves.Two types of sensor are available: velocity-only and velocity plus depth. This manual covers bothtypes of sensors. If information applies to a specified type of sensor, this fact is noted in the text.
System overviewAn overview of the assembled system is shown in Figure 1 . Refer to the documentation suppliedwith the individual components or accessories for more information.
6 English
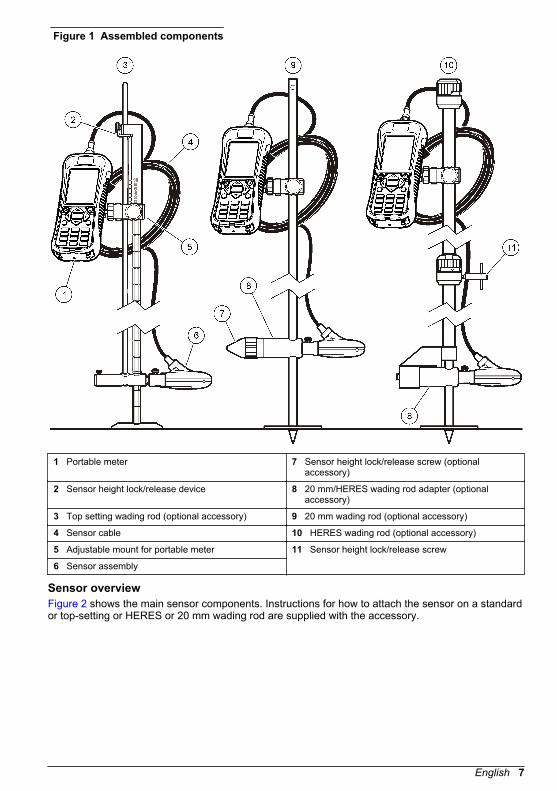
Figure 1 Assembled components
1 Portable meter 7 Sensor height lock/release screw (optionalaccessory)
2 Sensor height lock/release device 8 20 mm/HERES wading rod adapter (optionalaccessory)
3 Top setting wading rod (optional accessory) 9 20 mm wading rod (optional accessory)
4 Sensor cable 10 HERES wading rod (optional accessory)
5 Adjustable mount for portable meter 11 Sensor height lock/release screw
6 Sensor assembly
Sensor overviewFigure 2 shows the main sensor components. Instructions for how to attach the sensor on a standardor top-setting or HERES or 20 mm wading rod are supplied with the accessory.
English 7
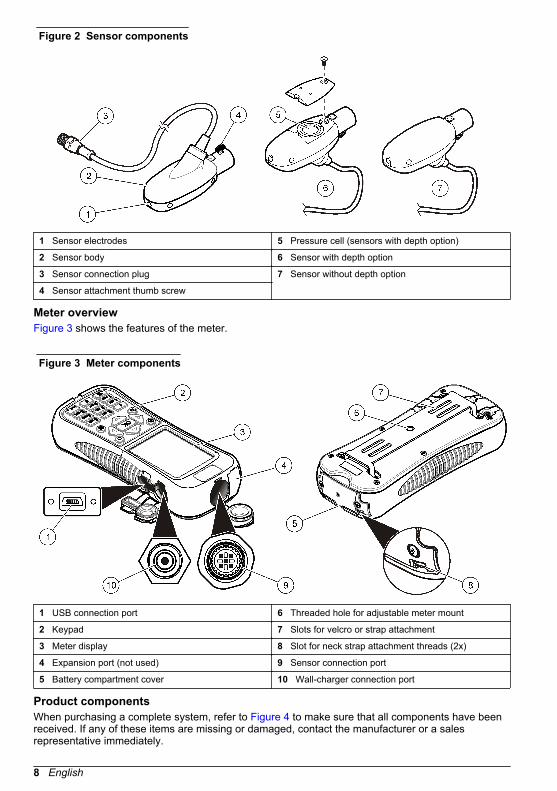
Figure 2 Sensor components
1 Sensor electrodes 5 Pressure cell (sensors with depth option)
2 Sensor body 6 Sensor with depth option
3 Sensor connection plug 7 Sensor without depth option
4 Sensor attachment thumb screw
Meter overviewFigure 3 shows the features of the meter.
Figure 3 Meter components
1 USB connection port 6 Threaded hole for adjustable meter mount
2 Keypad 7 Slots for velcro or strap attachment
3 Meter display 8 Slot for neck strap attachment threads (2x)
4 Expansion port (not used) 9 Sensor connection port
5 Battery compartment cover 10 Wall-charger connection port
Product componentsWhen purchasing a complete system, refer to Figure 4 to make sure that all components have beenreceived. If any of these items are missing or damaged, contact the manufacturer or a salesrepresentative immediately.
8 English

Figure 4 System components
1 Carrying case (with slot for sensor cable) 7 Cloth to dry the sensor
2 USB communication cable 8 Universal sensor mount
3 Adjustable portable meter mount 9 Velcro strap
4 Wall charger and universal plug kit 10 Lanyard
5 Sensor 11 Portable meter
6 Extra thumb screws (4x) 12 Sensor as connected to meter inside case
Installation
Installation with optional accessoriesMount the meter on an optional wading rod for use in low-stage stream environments where thestream can be waded. Optional accessories let the user take measurements from a bridge or cableover a stream. A torpedo shaped weight attached below the sensor keeps the sensor in place whenunder water. For more information, refer to the documentation supplied with the accessory.
Install the sensor on the universal sensor mountUse the universal sensor mount to attach the sensor to poles 1 inch or less in diameter. For correctoperation and accurate readings, the front of the sensor must be pointed upstream with theelectrodes in full contact with the flow.Note: Keep the sensor electrodes free from nonconductive substances such as oil and grease. To remove sensorcontamination, refer to Clean the sensor on page 26.
1. The front part of the sensor is round and contains three electrodes. The sensor has a mountinghole in back and a thumbscrew on top. Put the mounting shaft of the universal mount in themounting hole at the back of the sensor. Make sure that the mounting shaft is completelyengaged with the mounting hole and the thumbscrew is engaged with the groove.
2. Hand tighten the thumbscrew.3. Move a pole 1 inch or less in diameter through the clamp of the universal sensor mount. Tighten
the clamp.Note: Instructions for how to mount the sensor on a standard, top-setting, HERES or 20 mm wading rod aresupplied with the accessory.
English 9

Connect the sensor to the meter
Attach the lanyardAttach the lanyard to wear the meter safely around the neck.
10 English
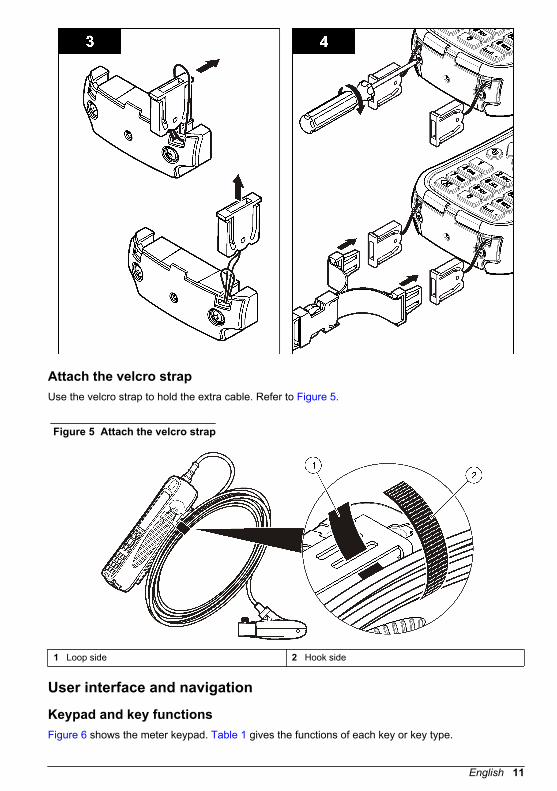
Attach the velcro strapUse the velcro strap to hold the extra cable. Refer to Figure 5.
Figure 5 Attach the velcro strap
1 Loop side 2 Hook side
User interface and navigation
Keypad and key functionsFigure 6 shows the meter keypad. Table 1 gives the functions of each key or key type.
English 11

Figure 6 Keypad
1 Power On/Off 6 Main Menu
2 OK 7 Underscore or decimal
3 Up and Down arrows 8 Backspace
4 Quick Jump 9 Alpha-numeric
5 Right and Left arrows 10 Previous menu
Table 1 Key description
Key Description
Power On/Off Energizes and de-energizes the meter.
OK Confirms an entry or highlighted menu option.
Up and Down arrows Moves up or down in the display. If the cursor is at the top or bottom of the display, thecursor wraps to the bottom or top when the UP or DOWN arrow is pushed.
Quick Jump In normal operation, this key jumps to the Select conduit shape screen.If the auto-zero feature is disabled, hold this key for five seconds to do a manual zero ofthe depth sensor.In Real-Time mode, the Quick Jump key toggles between the digital and graph views.
Right and Left arrows Moves to the right or left in the display.
Main Menu Moves to the Main Menu from any submenu or screen.
Underscore or decimal Puts in an underscore or decimal character. In numeric-only fields, this key automaticallyputs a decimal point in the cursor position.
Backspace Moves the cursor back one space.
Alpha-numeric Puts in the key alpha or numeric value. Values are put in the order shown on the key.After 2 seconds, the value shown in the display is stored and the cursor advances.
Previous menu Moves to the previous screen.
Status barA status bar is shown in the top of the display. Descriptions of the information in the status bar aregiven in Table 2.
12 English

Table 2 Status bar indicators
Indicator Description
Time and Date Shows the current time and date.
USB Shows when a USB cable is connected. If a USB cable is connected and this indicatordoes not show in the status bar, the USB cable is not fully engaged. Make sure that theUSB cable is pushed in completely and makes full contact with the connection port.
Conductivity If the sensor is out of the water and non-conductive, a blue ring appears next to thebattery icon. If the sensor is in the water and conductive, the indicator is a solid bluecircle.
Battery A five-bar graph shows the level of charge in the battery.
File access Shows while the meter gets access to a file.
Auto zero depthindicator
If the depth sensor was zeroed in the last 30 minutes, a solid green circle shows next tothe Conductivity indicator. If the depth sensor was not zeroed in the last 30 minutes,this indicator flashes red.
Navigation and Main MenuPush OK to confirm a selected menu option or a value shown in the display. Select More and pushOK to see additional screens and options if available. Push the Main Menu button to go to the MainMenu from a submenu.Note: Some operations cannot be completed unless a sensor is connected to the meter. If these operations aretried when there is no sensor connected, the display shows an error message. Connect a sensor and try theoperation again.
1. Real time—Select this option to get real-time velocity and depth information. (A sensor withdepth capability is necessary to read depth). An example of a Real Time screen for sensors withvelocity only is shown in Figure 7. Real time screens for sensors with both velocity and depth isshown in Figure 8. The format of the information and options shown depends on the type ofsensor used. In Real Time mode, the Quick Jump key toggles between digital and graphic viewsof Real Time information. The velocity is updated in FPA filter mode according to fixed periodaveraging time. In RC filter mode, the velocity is updated continuously on the screen every250 ms.
Option Description
Capture Stores the depth and velocity information shown in memory. The information is saved untilpower is cycled, the memory is saved to a non-volatile real-time file, or the user exits from real-time mode.
Save Saves captured measurements in the volatile memory to a non-volatile real-time file. Amessage will show if the number of files is greater than the maximum possible. Files arestored in tab delimited (.tsv) format.
Done or OK Exits the real-time mode and returns to the Main Menu. If there is unsaved data in volatilememory, a confirmation message asks the user to confirm the exit without saving the data.
Clear Clears captured measurements from the volatile memory buffer. The user can choose fromClear Last, Clear All or Cancel options.
English 13
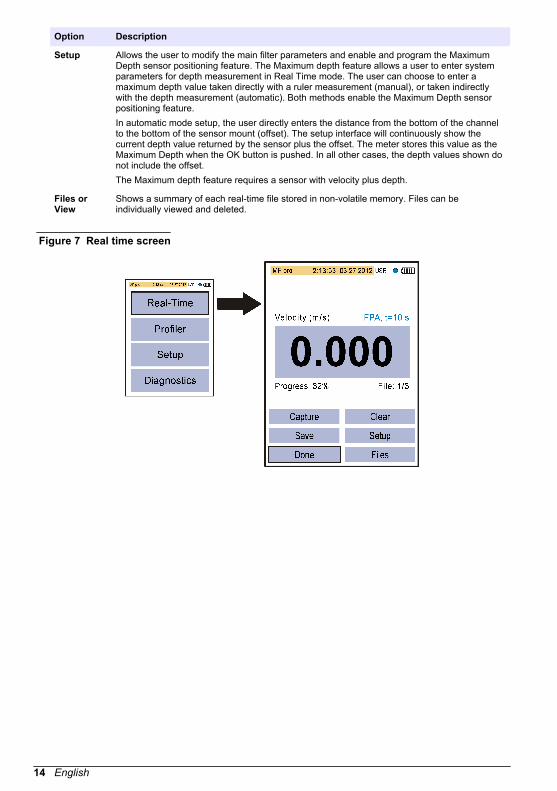
Option Description
Setup Allows the user to modify the main filter parameters and enable and program the MaximumDepth sensor positioning feature. The Maximum depth feature allows a user to enter systemparameters for depth measurement in Real Time mode. The user can choose to enter amaximum depth value taken directly with a ruler measurement (manual), or taken indirectlywith the depth measurement (automatic). Both methods enable the Maximum Depth sensorpositioning feature.In automatic mode setup, the user directly enters the distance from the bottom of the channelto the bottom of the sensor mount (offset). The setup interface will continuously show thecurrent depth value returned by the sensor plus the offset. The meter stores this value as theMaximum Depth when the OK button is pushed. In all other cases, the depth values shown donot include the offset.The Maximum depth feature requires a sensor with velocity plus depth.
Files orView
Shows a summary of each real-time file stored in non-volatile memory. Files can beindividually viewed and deleted.
Figure 7 Real time screen
14 English

Figure 8 Real time screen for sensor with depth
2. Profiler— Select this option to do stream or conduit velocity measurements. The meter showsprompts when user input is necessary. The meter saves up to 10 profiles with up to 32 stationsper profile. This number can be greater if data acquisition time is less than the maximum. Apercentage of the remaining memory is given in 1% resolution. Refer to the Appendixon page 30 for more information about profiles.
Option Description
Stream This option is used to set up a profile for a stream or flowing channel. Do velocity measurements tocalculate total discharge based on ISO 748 or USGS standards for Mid-section or Mean-sectionmethods.
Conduit This option is used to set up a profile for a conduit.
Files This option is used to view or delete stored files. Files can be deleted all at once or individually.
Setup This option is used to set up or change the settings for filter parameters and the Maximum Depthfeature.
3. Set up—Select this option to change general system settings and preferences.
Option Description
Velocitycalibration
Calibrates the sensor. Adds a field offset to the factory calibration. Refer to the Appendixon page 30 for more information.
English 15

Option Description
Filterparameters
Applies a data acquisition filter (Main filter or Pre-filter). The user can select the filterparameters.Main filter
• Fixed Period Averaging (FPA)—Fixed Period Averaging averages data over a userselectable fixed period of time (1 to 480 seconds). The default is 30 seconds. If the FPAvalue is 5, the velocity value shown in the display is updated once every 5 seconds.
• RCA time constant—The RC filter helps smooth out turbulence through the use of aselected time constant in the filter algorithm. This mode is useful when searching for amaximum velocity, for example in the common 0.9 x Vmax profile method. High RC filtertime constants give higher degrees of smoothing. The time constant can be set from 2 to20 seconds, with a default value of 6. At 1 time constant, the filter settles toapproximately 60% of the final value. At 5 time constants, the filter settles to 99.9% ofthe final value. Thus, if the RC value is set to 2, the final value shows after 10 seconds.
Pre-filter
• Median filter—The filtering process is done in the sensor. The feature can be disabled.However, the recommended (default) value is 5. Enable the feature to enter or changethis value.
Wet/drythreshold
Sets the sensor submersion threshold for wet and dry conditions. The default value is 20%.Refer to Wet/Dry threshold on page 33 for more information.
Auto zerodepth
Sets the Auto Zero feature to On or Off.If set to On, the instrument does an air calibration when the sensor is removed from thewater and is in the air. To do the air calibration, the instrument automatically zeroes thesensor.If set to Off, the user can manually zero the sensor. To do this, remove the sensor from theflow, then push and hold the Quick Jump key for five seconds.When the sensor has been in the flow for 30 minutes, the green circle in the upper rightcorner goes from green to red. This is a prompt to the user to remove and zero the sensoragain.
EMI Sets the local line frequency for ambient noise rejection to 50 Hz (default) or 60 Hz .
Clock Sets the date and time of the portable meter in 24-hour format. Daylight savings time is notsupported.
USB Sets the USB mode.
• Mass Storage (default)—This mode operates like a memory stick or hard drive. Files areread-only.
• CDC—This mode is used to update firmware.
Language Selects the language used in the menus.
Units Sets the units for velocity, flow and depth measurements. Options are Metric (default) orEnglish .
Beeper On (default) or Off. If set to On, the meter makes an audible tone when the sensor is at thecorrect depth for applicable profile methods. The meter also makes an audible tone whenan inactive button is pushed in any menu. This feature is available only with the optionaldepth sensor.
Flowcalculation
Selects the method of flow calculation for open water segment (stream profiles only).Options are Mean-section or Mid-section. Refer to the Appendix on page 30 for moreinformation.
16 English

Option Description
Station entry • Fixed—The operator puts in the width of the stream and the number of stations formeasurements. The meter divides the cross-section into evenly spaced distancesbetween the station verticals.
• Non-fixed (default)—The operator selects the spacing between station verticals. This isthe more commonly used option as it lets the operator include obstructions and otherrestrictions in the cross section.
Restoredefaults
Sets all meter options to the factory default values.
4. Diagnostics— Select this option to troubleshoot problems with the meter or an attached sensor.For more information about the Diagnostics options, refer to Diagnostics on page 28.
Startup and self-testD A N G E R
Chemical or biological hazards. If this instrument is used to monitor a treatment process and/orchemical feed system for which there are regulatory limits and monitoring requirements related topublic health, public safety, food or beverage manufacture or processing, it is the responsibility of theuser of this instrument to know and abide by any applicable regulation and to have sufficient andappropriate mechanisms in place for compliance with applicable regulations in the event of malfunctionof the instrument.
W A R N I N G Fire and explosion hazards. Do not use or store the instrument in direct sunlight, near a heat source orin high temperature environments such as a closed vehicle in direct sunlight. Failure to take thisprecaution can make the battery overheat and cause a fire or explosion.
The battery must be installed in the meter and charged before use. For more information aboutbattery installation and replacement, refer to Install or replace the battery on page 27. Forinformation on how to charge the battery, refer to Charge the battery on page 28.Note: The meter is not operational while the battery charges.
1. Push the meter power button until an audible beep is heard.The meter does a self test and the display shows the results. If the meter fails the self-test, thedisplay shows FAIL next to the failed parameter. If the sensor fails, attach a different sensor ifavailable.
2. When the self test is complete, push OK to go to the Main Menu.3. To de-energize the meter, push the power button again. In the Confirmation screen, select Yes
and push OK.If the portable meter becomes unresponsive, push and hold the power button for more than3 seconds to force the power off. Do not force off the power in normal operation or when the fileaccess icon is visible.
Sleep modeThe meter backlight goes dim after 30 seconds of no activity and goes into sleep mode after60 seconds of no activity. These actions do not occur if the meter is in real-time mode or while themeter is measuring. After 30 minutes in sleep mode, the meter power goes off.To cancel the sleep mode, push any key. The display brightness goes back to the normal level andall keys go back to their normal functions.
English 17

Operation
Stream profilesStations and station spacingFor a well-chosen cross-section, division into 25 to 30 partial sections is typically sufficient. If thecross-section is very smooth and the velocity distribution very consistent, it is possible to decreasethe number of stations.Make the distance between the partial stations so that no individual station contains more than 10%of the discharge. The ideal measurement is one in which each partial station contains 5% or less (≤5%) of the total discharge, but this is rarely possible when 25 stations are used. Partial stationsshould not have equal widths across the entire cross-section unless the discharge is well-distributed.Distances between stations are generally smaller where water depth and flow velocities changesignificantly. Places where depth and velocities frequently change significantly include bank areas,vertical or steep slopes, ledges in divided cross-sections and transitions from the main stream bed tothe foreland. Stations should also be located at points of significant changes in the stream bedprofile.The measurement cross-section must be set at right angles to the direction of flow. Cross-sectionsmust not contain still areas, counter currents or eddies. Do not put the sensor in deep pools, belowlarge inflows, or near ship moorings, ferries or sluices.Use Table 3 as a guide for the number of stations necessary for an acceptable measurement. Theinformation is based on EN - ISO 748 standards.
Table 3 Number of stations in relation to the waterway width
Feet Meters Number of stations
< 1.6 < 0.5 5 to 6
> 1.6 and < 3.3 > 0.5 and < 1 6 to 7
> 3.3 and < 9.8 > 1 and < 3 7 to 12
> 9.8 and < 16.4 > 3 and < 5 13 to 16
> 16.4 ≥ 5 ≥ 22
Measure velocityMeasurement quality is dependent on the correct selection of a measurement cross-section. Select asection of stream with the following characteristics:
• The flow directions at each measurement point across the stream are parallel to the bank andperpendicular to the cross-section.
• The streambed is stable and free of large rocks, weeds and protruding obstructions such as piersthat cause turbulence.
It is often not possible to completely satisfy all of these conditions. Use the criteria to select the bestpossible section and then select a cross-section.The general procedure to take velocity measurements in river and stream profiles is described below.Make the first measurement in a stream profile at the top. Make each subsequent measurementbelow the last one.
• In fixed mode, divide the channel into stations of equal width.• Conduct a velocity measurement at each station. The portable meter shows and stores the depth
and measured velocity information.• When the stream profile is completed, the meter automatically calculates the total flow.
For accurate measurement results, stand to the side of the instrument. Refer to Figure 9.
18 English

Figure 9 Position of user in the flow
Measure velocities in a cross-sectionA typical stream cross-section is shown in Figure 10.
Figure 10 Example of a typical cross section
To measure velocities in a cross-section:
1. In the Main Menu, select Profiler.2. Enter the Operator name. A list of options will show.
Option Description
Stream Used for measurements in a stream profile.
Conduit Used for measurements in a conduit profile.
English 19

Option Description
Files Used to view or delete files.
Setup Used to set up filter parameters and the Maximum depth feature.
3. Select Setup > Maximum depth. Select Manual or Automatic.
Option Description
Manual In this mode, the instrument prompts the user to manually enter the maximum depth of eachvertical. This value is normally obtained from a wading rod.
Automatic In this mode (available only on sensors with the depth option), the instrument uses the pressuretransducer to measure the maximum depth at each vertical.
a. If Automatic is selected, enter the distance from the bottom of the channel to the bottom of thesensor mount.
b. Put the sensor at the lowest position on the wading rod.c. Enter the minimum depth (measured from the bottom) that the sensor can read. Refer to
Figure 11. When rods with a base plate and/or tip are used, this extra distance can be larger.This depends on whether the subsurface is firm or yields. The extra distance is important as aparameter for the correct determination of the water depth.
Figure 11 Minimum depth
4. Select Top or Bottom for the measurement reference then push OK.5. If necessary, change or update the filter parameters in Profiler Setup.6. In the Profiler menu, select Stream.7. Enter a name for the stream profile. Make profile names alpha-numeric with a maximum of
11 characters. Push OK to save the profile name or select Clear to delete all current streamprofile data.
8. Enter the stage reference. This is typically an elevation value from an immovable object such as asurvey marker or bridge, etc.
20 English
9. In the Station menu, select Edge/Obstruction. Select one of the options.
Option Description
Left Select this option if the station is at the left edge of the water or an obstruction (i.e, sandbar,pylon or large boulder).
Right Use this option if the station is at the right edge of water or an obstruction (i.e., sandbar, pylonor large boulder).
Open water Use this option to configure the edge as an open water environment (default).
10. Select Distance to Vertical and enter the information.11. Select Set Depth and enter the information. If at an edge, the meter automatically sets this value
to 0.00.
a. If Manual mode was selected in the Profiler setup, enter the total depth of water at this verticalposition.
b. If Automatic mode was selected in the Profiler setup, push OK to set the maximum flow depthat the value shown.
12. If Left or Right was selected in Step 9, enter an edge factor for the vertical. Select a factor fromthe list or User-defined. For User-defined values, enter a roughness factor between 0.50 (veryrough) and 1.00 (smooth). The roughness factor is relevant only for right angled cross sections. Itis used as a factor in the calculation of the discharge proportion of edge areas. For example:
• Smooth edge with no vegetation (e.g., concrete, steel, cement)— 0.8 to 0.9 • Brick sides with vegetation— 0.7 • Rough walls with heavy vegetation—0.6 to 0.5
13. Select Measure Velocity. Select the number of points on the vertical to collect.14. Select a measurement point from the list. Obey the instrument prompts and adjust the sensor to
the correct depth. If the sensor has a depth option, adjust the sensor depth until the depth box isgreen. This means the sensor is in at the correct position.Note: Red indicates more adjustment is necessary. Yellow indicates the depth is close to the correct depth.
15. Select Capture to start the measurement process.16. If necessary, the setup can be changed and the measurement can be repeated. When the
measurement is complete, push OK to store the data.17. Repeat steps 13–16 for the other measurement points on the vertical.18. When all measurements for the station are complete, select Main or Verify. results. Push OK to
return to the list of measurement points.
Option Description
Main Returns to the station menu.
Verify Shows the average velocity reading for the station based on the measurement method.
19. Select Next to go to the next station.20. Repeat steps 10–19 for the remaining stations.21. When all measurements for all stations in the profile are complete, select Channel Summary to
view the results.Note: A warning flag will show if the discharge in one or more segments is > 5% of the total discharge.
Insert or delete a stationPrev, Next, Ins and Del options show at the bottom of the display in the Station screen. Prev andNext are used to navigate to a previous or subsequent station. Ins and Del are used to insert ordelete a station.
English 21
For example, after measurements have been done at 10 stations, a user may wish to insert a newstation between stations 3 and 4. The steps below describe how to do this. These steps can beapplied in similar situations.
1. Select Prev and push OK until the display shows the information for Station 3.2. Select Ins and push OK.
The instrument adds a new station named Station 4. Subsequent stations are automatically givennew sequential numbers.
3. To delete the current station (when in non-fixed mode), select Del and push OK.
Conduit profilesIt is possible to use all of the methods for conduit profiles in this section in sites with a typical profileshape and sufficient depth to measure 3-point velocities. The 0.9 x Vmax method can also be usedwhen the depth is not sufficient for multi-point profiles.Note: In typical conduit profiles, the first measurement is made at the bottom. Subsequent measurements aremade above the one made before. A different procedure may be necessary for some profiles.
1. In the Main Menu, select Profiler.2. Enter the operator name.3. In the list of options, select Conduit.4. Enter a name for the new Conduit profile.5. Select the conduit shape.
Note: The input screens that show next depend on the shape selected.
6. Enter values at the screen prompts.When the necessary values have been entered, the display shows the Select Method menu.
7. Select a profile method and do the steps for the method.
Option Description
0.9 x Vmax The meter calculates flow based on 90% of the fastest velocity. This is the recommendedmethod when the depth is less than 12.7 cm (5 in.) or when the velocity is not stable.
0.2/0.4/0.8 The meter calculates the flow value based on velocity measurements taken at 0.2, 0.4 and0.8 x the depth. One and two-point versions of this method are also possible.
Vel./Lev. Integ. The meter integrates 10 separate velocity and level measurements to calculate the flowlevel.
2D The sensor collects information while constantly moved through the flow in a specifiedpattern. The meter calculates the flow value when the user selects Save. This method isrecommended for flows where a difference of 30% or more exists between the right and leftside velocities.
0.9 x Vmax measurement methodThe meter uses the maximum velocity measurement in the conduit and multiplies this value by 0.9 tocalculate the total flow.Note: The RC filter mode with a value of 2 to 4 seconds is recommended for this method.
1. In the Select Method menu, select 0.9 x Vmax.2. With the sensor in the flow, select Measure Velocity to get a velocity measurement.
The measured values are shown on the graph.3. Move the sensor until a point of maximum velocity is found, then push OK.
The meter calculates and shows the flow, maximum and average velocity values.4. Select Save.
The information is saved to a data file.
22 English

0.2/0.4/0.8 methodDo measurements at one, two or three points to calculate an average velocity. Each point representsa percentage of the maximum depth as measured on the center line as shown in Figure 12.
Figure 12 2-4-8 profile
1. In the Select Method menu, select 0.2/0.4/0.8.2. Select one of the options.
Option Description
One point One-point measurement at 0.4 x maximum depth
Two point Two-point measurement at 0.2 and 0.8 x maximum depth
Three point Three-point measurement at 0.2, 0.4 and 0.8 x maximum depth
3. For the selected option, select a measurement point. The meter shows the sensor adjustmentinformation.
4. If necessary, adjust the sensor as necessary.5. Select Capture.
The meter gets information from the sensor and shows the velocity value in numerical andgraphical form.
6. If necessary, select Setup to change the Y-axis range or the data filter parameters.7. Push OK.8. Do steps 3–7 for all of the other measurement points then push OK to return to the list of
measurement points.9. Select Flow.10. Select Save to save the information to a data file.
Velocity/Level Integration measurement methodMeasurements are done at 10 different depths. The results from all segments are integrated tocalculate the flow value.
• Select Prev or Next to go to another measurement.• Select Main to return to the Select Method menu.
1. In the Select method menu, select Vel./Lev. Integ.The display shows the first measurement screen.
2. Select Measure Velocity.The sensor depth information is shown.
English 23

3. If necessary, adjust the sensor depth as shown.4. Select Capture.
The handheld unit gets information from the sensor and shows the average velocity value innumeric and graphical form.
5. If necessary, select Setup to change the Y-axis range in FPA filtering mode, the X and Y-axisrange when in RC filtering mode or the data filter parameters.
6. Push OK to confirm the information.7. Select Next. The next measurement screen in the series appears.8. Do steps 2–7 for the other measurement depths.9. Select one of the options at the bottom of the screen.
Option Description
Save Calculates the current flow value and saves this information to a data file.
Units Changes the unit type (English or Metric).
2D measurement methodVelocity is measured while the sensor is moved through the flow as shown in Figure 13.Select Cancel at any time to cancel the measurement and return to the Select Method menu.Note: The RC filter mode with a value of 2 to 4 seconds is recommended for this method.
1. In the Select method menu, select 2D.The sensor depth information is shown.
2. If necessary, adjust the sensor depth.3. Select Capture. While the sensor collects data, move the sensor through the entire cross-section
in the pattern shown in Figure 13.4. If necessary, select Setup to change the Y-axis range in FPA filtering mode, the X and Y-axis
range when in RC filtering mode or the data filter parameters.5. Push OK.6. Select one of the options shown at the bottom of the screen.
Option Description
Save Calculates the current flow value and saves this information to a data file.
Units Changes the unit type (English or Metric).
Figure 13 Path of the sensor in the flow
1 Start 2 Finish
24 English
Download dataThe meter directory is Read Only. In Windows, the meter operates as a mass storage device orremovable hard drive.
1. Set the meter to USB Mass Storage mode.2. To edit the data in a file, drag and drop the file to a laptop or PC. File names are limited to eight
characters.3. Data files are kept in the tab separated variable (.TSV) format. To see files in Microsoft® Excel,
double or right-click a file and open the file with Excel.Real time files are stored in a directory called RT. Stream and conduit profile files are stored in adirectory called P.
Delete data files
1. To delete all files from USB memory:
a. Go to Main Menu > Diagnostics > Delete Files.b. In the confirmation window, select Yes.c. Push OK once to delete the files, then one more time to return to the previous screen.
2. To delete Real Time files:
a. Go to Main Menu > Real-Time > Files.b. Select Delete All or use the UP or DOWN arrow to select a file in the list.c. Push OK once to delete the files, then one more time to return to the previous screen.
3. To delete Profiler files:
a. Go to Main Menu > Profiler > Files.b. Select Delete All or use the UP or DOWN arrow to select a file in the list.c. Push OK once to delete the files, then one more time to return to the previous screen.
Maintenance
Download the PVM utilityThe PVM utility is used to update the firmware in the portable meter. The PVM Utility is available at http://www.ott.com or http://www.hachhydromet.com. Do the steps listed for the selected URL.
1. Go to http://www.ott.com.2. Login to MyOtt.3. Click Software Updates.4. Select MF pro.5. Click More.6. Click PVMSetup.msi.7. Choose Save or Run.
1. Go to http://www.hachhydromet.com.2. Click the Service and Support tab.3. Click More (below Software Downloads).4. Select MF pro.5. Click the download link.6. Select Save or Run.
Update the firmwareNote: All data files in mass storage are lost when the firmware is updated. To download data, refer to Downloaddata on page 25.
English 25

The PVM Utility is necessary for this procedure. To download the PVM Utility, refer to Download thePVM utility on page 25.This is the general procedure to update firmware for the meter and sensor. To update the sensorfirmware, the sensor must be connected to the meter.
1. Double-click the PVM Utility desktop icon.2. Push the power button on the meter. When the meter self-test is complete, push OK.3. In the Main Menu, select Setup, then push OK.4. Select USB>CDC, then push OK.5. Connect the USB cable to the portable meter and the PC.6. In the PVM Utility window, select Connect.7. In the drop-down menu, select the PVM (COM X) port, where COM X is the virtual port number
assigned to the PVM by Windows. Push OK.8. In the left-side panel, select Firmware Update, then select the Meter or Sensor tab.9. Select the correct firmware version, then click Start.
The firmware download starts. A "Firmware update successful" message shows when thedownload is complete. For meter updates, the instrument display turns off until the instrumentcompletes the update. Then, the instrument automatically resets and powers up again after a fewminutes. Do not try to make the instrument power on or off before the update process iscomplete.
10. In the Main Menu, select Diagnostics > About. Make sure that the firmware versions for both theHandheld Boot and the Handheld Application are correct.
Clean the sensor
W A R N I N G
Chemical exposure hazard. Obey laboratory safety procedures and wear all of the personal protectiveequipment appropriate to the chemicals that are handled. Refer to the current material safety datasheets (MSDS) for safety protocols.
Clean the sensor when unexpected increases or decreases in flow or level trends occur and afteruse in sandy or muddy waterways.For heavy contamination, soak the sensor in clear water for a few minutes to help make thecontamination easy to remove.Disconnect the sensor from the meter before it is cleaned. Use only solutions listed as acceptable in Table 4 to clean the sensor. For sensors with a pressure cell (i.e., velocity plus depth sensors), makesure the holes for the pressure cell chambers are washed out and clear of contamination. Rinse thesensor with clean water before re-attaching the sensor to the assembly.
Table 4 Acceptable and unacceptable cleaning solutions
Acceptable Do not use
Dish detergent and water Concentrated bleach
Window cleaner Kerosene
Isopropyl alcohol Gasoline
Aromatic hydrocarbons
26 English

Clean the meter
1. Push the power button to de-energize the meter.2. Use a clean, moist cloth to clean the meter exterior. Mix the water with a mild detergent if
necessary.3. Dry the meter exterior with a clean cloth. Let the meter dry in air completely before it is energized
again.Note: Do not use paper-based cloths to clean the display. This type of cloth can cause damage to the displayscreen.
Install or replace the battery
W A R N I N G Personal injury hazard. This instrument contains one or more batteries. To prevent battery degradation,leakage or explosion, do not use or keep the instrument in places where the temperature is higher thanthe specified temperature limits of the instrument.
W A R N I N G Fire and explosion hazards. Battery substitution is not permitted. Use only batteries that are supplied bythe instrument manufacturer.
W A R N I N G Multiple hazards. Do not disassemble the instrument for maintenance. If the internal components mustbe cleaned or repaired, contact the manufacturer.
N O T I C E Discard used batteries promptly. Keep used batteries away from children. Do not disassemble the battery ordiscard the battery in fire.
The instrument is shipped without the battery installed. Order new batteries from the instrumentmanufacturer. Refer to Replacement parts and accessories on page 29. Recycle or discard usedbatteries in accordance with local regulations.Note: If the instrument must be returned to the factory for repair or maintenance, remove the battery and put thebattery in a protective cover before shipment.
1. If necessary, remove the used battery as shown in Figure 14.2. Install a new battery in the same location and with the same orientation.3. Install the battery cover. Make sure that the cover is secure to keep the enclosure rating.4. Charge the battery if necessary. Refer to Charge the battery on page 28.
English 27

Figure 14 Remove the battery
Charge the batteryMake sure that the correct plug-type for the geographic location is installed on the wall charger.Note: Battery charger substitution is not permitted. Use only the charger specified in the list of parts andaccessories for the instrument. Refer to Replacement parts and accessories on page 29.
A lithium ion battery in the meter supplies power to both the meter and the sensor. Install and chargethe battery before the instrument is used.A full battery charge will supply power to the system for approximately 10–11 hours with constantuse. When the level of battery charge drops to 3.4 V or less, the display shows a warning and themeter automatically powers off. The battery must be charged before the unit becomes functionalagain.
1. Connect the round end of the charger cable to the power jack of the portable meter. Refer to Figure 3 on page 8.
2. Connect the wall charger plug to a power outlet.A blue light shows around the charge port while the battery charges. When the charge process iscomplete, the blue light goes off. A discharged battery gets a full charge in about 8 hours.Note: The meter is not operational while the battery charges. The battery does not charge through the USBcable connection.
Troubleshooting
DiagnosticsIn the Main Menu, select Diagnostics to see information about the meter and do the diagnostic testsin Table 5.
Table 5 Meter diagnostics
Option Description
About Shows information about the meter and the sensor. Includes the serial number and the firmwareversion.
Delete files Deletes all files from memory to make space for new measurements. Make sure that the data isdownloaded to a PC before this option is selected. The system automatically reformats thememory after file deletion.
Sensor Shows diagnostic information about the sensor.
Self test Makes the meter do a diagnostic self test.
Key pad test Does a test of any button to make sure that the button is functional.
28 English
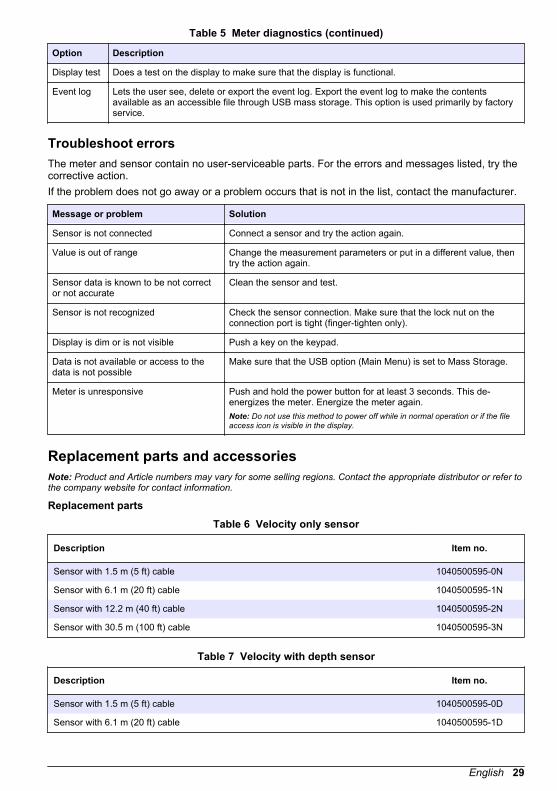
Table 5 Meter diagnostics (continued)
Option Description
Display test Does a test on the display to make sure that the display is functional.
Event log Lets the user see, delete or export the event log. Export the event log to make the contentsavailable as an accessible file through USB mass storage. This option is used primarily by factoryservice.
Troubleshoot errorsThe meter and sensor contain no user-serviceable parts. For the errors and messages listed, try thecorrective action.If the problem does not go away or a problem occurs that is not in the list, contact the manufacturer.
Message or problem Solution
Sensor is not connected Connect a sensor and try the action again.
Value is out of range Change the measurement parameters or put in a different value, thentry the action again.
Sensor data is known to be not corrector not accurate
Clean the sensor and test.
Sensor is not recognized Check the sensor connection. Make sure that the lock nut on theconnection port is tight (finger-tighten only).
Display is dim or is not visible Push a key on the keypad.
Data is not available or access to thedata is not possible
Make sure that the USB option (Main Menu) is set to Mass Storage.
Meter is unresponsive Push and hold the power button for at least 3 seconds. This de-energizes the meter. Energize the meter again.Note: Do not use this method to power off while in normal operation or if the fileaccess icon is visible in the display.
Replacement parts and accessoriesNote: Product and Article numbers may vary for some selling regions. Contact the appropriate distributor or refer tothe company website for contact information.
Replacement parts
Table 6 Velocity only sensor
Description Item no.
Sensor with 1.5 m (5 ft) cable 1040500595-0N
Sensor with 6.1 m (20 ft) cable 1040500595-1N
Sensor with 12.2 m (40 ft) cable 1040500595-2N
Sensor with 30.5 m (100 ft) cable 1040500595-3N
Table 7 Velocity with depth sensor
Description Item no.
Sensor with 1.5 m (5 ft) cable 1040500595-0D
Sensor with 6.1 m (20 ft) cable 1040500595-1D
English 29

Table 7 Velocity with depth sensor (continued)
Description Item no.
Sensor with 12.2 m (40 ft) cable 1040500595-2D
Sensor with 30.5 m (100 ft) cable 1040500595-3D
Table 8 Handheld meter
Description Item no.
English/Metric 1040500195-S
Accessories
Table 9 General accessories
Description Item no.
Adjustable meter mount 10.405.405.9.5
Battery charger 97.850.039.9.5
Carrying case 10.405.401.9.5
Lanyard, double ended loop 10.405.403.9.5
Lithium ion battery 97.820.021.9.5
Thumb screw kit (includes four thumb screws) 10.405.418.9.5
Universal sensor mount 10.405.419.9.5
USB cable 97.120.412.9.5
Appendix
Mean-section and Mid-section methodsThe user can select the Mean-section or the Mid-section method for flow calculations. The Mean-section method divides the cross-section into individual flow segments. Pairs of adjacent verticals arethe limits of the segments. The two edges of the cross-section are given values of 0 for the velocityand depth. The total flow is the sum of the partial flows of all segments. Figure 15 shows thedefinitions and the equation for the Mean-section method.
30 English

Figure 15 Mean-section method
Where:V = velocity at verticalb = distance to vertical from bankh = depth at verticalq = flow at vertical
The Mid-section method also divides the cross-section into individual flow segments. With the Mid-section method, the segments are not between verticals but are defined by half of the distance toneighbor verticals in each case. For this reason, the first and last verticals should be as near to theedges as possible (i.e., left edge of water (LEW) and right edge of water (REW)). Boundaryconditions dictate the proximity of the first and last vertical to the edge of water.Experience shows that the Mid-section method gives more exact results compared to the Mean-section method so it is the default setting. Figure 16 shows the definitions and equation for the Mid-section method.
English 31

Figure 16 Mid-section method
Where:m = station numbern = total number of stationsV = velocity at verticalb = distance to vertical from bankh = depth at verticalq = flow at vertical
Profiles and measurementsProfiles can be set up for streams or conduits. Figure 17 shows an example of a typical profile shapein a conduit. In a typical profile, velocity is less near a wall or edge than at the center and decreasesnear the surface. Multiple velocity measurements in the profile are averaged to calculate the totalflow. Measurements for conduit profiles are made from the bottom up. Measurements for streamprofiles are made from the top down.In the Main Menu, select Profiler. The meter prompts for the operator name, the type of profile(stream or conduit) and the profile name. Do the instructions for the selected profile type.
32 English

Figure 17 Typical profile
1 Depth 2 Velocity
Site selectionA site with the typical profile shape gives the most accurate results. Visual inspection is typicallysufficient to identify problem sites. Use the information in these guidelines to help select the best site.These guidelines apply to conduit and stream profiles.
• The channel should have as much straight run as possible. If the length of the straight run islimited, the length upstream from the profile should be two times the downstream length.
• The channel should be free of flow disturbances. The site must not have protruding pipe joints,sudden changes in diameter, contributing side-streams, outgoing side-streams or obstructions.Remove all rocks, sediment or other debris from the bottom of the pipe.
• The flow should not have visible swirls, eddies, vortices, back-flow or dead zones.• Do not select areas immediately downstream from sharp bends or obstructions.• Do not select areas with converging or diverging flow (approaches to a flume) or vertical drops.• Do not select areas immediately downstream from sluice gates or places where the channel spills
into a body of stationary water.
Do a velocity calibrationUse this feature to remove a velocity offset if necessary. The velocity offset stays active until themeter power is switched off.
1. Collect a bucket of water from the water in the profile area. The bucket must be non-metallic andat least 20.32 cm (8 in.). The water depth must be at least 15.24 cm (6 in.).
2. Put the sensor in the center of the bucket so that it does not touch the sidewall or the bottom ofthe bucket.
3. Let the water become still.4. Let the velocity reading stabilize.5. Select Zero Velocity.
Wet/Dry thresholdThe wet/dry threshold is the trigger point for the meter to know when the sensor is in or out of thewater. This information is important because if the meter does not know that the sensor is under the
English 33

surface of the water, the meter sets the velocity value to zero. For a profile or real-time reading, themeter prompts the user to submerge the sensor in the water.If the specific conductivity of the water being measured is very low, adjust the threshold value for thebest performance. Go to Setup Menu>Wet/Dry Threshold.For troubleshooting, the present reading is used as a guide to set a custom threshold. Get a readingin the water (wet) and then out of the water (dry). The threshold value must be between the wet anddry value. For example, if the actual wet value is 17 and the actual dry value is 2, put in a thresholdvalue half way between 2 and 17. The default value is 20.
34 English


OTT HydrometLudwigstrasse 1687437 Kempten, GermanyTel. +49 (0)8 31 5617-0Fax +49 (0)8 31 [email protected]
Hach Hydromet5600 Lindbergh DriveLoveland, CO 80538 U.S.A.Tel. (970) 669-3050(800) 949-3766 (U.S.A. only)Fax (970) [email protected]
© OTT Hydromet, 2012.All rights reserved. Printed in U.S.A.