our copper business - anglo american plc/media/files/a/anglo... · 2019-05-14 · world copper...
TRANSCRIPT

1
Real Mining. Real people. Real Difference
OUR COPPER BUSINESSWORLD CLASS ASSETS, LEADING CAPABILITIES AND
ATTRACTIVE GROWTH OPTIONS
DUNCAN WANBLAD, CEO BASE METALS
Real Mining. Real people. Real Difference
2
CAUTIONARY STATEMENT
Disclaimer: This presentation has been prepared by Anglo American plc (“Anglo American”) and comprises the written materials/slides for a presentation concerning Anglo American. By
attending this presentation and/or reviewing the slides you agree to be bound by the following conditions. The distribution of this document in certain jurisdictions may be restricted by law and
persons into whose possession this document comes should inform themselves about, and observe, any such restrictions.
This presentation is for information purposes only and does not constitute an offer to sell or the solicitation, inducement or an offer to buy shares in Anglo American or any other securities.
Further, it does not constitute a recommendation by Anglo American or any other party to sell or buy shares in Anglo American or any other securities and should not be treated as giving
investment, legal, accounting, regulatory, taxation or other advice.
No representation or warranty, either express or implied, is provided in relation to the accuracy, completeness or reliability of the information contain herein. None of Anglo American, its affiliates,
advisors or representatives shall have any liability whatsoever (in negligence or otherwise) for any loss howsoever arising from any use of this material or otherwise in connection with this
material.
Forward-looking statements
This presentation includes forward-looking statements. All statements other than statements of historical facts included in this presentation, including, without limitation, those regarding Anglo
American’s financial position, business, acquisition and divestment strategy, dividend policy, plans and objectives of management for future operations (including development plans and
objectives relating to Anglo American’s products, production forecasts and reserve and resource positions), are forward-looking statements. By their nature, such forward-looking statements
involve known and unknown risks, uncertainties and other factors which may cause the actual results, performance or achievements of Anglo American, or industry results, to be materially
different from any future results, performance or achievements expressed or implied by such forward-looking statements.
Such forward-looking statements are based on numerous assumptions regarding Anglo American’s present and future business strategies and the environment in which Anglo American will
operate in the future. Important factors that could cause Anglo American’s actual results, performance or achievements to differ materially from those in the forward-looking statements include,
among others, levels of actual production during any period, levels of global demand and commodity market prices, mineral resource exploration and development capabilities, recovery rates and
other operational capabilities, the availability of mining and processing equipment, the ability to produce and transport products profitably, the availability of transport infrastructure, the impact of
foreign currency exchange rates on market prices and operating costs, the availability of sufficient credit, the effects of inflation, political uncertainty and economic conditions in relevant areas of
the world, the actions of competitors, activities by governmental authorities such as permitting and changes in taxation or safety, health, environmental or other types of regulation in the countries
where Anglo American operates, conflicts over land and resource ownership rights and such other risk factors identified in Anglo American’s most recent Annual Report. Forward-looking
statements should, therefore, be construed in light of such risk factors and undue reliance should not be placed on forward-looking statements. These forward-looking statements speak only as of
the date of this presentation. Anglo American expressly disclaims any obligation or undertaking (except as required by applicable law, the City Code on Takeovers and Mergers (the “Takeover
Code”), the UK Listing Rules, the Disclosure and Transparency Rules of the Financial Conduct Authority, the Listings Requirements of the securities exchange of the JSE Limited in South Africa,
the SIX Swiss Exchange, the Botswana Stock Exchange and the Namibian Stock Exchange and any other applicable regulations) to release publicly any updates or revisions to any forward-
looking statement contained herein to reflect any change in Anglo American’s expectations with regard thereto or any change in events, conditions or circumstances on which any such statement
is based.
Nothing in this presentation should be interpreted to mean that future earnings per share of Anglo American will necessarily match or exceed its historical published earnings per share.
Certain statistical and other information about Anglo American included in this presentation is sourced from publicly available third party sources. As such it has not been independently verified
and presents the views of those third parties, but may not necessarily correspond to the views held by Anglo American and Anglo American expressly disclaims any responsibility for, or liability in
respect of, such information.
No Investment Advice
This presentation has been prepared without reference to your particular investment objectives, financial situation, taxation position and particular needs. It is important that you view this
presentation in its entirety. If you are in any doubt in relation to these matters, you should consult your stockbroker, bank manager, solicitor, accountant, taxation adviser or other independent
financial adviser (where applicable, as authorised under the Financial Services and Markets Act 2000 in the UK, or in South Africa, under the Financial Advisory and Intermediary Services Act 37
of 2002).
Alternative Performance Measures
Throughout this presentation a range of financial and non-financial measures are used to assess our performance, including a number of the financial measures that are not defined or specified
under IFRS, which are termed ‘Alternative Performance Measures’ (APMs). Management uses these measures to monitor the Group’s financial performance alongside IFRS measures to improve
the comparability of information between reporting periods and business units. These APMs should be considered in addition to, and not as a substitute for, or as superior to, measures of financial
performance, financial position or cash flows reported in accordance with IFRS. APMs are not uniformly defined by all companies, including those in the Group’s industry. Accordingly, it may not
be comparable with similarly titled measures and disclosures by other companies.

3
WHAT YOU WILL SEE AND HEAR THIS WEEK
“World class assets and leading capabilities to deliver a world class business”
Our people driving relentlessly to
best in class operational
performance, innovation and
capital discipline
Three world class assets, each
with significant endowment
optionality
Assets Capabilities Returns
A highly competitive business with
options that provide leverage to a
fundamentally attractive
commodity
4
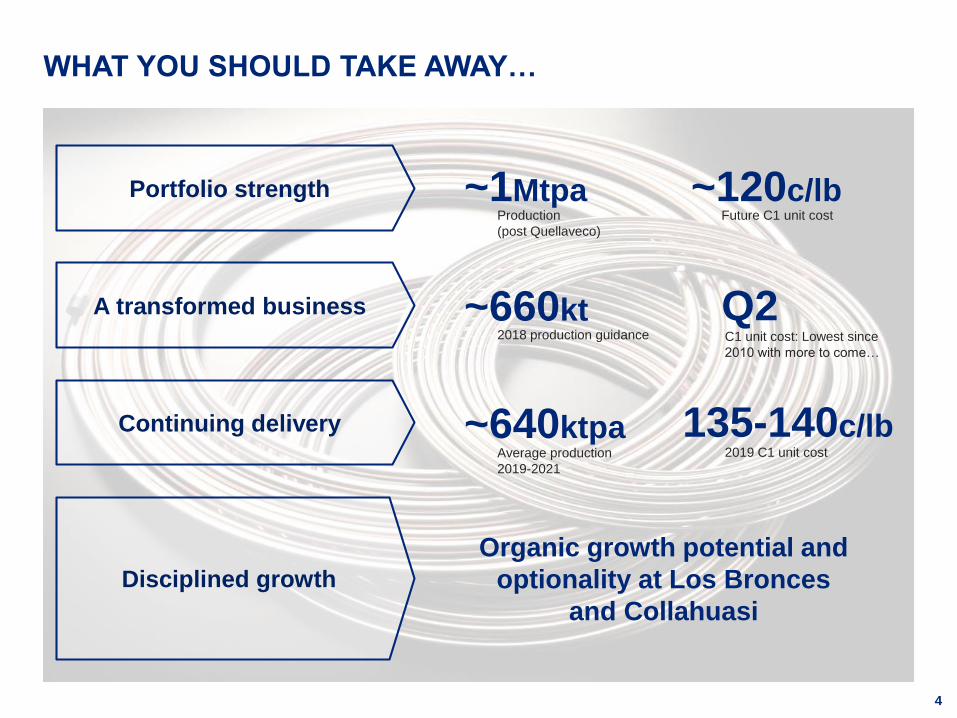
WHAT YOU SHOULD TAKE AWAY…
Portfolio strength
A transformed business
Continuing delivery
Disciplined growth
C1 unit cost: Lowest since
2010 with more to come…
~660kt
Average production
2019-2021
~640ktpa
Organic growth potential and
optionality at Los Bronces
and Collahuasi
2019 C1 unit cost
135-140c/lb
Q22018 production guidance
~1MtpaProduction
(post Quellaveco)
~120c/lbFuture C1 unit cost

5
Patricio
Chacana
Head of
Operations
Los Bronces
Pedro
Reyes
General
Manager El
Soldado &
Chagres
Functions
Duncan
Wanblad
CEO Base
Metals
Louis Irvine
Executive
Head of
Strategy &
Business
Development
Ana Elisa
Morgado
Executive
Head of HR
Base Metals
Hennie
Faul
CEO
Copper
Domenico
Pelliccia
Executive
Head of
Projects
Peter
White
CFO
Quellaveco
Christoff
Kuhn
Project
Director
Quellaveco
Tom
McCulley
CEO
Quellaveco
EXPERIENCED LEADERSHIP TEAM
Trevor
Dyer
CFO
Copper
QuellavecoOperations
Jorge
Gomez
CEO
Collahuasi
Diego
Ortega
Corporate
Affairs
Alex
Schmitt
Executive
Head of
Marketing
Base Metals
Aaron Puna
Executive
Head of
Technical &
Sustainability
6
COPPER BUSINESS OVERVIEW
DUNCAN WANBLAD, CEO BASE METALS

7
One of the best safety performances in the Chilean copper mining industry
LTIFR(1)
TRCFR(2)
23
13
2017 2018 YTD
Occupational health – new cases(3) Significant environmental incidents(4)
SAFETY IS OUR NUMBER ONE PRIORITY
0.0
0.5
1.0
1.5
2.0
2.5
3.0
3.5
4.0
20032002 2004 2005 20092006 2007 2008 20162010 2011 20132012 20152014 2017 2018
YTD
Nil 2014-2018

8
WORLD CLASS ASSETS
El Soldado
• 2018 forecast production: ~50kt
• Technology focus to improve competitive position
Chagres
• Best in Chile and best in class smelter
• 2018 production: ~140kt
• 2018 forecast production: ~365kt
• Significant future growth optionality
• Contained copper in mineral resources is ~140x current
production levels (5,6)
• 48mt of contained copper in Exclusive Mineral Resources and
30mt in ore reserves(5)
• 2018 forecast production: 240-245kt (our 44% share)
• Q2 on cost curve with 2019 C1 costs of ~$1.00/lb
• Q1 on cost curve, LoM 30 years
• Strong social support and all key permits in place
• Attractive returns: IRR>15%, four year payback, ROCE>20%
Los Bronces Collahuasi
Quellaveco El Soldado and Chagres
3rdLargest endowment in the world
52mtContained Copper Resources(5)
300ktAverage first 10 years production
Note: Please refer to the AA plc Ore Reserves and Mineral Resources Report 2017 for the tonnes, grades and a breakdown of the classification categories.

9
COMBINED WITH OUR LEADING CAPABILITIES
Innovation, technology & digitalisation
• Concentrated Mine
• Modern Mine
• Waterless Mine
• Intelligent Mine
Marketing
• Market intelligence
• Margin enhancement
• Customer relationships
• Operational flexibility
Anglo American Operating ModelSafety and sustainability
• Safety is our number one priority
• Healthy environment
• Thriving communities
• Trusted corporate leader
With a clear Purpose: Re-imagining mining to improve people’s lives

10
A WORLD CLASS COPPER BUSINESS
~1MtProduction post ramp up of Quellaveco
~120 c/lbCost position
2018F Future state
~1Mt
~660kt
+52%
~140c/lb
2018F Future state
~120c/lb
-14%
Production (kt) C1 unit cost (c/lb)

11
LEVERAGE TO A HIGHLY ATTRACTIVE COMMODITY
31%
24%
24%
11%
10%
Electrical Network
Buildings
Consumer Goods
Transport
Machinery
World Copper Usage Split (%)(7)
Wide range of applications make copper a
key material throughout the economic
development cycle
Global development and diversity of
applications expected to support future
demand growth
Coper demand to come from a number of different sectors
Urbanisation
Electric
vehicles
Renewables
Appliances +4.3MtBy 2030(8)
Other
transport

12
Ore grades are declining and copper mine supply is stagnating
COPPER MINING IS INCREASINGLY CHALLENGING
20302010 2020
Mined copper supply gap (Mt Cu)(8)
14
15
16
17
18
19
20
21
22
23
24
Demand Available from base mines
5.6Mt of new
production capability
needed from
greenfield projects
13
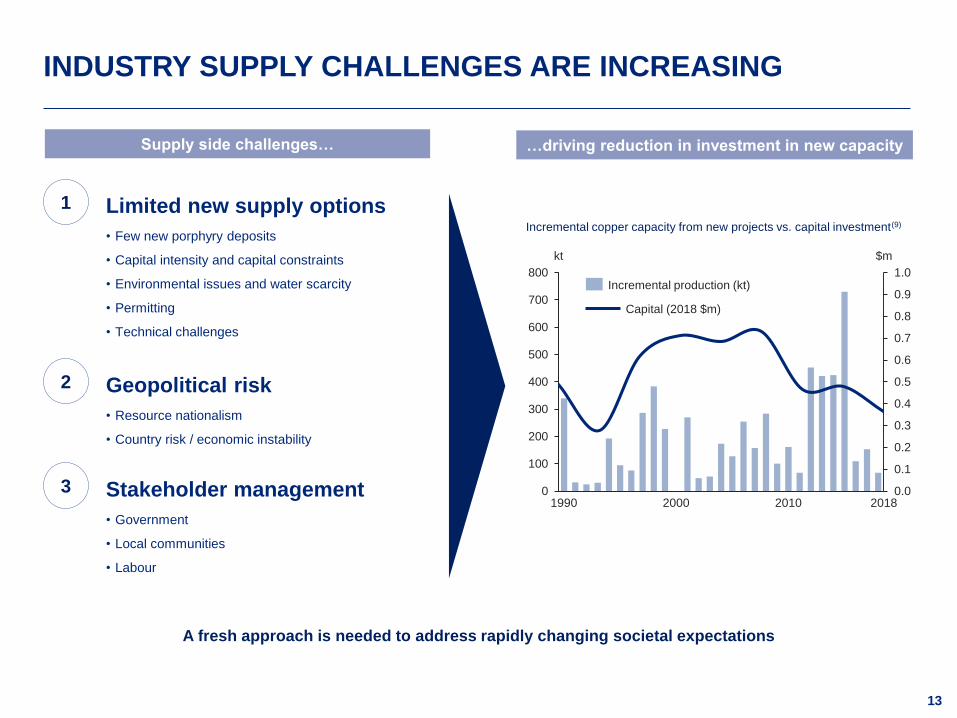
INDUSTRY SUPPLY CHALLENGES ARE INCREASING
1 Limited new supply options
• Few new porphyry deposits
• Capital intensity and capital constraints
• Environmental issues and water scarcity
• Permitting
• Technical challenges
3 Stakeholder management
• Government
• Local communities
• Labour
2 Geopolitical risk
• Resource nationalism
• Country risk / economic instability
…driving reduction in investment in new capacitySupply side challenges…
0
100
200
300
400
500
600
700
800
20001990 20100.0
0.1
0.2
0.3
0.4
0.5
0.6
0.7
0.8
0.9
1.0
$mkt
2018
Capital (2018 $m)
Incremental production (kt)
Incremental copper capacity from new projects vs. capital investment(9)
A fresh approach is needed to address rapidly changing societal expectations

14
OPERATIONALEFFICIENCY
FEWER SURPRISES
ACCESS TORESOURCES
Positioned as
development partner
of choice
SUSTAINABILITY AT THE HEART OF OUR BUSINESS
Trusted
corporate
leader
GROWINGRETURNS
Additional
opportunities
$Thriving
communities
Healthy
environmentImproved
productivity and
resource efficiency More control

15
AMBITIOUS PLANS TO MAKE A REAL DIFFERENCE
Reducing our carbon footprint...
30%Reduction in energy use(10)
30%Reduction in greenhouse
gases(10)
Organisational culture and awareness
Energy & Carbon Management System & Digitalisation
Renewable Energy Sources
Innovation and Technology

16
WATER MANAGEMENT IS CRITICAL IN MINING
Increasing competition and business risk
• Water scarcity exacerbated by climate change
• Greater competition for supply
• Increasing stakeholder engagement required
• Increase in permit complexity and timing e.g. ~10 years
for water permits in Peru
• Water requirements are increasing
• Strong water management is critical to reducing and
managing business risk
Our strategy
• Risk-based water management
• Transparent reporting
• Engagement with local and national
stakeholders
• Responsible stewardship
• Water security for all our operations
and communities

17
A MULTIFACETED APPROACH TO WATER SUSTAINABILITY
153bnGallons used p.a.(11)
Reuse & recycle
Retention
Evaporation
Discharge
75%Water reuse by 2020,
increasing to 100% by 2030
50%Fresh water
abstraction by 2030(11)
Coarse particle recovery
Dry tailings
Tailings dam underdrainage
But recognising the need to selectively invest in a long-term solution
Consuming lessRecycling more Technology & Innovation

18
IMPROVING LIVES OF THOSE IN OUR LOCAL COMMUNITIES
• Employment support Increase job prospects with local
companies, 1,300 people
benefited to date
• Collaboration with local
governments Improve their
local employment offices
• Quellaveco Commitment to hire unskilled 80%
of workforce from local community
• SME support Provides training, advisory and
funding ~75,000 entrepreneurs
benefited since 2006
• Ambassadors programme Over 950 employees / 330 projects
supporting community organisations
• Soy Técnico (‘I’m a technician’)
Transforming vocational education,
1,500 students benefited to date
• Collahuasi Educational
FoundationFocuses on developing the skills
required to sustain our business in
the long term
EmploymentEnterprise Education

19
VALUE ACCRETIVE GROWTH
OPTIONALITY
DUNCAN WANBLAD, CEO BASE METALS

20
Cash flow after sustaining
capital
Discretionary capital options
Portfolio
upgrade
Future project
optionality
Additional
shareholder
returns
Discretionary capital options
Balance sheet flexibility to
support base dividend
A BALANCED APPROACH TO CAPITAL ALLOCATION
• Potential for growth is there but under the
right circumstances and always based on
value
• Maximising returns on existing capital
base is the first priority
• Growth opportunities are focused on
organic options
• A balanced portfolio that offers near-term,
medium-term and long-term optionality in
high quality jurisdictions

21
SCALE AND ORGANIC GROWTH OPTIONALITY
Growth options from existing reserves and
huge upside potential from Quellaveco
Reserves and Exclusive Mineral Resources (Mt)(5)
At the very start of
its resource journey
Three of the largest endowments worldwide
with an average reserve life of 40 years
Mined copper production vs. resource base(12)
0
5,000
10,000
15,000
20,000
25,000
1930 1940 19801950 1960 1970 1990 2000 2010 2020
Copper production (kt)
Copper resource base (Mt copper in resource)
29.9
7.8 7.6
48.1
19.2
6.0
0
5
10
15
20
25
30
35
40
45
50
Collahuasi Los Bronces Quellaveco
Ore Reserves Exclusive Mineral Resources
Note: Please refer to the AA plc Ore Reserves and Mineral Resources Report 2017 for the tonnes, grades and a breakdown of the classification categories.

22
A UNIQUELY POSITIONED COPPER BUSINESS
A step change in volumes… …an improved cost position
Copper production (kt) (13)
0
200
400
600
800
1,000
1,200
1,400
20352020 20302025
El Soldado
CollahuasiSakatti
Quellaveco Los Bronces
Q1 Q2 Q3 Q4
20142018F
C1 unit costs (c/lb)
2025

23
QUELLAVECO – A WORLD CLASS COPPER PROJECT
Extending a long-standing
relationship, confirms asset’s
value
Strong local support and all
key permits in place
Low cost with significant
potential
Attractive returns Focus on execution Successfully syndicated
Payback
4 yearsFrom first production (2022)
IRR
> 15%Real, post-tax
ROCE
> 20%Average over first 10 years
Job creation
~9,000In construction phase
~2,500 jobs in normal operation
Implied NPV
$2.74bnFor 100% of the project
Consideration
$600m$500m upfront, $100m contingent

24
Current state Growth options Future state
Los Bronces
Underground
Synergies
with Andina
• Utilising technology to
increase throughput from
existing infrastructure
reducing costs and water
consumption
Coarse
Particle
Recovery
Production (2018F)
~365 ktpa
C1 Cost (2018F)
~$1.50 / lb3rd quartile
Reserve life (2017)
23 years
Production
400-500ktpa
C1 Cost
~$1.30 / lb2nd / 3rd quartile
Mine life
~40 years
LOS BRONCES – SIGNIFICANT GROWTH OPTIONALITY
• Abundant high grade ore
• Mine life extension to 2065
• Permit submission in Q1 2019
• Reduced mine interference
• Increased extraction
• Mine life extension beyond 2040

25
Number of expansion options available
COLLAHUASI – PLANT EXPANSION OPTIONS
• 170ktpdExisting licence allows throughput of up to 170ktpd, from
existing levels of 155-160ktpd prior to 2020
• 210ktpdInvestigating options to expand concentrator throughput
capacity up to 210ktpd post 2020, ~$1.2-1.5bn capex
• BioleachingAs a part of the next EIA, optionality will also be sought to
develop new leach pads that will enable us to implement
a bioleaching process using the existing cathodes plant,
~$0.9-1.1bn capex
• 4th / 5th lineOptionality exists for a long-term major growth project to
add additional extra lines. Combined with the above
would take copper production to ~900-1,000ktpa
Copper production (kt) (100%)
0
100
200
300
400
500
600
700
800
900
1,000
1,100
20302020 20372025 2035
210ktpd
Bioleaching170ktpd
4th / 4 & 5th LineBase Case

26
LONGER-TERM GROWTH OPTIONS
• Targeting deposits that can deliver high cash flows
and strong returns
• Los Bronces and Quellaveco near-asset projects
• Exciting prospective districts in diversified
geographies, including Brazil, Zambia, Australia
and Ecuador
• Located in Finnish Lapland, in an established
mining district, close to infrastructure
• Smaller high grade ore body
• Pre-feasibility studies in progress
• Located adjacent to proven production assets
• Synergies with existing infrastructure
• Attractive mineralisation
Sakatti Los Bronces District
West Wall Discovery
• Located in strategic centre of Chile
• Close to port infrastructure, 150km from the project

27
DISCOVERY & GEOSCIENCESTRANSFORMATIVE VALUE THROUGH DISCOVERY
DAVID FINCHAM, EXPLORATION VICE PRESIDENT, AMERICAS

28
Deposits that can deliver
high cash flows and
optionality
Projects that can be built in
capital efficient ways
Diversification of risk
New search spaces -
Frontier & undercover
District-scale positions
(1,000 to >10,000km2)
Future Smart™ can unlock
value in Discovery
Rapid implementation of
innovative discovery
concepts and tools
Operating Model adapted to
Discovery
First-mover advantage
DISCOVERY: SUPERIOR VALUE AND RISK DIVERSIFICATION
Agility Innovation
Value focused Geographies
29
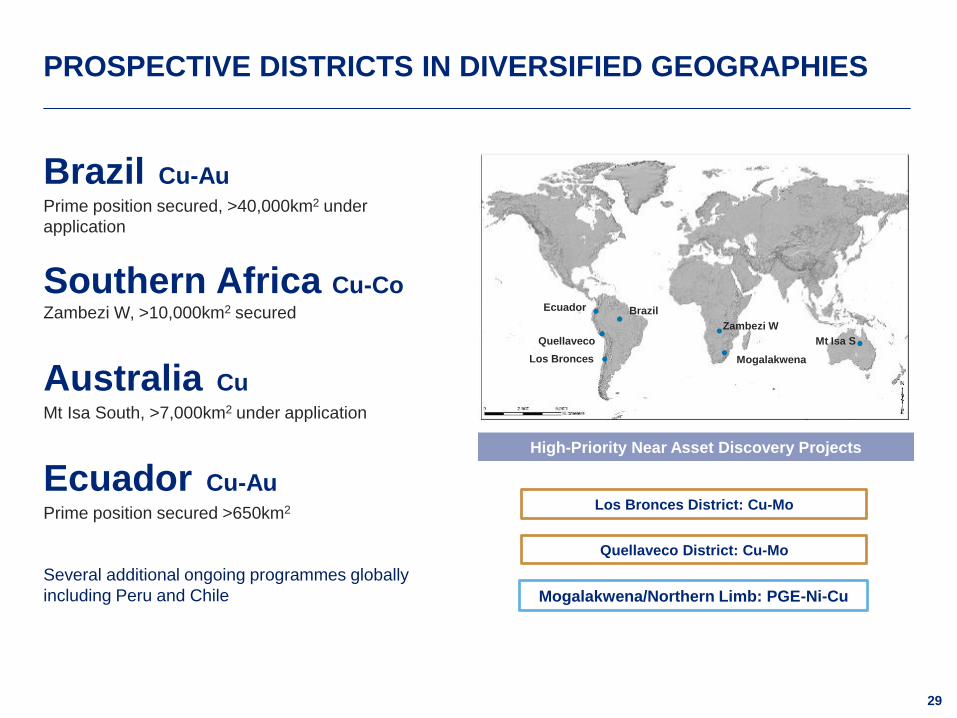
PROSPECTIVE DISTRICTS IN DIVERSIFIED GEOGRAPHIES
Brazil Cu-AuPrime position secured, >40,000km2 under
application
Southern Africa Cu-CoZambezi W, >10,000km2 secured
Australia CuMt Isa South, >7,000km2 under application
Ecuador Cu-AuPrime position secured >650km2
Several additional ongoing programmes globally
including Peru and Chile
High-Priority Near Asset Discovery Projects
Los Bronces District: Cu-Mo
Quellaveco District: Cu-Mo
Mogalakwena/Northern Limb: PGE-Ni-Cu
Ecuador
Quellaveco
Los Bronces Mogalakwena
Zambezi W
Mt Isa S
Brazil

30
LOS BRONCES AND QUELLAVECO NEAR ASSET PROJECTS
• Airborne geophysics flown over both districts to identify
high concentrations of sulphide minerals
• Structural interpretations key to understanding potential
location of economic mineralisation
• Geochemistry and geology to refine targets
• Focused and rapid drilling to test most prospective targets
Drill core with hydrothermal breccia mineralization -
La Agustina prospect, Los Bronces
La Agustina location – Los Bronces

31
BRAZIL GREENFIELDS CU – AN EMERGING FRONTIER
• Emerging Frontier Cu-Au district with over 40,000 km² under
application in Mato Grosso and Pará states
• Our largest greenfield land package; a first-mover advantage
• New discovery concept: >1 billion year old large-tonnage
porphyry Cu-Au
• Drilling at Uñiao has confirmed an extensive porphyry copper
system; drilling ongoing to establish if economic
• Geological mapping and geophysics aim to locate further
Uñiao style targets in the very large land holding
Drill rig at Uñiao
Regional geology and tenure applications

32
SOUTHERN AFRICA – EXPLORING BASE-METAL FRONTIERS
• Large land holding (>10,000km2) located in Zambezi
West, Zambia, in the western extension under cover
of the world class Central African Copper Belt
• Prospective for large tonnage Cu-Co deposits
• 20 to 300m of “Kalahari” sand cover
• The right rocks are now confirmed under cover, with
signs of fertility; drilling ongoing
Southern Africa - geology
33
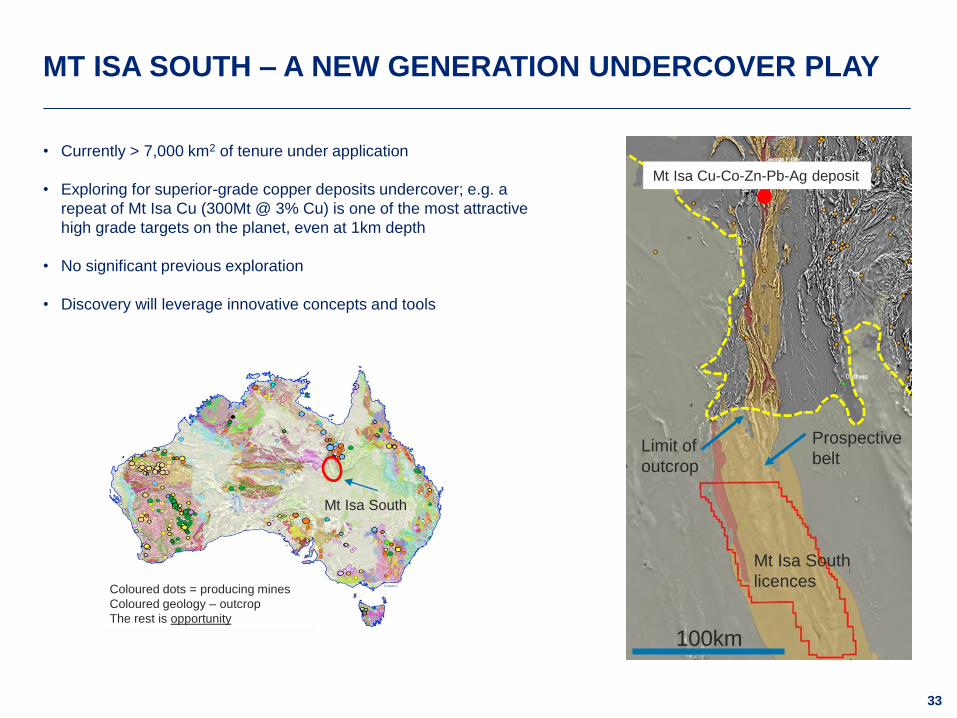
• Currently > 7,000 km2 of tenure under application
• Exploring for superior-grade copper deposits undercover; e.g. a
repeat of Mt Isa Cu (300Mt @ 3% Cu) is one of the most attractive
high grade targets on the planet, even at 1km depth
• No significant previous exploration
• Discovery will leverage innovative concepts and tools
Prospective
belt
Mt Isa South
licences
Mt Isa Cu-Co-Zn-Pb-Ag deposit
Limit of
outcrop
100km
Coloured dots = producing mines
Coloured geology – outcrop
The rest is opportunity
Mt Isa South
MT ISA SOUTH – A NEW GENERATION UNDERCOVER PLAY

34
ECUADOR – RAPIDLY EMERGING SUPERIOR VALUE
PORPHYRY BELT
• Emerging Porphyry Cu-Au (Mo) province
• Cascabel (SolGold) and Llurimagua (ENAMI/CODELCO)
indicates potential for high-grade Cu-Au (Mo) systems
• Earn-in agreement completed with Luminex for the
Pegasus project
• Pegasus is a >650km2 district with outcropping porphyry-
style mineralisation
• Geological fieldwork and geophysics planned for 2019 to
establish drill targets for 2020
• Country wide targeting work is ongoing
Porphyry-style alteration and mineralisation – Pegasus project
Pegasus District
Ecuador geology and Pegasus project location
35
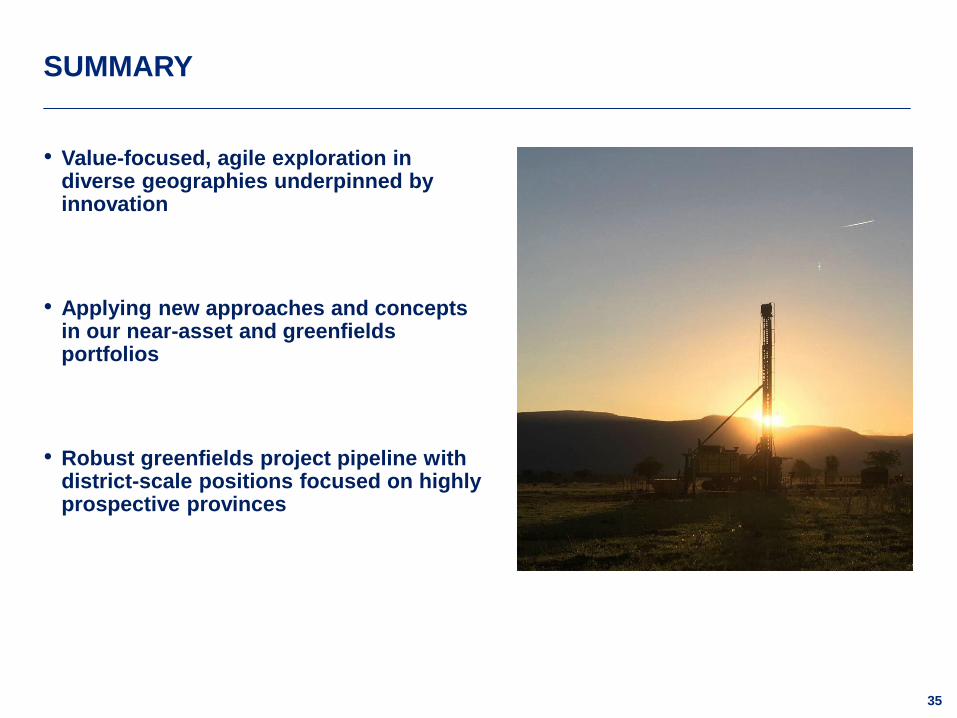
SUMMARY
• Value-focused, agile exploration in diverse geographies underpinned byinnovation
• Applying new approaches and conceptsin our near-asset and greenfieldsportfolios
• Robust greenfields project pipeline withdistrict-scale positions focused on highlyprospective provinces

36
OPERATIONAL PERFORMANCE:
A TRANSFORMED BUSINESS
DUNCAN WANBLAD, CEO BASE METALS
11CONFIDENTIAL

37
ANGLO AMERICAN OPERATING MODEL: A DIFFERENTIATED
APPROACH
Apply a manufacturing approach to
mining, through organised and efficient
planning and execution of work
Work that is planned, scheduled and
properly resourced is safer and delivers
consistently and at a lower cost
Low stability and high
variation in performance
Stabilisation of
processes at a higher
performance
Further improvements
implemented with little initial
process stability
Stabilisation of processes at
still higher performance
75th percentile

38
A RELENTLESS FOCUS ON EFFICIENCY
Los Bronces performance metrics
76%
2014 2018 YTD
97%
+21%
Mine compliance (%)(14) Confluencia Plant operating time (%)(14)
+19%Shovel performance(14)
+19%Molybdenum production(14)
2014 2018 YTD
93%
96%
+3%
ProcessingMining
39
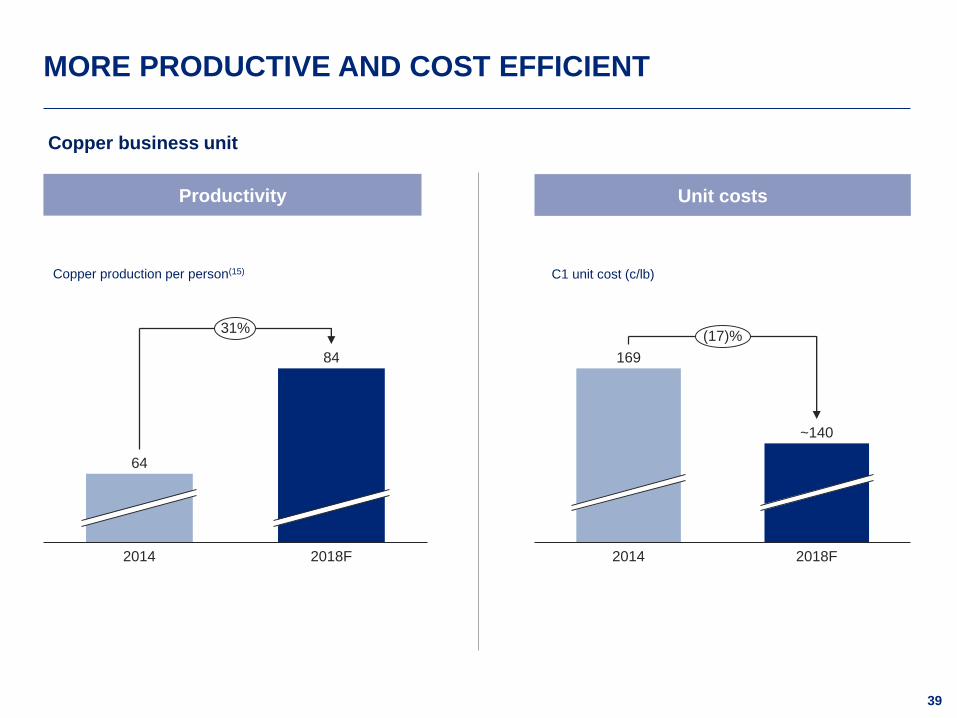
MORE PRODUCTIVE AND COST EFFICIENT
169
2014 2018F
~140
(17)%
2018F2014
64
84
31%
Copper production per person(15) C1 unit cost (c/lb)
Unit costsProductivity
Copper business unit

40
HIGHER RETURNS AND IMPROVED MARGINS
2017
41%
20152014 2016 2018F
39%
27%
31%
~45%
15%
20172014 2015 2016 2018F
18%
3%
6%
16%
~20%
11%
Copper business unit
EBITDA margin (%)(16)ROCE (%)

41
AND A SIGNIFICANTLY IMPROVED COMPETITIVE POSITION
Anglo American
Peer 1
Peer 2
Peer 3
Peer 4
Q1 Q2 Q3
20142018F
H1182014
2014H118
2014H118
H1182014
Lowest copper unit costs for over a decade
2025

42
TO DELIVER ENHANCED SHAREHOLDER RETURNS
2017
579
2018F 2019F
~660
2020F 2021F
630-660
620-680
590-650
Production (kt) C1 unit costs (c/lb)
2019F2017 2018F
147
~140
135-140
Previously
630-660Previously
600-660
Previously
600-660
Previously
~145New
guidance
New
guidance

43
REDEFINING MINING THROUGH
INNOVATION
AARON PUNA, EXECUTIVE HEAD OF TECHNICAL & SUSTAINABILITY

44
40kg
INNOVATION IS NEEDED TO ENSURE SUSTAINABILITY
Then Now Future state
What is required to produce
40kg of copper
1900 2018
1t waste
1t ore
4% Cu
3m3 water
10 KWhr
0.02 Km2
24t waste
8t ore
0.5% Cu
6m3 water
160 KWhr
100 Km2

45
WE ARE TAKING A TWO PHASED APPROACH
Innovation, technology and
digitalisation
A more productive, more efficient, sustainable business
Achieving & redefining
‘best in class’ performance
46
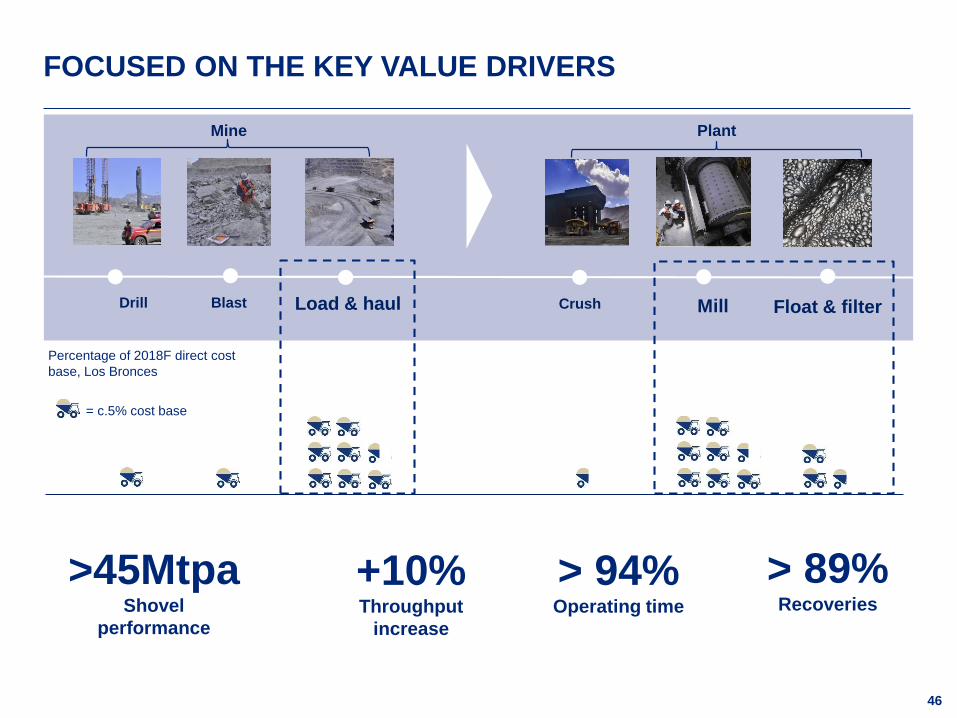
FOCUSED ON THE KEY VALUE DRIVERS
Mine Plant
BlastDrill Load & haul Crush Mill Float & filter
Percentage of 2018F direct cost
base, Los Bronces
= c.5% cost base
>45MtpaShovel
performance
> 94%Operating time
> 89%Recoveries
+10%Throughput
increase

47
CASE STUDY: ELECTRIC ROPE SHOVEL PERFORMANCE
18
54
84
40
4
37
20.2
82
109
81
3
7
Passes per Truck
% Double sided load
Loading hours
Shovel payload (t)
Shift change (mins)
% Best operator
4Mt
3Mt
4Mt
3Mt
5Mt
2Mt
2017 Best-in-class – 45Mtpa2017 Anglo Copper – 24Mtpa

48
CASE STUDY: ELECTRIC ROPE SHOVEL PERFORMANCE
Los Bronces Shovel 10
Best in class2017 2018F
25
30
45
20%
50%
2018F2017
31
Best in class
37
45
19%
22%
Collahuasi Shovel 12
2018
• Double side loading increased to 80%
• Best operator 80%
2018
• Double side loading increased to 80%
• Best operator 80%
• Shovel passes per truck 3.5
2019 Focus
• Shovel payload
• Time management
2019 Focus
• Shovel payload
• Time management

49
A NUMBER OF GAME CHANGING TECHNOLOGIES
Coarse Particle Recovery Dry Disposal
>50% Reduction in water
intensity
Advanced
Fragmentation
Shock-break Precision Classify
>50% Reduction in energy
intensity
50
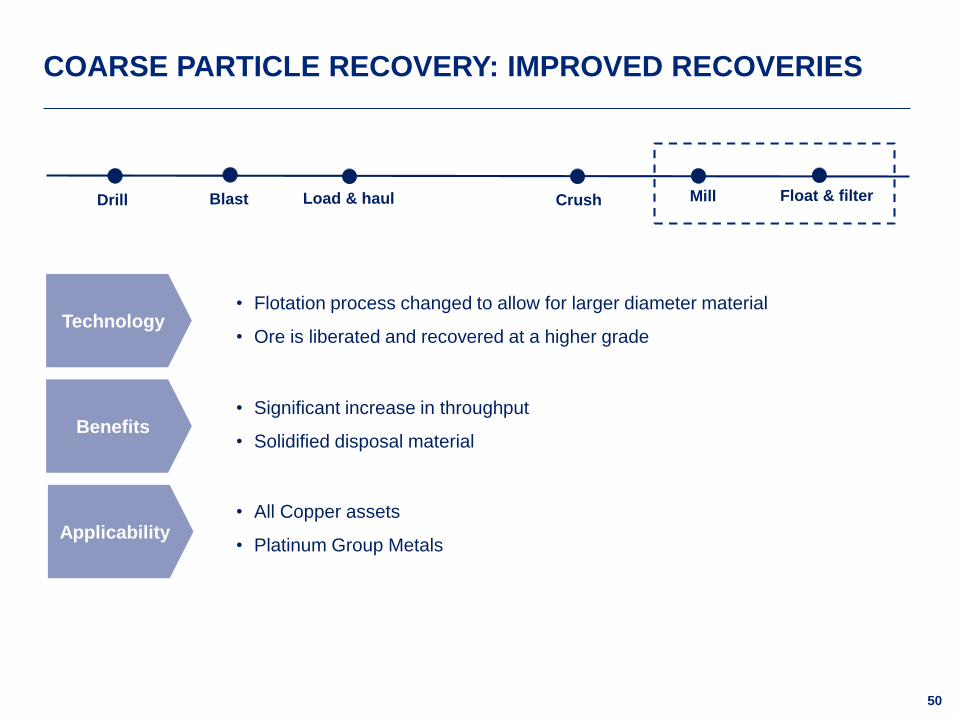
COARSE PARTICLE RECOVERY: IMPROVED RECOVERIES
Technology
Benefits
Applicability
• Flotation process changed to allow for larger diameter material
• Ore is liberated and recovered at a higher grade
• All Copper assets
• Platinum Group Metals
• Significant increase in throughput
• Solidified disposal material
BlastDrill Load & haul Crush Mill Float & filter

51
COARSE PARTICLE RECOVERY: IN COPPER
>10%Increase in Operating
Free Cash Flow
>20%Decrease in water and
energy intensity
Load & haul Crush Mill Float & filterBlastDrill

52
BULK SORTING: LESS WASTE TO CONCENTRATOR
BlastDrill Load & haul Crush Mill Float & filter
• Uses sensors to determine ore content prior to processing
• Gangue is removed using natural heterogeneity of ore bodies
• All Copper assets
• Platinum Group Metals and Iron Ore
• Provides immediate grade assays
• Unlocks production capacity by rejecting waste early
• Allows for lower cut off grades (LOM extension)
• Reduces bench cost and complexity
Technology
Benefits
Applicability

53
BULK SORTING: IN COPPER
>10%Decrease in water and
energy intensity
BlastDrill Load & haul Crush Mill Float & filter

54
WHAT DOES THIS MEAN FOR COPPER?
>15%Energy
Lower operating costs and
reduction in mine
equipment SIB capex
>20%Water consumption
>30%C1 unit cost
Contributing to Group
energy targets
In line with Group target
and one step closer to a
waterless mine
WaterEnergy Costs

55
COPPER MARKETING: LEVERAGING A
WORLD CLASS PRODUCTION PLATFORM
ALEX SCHMITT, EXECUTIVE HEAD OF MARKETING (BASE METALS)

56
European Marketing hub
London, UK
Asia-Pacific Marketing hub
Singapore
Shanghai office,
China
Base Metals Refinery (PGMs),
South Africa
Los Bronces
Collahuasi
Quellaveco
LEADING CAPABILITIES AND GLOBAL FOOTPRINT TO
IDENTIFY MARKET OPPORTUNITIES
Global footprint
Leading capabilities
• Governance
• Compliance
• Freight desk
• Risk management
• Futures trading
• Performance
management
• Credit markets
• Logistics and sales
operations platform

57
Marketing excellenceValue chain
optimisation
~200kt third party
trading
MARKET FOCUS: CONNECTING COPPER SOURCES TO END
CUSTOMERS
Trading margins Market developmentCost, cash & inventory
management

58
Marketing levers
unlocking value200Active counterparties, up
from 50 in 2013
20%+EBIT CAGR 2013 to 2018
SHAREHOLDER FOCUS: DELIVERING VALUE THROUGH
MARKET INTELLIGENCE
Market intelligence:
‘our window to the
world’
Copper Production Chain Market Intelligence
Customer Expectations Sector Trends

59
31%
24%
24%
11%
10%
Buildings
Electrical Network
Machinery
Transport
Consumer Goods
World Copper Usage Split 2017 (%)(7)
0
5,000
10,000
15,000
20,000Europe
N America
S America
Africa
Other Asia
China
Japan
Australasia
China
Boom
1960s: 4.7% p.a.
1970s: 3.4% p.a.
1980s: 1.8% p.a.
1990s: 3.0% p.a.
2000s: 1.5% p.a.
2010s: 2.5% p.a.
World Geographic Split (kt)(7)
Oil shocks, East
Asia fabrication
Post WWII
Industrialisation19th/20th Century
electrification
A VITAL INDUSTRIAL METAL…
60
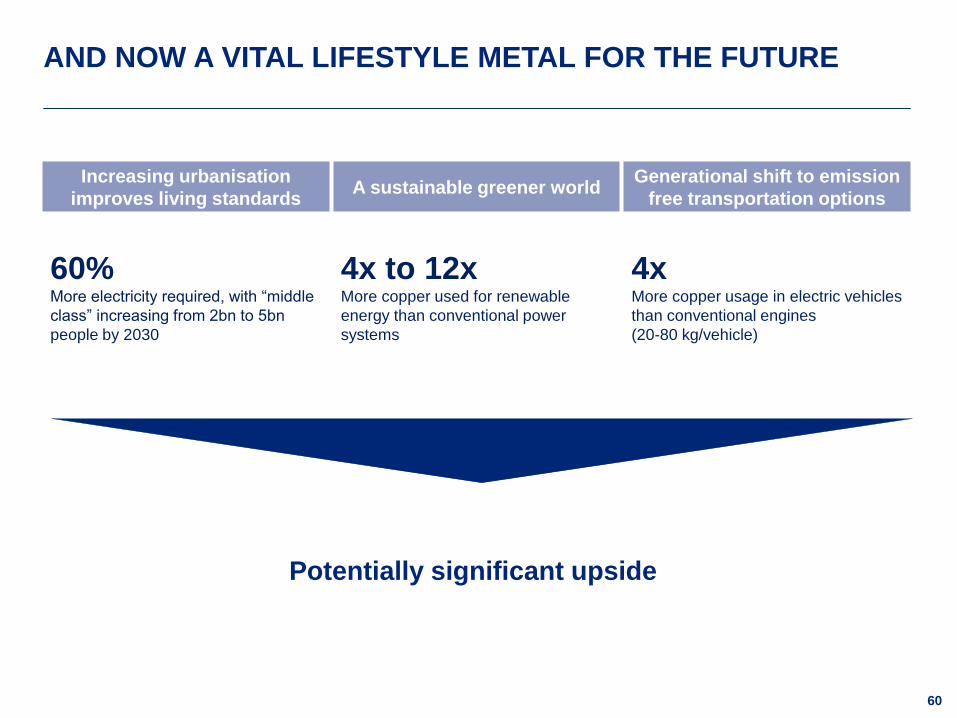
AND NOW A VITAL LIFESTYLE METAL FOR THE FUTURE
Potentially significant upside
Increasing urbanisation
improves living standardsA sustainable greener world
Generational shift to emission
free transportation options
60%More electricity required, with “middle
class” increasing from 2bn to 5bn
people by 2030
4x to 12xMore copper used for renewable
energy than conventional power
systems
4xMore copper usage in electric vehicles
than conventional engines
(20-80 kg/vehicle)
61
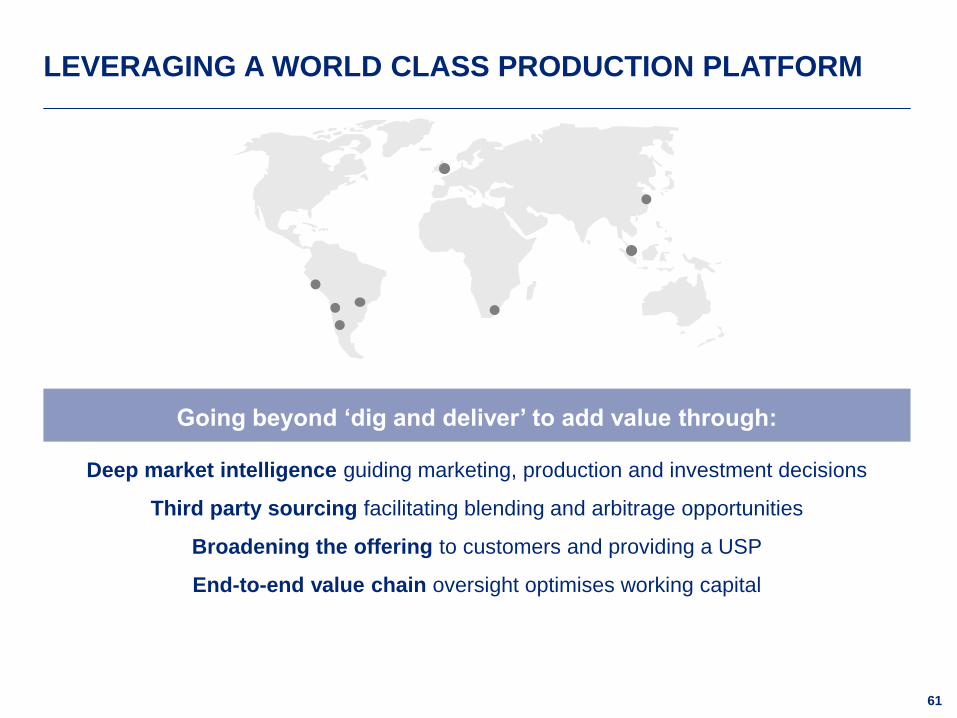
Deep market intelligence guiding marketing, production and investment decisions
Third party sourcing facilitating blending and arbitrage opportunities
Broadening the offering to customers and providing a USP
End-to-end value chain oversight optimises working capital
Going beyond ‘dig and deliver’ to add value through:
LEVERAGING A WORLD CLASS PRODUCTION PLATFORM

62
CONCLUSION
DUNCAN WANBLAD, CEO BASE METALS

63
• Step-change performance
delivered
• Further improvements committed
• Investment to unlock full asset
potential
• Deliver value-enhancing growth at
an improved cost position
• Providing leverage to a highly
attractive commodity
BUILDING A WORLD CLASS COPPER BUSINESS
64
APPENDIX

65
FOOTNOTES
(1) Managed operations, total Lost Time Injury Frequency Rate per 1,000,000 hours
(2) Managed operations, Total Recordable Cases Frequency Rate per 1,000,000 hours
(3) New cases of occupational disease. Basis of data changed in 2017 hence no comparable data available for prior years
(4) Level 4-5 environmental incidents. Environmental incidents are classified in terms of a five level severity rating, incidents with high and major impacts, as
defined by standard internal definitions, are reported as level 4-5 incidents
(5) Ore Reserves and Mineral Resources are based on published 2017 Reserves and Resources report. Estimates as at 31 December 2017. Please refer to
the AA plc Ore Reserves and Mineral Resources Report 2017 for the tonnes, grades and a breakdown of the classification categories. Los Bronces
District figures include Los Bronces Mine as well as Los Bronces Sur and Underground Inferred Resources
(6) Production based on 2018 forecast
(7) Source for copper usage split: Wood Mackenzie (Q3 Copper LTO, 2016)
(8) Source: Wood Mackenzie (Global copper mine supply summary, 2018). 4.3Mt represents forecast incremental consumption from 2018 to 2030. 5.6Mt
represents the forecast incremental supply required from greenfield copper mines in order to meet forecast demand
(9) Source: Wood Mackenzie (Global copper mine supply summary, 2018)
(10) Reductions by 2030 vs. 2016
(11) Managed operations. Water use, efficiency and consumption baseline is 2017
(12) Sources: USGS, SNL, Wood Mackenzie, Corporate reports, Bernstein analysis & estimates
(13) All figures stated on 100% basis except Collahuasi which is on a 44% basis
(14) YTD September 2018 vs. 2014. Shovel performance is for 73yd3Mt. Moly production based on September YTD production annualised vs 2014 full year
(15) Copper production from existing operations divided by full time own employees and permanent contractors. 2018 production based on latest forecast.
Collahuasi production and headcount at 100%
(16) Excludes the impact of third party sales