our inspection technique and system are certified by tÜv...
TRANSCRIPT

Electromagnetic Pipeline Testing GmbH DIRECT LINE: + 49 (0) 40 3571811 2 Vat.-No.: DE301505875
Große Bleichen 12/14 MAIL: [email protected] TAX-No.: 22/294/17084
20354 Hamburg, Germany WEB: www.empit.eu Trade Register: HRB 135628
Our inspection technique and system are certified by TÜV SÜD

02 © Electromagnatic Pipeline Testing GmbH, 2016
On the basis of magnetic measurements, EMPIT is a world-wide unique technique enabling to inspect uppiggable pipe-lines without changing or influencing the running pipeline pro-duction mode. As being a non-destructive testing (NDT) tech-nique, special preparations such as cleaning of the pipeline and the usage of special mediums is not necessary. In order to ensure reliability and performance, our technique and the system are certified by ‘TÜV-Süd’, which is the most acknowl-edged technical inspection association in Germany.
All unpiggable pipelines are inspected through aboveground inspection (AGI). This is done by analyzing the A. C. magnet-ic field of the pipeline aboveground. This magnetic field is in-duced by an inspection current that is introduced into the pipe-line. In order to generate the inspection current, we have de-veloped a special current source – shown in the picture below.
The EMPIT inspection A.C. current consists of multiple har-monic components in the audio frequency range. The A.C. current with the lowest frequency flows through the whole cross section of the pipe. The A.C. current with the highest frequency flows, conditioned by the skin effect, only immedi-ately under the exterior surface of the pipe.
A pipeline, which does not have any defect, shows a perfect-ly circular magnetic field. This is valid regardless of the fre-quency for all A.C. current harmonic components. Over a de-fect (e.g. caused by corrosion) a slight deformation of the mag-netic field appears. This deformation is caused by the impedi-ment of the current flow in the pipe wall and, according to kind of the defect, by straying out the magnetic flux from the pipe wall. The deformation of the outer A.C. magnetic field is fre-quency-dependent. This deformation is analyzed and recog-nized by the EMPIT technique up to a pipe depth of 2 m.
Power Generator (left) and Current Source (right)
Data Collector Module (left) and Sensor Array (right)
Another essential part of our technique is the inspection sys-tem. The Sensor Array (SA), seen on the right side of the pic-ture, holds 24 sensors. Each of them measures the horizontal component of the magnetic field. The data is transferred to the Data Collector Module (DCM), which shows direct information of the pipeline on the screen. Data of the magnetic field, the level of the inspection current, the pipeline depth, and the co-ordinates of the Sensor Array over the pipeline will be stored.
As certified by TÜV Süd :
Outer pipeline diameter (OD)1 3” to 16”Maximum wall thickness (WT)2 10 mmPipeline depth (to its axis) up to 2 mInspection current ICS 16AeffMaximum pipeline range between two contact points 1.000 mProductivity3 750 mDepth resolution (uncertainty of depth of cover) ≤ 20 mm
Defect specification – Probability of detection (POD >96%) :
Length 50 mmWidth 50 mmMetal loss 50% of WTDefect detection (response threshold)4 > 20%of WT
1 Inspection of pipelines with outer diamter up to 42“ is possible2 Inspection of larger WT needs to be requested3 Dependent on ground conditions (smoothness etc.)4 Spirally welded pipes can be inspected
Technical Specifications
01 // Technique

03 © Electromagnatic Pipeline Testing GmbH, 2016
Detection of Metal Loss Features
The EMPIT inspection technique is capable to characterize de-fect sizes, expressed through different levels:
Detection Level 1 – the reference defect is classified through a minimum peak metal loss of 50 % and the dimensions 50 mm x 50 mm. The probability of detection for such a defect is at least 96 %. In this detection level, the pipeline has a depth of cover that is smaller than 1.5 m.Detection below Level 1 - is used when a metal loss feature is in at least one coordinate smaller than the reference defect in this level. Detection of features starts if the metal loss is great-er than 20 %. Detection Level 2 – the reference defect is classified through a minimum peak metal loss of 50 % and the dimensions 150 mm x 150 mm. The probability of detection for such a defect is at least 96 %. In this detection level, the pipeline has a depth of cover that is between 1.5 m and 2 m. Detection below Level 2 - is used when a metal loss feature is in at least one coordinate smaller than the reference defect in this level.
In addition to the faults survey, the intensity of the inspection current is monitored. At places, where the insulation (coating) of the pipeline is characterized by a defect, a small part of the inspection current leaks into the surrounding earth. As a re-sult, the inspection current changes, which can be recognized from current plots.
The calculated inspection current values are plotted and pre-sented in the graphic analysis, which is done for every inspect-ed pipeline. A normalized scaling is used in current plots. As reference values for the normalization of the current, values at the current source output are used. Normally, the current value is changing monotonously along the pipeline due to the slight leakage of the pipeline coating. But in places where the coat-ing is damaged the leakage is stronger and this produces a jump on the current plot, recognized by our system. Using this feature, coating damages will be detected. The threshold lev-el for current leakage depends on coating kind, OD of the pipe and the soil conditions. For instance, the steepness of 0.3%/m can be used. Changes of the inspection current are indicated if the current jump feature is at least 1.5 m long.
Detection of Coating Features
Example of Defect “Detection below Level 1”
Example of Defect “Detection below Level 2”
Example of Coating Feature

04 © Electromagnatic Pipeline Testing GmbH, 2016
- The graphic below shows the schematic visualisation of the setup for the inspection run - In order to create a measurable magnetic field, surrounding the pipeline, an A.C current is in-troduced into the pipeline. This can be either done through parts of the pipeline running above the ground (e.g. valves), through Cathodic-Protection-posts, or through dug holes. The two connection points should not lie more than 1,000 meters apart. After contacting and laying out the connection cable, a quick functional test is carried out. Then, the actual inspec-tion begins. Starting point is one of the two connection points.
The monitor of the DCM shows a live-report of the depth of the pipeline, the exact position of the SA, the inspection current, and the positioning of the SA over the pipeline. The analysis of the magnetic field data and the calculation process take ap-prox. 10 sec. During this time, the system is not moved. After-wards, the SA and DCM will be moved 1 m further to the next inspection step. The storage of the data happens after every step. The assembly of the sensors in the SA allows a seamless capture and analysis of the magnetic field data and allows us to archive an average productivity of 750 m per day (depend-ed on the surface over the pipeline).
02 // Inspection
Connection through CP-Post
Connection through dug hole
Inspection Run
Schematic visualisation of EMPIT inspection Setup
05 © Electromagnatic Pipeline Testing GmbH, 2016
After the raw data are collected, the following steps are nec-essary in the evaluation process:
The first step of the post-processing is the reduction of exter-nal interferences on the magnetic field data. External interfer-ence can be caused by magnetic disturbances from the envi-ronment, from electric cables, or big metal objects – which sit close to the pipeline.
In the second step, the post-processed inspection data is evaluated. For the evaluation, a specially developed program is used. The program is able to calculate, filter, and display the magnetic field variation parameters in both, frequency, and spatial domains. A threshold level is used for a better defect recognition over interferences. Based on a clear recognition of the EMPIT reference defects, the threshold level is chosen. Afterwards, all information is summarized in graphical analy-sis spreadsheets.
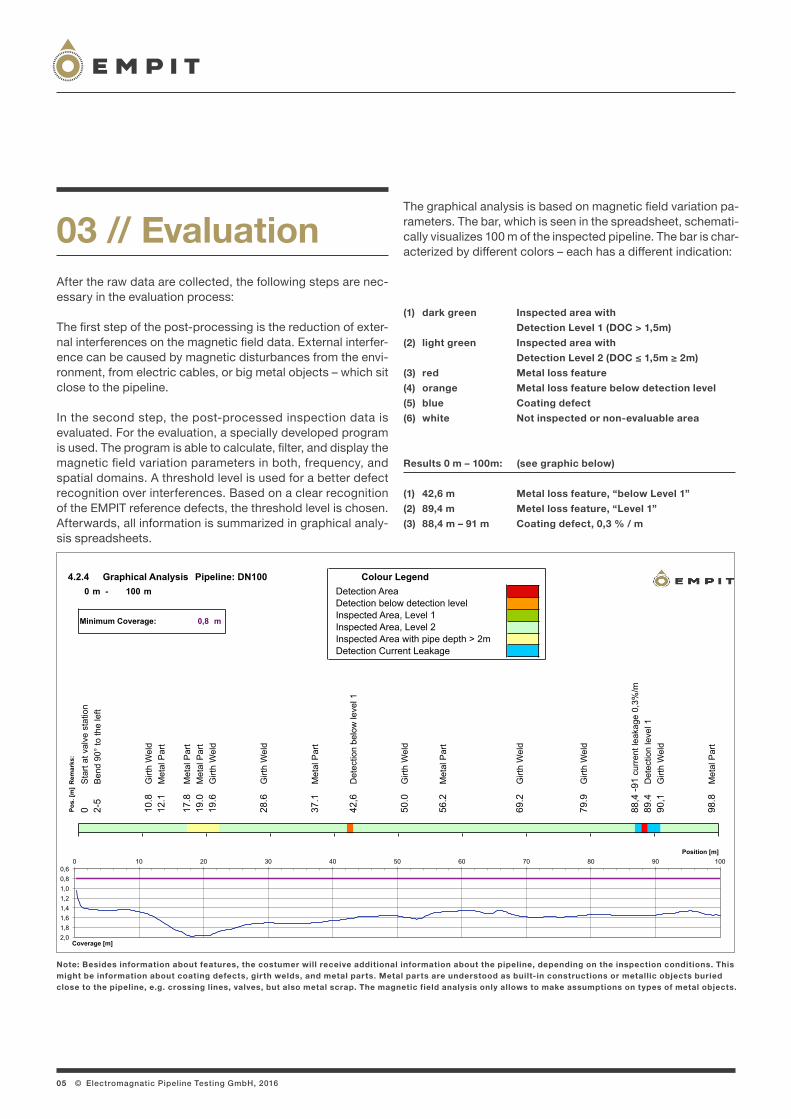
The graphical analysis is based on magnetic field variation pa-rameters. The bar, which is seen in the spreadsheet, schemati-cally visualizes 100 m of the inspected pipeline. The bar is char-acterized by different colors – each has a different indication:
(1) dark green Inspected area with Detection Level 1 (DOC > 1,5m)
(2) light green Inspected area with Detection Level 2 (DOC ≤ 1,5m ≥ 2m)
(3) red Metal loss feature(4) orange Metal loss feature below detection level (5) blue Coating defect (6) white Not inspected or non-evaluable area
Results 0 m – 100m: (see graphic below)
(1) 42,6 m Metal loss feature, “below Level 1”(2) 89,4 m Metel loss feature, “Level 1”(3) 88,4 m – 91 m Coating defect, 0,3 % / m
Note: Besides information about features, the costumer will receive additional information about the pipeline, depending on the inspection conditions. This might be information about coating defects, girth welds, and metal parts. Metal parts are understood as built-in constructions or metallic objects buried close to the pipeline, e.g. crossing lines, valves, but also metal scrap. The magnetic field analysis only allows to make assumptions on types of metal objects.
03 // Evaluation
Final Report 1012
Colour Legendm - m Detection Area
Detection below detection levelInspected Area, Level 1Inspected Area, Level 2Inspected Area with pipe depth > 2mDetection Current Leakage
98.8
88,4
-91
curr
ent l
eaka
ge 0
,3%
/m89
.490
,1
79.9
69.2
56.2
50.0
42,6
37.1
28.6
17.8
19.0
19.6
Met
al P
art
Pos
. [m
]
0 2-5
10.8
12.1
Girt
h W
eld
Det
ectio
n le
vel 1
Girt
h W
eld
Girt
h W
eld
Girt
h W
eld
Met
al P
art
Det
ectio
n be
low
leve
l 1
Met
al P
art
Girt
h W
eld
Met
al P
art
Met
al P
art
Girt
h W
eld
Girt
h W
eld
Met
al P
art
Sta
rt at
val
ve s
tatio
nB
end
90°
to th
e le
ft
Graphical Analysis Pipeline: DN1004.2.4
m
Rem
arks
:
0 100
Minimum Coverage: 0,8
0,6 0,8 1,0 1,2 1,4 1,6 1,8 2,0
0 10 20 30 40 50 60 70 80 90 100
Coverage [m]
Position [m]

06 © Electromagnatic Pipeline Testing GmbH, 2016
The EMPIT-System measures the depth of cover for the full length of inspection every meter. The certified uncertainty of DOC-measurement is ≤ 20 mm. Exact values will be given in the graphical analysis. If not other stated by the customer the value for critical DOC, less than 0.8 m cover, will be highlight-ed in the final report.
Our costumer receives a Final Report showing the features of the inspected section(s). The features are differentiated be-tween metal loss features and coating features. Metal loss fea-tures are characterized in terms of size (mm) and metal loss (% of wall thickness). Also, critical depth of cover will be highlight-ed in the report.
Electromagnetic Pipeline Testing GmbH DIRECT LINE: + 49 (0) 40 3571811 2 Vat.-No.: DE301505875 Große Bleichen 12/14 MOBILE: +49 (0) 176 82315986 TAX-No.: 22/294/17084 20354 Hamburg, Germany MAIL: [email protected] Trade Register: HRB 135628
Hamburg, Germany
Certified by TÜV SÜD
Final Report Nr. -/-
-Customer-
Gas Pipelines: R22 DN100 R25 DN300
January 18th to 30th, 2015
Inspection of Depth of Cover (DOC)
Final Report
Graphic Analysis
EMPIT-Crew during inspection
Excavation of metal loss defect and coating defect
Reporting and Right of Way (ROW)
Localization of Pipelines
The Graphic Analysis, which is enclosed to every inspec-tion report, serves to visualize the features of the pipeline. The Graphic Analysis will be done for every 100m of in-spected pipeline. All features are directly linked to coordi-nates and to landmark points aboveground such as mark-ers of the pipeline. This is becoming very handy during ex-cavations of the features.
Enclosed to every 100 m spreadsheet, the customer re-ceives photos, which have been taken during the survey. These pictures are shot every 50 m in the direction of in-spection. The coordinate shown on a photo corresponds with the location of the Sensor Array over the pipeline. Therewith, the customer is able to evaluate the ROW-con-ditions.
The inspection technique finds the exact coordinates of the pipeline. While a usual pipe-finder holds 2 sensors, our system holds 24 sensors, which makes it to the best pipe-finder in the world. Consequently, it is possible for the pipeline operator to get exact information of the posi-tion of the pipeline.

07 © Electromagnatic Pipeline Testing GmbH, 2016
Type material loss, gouge (mill feature)Position 115 cm in upstream direction from girth weldAxial length 70 mmCircumferential width 20 mm Max. material loss 1.5 mmMeasured Wall Thickness (WT) 7.8 mmCalculated remaining WT 6.3 mmMetall Loss 19,2 %
Type material loss, relocationPosition 20 cm in downstream direction from girth weldAxial length 70 mmCircumferential width 18 mmMax. material loss 1.5 mmMeasured WT 7.8 mmCalculated remaining WT 6.3 mmMetall Loss
Type material loss, dentPosition 20 cm in upstream direction from girth weldAxial length 80 mmCircumferential width 10 mmMax. material loss 1.0 mmMeasured WT 7.8 mmCalculated remaining WT 6.8 m
Type material lossPosition 7 cm in upstream direction from girth weldAxial length 290 mm Circumferential width 15 mmMax. material loss 1.1 mmMeasured WT 7.8 mmCalculated remaining WT 6.7 mm
EMPIT inspection projects were executed on gas, oil, brine and jet fuel pipelines, run by pipeline operators around the world. The outer diameter of inspected pipelines is so far spread from DN80 to DN1000. In order to give you a practical impression of our detection-abilities, results from a past inspection are pre-sented below in detail:
Defect 1
Defect 2
Defect 3
Defect 4
04 // References