our journey. your success. - annualreports.com · our journey. your success. 2007 annual report...
TRANSCRIPT

Our Journey.Your Success.
2007 ANNUAL REPORT
1920s
1930s
1940s
2008
1970s
1960s

“We now have in place the core product portfolio,
This focus and execution allowed us to reportorganizational structure and leadership team that will take us through the next phases of our transformation.
solid operational and financial performance in 2007.”
Fellow Shareholders,
2007 was a positive, momentum-building year for Deluxe on our continued transforma-tional journey. We are entering the middlestages of executing our multi-year plan todeliver greater value to our customers andinvestors. We are focused on our journey andyour success — our investors, customers,employees and business partners. The companyis fundamentally changing its operating model,aggressively reducing costs and, importantly,starting to invest more heavily in new revenue-expansion activities. We are making strongprogress in our transformation from checkprinter to model business partner for financialinstitutions, small businesses, and consumers.We are focused on innovation in check printingand cost containment, while driving more ofour focus to new revenue sources. We now have in place the core product portfolio, organizational structure, and leadership teamthat will take us through the next phases of our transformation.
Key 2007 AccomplishmentsIn 2007, we delivered significant improvement in our operating performance,stabilizing our check revenue base, progressing on new revenue expansion initia-tives, achieving significant process improvements and resultant cost reductions,and solidifying our infrastructure for better efficiency. We accomplished all this,while remaining focused on our strong heritage relative to customers, brandsand values. We were successful in achieving $90 million in cost and expensereductions in 2007, ahead of our original target of $75 to $82 million, and we expect an additional $70 million of reductions in 2008.
We realigned our sales and marketing operations and refined our channel management structure through process centralization, simplification, and platformand tool consolidation. We made meaningful progress with Lean productivityimprovements in manufacturing and indirect spend reductions, completedimplementation of an innovative new flat check delivery package, and advancedwork on realigning to a common manufacturing platform.
In shared services infrastructure, we significantly reduced the cost of informationtechnology through system utilization, networking, and voice communication efficiencies. We completed the outsourcing of our finance transaction processes,reduced our real estate square footage 12% and streamlined our human resourcesfunction. We completed a $200 million debt offering to provide us with additionalfinancial flexibility. We also began to position the company for future revenuegrowth by laying the initial groundwork for a new e-commerce platform, releasingthe new Deluxe.com, expanding full-color and Web-to-print capabilities and pilot-ing many new loyalty, retention, monitoring, and protection solutions.
This focus and execution allowed us to report solid operational and financialperformance in 2007, increasing operating income 35% and earnings per share41% from 2006 levels. The company continued to strengthen its balance sheet,reducing debt more than $171 million and generating $245 million in operatingcash flow. We recognize there is still a great deal of work to do, but we madesignificant progress in 2007, and we are excited about our momentum headinginto 2008. Simply stated, our strategy is on track.
Next Steps On Our JourneyOur enterprise focus and strategy is paying off. Leadership is moving the companyin the right direction. We are all rallying around “One Deluxe” and this focus hasallowed us to improve our performance. We are gaining momentum in achievingprocess improvements and cost reductions. While our work here continues, wehave an improved, more robust infrastructure in place and more stable core check businesses.
These are great foundational pillars to build upon. We will not take our eyes off of costs, but our transformation efforts are now shifting from playing more
defense to playing more offense through our heightened focus on revenueexpansion initiatives. As part of this shift, the time is now in our transformation tounveil our new corporate brand identity. Our new design maintains the highlyrecognized and powerful red “D” for Deluxe, while creatively showing a clearer andmore open path to Deluxe — one that implies we are easier to do business withand more open to our future.
Four key strategies will guide us further on our journey in 2008. These strategieswill advance us from simply leadership in check printing to more customer-facingsolutions: focusing on customers, growing revenue, improving business processes,and improving learning and our culture.
We are focusing on our customers with passion and precision, expanding and optimizing product and service offerings. We are shifting our emphasis from more on cost containment to revenue growth by accelerating and building out better value propositions for our customers. Business process improvement remainstantamount to our strategy. We are streamlining, standardizing, and improvinginnovation and efficiencies in everything we do. Finally, we are committed to building a highly engaged, winning team in a growth culture of continuousimprovement with faster speed to market and a stronger sense of urgency andadaptability to change. All these strategies leverage the power of One Deluxe and,at the same time, allow us to improve the performance in each of our segments.
Small Business Services (SBS)SBS revenue grew in the low single digits, excluding the sale of the industrial packaging product line. Operating income consistently improved throughout 2007 with four solid quarters of double-digit performance as a percent of revenue.We had a strong year of acquiring new customers driven by our Deluxe BusinessAdvantage® Program, continued expansion of custom color products through the Johnson Group acquisition, and announced an exciting partnership with WebsitePros®.
Our focus in 2008 is again on profitable growth. We remain focused on acquiringnew customers and increasing our share of wallet, where we believe we can sellmore personalized forms and related products, as well as higher-growth solutions,including custom, full-color, digital, Web-to-print, and promotional products. In addition, we see more opportunities to help small businesses grow by expandingour portfolio into marketing services such as logo design, Web site creation,campaign management, mailing and other related services. We are investingheavily the first half of the year to build out stronger e-commerce and verticalsegmentation capabilities that we believe will help us drive higher revenuegrowth in the second half of the year and beyond.
Financial Services (FS)FS revenues stabilized in 2007 and, despite declining check markets, declined less than 1%. This significant improvement over double-digit declines the last few years was achieved through continued record retention rates and strong new acquisition rates. We continued to simplify our processes and take complexity out of the business while reducing our cost and expensestructure, which led to an improvement in operating income. In addition to our strong core check revenue, we made progress in advancing new non-checkrevenue expansion opportunities in the loyalty, retention, monitoring, and protection spaces. These new initiatives are helping financial institutions (FIs)view Deluxe as much more than just a check provider, but also as a trusted business partner.
Our focus in 2008 is on retaining core check revenue, acquiring new customers,and simplifying our business model, as well as providing loyalty, retention,stored-value gift cards, and monitoring and protection products and servicesthat differentiate us from competitors and make us a more relevant businesspartner to our FI clients. Some examples include our Deluxe ImpressionsSM
suite, Welcome Home® Tool Kit, DeluxeCallingSM and Deluxe ID TheftBlock®
— all new loyalty, retention, and monitoring, and protection service offerings.
Direct ChecksDirect Checks revenue also stabilized and declined less than 1% in 2007, a significant improvement over the double-digit declines of the last few years. We fortified our market position by continuing to be the nation’s leading
Lee SchramChief Executive Officer

2007 Milestones Build 2008 Momentum
direct-to-consumer check supplier and our operating income profile remainedstrong. We enhanced results through our investments in free-standing insertadvertising impressions, and our focus on selling additional products such as holiday greeting cards, stored-value gift cards, and premium-priced features and accessories.
Our focus for 2008 is to continue recapturing share through increased free-standinginsert advertising and enhanced internet search engine spend, acquiring andretaining customers, and maximizing the lifetime value of our customers by selling new features and accessories. We are also starting to focus on other products andservices, in addition to checks and related accessories, that we can sell directly toconsumers. All these efforts should allow our profitability profile to remain withinone to two points of our operating margin profile from the last several years.
Unlocking Our PotentialWith such exciting opportunities in each of our business segments, we are forgingahead with the next steps in our transformation. We know we must continue to improve near-term results, while at the same time continuing to position thecompany for long-term success. As we continue our transformation, we need tointensify our innovation, product development, and product launch capabilities.As we reduce our infrastructure costs, we are reinvesting some of these savings in new products, platforms, enablers, and tools.
Our continued reinvention focuses not only on how we can help our customers run and protect their businesses, but also grow their businesses. This focus startswith repositioning Deluxe’s brand framework to drive emotional attachment, distinctive customer experiences, and solid proof of our ability to grow loyal customers and strengthen their business performance. We then target customerexperience requirements to leverage Deluxe’s unique position at the intersectionbetween FIs and the small business customer, reaching more deeply into verticalmarket segments and expanding relationships based upon growth needs. These verticals include retailers, contractors, professional services providers, banks and credit unions.
Based upon this, in the future, we see more of a transition to two core operating models… a democratization-of-services model and a premier model. Democratization of services involves taking existing higher-cost services and turning them into lower-cost solutions by productizing them for affordabilityand scale. The premier model provides customized support, expertise, products, andservices to a well-defined, small group of customers because the economic returnwarrants specialized relations and treatment. We are working to define the core
elements, required systems, and value propositions of each of these models. This will include creating a cost-effective and flexible infrastructure to support bothmodels. All of these then align to create product and service portfolio expansionopportunities focused on helping our customers grow their businesses. Positioning,products, services, and content will increasingly be tailored to specific verticalmarket segments. Services will be expanded and aggressively rolled out and functionality enhanced to improve the customer buying experience. We will still be focused on a lean, simplified, stable core business, and this great foundation will allow us to more fully realize the potential of our growth initiatives.
In closing, my sincere thanks to all the people of Deluxe for your unwaveringenthusiasm and dedication, to our customers for your loyalty and trust, to ourpartners for your engagement and commitment, and to our shareholders foryour support and confidence on our exciting transformational journey.
We believe our future is bright and that we collectively own our story. 2008 is a pivotal year for Deluxe as we take another positive step in becoming a greatcompany again. We are focusing on our customers, taking steps to prove we cangrow revenue while not taking our eyes off of costs, and continuing to improveprofitability and operating cash flow. We have the products, people, and a newcontemporized brand required to win. We have built a stronger core foundationand now will expand on it in the next steps of our transformation. We knowthat if we execute these focus areas well on our continued journey, we willunlock more of Deluxe’s full potential and create value for our shareholders.
Lee SchramChief Executive Officer
Shareholders, continued
Updated Brand Mark, New Solutions
The groundwork was laid in 2007 for the February 2008introduction of Deluxe’s updated enterprise brand mark. The contemporary, streamlined design reflects our focus onthe future, while honoring our heritage and leveraging theequity of our signature red “D.” The addition of “Corp”reflects the broadening of our scope beyond checks and our commitment to being the model solutions partner for our 6-million-plus small business and financial institution customers.
The updated brand mark is the first step in Deluxe’s migrationto a master brand architecture. Extensive research has pointedthe organization to a brand framework rooted in thestrengths of the Deluxe name. During 2008 and 2009 wewill be migrating more than 20 acquired sub-brands to theDeluxe master brand. This move will create long-term brandvalue, while contributing to enterprise-wide Lean initiativesand cost reductions.
On a parallel path, our Experience and New SolutionsGroups are working closer together than ever. OurExperience team works with thousands of financial institutioncustomers to solve industry challenges and share ideasthrough our Collaboratives and Knowledge Exchange
Expos. New solutions, like DeluxeCalling® and the Welcome Home® Tool Kit, are a direct result of our industry-leading experience work.
“In 2008, there will be even greater focus on developing solutionsthat leverage the learnings from Deluxe’sCollaboratives andKnowledge Exchange Expos. We understand customer experience and theneeds of the small business andfinancial institution customers. Leveraging this understanding to develop new customer solutions will be the driving force behind the repositioning of the Deluxe brand.”
Laura Radewald Martie WoodsVice President, Chief Experience OfficerEnterprise Brand
Successful Senior Notes Offering
Anticipating the October 1, 2007 maturing of $325 million,3.25% senior, unsecured notes, Deluxe in May 2007 readied plansto offer $200 million of 7.375% senior, unsecured notes. This wasthe first time in its 93-year history Deluxe sought to obtain funding as a high-yield issuer of debt.
Deluxe went into the offering with a strong story to tell: three successive quarters of meeting or exceeding our financial commitments and solid evidence that our transformation was gainingtraction. Key members of Deluxe’s financial leadership team toldthe company’s story to hundreds of institutional bond investors. This class of investors was both enthusiastic and curious about the company’s progress on its journey from world-class checkprinter to model business partner targeting financial institutions,small businesses and consumers.
The bond offering yielded strongresponse with overwhelmingdemand from investors. The proceeds provided Deluxe withthe financial flexibility to comfortably meet its Octoberrepayment obligation whilemaintaining focus on our business transformation.
“The successful bond offering combined withthe company’s strong financial performance— including excellent cash flow and creditratios — put us in a great position to stayfocused on our long-term vision for growth.”
Jeff Johnson, Assistant Treasurer

2007 Mile
stone
s, co
ntin
ued
Reinventing Our E-commerce Platform
Deluxe was visionary when it entered the e-commerce marketplace in the 1990s. Today, we generate over$400 million in revenue annually across our e-commerce Web sites and electronic ordering platforms, mostly comingfrom the personal check businesses.
Deluxe’s future Web strategy is focused on deliveringhigh-value, personalized customer experiences. In 2007,Deluxe upgraded and relaunched Deluxe.com. Our E-commerce group championed the selection and implementation of a best-in-class e-tailing and visualizationplatform. We created and implemented a fully functioninge-tail Web site to test a high-intimacy, go-to-market modelfor small businesses. And we introduced a new electronicordering platform to provide unique ordering experiencesfor our financial institution customers.
Deluxe is focused on and positioned to aggressively acquireand grow profitable customer relationships through its e-commerce channels. Legacy brand Web sites will, over the next 12 to 24 months, be streamlined under the Deluxemaster brand. This strategy will create a powerful customeroffering by bringing together an expanded, more completeproduct and service portfolio. Our primary customer saleschannels — Web, direct mail and call centers — will bemore closely integrated than ever. This will ensure every customer can interact with Deluxe via his or her preferredchannels and receive a high-value experience.
“Deluxe’s next-generation e-commerce and internetstrategy will again make us a leader in creating onlineexperiences designed to delightour customers. These experienceswill generate zealous loyalty as wepartner with our customers to grow their businesses, and in turn, create loyal customers for them.”
Knowledge Products Drive Results
Deluxe introduced several new knowledge-based solutions to our FI customers in 2007. Born out of our successfulDeluxe Knowledge ExchangeSM Collaboratives, these solutionsare driving loyalty, retention and growth for our FI customers.And strong results are helping Deluxe be viewed by FIs as the country’s best check provider — and as a trusted business partner.
DeluxeCallingSM is one example of how Deluxe is creatingvalue for our bank and credit union customers. Piloted in2006 and introduced in 2007, DeluxeCalling leverages ourworld-class call centers to help FIs increase account depthamong new, third-party borrowers. Highly trained Deluxecall center associates place outbound calls on behalf of FIcustomers with a goal of building relationships — andaccounts — with indirect borrowers.
To date, DeluxeCalling program results are outperformingdirect mail campaigns 10 to 1. The results of one two-monthpilot with a 500,000-plus member credit union were staggering.More than 20% of customers targeted via DeluxeCalling visited a branch, and 40% of those visiting a branch opened at least one additional account. This was up from a 1%branch-visit rate following the FI’s own direct mail campaign.
We will expand the power of DeluxeCalling in 2008 by adding “conversion” outbound calling services targeting an FI’s small business or retail customers impacted by a merger or acquisition. We are also expanding our pilot opportunities to test and measure highly customized campaigns.
“Our customer care centers are rated world-class —among the best of all callcenters in the U.S. It’s reallyexciting for our team to havethe opportunity to partner sodeeply with our FI customers on programs that are changing therelationships they have with their customers.”
Bev Contreras Ronalda SmithOutbound Call Associate, Team Leader,Phoenix Customer Call Phoenix Customer CallCare Center Care Center
IT Cost Reductions
Deluxe’s Information Technology (IT) group in 2007 delivered significant cost savings compared to 2006 spendinglevels. We aggressively renegotiated principal partner contractsin the areas of data center management, telecommunications,and hardware and software procurement. These critical relationships are more flexible and transparent than ever before,which allows us to work more productively with these partnersto make long-term strategic decisions.
Our right-sourcing strategy also is yielding results. We successfully transitioned more than 80% of our ITmaintenance and support needs to our new outsourcingpartner. We made the strategic decision to in-sourceour PC support services, which has allowed us to be faster and more responsive to the needs of our internal users at aper-unit cost saving.
The IT group is focused in 2008 and beyond on a highest-value/lowest-cost operating model. We will leverage forwardour enhanced vendor partnership strategy. And we are aggres-sively pursuing further consolidation and virtualization of our enterprise IT infrastructure,including application streamlin-ing and data integration.
“My team needed to renegotiate a contract —mid-term — and businessrelationship with a keypartner. Our enterprisestrategy calls for changes inservice and cost structure, as well as greater transparency. Today, we are providing better services at a lower cost in an environment that enables us to work with our partner to makecost-value decisions in real time.”
Market-leading Package Solution
Deluxe’s cost reduction initiatives were ahead of schedule in2007 due to our sharp, enterprise-wide focus on Lean processesand innovation. Our industry-leading flat check packaging solution is an excellent example of Lean innovation.
Deluxe was the first — and to date is the only — check manufacturer to introduce a check packaging solution and fulfillment process designed to address the United StatesPostal Service’s (USPS) changing requirements and significantincrease in parcel delivery costs. Spurred by a potential 40%cost increase, we worked closely with the USPS, our financialinstitution and direct check customers and our suppliers tofind an innovative solution.
Deluxe deployed new equipment and workflow processes in six locations and began shipping its patent-pending flat package solution May 14 — the same day the USPS rate increase took effect. The package is weather-resistant,tamper-evident, sized for processing through USPS automated equipment and flexible enough to fit in a
variety of mail receptacles. It also contains a flat version of the traditional check box that check users can assemble tostore checks.
The long-term benefits of this solution will continue tounfold in 2008 and 2009 as the project team continues tomake the process lean through automation and additionalproductivity gains. Our team is also exploring extended and new uses for the technology, processand package.
“This project is a great example ofthe one Deluxe enterprise strategyat work. Our cross-functionalteam rose to leadership’s speed-to-market challenge with an innova-tive solution. This year we’ll shipmillions of check orders using themost secure and cost-effective method inthe marketplace. And that’s just the beginning.”
Brian Boo Gary MeelhauseEngineering Manager Principal Project Manager
Greg Schwab,Director, Network Servicesand Call Technologies
Dan FloodE-marketing Manager
Kelly LarsonExecutive Director, E-commerce

Stabilized core revenue while growing diluted EPS 41% and generating strong operating cash flow of $245 million.
Cost reduction initiatives ahead of schedule. Announced an additional $75 million in costs savings for 2008 and 2009.
Made progress on new revenue expansion initiatives. Created and implemented successful small business Web site e-tail pilot.
Reduced debt in excess of $171 million. Issued $200 million of notes in May and repaid $325 million of notes on October 1.
Repurchased $11 million of common stock.
EXECUTIVE OFFICES
Street Address:
3680 Victoria Street North
Shoreview, MN 55126-2966
Mailing Address:
P.O. Box 64235
St. Paul, MN 55164-0235
(651) 483-7111
DILUTED EPS FROMCONTINUING OPERATIONS
2007 HIGHLIGHTSREVENUE(IN BILLIONS)
$1.24
$1.57
$1.72$1.64 $1.61
03 04 05 06 07
$3.49$3.93
$3.10
$1.95$2.76
03 04 05 06 07
OPERATING CASH FLOW FROM CONTINUING OPERATIONS
(IN MILLIONS)
$181.5
$307.6
$178.3
$239.3$244.7
03 04 05 06 07

Quarterly stock dataThe chart below shows the per-share closing priceranges for the company’s common stock for the past two fiscal years as quoted on the New YorkStock Exchange.
Stock ExchangeDeluxe Corporation common stock is traded on the New York Stock Exchange under the symbol DLX.
Required FilingsWe have submitted the required Annual CEOCertification to the New York Stock Exchange andfiled as exhibits to the annual report on Form 10-Kthe Chief Executive Officer and Chief FinancialOfficer certifications required by Section 302 of the Sarbanes-Oxley Act.
Annual MeetingShareholders are invited to attend Deluxe’s annualshareholder meeting on Wednesday, April 30, 2008.It will be held in the Deluxe headquarters building,3680 Victoria Street North, Shoreview, MN, at 2:00 p.m. CDT.
Form 10-K AvailableA complete copy of our annual report on Form 10-Kis posted at Deluxe.com. It also may be obtainedwithout charge by sending an e-mail to [email protected] or a written request to:
Deluxe CorporationAttn: Investor RelationsP.O. Box 64235St. Paul, MN 55164-0235(651) 787-1068
Shareholder InquiriesRequests for additional information should be sent to the attention of Investor Relations at the above address or by e-mail to [email protected].
Executive OfficesStreet address:3680 Victoria Street North Shoreview, MN 55126-2966
Mailing address: P.O. Box 64235St. Paul, MN 55164-0235(651) 483-7111
Stock Ownership and Record KeepingWells Fargo Shareowner Services
Street address: 161 North Concord ExchangeSt. Paul, MN 55075(800) 468-9716(651) 450-4064
Mailing address:P.O. Box 64854St. Paul, MN 55164-0854Wellsfargo.com/shareownerservices
Acquiring InformationThe latest company press releases regarding financialresults, dividend news and other information, as wellas the annual report on Form 10-K, quarterly reportson Form 10-Q, proxy statement and other SEC filings can be found online at Deluxe.com. To request printed versions of any of the materials listed, please call (651) 787-1068 or e-mail [email protected].
Deluxe Web sitesBagsandbowsonline.comChecks.comChecksunlimited.comDeluxeforms.comDeluxe.comDeluxesmallbusiness.comDesignerchecks.comGosafeguard.comJohnsongroup.comNebs.comRedleafdigital.comRussellandmiller.com
Forward-Looking StatementsStatements made in this report concerning the company’s or management’s intentions, expectationsor predictions about future results or events are “forward-looking statements” within the meaning of the Private Securities Litigation Reform Act of1995. Such statements reflect management’s currentexpectations or beliefs, and are subject to risks and uncertainties that could cause actual results or eventsto differ materially from those projected. Additionalinformation concerning various factors that couldcause actual results and events to differ from those
projected are contained in the company’s annualreport on Form 10-K for the year endedDecember 31, 2007, which has been filed with the Securities and Exchange Commission and is posted on Deluxe.com.
Leadership Board of Directors
Stephen P. NachtsheimDirector Since 1995Non-Executive Chairman, Deluxe CorporationVice President, Intel Corporation (Retired)
Cheryl E. Mayberry McKissackDirector Since 2000President and Chief Executive Officer, Nia Enterprises, LLC
Charles A. HaggertyDirector Since 2000Chairman, Western Digital Corporation (Retired)
Martyn R. RedgraveDirector Since 2001Executive Vice President and Chief Administrative Officer, Limited Brands, Inc.
Mary Ann O’DwyerDirector Since 2003Senior Vice President of Finance and Operations and Chief Financial Officer, Wheels, Inc.
Isaiah Harris, Jr.Director Since 2004President, BellSouth Advertising & Publishing Group (Retired)
Ronald C. BaldwinDirector Since 2007Vice Chairman, Huntington Bancshares, Inc. (Retired)
Don J. McGrathDirector Since 2007Chairman and Chief Executive Officer, BancWest Corporation
Neil J. MetvinerDirector Since 2007Executive Vice President and President, Global Mailstream,Europe, Pitney Bowes, Inc.
Lee J. SchramDirector Since 2006Chief Executive Officer, Deluxe Corporation
Executive Leadership TeamLee J. SchramChief Executive Officer
Richard S. GreeneSenior Vice President, Chief Financial Officer
Anthony C. ScarfoneSenior Vice President, General Counsel and Secretary
Jeffrey D. StonerSenior Vice President, Human Resources
Luann E. WidenerSenior Vice President, Chief Sales and Marketing Officer forFinancial Institutions and Small Businesses
Leanne E. BranhamVice President, Fulfillment
Lynn R. KoldenhovenVice President, Sales and Marketing for Direct-to-Consumer Segment
Terry D. PetersonVice President, Investor Relations and Chief Accounting Officer
© 2008 Deluxe Enterprise Operations, Inc. All rights reserved.
Designed and printed by Russell and Miller, wholly owned by Deluxe Corporation.
Project1 3/14/08 9:28 AM Page 1

1
UNITED STATES SECURITIES AND EXCHANGE COMMISSION
Washington, D.C. 20549
Form 10-K
[ x ] Annual Report Pursuant to Section 13 or 15(d) of the Securities Exchange Act of 1934 For the fiscal year ended December 31, 2007
Commission file number: 1-7945
DELUXE CORPORATION (Exact name of registrant as specified in its charter)
Minnesota 41-0216800
(State or other jurisdiction of (I.R.S. Employer incorporation or organization) Identification No.)
3680 Victoria St. N., Shoreview, Minnesota 55126-2966 (Address of principal executive offices) (Zip Code)
Registrant's telephone number, including area code: (651) 483-7111
Securities registered pursuant to Section 12(b) of the Act:
Common Stock, par value $1.00 per share New York Stock Exchange (Title of each class) (Name of each exchange on which registered)
Securities registered pursuant to Section 12(g) of the Act: None
Indicate by check mark if the registrant is a well-known seasoned issuer, as defined in Rule 405 of the Securities Act. � Yes __ No Indicate by check mark if the registrant is not required to file reports pursuant to Section 13 or Section 15(d) of the Act. Yes � No Indicate by check mark whether the registrant (1) has filed all reports required to be filed by Section 13 or 15(d) of the Securities Exchange Act of 1934 during the preceding 12 months (or for such shorter period that the registrant was required to file such reports), and (2) has been subject to such filing requirements for the past 90 days. � Yes __ No
2
Indicate by check mark if disclosure of delinquent filers pursuant to Item 405 of Regulation S-K (§229.405 of this chapter) is not contained herein, and will not be contained, to the best of registrant's knowledge, in definitive proxy or information statements incorporated by reference in Part III of this Form 10-K or any amendment to this Form 10-K. [�] Indicate by check mark whether the registrant is a large accelerated filer, an accelerated filer, a non-accelerated filer, or a smaller reporting company. See definitions of “large accelerated filer,” “accelerated filer,” and “smaller reporting company” in Rule 12b-2 of the Exchange Act. (Check one):
Large accelerated filer � Accelerated filer __
Non-accelerated filer __ Smaller reporting company __ (Do not check if a smaller reporting company)
Indicate by check mark whether the registrant is a shell company (as defined in Rule 12b-2 of the Act). Yes � No
The aggregate market value of the voting stock held by non-affiliates of the registrant is $2,106,692,238 based on the last sales price of the registrant’s common stock on the New York Stock Exchange on June 29, 2007. The number of outstanding shares of the registrant's common stock as of February 14, 2008, was 51,396,076. Documents Incorporated by Reference:
1. Portions of our definitive proxy statement to be filed within 120 days after our fiscal year-end are incorporated by reference in Part III.

3
DELUXE CORPORATION FORM 10-K
FOR THE YEAR ENDED DECEMBER 31, 2007
TABLE OF CONTENTS
Item Description Page
Item 1 Business 4
Item 1A Risk Factors 13
Item 1B Unresolved Staff Comments 17
Item 2 Properties 17
Item 3 Legal Proceedings 17
Item 4 Submission of Matters to a Vote of Security Holders 18
Item 5 Market for Registrant’s Common Equity, Related Stockholder Matters and Issuer Purchases of Equity Securities
18
Item 6 Selected Financial Data 20
Item 7 Management’s Discussion and Analysis of Financial Condition and Results of Operation
21
Item 7A Quantitative and Qualitative Disclosure About Market Risk 44
Item 8 Financial Statements and Supplementary Data 44
Item 9 Changes in and Disagreements with Accountants on Accounting and Financial Disclosure
92
Item 9A Controls and Procedures 92
Item 9B Other Information 92
Item 10 Directors, Executive Officers and Corporate Governance 93
Item 11 Executive Compensation 93
Item 12 Security Ownership of Certain Beneficial Owners and Management and Related Stockholder Matters
93
Item 13 Certain Relationships and Related Transactions, and Director Independence 93
Item 14 Principal Accounting Fees and Services 94
Item 15 Exhibits, Financial Statement Schedules 94
Signatures 99
Index to Exhibits 101

4
PART I
Item 1. Business.
Deluxe Corporation was incorporated under the laws of the State of Minnesota in 1920. From 1920 until 1988 our company was named Deluxe Check Printers, Incorporated. Our principal corporate offices are located at 3680 Victoria Street North, Shoreview, Minnesota 55126-2966. Our main telephone number is (651) 483-7111.
COMPANY OVERVIEW
Through our industry-leading businesses and brands, we help small businesses and financial institutions better manage, promote, and grow their businesses. We use direct marketing, a North American sales force, financial institution referrals, independent distributors and the internet to provide our customers a wide range of customized products and services: personalized printed items (checks, forms, business cards, stationery, greeting cards, labels, and retail packaging supplies), promotional products and merchandising materials, fraud prevention and marketing services and financial institution customer loyalty and retention programs. We also sell personalized checks, accessories, stored value gift cards and other services directly to consumers.
BUSINESS SEGMENTS
Our business segments include Small Business Services (SBS), Financial Services and Direct Checks. These businesses are generally organized by type of customer and reflect the way we manage the company. Additional information concerning our segments appears under the caption “Note 17: Business segment information” of the Notes to Consolidated Financial Statements appearing in Item 8 of this report.
Small Business Services
SBS operates under various brands including Deluxe, New England Business Service, Inc. (NEBS®), Safeguard®, McBee®, and RapidForms®. This is our largest segment in terms of revenue and operating income, and we are concentrating on profitably growing this segment. SBS strives to be a leading resource to small businesses by providing personalized products and services that help them manage, promote and grow their businesses. SBS sells business checks, printed forms, promotional products, marketing materials and related services and products to more than six million small business customers in the United States and Canada. Of these customers, four million have ordered our products or services in the last 24 months. Printed forms include billing forms, work orders, job proposals, purchase orders, invoices and personnel forms. We also produce computer forms compatible with accounting software packages commonly used by small businesses. Our stationery, letterhead, envelopes and business cards are produced in a variety of formats and ink colors. Acquisitions in recent years have added capabilities in the custom, full-color digital and web-to-print spaces.
The majority of SBS products are distributed through more than one channel. Our primary channels are direct
mail, in which promotional advertising is delivered by mail to small businesses, and financial institution referrals. These efforts are supplemented by the account development efforts of an outbound telemarketing group. We also sell through internet websites, a network of independent local dealers and Safeguard® distributors, as well as our field sales organization that calls directly on small businesses. Customer service for initial order support, product reorders and routine service is provided by a network of call center representatives located throughout the United States and Canada.

5
Our focus within SBS is to grow revenue and increase operating margin by continuing to implement the following strategies:
• Acquire new customers by leveraging customer referrals that we receive from our financial institution clients and from other marketing initiatives such as direct mail and e-commerce;
• Increase our share of the amount small businesses spend on the products and services in our portfolio;
• Consolidate brands and leverage cross-selling opportunities; and
• Continue to optimize our cost and expense structure.
We are investing in several key enablers to achieve our strategies. These key enablers include improving our e-commerce capabilities, implementing an integrated platform for our various brands, improving our customer analytics and focusing on key vertical segments and improved merchandising. As we focus on these key enablers, we plan to streamline and update our brand structure, as well as transition our sales model to integrate field sales, marketing and customer call centers across the company. We believe this creates more focus on customers, positions us for growth and ensures we are leveraging processes, facilities and resources to our best advantage. We have also introduced a new www.Deluxe.com website which will serve as a platform for improved e-commerce capability, and we have identified significant opportunities to expand sales to our existing customers.
Additionally, the small business customer referrals we receive from our Deluxe Business AdvantageSM
program, which provides a fast and simple way for financial institutions to offer expanded personalized service to small businesses, will continue to be an important part of our growth strategy. We have acquired companies which allow us to expand our business in the custom, full color, digital and web-to-print space with our small business customers and we divested a non-strategic product line. Recently, we introduced the Deluxe Marketing Store to offer fast, hassle-free solutions for small businesses. The Deluxe Marketing Store is a website that offers products and services to help small businesses reach their customers, build customer loyalty and promote their business. Small businesses can design and create logos, websites, mailings and other promotional items. The Deluxe Marketing Store is also a resource for small businesses as it contains useful information for growing and managing a small business.
Financial Services
Financial Services sells personal and business checks, check-related products and services, stored value gift cards and customer loyalty, retention and fraud monitoring/protection services to financial institutions. We also offer enhanced services such as customized reporting, file management and expedited account conversion support. Our relationships with specific financial institutions are generally formalized through supply contracts which usually range in duration from three to five years. We serve approximately 7,000 financial institutions in the United States. Consumers and small businesses typically submit their check order to their financial institution, which then forwards the order to us. We process the order and ship it directly to the consumer or small business. Financial Services produces a wide range of check designs, with many consumers preferring one of the dozens of licensed or cause-related designs we offer, including Disney®, Warner Brothers®, Garfield®, Harley-Davidson®, NASCAR®, PGA TOUR, Thomas Kinkade®, Susan G. Komen Breast Cancer Foundation and National Arbor Day Foundation®. Our strategies within Financial Services are as follows:
• Continue to retain core check revenue streams and acquire new customers;
• Provide services and products that differentiate us from the competition and make us a more relevant business partner to our financial institution clients; and
• Continue to simplify our business model and optimize our cost and expense structure.
To achieve our strategies we are leveraging our customer acquisition and loyalty programs, our Deluxe Business Advantage program and enhanced small business customer service. The Deluxe Business Advantage
program is designed to maximize financial institution business check programs by offering expanded personalized service to small businesses with a number of service level options.
In our efforts to expand beyond check-related products, we have introduced and continue to pilot several new
services that focus on customer loyalty and retention. Two examples are the Welcome HomeSM Tool Kit and the

6
Deluxe ImpressionsSM products which enable financial institutions to forge strong bonds with new customers, thereby increasing customer loyalty and retention. We also offer Deluxe ID TheftBlock®, a set of fraud monitoring and recovery services that provides assistance to consumers in detecting and recovering from identity theft. We also enhanced our stored value gift card program and launched DeluxeCalling SM, a service providing a first point of contact with new indirect loan consumers on behalf of our financial institution clients. This service leverages our core competency of call center expertise and provides incremental revenue and increased customer retention for our financial institution clients. Providing products and services that differentiate us from the competition is expected to help offset the decline in check usage and the pricing pressures we are experiencing in our check programs. As such, we are also focused on accelerating the pace at which we introduce new products and services.
In addition to these value-added services, we continue to offer our Knowledge ExchangeTM Series for
financial institution clients through which we host knowledge exchange expos, conduct web seminars and host special industry conference calls, as well as offer specialized publications. Through this program, financial institutions gain knowledge and exposure to thought leaders in areas that most impact their core strategies: client loyalty, small business and retail client strategy, cost management, customer experience and brand enhancement. Our Collaborative initiative, a key component of the Knowledge Exchange Series, enlists a team of leading financial institution executives who meet with us over a one year timeframe to develop and test specific and focused solutions on behalf of the financial services industry. These findings and new strategies or services are then disseminated for the benefit of all our clients. Our Small Business Collaborative initiative grew out of our Knowledge Exchange Series and explored and identified innovative ways for financial institution clients to improve relationships with small businesses. Our current Collaborative is exploring new ways in which financial institutions can improve the customer dispute resolution process in such a way that customer loyalty is enhanced. The findings from our current Collaborative will be disclosed at a conference in May 2008.
In addition to our initiatives to retain customers and introduce new products and services, we continue our
efforts to simplify processes, eliminate complexity in this business and lower our cost structure. Our efforts are focused on using lean principles to streamline call center and check fulfillment activities, redesign services into standardized flexible models, eliminate multiple systems and work streams and strengthen our ability to quickly develop and bring new products and services to market.
Direct Checks
Direct Checks is the nation’s leading direct-to-consumer check supplier, selling under the Checks Unlimited®, Designer® Checks and Checks.com brand names. Through these brands, we sell personal and business checks and related products and services directly to consumers using direct response marketing and the internet. We estimate the direct-to-consumer personal check printing portion of the payments industry accounts for approximately 15% of all personal checks sold.
We use a variety of direct marketing techniques to acquire new customers, including newspaper inserts, in-
package advertising, statement stuffers and co-op advertising. We also use e-commerce strategies to direct traffic to our websites, which include: www.checksunlimited.com, www.designerchecks.com and www.checks.com. Our direct-to-consumer focus has resulted in a total customer base of over 43 million customers, the most in the direct-to-consumer checks marketplace.
Direct Checks competes primarily on price and design. Pricing in the direct-to-consumer channel is generally
lower than prices charged to consumers in the financial institution channel. We also compete on design by seeking to offer the most attractive selection of images with high consumer appeal, many of which are acquired or licensed from well-known artists and organizations such as Disney®, Warner Brothers®, Harley Davidson® and Thomas Kinkade®.

7
Our focus within Direct Checks is to enhance our share of the direct-to-consumer channel by continuing to implement the following strategies:
• Maintain our 2007 level of marketing spend, which was increased from previous years;
• Maximize the lifetime value of customers by selling new features and accessories; and
• Continue to optimize our cost and expense structure. Beginning in 2007, we increased our advertising circulation of free-standing inserts under a new direct mail
advertising contract which will remain in effect for the next several years. This has been an effective form of new customer acquisition in this channel. We also intend to increase the portion of our advertising expense designated for customer retention by utilizing reactivation and e-mail campaigns. We continue to develop improved call center processes, provide additional products to Direct Checks’ small business customers and explore other avenues to increase sales to existing customers. In late 2006, we introduced the EZShieldTM product, a fraud protection service that provides reimbursement to consumers for forged signatures or endorsements and altered checks. We have also introduced holiday greeting cards and stored value gift cards on our websites.
PRODUCTS AND SERVICES
Revenue, by product, as a percentage of consolidated revenue for the last three years was as follows:
2007 2006
2005
Checks and related services ................................ 65.1% 63.5% 64.7%
Other printed products, including forms...................... 23.7% 22.9% 22.0%
Accessories and promotional products ........................ 8.0% 8.2% 8.4%
Packaging supplies and other................................ 3.2% 5.4% 4.9%
Total revenue........................................................... 100.0% 100.0% 100.0%
We remain one of the largest providers of checks in the United States, both in terms of revenue and the
number of checks produced. We provide check printing and related services for approximately 7,000 financial institution clients, as well as personalized checks, related accessories and fraud prevention services directly to millions of small businesses and consumers. Checks and related services account for the majority of the revenue in our Financial Services and Direct Checks segments and represent 48.9%, 46.1% and 44.8% of SBS total revenue in 2007, 2006 and 2005, respectively.
We are a leading provider of printed forms to small businesses, having provided products to more than six
million customers over the past five years. Printed forms include billing forms, work orders, job proposals, purchase orders, invoices and personnel forms. We produce computer forms compatible with accounting software packages commonly used by small businesses. Our stationery, letterhead, envelopes and business cards are produced in a variety of formats and ink colors. These items are designed to provide small business owners with the customized documents necessary to efficiently manage their business. We also provide promotional printed items and digital printing services designed to fulfill selling and marketing needs of the small businesses we serve.
MANUFACTURING
We continue to focus on improving the customer experience by providing excellent service and quality, reducing costs and increasing productivity. We accomplish this by embedding lean operating principles in all processes, emphasizing a culture of continuous improvement. Under this approach, employees work together to produce products, rather than working on individual tasks in a linear fashion. Because employees assume more ownership of the end product, the results are improved productivity and lower costs. We continue to see the benefit of these operational efficiencies in our results. The expertise we have developed in logistics, productivity and inventory management has allowed us to reduce our number of production facilities while still meeting client

8
requirements. We closed six check printing facilities in 2004, and in 2006, we closed our Los Angeles, California and Athens, Ohio printing facilities. Aside from our plant consolidations, we continue to seek other innovations to further increase efficiencies and reduce costs. During 2007, we implemented a new flat check package to mitigate the effects on our customers of a postal rate increase, which demonstrates our commitment to innovative solutions.
We have a shared services approach to manufacturing through which our three business segments share
manufacturing operations in order to optimize capacity utilization. This allows us to create centers of operational excellence that have a culture of continuous improvement. We have created blended sites to serve a variety of segments, brands and channels. As a result, we continue to reduce costs by utilizing our assets and printing technologies more efficiently and by enabling employees to better leverage their capabilities and talents.
INDUSTRY OVERVIEW Checks
According to a Federal Reserve study released in December 2007, approximately 33 billion checks are written annually. This includes checks which are converted to automated clearing house (ACH) payments. Checks remain the largest single non-cash payment method in the United States, accounting for approximately 35% of all non-cash payment transactions. This is a reduction from the Federal Reserve Study released in December 2004 when checks accounted for approximately 45% of all non-cash payment transactions. The Federal Reserve estimates that checks written declined approximately four percent per year between 2003 and 2006. According to our estimates, the use of small business checks is declining at a rate of two to four percent per year. The total transaction volume of all electronic payment methods exceeds check payments, and we expect this trend to continue. We believe check usage tends to be fairly resilient to downturns in the economy, so we expect recent economic conditions to have only a minor impact on our personal check businesses in the coming year.
Small Business Customers
The Small Business Administration’s Office of Advocacy defines a small business as an independent business having fewer than 500 employees. In 2006, the most recent date for which information is available, it was estimated that there were approximately 27 million small businesses in the United States. This represented approximately 99.7% of all employers. According to the same survey, small businesses employ half of all private sector employees and generated over 60% of net new jobs created each year over the last decade.
The small business market is impacted by general economic conditions and the rate of small business
formations. Small business growth continues to parallel the overall economy. The index of small business optimism published by the National Federation of Independent Business (NFIB) in December 2007 continued to be below average. We expect continued economic softness to have some negative impact on our 2008 results, primarily in the first half of the year.
We seek to serve the needs of the small business customer. We design, produce and distribute business
checks, forms, envelopes, retail packaging and related products to help them grow and promote their business. The rate checks are used by small businesses has thus far not been impacted as significantly by the use of alternative payment methods. The Formtrac 2006 report from the Document Management Industries Association (DMIA), the most recent data available, indicates that the business check portion of the markets serviced by SBS declined at a rate of two to four percent in 2006. Business forms products are also under pressure. Continual technological improvements have provided small business customers with alternative means to enact and record business transactions. For example, off-the-shelf business software applications and electronic transaction systems have been designed to automate many of the functions performed by business forms products.
9
Financial Institution Clients
Checks are most commonly ordered through financial institutions. We estimate approximately 85% of all consumer checks are ordered in this manner. Financial institutions include banks, credit unions and other financial services companies. Several developments related to financial institutions have affected the check printing portion of the payments industry:
• Financial institutions seek to maintain the profits they have historically generated from their check programs, despite the decline in check usage. This has put significant pricing pressure on check printers in the past several years.
• Financial institutions continue to consolidate through mergers and acquisitions. Often, the newly-combined entity seeks to reduce costs by leveraging economies of scale in purchasing, including its check supply contracts. This results in check providers competing intensely on price in order to retain not only their previous business with one of the financial institutions, but also to gain the business of the other party in the merger/acquisition.
• Financial institution mergers and acquisitions can also impact the duration of our contracts. Normally, the length of our contracts with financial institutions range from three to five years. However, contracts are sometimes renegotiated or bought out mid-term due to a consolidation of financial institutions.
• Banks, especially larger ones, may request pre-paid product discounts, made in the form of cash incentives, payable at the beginning of a contract. These contract acquisition payments negatively impact check producers’ cash flows in the short-term.
The recent turmoil in the financial services industry related to subprime lending activities has not had a
significant impact on financial institution check programs.
Consumer Direct Mail Response Rates
Direct Checks and portions of SBS have been impacted by reduced consumer response rates to direct mail advertisements. Our own experience indicates that the decline in our customer response rates is attributable to the decline in check usage and a general decline in direct marketing response rates. We continuously evaluate our marketing techniques to ensure we utilize the most effective and affordable advertising media.
Competition
The small business forms and supplies industry is highly fragmented with many small local suppliers and large national retailers. We believe we are well-positioned in this competitive landscape through our broad customer base, the breadth of our small business product and service offerings, multiple distribution channels, established relationships with our financial institution clients, reasonable prices, high quality and dependable service.
In the small business forms and supplies industry, the competitive factors influencing a customer’s purchase
decision are breadth of product line, speed of delivery, product quality, price, convenience and customer service. Our primary competitors are office product superstores, local printers, business form dealers, contract stationers and internet-based suppliers. Local printers provide personalization and customization, but typically have a limited variety of products and services, as well as limited printing sophistication. Office superstores offer a variety of products at competitive prices, but provide limited personalization and customization. We are aware of numerous independent companies or divisions of companies offering printed products and business supplies to small businesses through the internet, direct mail, distributors or a direct sales force.
In the check printing portion of the payments industry, we face considerable competition from several other
check printers, and we expect competition to remain intense as check usage continues to decline and financial institutions continue to consolidate. We also face competition from check printing software vendors and from internet-based sellers of checks and related products. Moreover, the check product must compete with alternative payment methods, including credit cards, debit cards, automated teller machines and electronic payment systems.

10
In the financial institution check printing business, the principal factors on which we compete are product and service breadth, price, quality and check merchandising program management. From time to time, some of our check printing competitors have reduced the prices of their products during the selection process in an attempt to gain greater volume. The corresponding pricing pressure placed on us has resulted in reduced profit margins and some shifts of business. Continuing pricing pressure will likely result in additional margin compression. Additionally, product discounts in the form of cash incentives payable to financial institutions upon contract execution have been a practice within the industry since the late 1990’s. Both the number of financial institution clients requesting these payments and the size of the payments has fluctuated significantly in recent years. These up-front payments negatively impact check printers’ cash flows in the short-term and may result in additional pricing pressure when the financial institution also negotiates greater product discount levels throughout the term of the contract. Beginning in 2006, we sought to reduce the use of up-front product discounts by structuring new contracts with incentives throughout the duration of the contract.
In May 2007, our two primary competitors in the check printing portion of the payments industry merged and are
now doing business as Harland ClarkeTM. As this is a recent merger, the impact, if any, it may have on competition remains uncertain.
Seasonality
General economic conditions have an impact on our business and financial results. From time to time, the markets in which we sell our products and services experience weak economic conditions that may negatively impact revenue. We experience some seasonal trends in the sale of our products. For example, holiday card sales and stored value gift cards typically are stronger in the fourth quarter of the year, and sales of tax forms are stronger in the first quarter of the year.
Raw Materials and Supplies
The principal raw materials used in producing our main products are paper, plastics, ink, cartons and printing plate material, which we purchase from various sources. We also purchase some stock business forms produced by third parties. We believe that we will be able to obtain an adequate supply of materials from current or alternative suppliers.
Governmental Regulation
We are subject to regulations implementing the privacy and information security requirements of the federal financial modernization law known as the Gramm-Leach-Bliley Act (the Act) and other federal regulation and state law on the same subject. These laws and regulations require us to develop and implement policies to protect the security and confidentiality of consumers’ nonpublic personal information and to disclose these policies to consumers before a customer relationship is established and annually thereafter. Our financial institution clients request various contractual provisions in our supply contracts that are intended to comply with their obligations under the Act and with other privacy and security oriented laws. The regulations require some of our businesses to provide a notice to consumers to allow them the opportunity to have their nonpublic personal information removed from our files before we share their information with certain third parties. The regulations, including the above provision, may limit our ability to use consumer data to pursue certain business opportunities.
Congress and many states have passed and are considering additional laws or regulations that, among other
things, restrict the use, purchase, sale or sharing of nonpublic personal information about consumers and business customers. Laws and regulations may be adopted in the future with respect to the internet, e-commerce or marketing practices generally relating to consumer privacy. Such laws or regulations may impede the growth of the internet and/or use of other sales or marketing vehicles. For example, new privacy laws could decrease traffic to our websites, decrease telemarketing opportunities and increase the cost of obtaining new customers. We do not expect that changes to these laws and regulations will have a significant impact on our business in 2008.

11
Intellectual Property
We rely on a combination of trademark and copyright laws, trade secret and patent protection and confidentiality and license agreements to protect our trademarks, software and other intellectual property. However, intellectual property laws afford limited protection. Third parties may infringe or misappropriate our intellectual property or otherwise independently develop substantially equivalent products or services which do not infringe on our intellectual property rights. In addition, check designs exclusively licensed from third parties account for a portion of our revenue. These license agreements generally average three years in duration. There can be no guarantee that such licenses will be available to us indefinitely or at terms under which we can continue to generate a profit from the sale of licensed products.
EMPLOYEES
As of December 31, 2007, we employed 7,600 employees in the United States and 391 employees in Canada.
None of our employees are represented by labor unions, and we consider our employee relations to be good.
AVAILABILITY OF COMMISSION FILINGS
We make available through the Investor Relations section of our website, www.deluxe.com, our annual reports on Form 10-K, quarterly reports on Form 10-Q, current reports on Form 8-K and amendments to these reports filed or furnished pursuant to section 13(a) or 15(d) of the Exchange Act as soon as reasonably practicable after these items are electronically filed with or furnished to the Securities and Exchange Commission (SEC). These reports can also be accessed via the SEC website, www.sec.gov, or via the SEC’s Public Reference Room located at 100 F Street N.E., Washington, D.C. 20549. Information concerning the operation of the SEC’s Public Reference Room can be obtained by calling 1-800-SEC-0330.
A copy of this report may be obtained without charge by calling 651-787-1068 or by sending a written request
to the attention of Investor Relations, Deluxe Corporation, P.O. Box 64235, St. Paul, Minnesota 55164-0235.
CODE OF ETHICS AND CORPORATE GOVERNANCE GUIDELINES
We have adopted a Code of Ethics and Business Conduct which applies to all of our employees and our board
of directors. The Code of Ethics and Business Conduct is available in the Investor Relations section of our website, www.deluxe.com, and also can be obtained free of charge upon written request to the attention of Investor Relations, Deluxe Corporation, P.O. Box 64235, St. Paul, Minnesota 55164-0235. Any changes or waivers of the Code of Ethics and Business Conduct will be disclosed on our website. In addition, our Corporate Governance Guidelines and the charters of the Audit, Compensation, Corporate Governance and Finance Committees of our board of directors are available on our website or upon written request.

12
EXECUTIVE OFFICERS OF THE REGISTRANT
Our executive officers are elected by the board of directors each year. The following summarizes our executive officers and their positions.
Name Age Present Position Executive Officer Since
Anthony Scarfone 46 Senior Vice President, General Counsel and Secretary 2000
Luann Widener 50 Senior Vice President, Chief Sales and Marketing Officer for Financial Institutions and Small Businesses
2003
Terry Peterson 43 Vice President, Investor Relations and Chief Accounting Officer 2005
Leanne Branham 44 Vice President, Fulfillment 2006
Mike Degeneffe 43 Chief Information Officer 2006
Richard Greene 43 Senior Vice President, Chief Financial Officer 2006
Lynn Koldenhoven 41 Vice President, Sales and Marketing Direct-to-Consumer 2006
Lee Schram 46 Chief Executive Officer 2006
Jeff Stoner 44 Senior Vice President, Human Resources 2006
Anthony Scarfone joined us in September 2000 as senior vice president, general counsel and secretary.
Luann Widener was named chief sales and marketing officer for financial institutions and small businesses in October 2006. From March 2006 until October 2006, Ms. Widener was senior vice president, president of manufacturing shared services, supply chain and Financial Services. From June 2003 to March 2006, Ms. Widener served as senior vice president, human resources and in December 2005, she assumed responsibility for our manufacturing and supply chain operations. From July 2000 to June 2003, Ms. Widener served as vice president of manufacturing operations for our Financial Services segment.
Terry Peterson was named vice president of investor relations in October 2006. From May 2006 to
September 2006, Mr. Peterson served as interim Chief Financial Officer and was named chief accounting officer in March 2005. Mr. Peterson joined us in September 2004 and served as director of internal audit until March 2005. From August 2002 until August 2004, Mr. Peterson was vice president and controller of the GCS Services Division of Ecolab, Inc., a worldwide developer and marketer of premium cleaning and sanitation products.
Leanne Branham was named vice president, fulfillment in October 2006. From July 2004 to October 2006, Ms. Branham served as vice president of manufacturing shared services and from July 2003 to June 2004, Ms. Branham was vice president of manufacturing for Financial Services. From May 2001 to July 2003, Ms. Branham served as director of marketing for Direct Checks.
Mike Degeneffe joined us as chief information officer in October 2006. From September 2000 to October 2006, Mr. Degeneffe was employed by Residential Funding Corporation, a business unit of General Motors Acceptance Corporation (GMAC), where he served as chief information officer and enterprise chief technology officer from September 2004 to October 2006 and as managing director and enterprise chief information officer from April 2001 to September 2004.
Richard Greene joined us as senior vice president, chief financial officer in October 2006. From April 2005 to April 2006, Mr. Greene served as chief financial officer of the plastics and adhesives segment of Tyco International Ltd., which was renamed Covalence Specialty Materials Corp. upon divestiture. From October 2003 to April 2005, Mr. Greene was vice president and chief financial officer of the Tyco Plastics unit of Tyco International Ltd. From July 1999 to October 2003, Mr. Greene held various finance leadership positions at wholly-owned subsidiaries of Honeywell International Inc., a diversified technology and manufacturing company.
Lynn Koldenhoven was named vice president, sales and marketing direct-to-consumer in October 2006. Prior to this, Ms. Koldenhoven held a variety of positions within Direct Checks, including: interim vice president from February 2006 to October 2006, executive director of marketing from March 2004 to January 2006, director of core marketing from July 2003 to March 2004 and manager of checks manufacturing from May 2001 to July 2003.

13
Lee Schram joined us as chief executive officer in May 2006. From March 2003 to April 2006, Mr. Schram served as senior vice president of the Retail Solutions Division of NCR Corporation (NCR), a leading global technology company. From January 2002 to March 2003, Mr. Schram was vice president and general manager, payment solutions of the Financial Services Division of NCR. From September 2000 to January 2002, Mr. Schram served as chief financial officer of the Retail and Financial Group of NCR.
Jeff Stoner was named senior vice president, human resources in March 2006. Mr. Stoner joined us in November 2003 and served as vice president of organizational effectiveness until March 2006. From June 2001 until November 2003, Mr. Stoner was a vice president for the global product business unit of Personnel Decisions International, Inc., a human resources consulting firm. Item 1A. Risk Factors.
Our business, consolidated results of operations, financial condition and cash flows could be adversely affected by various risks and uncertainties. These risks include, but are not limited to, the principal factors listed below and the other matters set forth in this Annual Report on Form 10-K. Additional risks not presently known to us, or that we currently deem immaterial, may also impair our business, results of operations and financial condition. You should carefully consider all of these risks.
The check printing portion of the payments industry is mature and, if check usage declines faster than expected,
it could have a materially adverse impact on our operating results.
Check printing is, and is expected to continue to be, an essential part of our business, representing 65.1% of our consolidated revenue in 2007. We primarily sell checks for personal and small business use and believe that there will continue to be a substantial demand for these checks for the foreseeable future. However, the total number of checks written in the United States has been in decline since the mid-1990s. According to our estimates, the total number of checks written by individuals has continued to decline approximately four to five percent each year and checks written by small businesses have declined two to four percent each year over the past three years. We believe that the number of checks written will continue to decline due to the increasing use of alternative payment methods, including credit cards, debit cards, automated teller machines, direct deposit and electronic and other bill paying services. However, the rate and the extent to which alternative payment methods will achieve acceptance and replace checks, whether as a result of legislative developments, personal preference or otherwise, cannot be predicted with certainty. A surge in the popularity of any of these alternative payment methods, or our inability to successfully offset the decline in check usage with other sources of revenue, could have a material adverse effect on our business, results of operations and prospects.
We face intense competition in all areas of our business.
Although we are one of the leading check printers in the United States, we face considerable competition. In
addition to competition from alternative payment systems, we also face intense competition from another check printer in our traditional financial institution sales channel, from direct mail sellers of personal checks, from sellers of business checks and forms, from check printing software vendors and from internet-based sellers of checks to individuals and small businesses. Additionally, low price, high volume office supply chain stores offer standardized business forms, checks and related products to small businesses. We can provide no assurance that we will be able to compete effectively against current and future competitors. Continued competition could result in additional price reductions, reduced profit margins, loss of customers and an increase in up-front cash payments to financial institutions upon contract execution or renewal.
In May 2007, our two primary competitors in the check printing portion of the payments industry merged and are
now doing business as Harland ClarkeTM. As this is a recent merger, the impact, if any, it may have on competition remains uncertain.

14
We may not be successful at implementing our growth strategies within Small Business Services.
We continue to execute strategies intended to drive sustained growth within Small Business Services. We continue to promote our Deluxe Business AdvantageSM program and intend to expand sales to new and existing customers, develop models to tailor our marketing approach to each customer and further integrate our field sales, marketing and call center functions across the company. We continue to assess our branding strategy and improve our ecommerce and merchandising strategies. All of these initiatives have required and will continue to require investment. Small Business Services revenue increased in 2007, as compared to 2006, excluding the impact of the sale of our industrial packaging product line in January 2007. We can provide no assurance that our growth strategies will continue to be successful in the long-term and result in a positive return on our investment.
Our ability to reduce costs is critical to our success.
We intend to continue to reduce expenses, primarily within our shared services functions. We also expect to
continue to simplify our business processes and reduce our cost and expense structure. These initiatives have required and will continue to require up-front expenditures related to items such as redesigning and streamlining processes, consolidating information technology platforms, standardizing technology applications and improving real estate utilization. We can provide no assurance that we will achieve our anticipated cost reductions or that we will do so without incurring unexpected or greater than anticipated expenditures. Moreover, we may find that we are unable to achieve our business simplification and cost reduction goals without disruption to our business and as a result, we may choose to delay or forego certain cost reductions as business conditions require.
Consolidation among financial institutions has, and may continue to, adversely affect the pricing of our products
and may result in the loss of clients.
The number of financial institutions has declined due to consolidation in the financial services industry. Margin
pressures arise from such consolidation as merged entities seek to reduce costs by leveraging economies of scale, including their check supply contracts. The increase in general negotiating leverage possessed by such consolidated entities has resulted in contracts which are not as favorable to us as those historically negotiated with these clients, and in some cases, has resulted in the loss of clients to competitors. Although we devote considerable effort toward the development of a competitively-priced, high-quality suite of products and services for the financial services industry, there can be no assurance that significant financial institution clients will be retained or that the loss of a significant client can be offset through the addition of new clients or by expanded sales to our remaining clients.
Continuing softness in direct mail response rates could have a further adverse impact on our operating results.
Our Direct Checks segment and portions of our Small Business Services segment have experienced declines in
response and retention rates related to direct mail promotional materials. We believe that media response rates are declining across a wide variety of products and services. Additionally, we believe that our declines are attributable to the general decline in check usage and the gradual obsolescence of standardized forms products. To offset these impacts, we continue to modify our marketing and sales efforts. We may not succeed in offsetting the decline in response rates, even with additional marketing and sales efforts.
The profitability of our Direct Checks segment depends in large part on our ability to secure adequate advertising
media placements at acceptable rates, as well as the consumer response rates generated by such advertising. We can provide no assurance regarding the future cost, effectiveness and/or availability of suitable advertising media. Consumers may not continue to respond to such advertising at the same rates, and competitive pressure may inhibit our ability to reflect increased costs in the prices of our products. We may not be able to sustain our current levels of profitability in this situation.
Small Business Services’ standardized business forms and related products face technological obsolescence and
changing customer preferences.
Continual technological improvements have provided small business customers with alternative means to enact and record business transactions. For example, because of the lower price and higher performance capabilities of

15
personal computers and related printers, small businesses now have an alternate means to print many business forms. Additionally, electronic transaction systems and off-the-shelf business software applications have been designed to automate many of the functions performed by business forms products. If small business preferences change rapidly and we are unable to develop new products and services with comparable profit margins, our results of operations could be adversely affected.
We face uncertainty with respect to recent and future acquisitions.
We acquired the Johnson Group in October 2006 and All Trade Computer Forms, Inc. in February 2007 with the intent to expand our business with custom, full-color, digital and web-to-print capabilities. The integration of any acquisition involves numerous risks, including: difficulties in assimilating operations and products; diversion of management’s attention from other business concerns; potential loss of key employees; potential exposure to unknown liabilities; and possible loss of our clients and customers or the clients and customers of the acquired businesses. One or more of these factors could impact our ability to successfully integrate an acquisition and could negatively affect our results of operations.
With regards to future acquisitions, we cannot predict whether suitable acquisition candidates can be acquired on
acceptable terms or whether any acquired products, technologies or businesses will contribute to our revenue or earnings to any material extent. Significant acquisitions typically result in additional contingent liabilities or debt and/or additional amortization expense related to acquired intangible assets, and thus, could adversely affect our business, results of operations and financial condition.
The cost and availability of materials, delivery services and energy could adversely affect our operating results.
We are subject to risks associated with the cost and availability of paper, plastics, ink, other raw materials, delivery services and energy. Postal rates increased in 2007 and fuel costs have continued to increase over the past several years. Competitive pressures and/or contractual arrangements inhibit our ability to reflect increased costs in the prices of our products.
Paper costs represent a significant portion of our materials cost. Historically, we have not been negatively impacted by paper shortages because of our relationships with various paper suppliers. However, we can provide no assurance that we will be able to purchase sufficient quantities of paper if such a shortage were to occur. Additionally, we depend upon third party providers for delivery services. Events resulting in the inability of these service providers to perform their obligations, such as extended labor strikes, could adversely impact our results of operations by requiring us to secure alternate providers at higher costs.
Forecasts involving future results reflect various assumptions that may prove to be incorrect.
From time to time, we make predictions or forecasts regarding our future results, including, but not limited to,
forecasts regarding estimated revenue, earnings, earnings per share or operating cash flow. Any forecast regarding our future performance reflects various assumptions which are subject to significant uncertainties, and, as a matter of course, may prove to be incorrect. Further, the achievement of any forecast depends on numerous factors which are beyond our control. As a result, we cannot assure you that our performance will be consistent with any management forecasts or that the variation from such forecasts will not be material and adverse. You are cautioned not to base your entire analysis of our business and prospects upon isolated predictions, and are encouraged to use the entire mix of historical and forward-looking information made available by us, and other information affecting us and our products and services, including the factors discussed here.
In addition, independent analysts periodically publish reports regarding our projected future performance. The
methodologies we employ in arriving at our own internal projections and the approaches taken by independent analysts in making their estimates are likely different in many significant respects. We expressly disclaim any responsibility to advise analysts or the public markets of our views regarding the accuracy of the published estimates of independent analysts. If you are relying on these estimates, you should pursue your own investigation and analysis of their accuracy and the reasonableness of the assumptions on which they are based.

16
General economic conditions within the United States could have an adverse effect on our operating results.
The rate of small business formations, small business confidence, consumer spending and employment levels, as well as higher fuel costs, all have an impact on our businesses. We estimate that lower than average small business optimism and a decline in small business formations negatively impacted our results of operations in Small Business Services in the latter half of 2007, and we expect this trend to continue into the first half of 2008. Although consumer spending and employment levels both trended negatively during the last half of 2007, we did not experience a significant negative impact in our personal check businesses. A prolonged downturn in general economic conditions could result in additional declines in our revenue and profitability. In addition, the recent turmoil in the financial services industry related to subprime lending activities may cause financial institutions to seek additional concessions from their vendors.
Security breaches involving customer data, or the perception that e-commerce is not secure, could adversely
affect our reputation and business.
We rely on various security procedures and systems to ensure the secure storage and transmission of data.
Computer networks and the internet are, by nature, vulnerable to unauthorized access. We cannot provide assurance that misuse of new technologies or advances in criminal capabilities will not compromise or breach our security procedures and systems resulting in unauthorized access and/or use of customer data, including consumers’ nonpublic personal information. A security breach could damage our reputation, deter clients and consumers from ordering our products and result in claims against us. If we are unsuccessful in defending a lawsuit regarding security breaches, we may be forced to pay damages which could have an adverse effect on our operating results. Additionally, general publicity regarding security breaches at other companies could lead to the perception among the general public that e-commerce is not secure. This could decrease traffic to our websites and foreclose future business opportunities.
We may be unable to protect our rights in intellectual property.
We rely on a combination of trademark and copyright laws, trade secret and patent protection, and confidentiality
and license agreements to protect our trademarks, software and other intellectual property. Despite our efforts to protect our intellectual property, third parties may infringe or misappropriate our intellectual property or otherwise independently develop substantially equivalent products and services which do not infringe on our intellectual property rights. We may be required to spend significant resources to protect our trade secrets and monitor and police our intellectual property rights. The loss of intellectual property protection or the inability to secure or enforce intellectual property protection could harm our business and ability to compete. In addition, check designs exclusively licensed from third parties account for a portion of our revenue. These license agreements generally average three years in duration. There can be no guarantee that such licenses will be available to us indefinitely or at terms under which we can continue to generate a profit from the sale of licensed products.
We are dependent upon third party providers for certain significant information technology needs.
We have entered into agreements with third party providers for information technology services, including
telecommunications and network server services. In the event that one or more of these providers is not able to provide adequate or timely information technology services, we could be adversely affected. Although we believe that information technology services are available from numerous sources, a failure to perform by one or more of our service providers could cause a disruption in our business while we obtain an alternative source of supply. In addition, the use of substitute third party providers could result in increased expense.
Legislation relating to consumer privacy protection could limit or harm our business.
We are subject to regulations implementing the privacy and information security requirements of the federal
financial modernization law known as the Gramm-Leach-Bliley Act and other federal regulation and state law on the same subject. These laws and regulations require us to develop, implement and maintain policies and procedures to protect the security and confidentiality of consumers’ nonpublic personal information and to disclose these policies to consumers before a customer relationship is established and annually thereafter. These regulations could have the effect of limiting business initiatives.

17
We are unable to predict whether more restrictive legislation or regulation will be adopted in the future. Any future legislation or regulation, or the interpretation of existing legislation or regulation, could have a negative impact on our business, results of operations or prospects. Laws and regulations may be adopted in the future with respect to the internet, e-commerce or marketing practices generally relating to consumer privacy. Such laws or regulations may impede the growth of the internet and/or use of other sales or marketing vehicles. For example, new privacy laws could decrease traffic to our websites, decrease telemarketing opportunities and increase the cost of obtaining new customers.
If we are unable to attract and retain key personnel and other qualified employees, our business could suffer.
Our success at efforts to grow our business and reduce costs depends on the contributions and abilities of key executives, operating officers and other personnel. If we are unable to retain our existing employees and attract qualified personnel, we may not be able to manage our business effectively. Competition for employees in fields such as information technology, finance, sales, product management and customer service is intense, and we can provide no assurance that we will be successful in attracting and retaining such personnel.
We may be subject to sales and other taxes which could have an adverse effect on our business.
In accordance with current federal, state and local tax laws, we currently collect sales, use or other similar taxes
in state and local jurisdictions where our businesses have a physical presence. One or more state or local jurisdiction may seek to impose sales tax collection obligations on out-of-state companies which engage in remote or online commerce. Further, tax law and the interpretation of constitutional limitations thereon are subject to change. In addition, any new operations in states where we do not currently have a physical presence could subject shipments of goods by our direct-to-consumer businesses into such states to sales tax under current or future laws. If one or more state or local jurisdiction successfully asserts that we must collect sales or other taxes beyond our current practices, it could have a material, adverse affect on our business.
We may be subject to environmental risks.
Our printing facilities are subject to many federal and state regulations designed to protect the environment. We
have sold former printing facilities to third parties and in some instances, have agreed to indemnify the buyer of the facility for certain environmental liabilities. We believe that, based on current information, we will not be required to incur additional material, uninsured expense with respect to our sites, but unforeseen conditions could result in additional liability and expense.
Item 1B. Unresolved Staff Comments.
None.
Item 2. Properties.
Our principal executive office is an owned property located in Shoreview, Minnesota. Aside from small sales
offices, we occupy 33 facilities throughout the United States and three facilities in Canada where we conduct printing and fulfillment, call center and administrative functions. These facilities are either owned or leased and have a combined floor space of approximately 2.9 million square feet. We believe that our properties are sufficiently maintained and are adequate and suitable for our business needs as presently conducted.
Item 3. Legal Proceedings.
We are involved in routine litigation incidental to our business, but there are no material pending legal
proceedings to which we are a party or to which any of our property is subject.

18
Item 4. Submission of Matters to a Vote of Security Holders.
None.
PART II Item 5. Market for Registrant's Common Equity, Related Stockholder Matters and Issuer Purchases of
Equity Securities.
Our common stock is traded on the New York Stock Exchange under the symbol DLX. Dividends are declared by our board of directors on a current basis and therefore, may be subject to change in the future, although we currently have no plans to change our $0.25 per share quarterly dividend amount. As of December 31, 2007, the number of shareholders of record was 8,020. The table below shows the per share closing price ranges of our common stock for the past two fiscal years as quoted on the New York Stock Exchange, as well as the quarterly dividend amount for each period.
Stock price
Dividend High Low Close
2007
Quarter 4................................$ 0.25 $ 40.86 $ 28.93 $ 32.89
Quarter 3................................ 0.25 42.49 28.56 36.84
Quarter 2................................ 0.25 44.95 33.38 40.61
Quarter 1................................ 0.25 33.95 25.13 33.53
2006
Quarter 4................................$ 0.25 $ 25.77 $ 17.00 $ 25.20
Quarter 3................................ 0.25 18.15 12.98 17.10
Quarter 2................................ 0.40 26.65 17.48 17.48
Quarter 1................................ 0.40 31.56 23.35 26.17
The following table shows purchases of our own equity securities, based on trade date, which we completed during the fourth quarter of 2007.
Issuer Purchases of Equity Securities
Period
Total number of shares (or units)
purchased
Average price paid per share
(or unit)
Total number of shares (or units)
purchased as part of publicly
announced plans or programs
Maximum number (or
approximate dollar value) of shares (or units) that may yet be
purchased under the plans or programs
October 1, 2007 – October 31, 2007
—
$ —
—
7,797,200
November 1, 2007 – November 30, 2007
200,000
32.52
200,000
7,597,200
December 1, 2007 – December 31, 2007
59,000
29.92
59,000
7,538,200
Total 259,000 $31.92 259,000 7,538,200
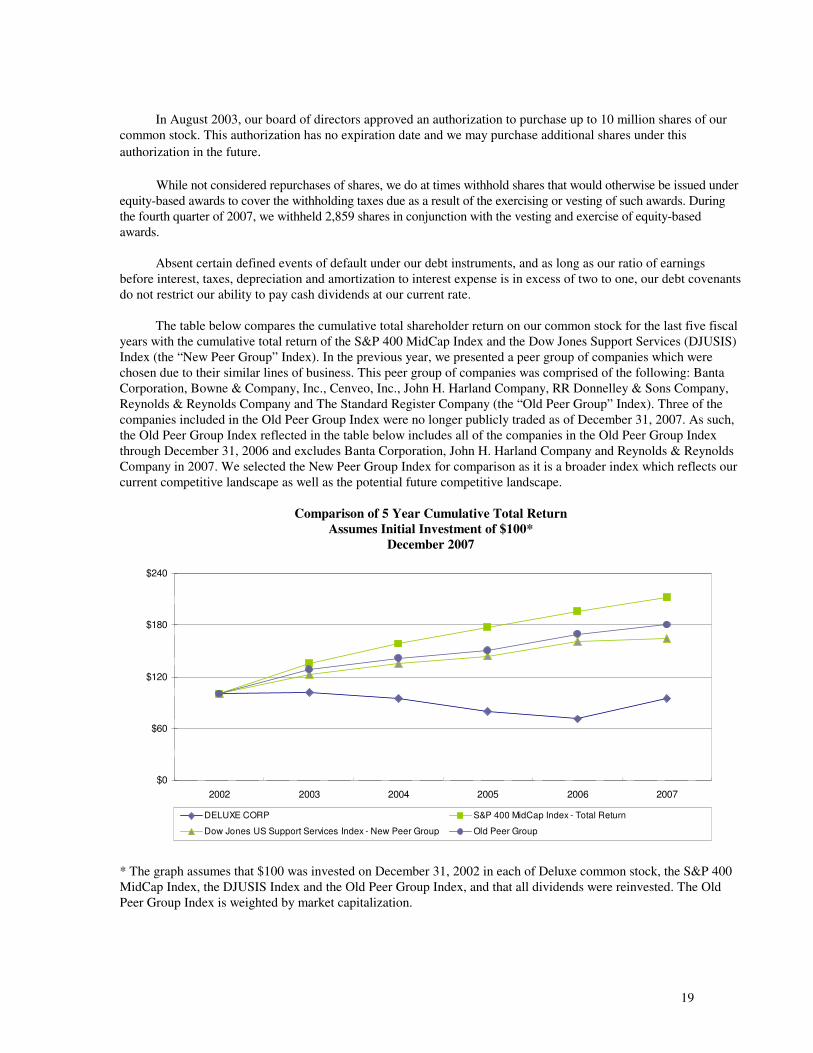
19
In August 2003, our board of directors approved an authorization to purchase up to 10 million shares of our
common stock. This authorization has no expiration date and we may purchase additional shares under this
authorization in the future. While not considered repurchases of shares, we do at times withhold shares that would otherwise be issued under
equity-based awards to cover the withholding taxes due as a result of the exercising or vesting of such awards. During the fourth quarter of 2007, we withheld 2,859 shares in conjunction with the vesting and exercise of equity-based awards.
Absent certain defined events of default under our debt instruments, and as long as our ratio of earnings
before interest, taxes, depreciation and amortization to interest expense is in excess of two to one, our debt covenants do not restrict our ability to pay cash dividends at our current rate.
The table below compares the cumulative total shareholder return on our common stock for the last five fiscal
years with the cumulative total return of the S&P 400 MidCap Index and the Dow Jones Support Services (DJUSIS) Index (the “New Peer Group” Index). In the previous year, we presented a peer group of companies which were chosen due to their similar lines of business. This peer group of companies was comprised of the following: Banta Corporation, Bowne & Company, Inc., Cenveo, Inc., John H. Harland Company, RR Donnelley & Sons Company, Reynolds & Reynolds Company and The Standard Register Company (the “Old Peer Group” Index). Three of the companies included in the Old Peer Group Index were no longer publicly traded as of December 31, 2007. As such, the Old Peer Group Index reflected in the table below includes all of the companies in the Old Peer Group Index through December 31, 2006 and excludes Banta Corporation, John H. Harland Company and Reynolds & Reynolds Company in 2007. We selected the New Peer Group Index for comparison as it is a broader index which reflects our current competitive landscape as well as the potential future competitive landscape.
Comparison of 5 Year Cumulative Total Return Assumes Initial Investment of $100*
December 2007
$0
$60
$120
$180
$240
2002 2003 2004 2005 2006 2007
DELUXE CORP S&P 400 MidCap Index - Total Return
Dow Jones US Support Services Index - New Peer Group Old Peer Group
* The graph assumes that $100 was invested on December 31, 2002 in each of Deluxe common stock, the S&P 400 MidCap Index, the DJUSIS Index and the Old Peer Group Index, and that all dividends were reinvested. The Old Peer Group Index is weighted by market capitalization.

20
Item 6. Selected Financial Data.
The following table shows certain selected financial data for the five years ended December 31, 2007. This information should be read in conjunction with Management’s Discussion and Analysis of Financial Condition and Results of Operation appearing in Item 7 of this report and our consolidated financial statements appearing in Item 8 of this report.
(dollars and orders in thousands, except per share and per order amounts)
2007
2006
2005
2004
2003
Statement of Income Data: Revenue(1) ................................................................$ 1,606,367 $ 1,639,654 $ 1,716,294 $ 1,567,015 $ 1,242,141 As a percentage of revenue: Gross profit ................................................................ 63.5% 62.6% 64.6% 65.8% 65.7% Selling, general and administrative expense ................... 47.1% 48.1% 46.8% 43.6% 40.0% Operating income(2) ........................................................ 16.7% 12.1% 17.8% 22.2% 25.7% Operating income(2) ..............................................................$ 267,545 $ 198,299 $ 304,839 $ 347,912 $ 318,921 Income from continuing operations(2)................................ 143,515 100,558 157,963 198,648 192,472 Per share – basic ............................................................. 2.79 1.97 3.12 3.96 3.53 Per share – diluted .......................................................... 2.76 1.95 3.10 3.93 3.49 Cash dividends per share ...................................................... 1.00 1.30 1.60 1.48 1.48
Balance Sheet Data: Cash and marketable securities................................ 21,615 11,599 6,867 15,492 2,968 Return on average assets....................................................... 11.6% 7.5% 10.8% 19.2% 31.2% Total assets ................................................................$ 1,210,755 $ 1,267,132 $ 1,425,875 $ 1,499,079 $ 562,960 Long-term obligations(3) ....................................................... 776,840 903,121 954,164 980,207 381,694 Total debt ................................................................ 844,040 1,015,781 1,166,510 1,244,207 594,944
Statement of Cash Flows Data: Net cash provided by operating activities of continuing operations ........................................................ 244,716 239,341 178,279 307,591 181,467 Net cash used by investing activities of continuing operations ........................................................ (10,971 ) (33,174 ) (55,917 ) (670,837 ) (24,883 ) Net cash (used) provided by financing activities of continuing operations .................................................... (224,890 ) (204,587 ) (142,816 ) 369,963 (278,471 ) Purchases of capital assets .................................................... (32,328 ) (41,324 ) (55,653 ) (43,817 ) (22,034 ) Payments for acquisitions, net of cash acquired ................... (2,316 ) (16,521 ) (2,888 ) (624,859 ) — Payments for common shares repurchased ........................... (11,288 ) — — (26,637 ) (507,126 )
Other Data (continuing operations): Orders(4) ................................................................................ 64,856 64,783 65,189 76,276 77,347 Revenue per order................................................................$ 24.77 $ 25.31 $ 26.33 $ 20.54 $ 16.06 Number of employees........................................................... 7,991 8,813 8,720 8,957 5,805 Number of printing/fulfillment facilities............................... 23 24 21 20 14 Number of call center facilities................................ 14 17 18 18 7
(1) Our results of operations for the years ended December 31, 2007, 2006, 2005 and 2004 were impacted by the acquisition of New England Business Service, Inc. (NEBS) on June 25, 2004. NEBS contributed revenue of $671.2 million in 2005 and $363.2 million in 2004. We are not able to quantify NEBS revenue for 2007 or 2006 or its contribution to operating income because of its integration with our other businesses.
(2) Our results of operations for the years ended December 31, 2007, 2006, 2005 and 2004 were impacted by the adoption of the fair value method of
accounting for share-based compensation outlined in Statement of Financial Accounting Standards (SFAS) No. 123(R), Share-Based Payment, for 2007 and 2006 and SFAS No. 123, Accounting for Stock-Based Compensation, for 2005 and 2004. During 2003, we recorded expense for our restricted stock and restricted stock unit awards and our employee stock purchase plan in accordance with Accounting Principles Board Opinion No. 25, Accounting for
Stock Issued to Employees. Expense recognized for share-based compensation in each year was as follows: 2007 - $13,533; 2006 - $6,191; 2005 - $7,003; 2004 - $12,248; 2003 - $954.
(3) Long-term obligations include both the current and long-term portions of our long-term debt obligations, including capital leases.
(4) Orders is our company-wide measure of volume. When portions of a customer order are on back-order, one customer order may be fulfilled via multiple
shipments. Generally, an order is counted when the last item ordered is shipped to the customer.

21
Item 7. Management's Discussion and Analysis of Financial Condition and Results of Operation. EXECUTIVE OVERVIEW
Our business is organized into three segments: Small Business Services, Financial Services and Direct Checks. Our Small Business Services segment generated 58.4% of our consolidated revenue for 2007. This segment sells business checks, printed forms, promotional products, marketing materials and related services and products to more than six million small businesses and home offices through financial institution referrals, direct response marketing, sales representatives, independent distributors and the internet. Of the more than six million customers we have served in the past five years, four million have ordered our products or services in the last 24 months. Our Financial Services segment generated 28.5% of our consolidated revenue for 2007. This segment sells personal and business checks, check-related products and services, stored value gift cards and customer loyalty, retention and fraud monitoring/protection services to approximately 7,000 financial institution clients nationwide, including banks, credit unions and financial services companies. Our Direct Checks segment generated 13.1% of our consolidated revenue for 2007. This segment is the nation’s leading direct-to-consumer check supplier, selling under the Checks Unlimited®, Designer® Checks and Checks.com brand names. Through these brands, we sell personal and business checks and related products and services directly to consumers using direct response marketing and the internet. We operate primarily in the United States. Small Business Services also has operations in Canada.
Our net income for 2007, as compared to 2006, benefited from the following:
• Various cost reductions from previously announced management initiatives to reduce our cost structure, primarily within information technology, sales and marketing, and manufacturing;
• Lower amortization expense and project costs related to a software project written-off in the second quarter of 2006;
• Additional revenue in Direct Checks from selling additional premium features and services, as well as a weather-related backlog from the last week of December 2006;
• Lower net restructuring charges in 2007, as compared to 2006;
• Lower amortization of acquisition-related intangible assets within Small Business Services, as certain of the assets are amortized using accelerated methods; and
• An increase in order volume for Financial Services, as compared to 2006, due to net client gains and financial institution conversion activity.
These benefits were partially offset by the following:
• Higher performance-based employee compensation;
• Lower order volume for our Direct Checks segment; and
• Lower revenue per order for our Financial Services segment.
Further, our results for 2006 included a non-cash, pre-tax asset impairment loss of $44.7 million, an $11.0 million pre-tax gain on the termination of an underperforming outsourced payroll services contract and a $4.6 million net pre-tax gain on facility sales.
In May 2007, we issued $200.0 million of 7.375% senior, unsecured notes maturing on June 1, 2015.
Proceeds from the offering, net of offering costs, were $196.3 million. These proceeds were used to repay amounts drawn on our credit facility and to invest in marketable securities. On October 1, 2007, we used proceeds from liquidating all of our marketable securities and certain cash equivalents, together with a $120.0 million advance on our credit facilities, primarily to repay $325.0 million of 3.5% unsecured notes, plus accrued interest. Further information regarding our debt can be found under the caption “Note 13: Debt” of the Notes to Consolidated Financial Statements appearing in Item 8 of this report.

22
Our Strategies Small Business Services – Our focus within Small Business Services is to grow revenue and increase
operating margin by continuing to implement the following strategies:
• Acquire new customers by leveraging customer referrals that we receive from our financial institution clients and from other marketing initiatives such as direct mail and e-commerce;
• Increase our share of the amount small businesses spend on the products and services in our portfolio;
• Consolidate brands and leverage cross-selling opportunities; and
• Continue to optimize our cost and expense structure. We are investing in several key enablers to achieve our strategies. These key enablers include improving our
e-commerce capabilities, implementing an integrated platform for our various brands, improving our customer analytics and focusing on key vertical segments and improved merchandising. As we focus on these key enablers, we plan to streamline and update our brand structure, as well as transition our sales model to integrate field sales, marketing and customer call centers across the company. We believe this creates more focus on customers, positions us for growth and ensures we are leveraging processes, facilities and resources to our best advantage. We have also introduced a new www.Deluxe.com website which will serve as a platform for improved e-commerce capability, and we have identified significant opportunities to expand sales to our existing customers.
Additionally, the small business customer referrals we receive from our Deluxe Business AdvantageSM
program, which provides a fast and simple way for financial institutions to offer expanded personalized service to small businesses, will continue to be an important part of our growth strategy. With the acquisition of the Johnson Group in October 2006 and All Trade Computer Forms, Inc. in January 2007, we have acquired companies which allow us to expand our business in the custom, full color, digital and web-to-print space with our small business customers. Further information regarding these acquisitions can be found under the caption “Note 4: Acquisitions and disposition” of the Notes to Consolidated Financial Statements appearing in Item 8 of this report. We divested a non-strategic product line in January 2007 when we completed the sale of our industrial packaging product line for $19.2 million, realizing a pre-tax gain of $3.8 million. This business generated revenue of approximately $51 million in 2006. This sale did not have a significant impact on earnings or operating cash flow.
Recently, we introduced the Deluxe Marketing Store to offer fast, hassle-free solutions for small businesses.
The Deluxe Marketing Store is a website that offers products and services to help small businesses reach their customers, build customer loyalty and promote their business. Small businesses can design and create logos, websites, mailings and other promotional items. The Deluxe Marketing Store is also a resource for small businesses as it contains useful information for growing and managing a small business.
Financial Services – Our strategies within Financial Services are as follows:
• Continue to retain core check revenue streams and acquire new customers;
• Provide services and products that differentiate us from the competition and make us a more relevant business partner to our financial institution clients; and
• Continue to simplify our business model and optimize our cost and expense structure.
To achieve our strategies we are leveraging our customer acquisition and loyalty programs, our Deluxe Business Advantage program and enhanced small business customer service. The Deluxe Business Advantage
program is designed to maximize financial institution business check programs by offering expanded personalized service to small businesses with a number of service level options.
In our efforts to expand beyond check-related products, we have introduced and continue to pilot several new
services that focus on customer loyalty and retention. Two examples are the Welcome HomeSM Tool Kit and the Deluxe ImpressionsSM products which enable financial institutions to forge strong bonds with new customers, thereby increasing customer loyalty and retention. We also offer Deluxe ID TheftBlock®, a set of fraud monitoring and recovery services that provides assistance to consumers in detecting and recovering from identity theft. We also

23
enhanced our stored value gift card program and launched DeluxeCallingSM, a service providing a first point of contact with new indirect loan consumers on behalf of our financial institution clients. This service leverages our core competency of call center expertise and provides incremental revenue and increased customer retention for our financial institution clients. Providing products and services that differentiate us from the competition is expected to help offset the decline in check usage and the pricing pressures we are experiencing in our check programs. As such, we are also focused on accelerating the pace at which we introduce new products and services. In addition to these value-added services, we continue to offer our Knowledge ExchangeTM Series, a suite of resources and events for our financial institution clients focused on the customer experience.
In addition to our initiatives to retain customers and introduce new products and services, we continue our
efforts to simplify processes, eliminate complexity in this business and lower our cost structure. Our efforts are focused on using lean principles to streamline call center and check fulfillment activities, redesign services into standardized flexible models, eliminate multiple systems and work streams and strengthen our ability to quickly develop and bring new products and services to market.
Direct Checks – Our focus within Direct Checks is to enhance our share of the direct-to-consumer channel by
continuing to implement the following strategies:
• Maintain our 2007 level of marketing spend, which was increased from previous years;
• Maximize the lifetime value of customers by selling new features and accessories; and
• Continue to optimize our cost and expense structure. Beginning in 2007, we increased our advertising circulation of free-standing inserts under a new direct mail
advertising contract which will remain in effect for the next several years. This has been an effective form of new customer acquisition in this channel. We also intend to increase the portion of our advertising expense designated for customer retention by utilizing reactivation and email campaigns. We continue to develop improved call center processes, provide additional products to Direct Checks’ small business customers and explore other avenues to increase sales to existing customers. In late 2006, we introduced the EZShieldTM product, a fraud protection service that provides reimbursement to consumers for forged signatures or endorsements and altered checks. We have also introduced holiday greeting cards and stored value gift cards on our websites.
Cost Reduction Initiatives
We are pursuing aggressive cost reduction and business simplification initiatives, including: reducing shared
services infrastructure costs; streamlining our call center and check fulfillment activities; eliminating system and work stream redundancies; and strengthening our ability to quickly develop new products and services and bring them to market. We believe significant cost reduction opportunities exist in the reduction of stock keeping units (SKUs), the standardization of products and services and improvements in sourcing third-party goods and services. These opportunities collectively are expected to reduce our annual cost structure by at least $225 million, net of required investments, by the end of 2009. The baseline for these anticipated savings is the annual diluted earnings per share guidance for 2006 of $1.41 to $1.51, which we provided in our press release on July 27, 2006 regarding second quarter 2006 results. We expect all three of our business segments to benefit from cost reductions. We estimate that approximately 30-35% of the $225 million target will come from our shared services infrastructure organizations. We expect information technology will provide the greatest percentage of these savings through lowering data center costs, improving mainframe and server utilization and reducing the cost of networking and voice communications. We estimate that approximately 40-45% of the $225 million target will come from fulfillment, including manufacturing and supply chain, and we estimate that approximately 20-25% of the $225 million target will come from reorganizing our sales and marketing functions. Overall, approximately one-third of the savings are expected to affect cost of goods sold, with the remaining two-thirds impacting selling, general and administrative (SG&A) expense.
Through December 31, 2007, we estimate that we have realized approximately $105 million of our $225
million target. We anticipate that we will realize an additional $70 million of the $225 million target in 2008 and the remaining $50 million in 2009.

24
Business Challenges
The market for our two largest products, checks and business forms, is very competitive. These products are
mature and their use has been declining. According to our estimates, the total number of checks written in the United States has been in decline as a result of alternative payment methods, including credit cards, debit cards, automated teller machines and electronic payment systems. According to a Federal Reserve study released in December 2007, approximately 33 billion checks are written annually. This includes checks which are converted to automated clearing house (ACH) payments. The check remains the largest single non-cash payment method in the United States, accounting for approximately 35% of all non-cash payment transactions. This is a reduction from the Federal Reserve study released in December 2004 when checks accounted for approximately 45% of all non-cash payment transactions. The Federal Reserve estimates that checks written declined approximately four percent per year between 2003 and 2006. According to our estimates, the use of business checks is declining at a rate of two to four percent per year. The total transaction volume of all electronic payment methods exceeds check payments, and we expect this trend to continue. In addition to the decline in check usage, the use of business forms is also under pressure. Continual technological improvements have provided small business customers with alternative means to enact and record business transactions. For example, off-the-shelf business software applications and electronic transaction systems have been designed to automate several of the functions performed by business forms products.
Because check usage is declining and financial institutions are consolidating, we have been encountering
significant pricing pressure when negotiating contracts with our financial institution clients. Our traditional financial institution relationships are typically formalized through supply contracts averaging three to five years in duration. As we compete to retain and acquire new financial institution business, the resulting pricing pressure, combined with declining check usage in the marketplace, has reduced our revenue and profit margins. We expect this trend to continue.
Direct Checks and portions of Small Business Services have been impacted by reduced consumer response
rates to direct mail advertisements. Our own experience indicates that direct-to-consumer media response rates are declining across a wide variety of products and services. Additionally, our consumer response rates are declining further due to the decline in check usage and the gradual obsolescence of standardized forms products.
We estimate that general economic conditions negatively impacted our 2007 results of operations in the latter half
of the year, primarily in Small Business Services. The rate of small business formations and small business confidence impact Small Business Services. The index of small business optimism published by the National Federation of Independent Business (NFIB) in December 2007 continued to be below average. According to estimates of the Small Business Administration’s Office of Advocacy, new small business formations were down slightly in 2006 as compared to 2005, the most recent date for which information is available. Consumer spending and employment levels may also have some impact on our personal check businesses. Although both trended negatively during the last half of 2007, we did not experience a significant negative impact in our personal check businesses. We expect that general economic conditions will have some negative impact on our 2008 results of operations, primarily in Small Business Services in the first half of the year. A prolonged downturn in general economic conditions could result in additional declines in our revenue and profitability.
Outlook for 2008
We anticipate that consolidated revenue will be between $1.56 billion and $1.61 billion for 2008, as compared to
$1.61 billion for 2007. Despite the decline in check usage and economic uncertainty, we expect to deliver near flat revenue performance in 2008 as compared to 2007. We anticipate that growth in Small Business Services will be in the very low single digits, while declines in Financial Services will be in the low to mid single digits and declines in Direct Checks will be in the high single digits. We expect that revenue from our expansion initiatives will grow modestly during the latter half of the year.
We expect that 2008 diluted earnings per share will be between $3.00 and $3.20, compared to $2.76 for 2007.
We expect that operating income will increase from 2007 due to our cost reduction initiatives, partially offset by the impact of revenue declines in our personal check businesses, continued investments in new products and enablers, such

25
as e-commerce, and other cost increases. We estimate that our effective tax rate for 2008 will be approximately 35%, compared to 34.1% for 2007.
We anticipate that operating cash flow will be between $230 million and $250 million in 2008, compared to $245
million in 2007. We expect that increased earnings and working capital improvements throughout the year will be offset by higher payments for employee performance-based compensation in the first quarter. We estimate that capital spending will be approximately $30 million in 2008, with investment focused on cost reduction and key enablers such as e-commerce. Our priorities for the use of cash include paying down our credit facility in 2008 and investing both organically and in acquisitions to augment growth. We will also consider other opportunities to enhance shareholder value, including modest share repurchase opportunities and evaluating our dividend policy.
CONSOLIDATED RESULTS OF OPERATIONS
Consolidated Revenue
Change
(in thousands, except per order amounts)
2007
2006
2005
2007 vs. 2006
2006 vs. 2005
Revenue ................................................................$ 1,606,367 $ 1,639,654 $ 1,716,294 (2.0%) (4.5%)
Orders ................................................................ 64,856 64,783 65,189 0.1% (0.6%)
Revenue per order........................................................$ 24.77 $ 25.31 $ 26.33 (2.1%) (3.9%)
The decrease in revenue for 2007, as compared to 2006, was primarily due to a $48 million decrease resulting
from the sale of our industrial packaging product line in January 2007, as well as a decline in volume for our Direct Checks segment and lower revenue per order due to lower pricing in our Financial Services segment. Lower volume for Direct Checks was primarily due to the overall decline in check usage, as well as lower customer retention and lower direct mail consumer response rates. Small Business Services also experienced a slight revenue decrease in the last half of the year related to general economic conditions. Partially offsetting these decreases were revenues generated by the Johnson Group, which we acquired in the fourth quarter of 2006, and higher revenue per order for Direct Checks due to the introduction of new products and services, including the EZShield product discussed earlier under Executive Overview. Additionally, Financial Services volume increased due to client gains and financial institution conversion activity, and revenue in Canada increased due to a favorable exchange rate and increased check orders triggered by a new check format mandated by the Canadian Payments Association that drove higher volume in the first half of 2007.
The number of orders increased slightly for 2007, as compared to 2006, as the Financial Services volume
increase of 1.4% exceeded the negative impacts of Direct Checks’ volume decline, the sale of Small Business Services’ industrial packaging product line and the negative economic impact experienced by Small Business Services in the last half of the year. Revenue per order decreased for 2007, as compared to 2006, as lower prices in Financial Services more than offset the impact of increases in revenue per order for Direct Checks and Small Business Services.
The decrease in revenue for 2006, as compared to 2005, was due to lower prices and a change in product mix
in our Financial Services segment resulting in significantly lower revenue per order, as well as a decline in volume for our Direct Checks segment. Revenue for 2005 also benefited from $11.7 million of contract termination payments in the second quarter. Lower volume for Direct Checks was due to the overall decline in check usage, as well as lower customer retention, lower direct mail consumer response rates and lower advertising expenditures in prior periods. Partially offsetting these decreases was increased revenue for Small Business Services due to higher revenue per order and an increase in first-time buyers as we implemented our growth strategies. Additionally, Direct Checks revenue per order increased, as did Financial Services order volume. Revenue per order increased for Direct Checks due to the introduction of the EZShield product discussed earlier, as well as a decline in orders received through our mail channel, which typically result in lower revenue per order. Financial Services volume increased as the impact of net client gains exceeded the impact of the decline in check usage.

26
The number of orders decreased for 2006, as compared to 2005, as the negative impact of the Direct Checks
volume decline exceeded the volume increases for Financial Services and Small Business Services. Revenue per order decreased for 2006, as compared to 2005, as lower prices and a change in product mix in Financial Services more than offset the impact of the increases in revenue per order for Small Business Services and Direct Checks.
Supplemental information regarding revenue by product is as follows:
Change
(in thousands)
2007 2006
2005
2007 vs. 2006
2006 vs. 2005
Checks and related services ................................$ 1,045,008 $ 1,041,523 $ 1,110,695 0.3% (6.2%)
Other printed products, including forms...................... 380,632 375,025 377,756 1.5% (0.7%)
Accessories and promotional products ........................ 129,169 134,618 144,693 (4.0%) (7.0%)
Packaging supplies and other................................ 51,558 88,488 83,150 (41.7%) 6.4%
Total revenue...........................................................$ 1,606,367 $ 1,639,654 $ 1,716,294 (2.0%) (4.5%)
The percentage of total revenue derived from the sale of checks and related services was 65.1% in 2007, as
compared to 63.5% in 2006 and 64.7% in 2005. Small Business Services contributed non-check revenue of $480.0 million in 2007, $523.1 million in 2006 and $514.6 million in 2005, from the sale of forms, envelopes, holiday cards, labels, business cards, stationery and other promotional products. The decrease in Small Business Services non-check revenue for 2007, as compared to 2006, was primarily due to the sale of our industrial packaging product line in January 2007.
Consolidated Gross Margin
Change
(in thousands)
2007 2006
2005
2007 vs. 2006
2006 vs. 2005
Gross profit................................................................$ 1,019,806 $ 1,026,375 $ 1,107,933 (0.6%) (7.4%)
Gross margin ............................................................... 63.5% 62.6% 64.6% 0.9 pt. (2.0) pt. Gross margin increased for 2007, as compared to 2006, due to manufacturing efficiencies, including the
closing of two Small Business Services manufacturing facilities in mid-2006, as well as lower material costs in 2007 related to a higher mix of check products in Small Business Services. Additionally, we benefited from increased Financial Services order volume in 2007. Partially offsetting these gross margin increases was the lower Financial Services revenue per order discussed earlier, a postal rate increase in 2007 and costs associated with the implementation of new check packaging intended to mitigate the effects of the postal rate increase.
Gross margin decreased for 2006, as compared to 2005, primarily due to lower prices and an unfavorable shift
in product mix in Financial Services, contract termination payments received in 2005 and higher overall product delivery costs in 2006 due to rate increases and fuel surcharges. Partially offsetting these declines was the increase in Small Business Services revenue per order discussed earlier, as well as cost savings from closing two Small Business Services manufacturing facilities in mid-2006.
Consolidated Selling, General & Administrative Expense
Change
(in thousands)
2007 2006
2005
2007 vs. 2006
2006 vs. 2005
Selling, general and administrative expense ................$ 756,034 $ 787,960 $ 803,633 (4.1%) (2.0%)
SG&A as a percentage of revenue ............................... 47.1% 48.1% 46.8% (1.0) pt. 1.3 pt.

27
The decrease in SG&A expense for 2007, as compared to 2006, was due to various cost reduction initiatives within our shared services organizations, lower amortization expense and project costs related to a software project we wrote-off in the second quarter of 2006, investments made in 2006 related to implementing our Small Business Services growth strategies and a $5.0 million reduction in net restructuring charges in 2007. Further information regarding our restructuring charges can be found under the Restructuring Accruals section of this discussion. We also benefited from lower amortization of acquisition-related intangible assets within Small Business Services, as certain of these assets are amortized using accelerated methods. Partially offsetting these SG&A decreases was higher expense for performance-based employee compensation based on our 2007 operating performance, a gain in 2006 of $11.0 million from the termination of an underperforming outsourced payroll services contract and higher referral commissions for Small Business Services resulting from growth in our Deluxe Business Advantage financial institution referral program.
The decrease in SG&A expense for 2006, as compared to 2005, was due to cost synergies resulting from the
continued integration of New England Business Service, Inc. (NEBS), which was acquired in June 2004, as well as various other cost reduction initiatives, a decrease in amortization expense resulting primarily from one of our order capture software systems being fully amortized and a gain of $11.0 million, which decreased expense, from terminating an underperforming outsourced payroll services contract in the fourth quarter of 2006. Also contributing to the decrease were lower marketing costs for Small Business Services as we increased our focus on gaining new customers through financial institution referrals. Partially offsetting these decreases were investments related to our Small Business Services growth strategies, primarily the hiring and training of call center and sales personnel, higher customer care costs and commissions for Small Business Services as a result of the increased revenue and severance charges of $9.7 million related to executing our cost savings initiatives. Further information regarding the severance charges can be found under Restructuring Accruals.
Asset Impairment Loss
Change
(in thousands)
2007 2006
2005
2007 vs. 2006
2006 vs. 2005
Asset impairment loss................................$ — $ 44,698 $ — $ (44,698 ) $ 44,698
In June 2006, we determined that a software project intended to replace major portions of our existing order
capture, billing and pricing systems would not meet our future business requirements in a cost-effective manner. Therefore, we made the decision to abandon the project. Accordingly, we wrote down the carrying value of the related internal-use software to zero during the second quarter of 2006. This resulted in a non-cash asset impairment loss of $44.7 million, of which $26.4 million was allocated to the Financial Services segment and $18.3 million was allocated to the Small Business Services segment.
Net Gain on Sale of Product Line and Assets Held for Sale
Change
(in thousands)
2007 2006
2005
2007 vs. 2006
2006 vs. 2005
Net gain on sale of product line and assets held for sale ................................$ 3,773 $ 4,582 $ 539 $ (809)
$ 4,043 During 2007, we completed the sale of our Small Business Services industrial packaging product line for
$19.2 million, realizing a pre-tax gain of $3.8 million. This sale had an insignificant impact on our earnings per share because of an offsetting income tax effect.
During 2006, we completed the sale of three Financial Services facilities which were closed in 2004, realizing
a gain totaling $5.5 million. During 2006, we also recorded a loss of $0.9 million when we completed the sale of a Small Business Services facility which was closed prior to the NEBS acquisition in June 2004.
During 2005, we completed the sale of a Small Business Services facility and a Financial Services facility,
both of which were closed in 2004, realizing a total gain of $0.5 million.

28
Interest Expense
Change
(in thousands)
2007 2006
2005
2007 vs.
2006
2006 vs. 2005
Interest expense ...........................................................$ 55,294 $ 56,661 $ 56,604 (2.4%) 0.1%
Weighted-average debt outstanding............................. 994,597 1,103,082 1,225,569 (9.8%) (10.0%)
Weighted-average interest rate ................................ 5.02% 4.59% 4.18% 0.43 pt. 0.41 pt.
The decrease in interest expense for 2007, as compared to 2006, was due to our lower average debt level
during 2007, partially offset by a slightly higher average interest rate. Interest expense for 2006 was flat compared to 2005 as the lower average debt level was offset by higher interest rates.
Other Income
Change
(in thousands)
2007 2006
2005
2007 vs. 2006
2006 vs. 2005
Other income ...............................................................$ 5,403 $ 903 $ 2,499 $ 4,500 $ (1,596)
The increase in other income for 2007, as compared to 2006, was primarily due to interest earned on investments in marketable securities which were purchased using the proceeds from the $200.0 million notes we issued in May 2007. The decrease in other income for 2006, as compared to 2005, was due to lower earnings on life insurance policy investments in 2006, as well as lower interest income.
Income Tax Provision
Change
(in thousands)
2007 2006
2005
2007 vs.
2006
2006 vs. 2005
Income tax provision ................................$ 74,139 $ 41,983 $ 92,771 76.6% (54.7%)
Effective tax rate................................ 34.1% 29.5% 37.0% 4.6 pt. (7.5) pt.
The increase in our effective tax rate for 2007, as compared to 2006, was largely due to a $5.0 million
reduction in our 2006 income tax provision for the true-up of certain deferred income tax balances. As this item was not material to our current or prior periods, we recorded a one-time, discrete benefit to our provision for income taxes for 2006. In addition, our state income tax rate was higher in 2007 and the lower pre-tax income in 2006 resulted in our permanent differences having a larger positive impact on the 2006 effective tax rate. Partially offsetting these increases in our effective tax rate compared to 2006 was the impact of positive adjustments in 2007 related to receivables for prior year tax returns. The overall increase in our effective tax rate reduced diluted earnings per share $0.20 for 2007, as compared to 2006. We expect that our annual effective tax rate for 2008 will be approximately 35%.
The decrease in our effective tax rate for 2006, as compared to 2005, was largely due to the $5.0 million
reduction in our income tax provision for the true-up of certain deferred income tax balances. Additionally, our overall state tax rate was lower in 2006, and the decrease in our pre-tax income for 2006, as compared to 2005, resulted in our permanent differences having a larger positive impact on the effective tax rate. Partially offsetting these reductions in our effective tax rate were accruals for contingent tax liabilities. Accruals related to unresolved tax contingencies more than offset net accrual reversals of $1.5 million related to settled issues, primarily resulting from the expiration of the statutes of limitations in various state income tax jurisdictions. The overall decrease in our effective tax rate contributed $0.21 to diluted earnings per share for 2006, as compared to 2005.

29
RESTRUCTURING ACCRUALS
During 2007, we recorded restructuring accruals of $7.1 million related to employee reductions within our shared services functions of sales, marketing, customer care, fulfillment, information technology, human resources and finance. During 2006, we recorded restructuring accruals of $11.1 million for severance related to employee reductions in these shared services functions, as well as the closing of our Financial Services customer service call center located in Syracuse, New York. The Syracuse facility was closed in January 2007 and the other employee reductions are expected to be completed by the end of 2008, with severance payments to be completed in 2009. These reductions were the result of the cost reduction initiatives discussed earlier under Executive Overview. Also during 2007, we reversed $2.6 million of previously recorded restructuring accruals. These reversals were comprised of $2.0 million of severance benefits due to fewer employees receiving benefits than originally estimated and $0.6 million of re-negotiated operating lease obligations. During 2006, we reversed $0.2 million of previously recorded restructuring accruals.
The restructuring charges, net of reversals, are reflected in our 2007 consolidated statement of income as a
$0.4 million reduction in cost of goods sold, an increase of $4.7 million in SG&A expense and a $0.2 million reduction in the gain recognized on the sale of our industrial packaging product line. For 2006, the restructuring charges, net of reversals, are reflected as cost of goods sold of $1.2 million and SG&A expense of $9.7 million. The 2007 and 2006 restructuring accruals, net of reversals, included severance benefits for a total of 718 employees. As a result of these initiatives, we realized cost savings of approximately $2 million in cost of goods sold and $24 million in SG&A expense in 2007, in comparison to our 2006 results of operations. We expect to realize additional cost savings of approximately $12 million in SG&A expense in 2008, in comparison to our 2007 results of operations. Reduced costs consist primarily of labor costs.
In conjunction with our acquisition of NEBS in 2004, we recorded $30.2 million of restructuring accruals related
to NEBS activities which we decided to exit. As a result of facility closings and other employee reductions, we estimate that we realized savings of approximately $5 million in cost of goods sold and $2 million in SG&A expense in 2006, in comparison to our 2005 results of operations. Because two of the NEBS facilities were closed in mid-2006, we realized additional savings in 2007 of approximately $2 million in cost of goods sold, in comparison to our 2006 results of operations.
Further information regarding our restructuring accruals can be found under the caption “Note 6:
Restructuring accruals” of the Notes to Consolidated Financial Statements appearing in Item 8 of this report.
SEGMENT RESULTS
Additional financial information regarding our business segments appears under the caption “Note 17: Business segment information” of the Notes to Consolidated Financial Statements appearing in Item 8 of this report.
Small Business Services
This segment sells business checks, printed forms, promotional products, marketing materials and related services and products to small businesses and home offices through direct response marketing, financial institution referrals and via sales representatives, independent distributors and the internet.
Change
(in thousands)
2007 2006
2005
2007 vs. 2006
2006 vs. 2005
Revenue ................................................................$ 939,139 $ 969,809 $ 932,286 (3.2%) 4.0%Operating income ........................................................ 130,462 86,764 105,118 50.4% (17.5%) % of revenue.......................................................... 13.9% 8.9% 11.3% 5.0 pt. (2.4) pt.
The decrease in revenue for 2007, as compared to 2006, was primarily due to a $48 million decrease resulting
from the sale of our industrial packaging product line in January 2007, as well as a slight decline in the last half of the year related to general economic conditions. These decreases were partially offset by revenues generated by the
30
Johnson Group, which we acquired in October 2006, and increased revenue in Canada due to a favorable exchange rate and higher check sales resulting from a new check format mandated by the Canadian Payments Association.
The increase in operating income and operating margin for 2007, as compared to 2006, was due to progress
on our cost reduction initiatives, investments related to implementing our growth strategy in 2006, improved manufacturing efficiencies in 2007, including the closing of two manufacturing facilities in mid-2006, lower materials expense related to a higher mix of check products, lower amortization of acquisition-related intangibles, a $3.8 million pre-tax gain on the sale of our industrial packaging product line and a $2.6 million reduction in net restructuring charges in 2007. In addition, 2006 results include the recognition of $18.3 million of the 2006 impairment loss discussed earlier under Consolidated Results of Operations-Asset Impairment Loss. Partially offsetting these operating income improvements were higher expense in 2007 related to performance-based employee compensation and higher referral commissions. In addition, during 2006 we realized a gain of $11.0 million from the termination of an underperforming outsourced payroll services contact.
The increase in revenue for 2006, as compared to 2005, was due to an increase in both revenue per order and
the number of first-time customers resulting from the implementation of our growth strategies. Additionally, we began offering more products for our distributor channel in 2006, and the acquisition of the Johnson Group in October 2006 contributed $3.5 million of revenue.
The decrease in operating income and operating margin for 2006, as compared to 2005, was due to the non-
cash asset impairment loss of $18.3 million allocated to this segment, as discussed earlier under Consolidated
Results of Operations-Asset Impairment Loss, investments related to our growth strategies, primarily the hiring and training of call center and sales personnel, as well as higher customer care costs and commissions related to the revenue increase. Also contributing to the decline were higher product delivery costs and severance charges of $5.7 million for various employee reductions related to our cost savings initiatives. These decreases were partially offset by the impact of the revenue increase, lower marketing expense due to reduced advertising expenditures and a gain of $11.0 million from the termination of an underperforming outsourced payroll services contract in the fourth quarter of 2006. Also, contributing to operating income were cost synergies resulting from the integration of NEBS, including two plant closings in mid-2006, other cost reduction initiatives and lower amortization of acquisition-related intangible assets, as certain of the assets are being amortized using accelerated methods.
Changes in the allocation of corporate costs resulted in a decrease of $12.7 million in Small Business Services
operating income for 2006, as compared to 2005. As discussed under the caption “Note 17: Business segment information” of the Notes to Consolidated Financial Statements appearing in Item 8 of this report, we began allocating corporate costs to the NEBS portion of Small Business Services on April 1, 2005 only for those corporate services which the NEBS portion of the business was utilizing. As such, the NEBS portion of Small Business Services did not bear any allocation of corporate costs in the first quarter of 2005 and did not bear a full allocation of corporate costs during the remainder of 2005. As of January 1, 2006, the NEBS portion of the business was fully integrated into all corporate functions and thus, Small Business Services results included a full allocation of corporate costs in 2006.
Financial Services
Financial Services sells personal and business checks, check-related products and services, stored value gift cards and customer loyalty, retention and fraud monitoring/protection services to banks and other financial institutions. We also offer enhanced services such as customized reporting, file management and expedited account conversion support.
Change
(in thousands)
2007 2006
2005
2007 vs. 2006
2006 vs. 2005
Revenue ................................................................$ 457,292 $ 458,118 $ 537,525 (0.2%) (14.8%)Operating income ........................................................ 74,305 46,613 119,677 59.4% (61.1%) % of revenue.......................................................... 16.2% 10.2% 22.3% 6.0 pt. (12.1) pt.

31
The decrease in revenue for 2007, as compared to 2006, was driven by lower revenue per order due to continued pricing pressure despite a price increase implemented in 2007. Lower pricing was partially offset by a 1.4% increase in order volume, as client acquisition gains and financial institution conversion activity exceeded the impact of the consumer-driven decline in check usage.
Operating income increased for 2007, as compared to 2006, given 2006 results included the recognition of
$26.4 million of the 2006 asset impairment loss related to a software project we wrote-off. Further information regarding the asset impairment loss was provided earlier under Consolidated Results of Operations-Asset
Impairment Loss. Additionally, we benefited from progress on our cost savings initiatives, manufacturing efficiencies, lower amortization and other costs related to the software project we wrote-off in 2006, increased order volume and a $3.3 million reduction in net restructuring charges in 2007. Partially offsetting these operating income increases were higher delivery costs due to a postal rate increase in May 2007, lower revenue per order and higher expense related to performance-based employee compensation. Additionally, 2006 results included gains of $5.5 million from sales of facilities.
The decrease in revenue for 2006, as compared to 2005, was due to lower revenue per order due to pricing
pressure, an unfavorable shift in product mix and contract termination payments of $11.7 million in the second quarter of 2005. Partially offsetting these decreases was an increase in order volume. Order volume increased 1.1% for 2006, as compared to 2005, as client acquisition gains exceeded the impact of the decline in check usage. This is the first time order volume for this segment increased since we began tracking orders as a measure of volume in 2000.
Operating income decreased for 2006, as compared to 2005, due to the revenue decline, the non-cash asset
impairment loss of $26.4 million allocated to this segment, as discussed earlier under Consolidated Results of
Operations-Asset Impairment Loss, higher product delivery costs and severance charges of $4.4 million related to the January 2007 closing of our customer service call center located in Syracuse, New York and various other employee reductions. These impacts were partially offset by lower amortization expense related to one of our order capture software systems being fully amortized, various cost reduction initiatives, primarily within information technology, and gains of $5.5 million from facility sales in 2006. Also, as discussed earlier, Small Business Services began bearing a larger portion of corporate costs in 2006. This change in allocations resulted in an $8.5 million benefit to Financial Services for 2006, as compared to 2005.
Direct Checks
Direct Checks sells personal and business checks and related products and services directly to consumers through direct response marketing and the internet. We use a variety of direct marketing techniques to acquire new customers in the direct-to-consumer channel, including newspaper inserts, in-package advertising, statement stuffers and co-op advertising. We also use e-commerce strategies to direct traffic to our websites. Direct Checks sells under the Checks Unlimited and Designer Checks brand names, as well as www.checks.com.
Change
(in thousands)
2007 2006
2005
2007 vs. 2006
2006 vs. 2005
Revenue ................................................................$ 209,936 $ 211,727 $ 246,483 (0.8%) (14.1%)Operating income ........................................................ 62,778 64,922 80,044 (3.3%) (18.9%) % of revenue.......................................................... 29.9% 30.7% 32.5% (0.8) pt. (1.8) pt.
The decrease in revenue for 2007, as compared to 2006, was due to a reduction in orders stemming from the
overall decline in check usage and lower customer retention, as well as lower direct mail consumer response rates. Partially offsetting the volume decline was higher revenue per order resulting from new accessories and services, including the introduction in October 2006 of the EZShield product discussed earlier under Executive Overview. Additionally, revenue was favorably impacted by approximately $3 million due to weather-related production and shipping disruptions during the last week of December 2006, which caused revenue to be delayed into 2007.

32
The decrease in operating income for 2007, as compared to 2006, was primarily due to the lower order volume, higher performance-based employee compensation, increased delivery costs related to a postal rate increase and the implementation of new check packaging intended to mitigate the effect of the postal rate increase, as well as higher advertising expense related to increased circulation. These decreases in operating income were partially offset by our cost reduction initiatives and higher revenue from new accessories and premium features and services.
The decrease in revenue for 2006, as compared to 2005, was due to lower order volume resulting from the
same factors as discussed earlier regarding 2007 revenue. Additionally, revenue was negatively impacted approximately $3 million due to weather-related production and shipping disruptions during the last week of December 2006, causing revenue to be delayed into 2007. The volume decline was partially offset by an increase in revenue per order resulting from the introduction in October 2006 of the EZShield product discussed earlier under Executive Overview, as well as a decline in orders received through our mail channel, which typically result in lower revenue per order.
The decrease in operating income for 2006, as compared to 2005, was due to the revenue decline, partially
offset by lower customer care costs associated with the lower order volume and a decrease in advertising expense due to reductions in advertising expenditures. Additionally, the decrease in operating income was partially offset by a reduction in the allocation of corporate costs. As discussed earlier, Small Business Services began bearing a larger portion of corporate costs in 2006. This change in allocations resulted in a $4.2 million benefit to Direct Checks for 2006, as compared to 2005.
CASH FLOWS
As of December 31, 2007, we held cash and cash equivalents of $21.6 million. The following table shows our cash flow activity for the last three years and should be read in conjunction with the consolidated statements of cash flows appearing in Item 8 of this report.
Change
(in thousands)
2007 2006
2005
2007 vs. 2006
2006 vs. 2005
Continuing operations:
Net cash provided by operating activities..................$ 244,716 $ 239,341 $ 178,279 $ 5,375 $ 61,062
Net cash used by investing activities ......................... (10,971 ) (33,174 ) (55,917 ) 22,203 22,743
Net cash used by financing activities......................... (224,890 ) (204,587 ) (142,816 ) (20,303) (61,771)
Effect of exchange rate change on cash ..................... 1,161 158 202 1,003 (44)
Net cash provided (used) by continuing operations ................................................................ 10,016 1,738 (20,252 ) 8,278 21,990
Net cash provided (used) by operating activities of discontinued operations................................ — 23 (4,152 ) (23) 4,175
Net cash provided by investing activities of discontinued operations................................................................ — 2,971 15,779 (2,971) (12,808)
Net change in cash and cash equivalents................................................................$ 10,016 $ 4,732 $ (8,625 ) $ 5,284 $ 13,357
The $5.4 million increase in cash provided by operating activities for 2007, as compared to 2006, was due to
positive working capital changes, as well as the higher earnings discussed earlier under Consolidated Results of
Operations. Partially offsetting these increases was a $29.6 million increase in 2007 contributions to our voluntary employee beneficiary association (VEBA) trust used to fund medical and severance benefits, as well as a $15.1 million increase in income tax payments. During 2006, we decided that we would no longer pre-fund the VEBA trust as the tax benefit from the pre-funding no longer exceeds the associated interest cost. As such, during 2006 we made minimal contributions to the trust as we did not pre-fund the trust and we utilized the prepaid funds in the trust to

33
cover benefit payments. Beginning in 2007, we fund the VEBA trust throughout the year as needed to pay medical and severance benefits.
The $61.1 million increase in cash provided by operating activities for 2006, as compared to 2005, was due to
a $53.1 million decrease in contract acquisition payments related to new financial institution contracts, a $30.7 million decrease in income tax payments, a $27.5 million decrease in payments to our VEBA trust used to fund medical and severance benefits, a $24.5 million decrease in employee profit sharing and pension payments related to our 2005 operating results and a $7.1 million benefit from utilizing the December 31, 2005 prepaid amount in the VEBA trust. These increases were largely offset by the lower earnings discussed earlier under Consolidated Results
of Operations. Included in cash provided by operating activities were the following operating cash outflows:
Change
(in thousands)
2007 2006
2005
2007 vs. 2006
2006 vs. 2005
Income tax payments ...................................................$ 89,944 $ 74,891 $ 105,546 $ 15,053 $ (30,655)
Interest payments ......................................................... 57,077 57,035 57,393 42 (358)
VEBA trust contributions to fund medical and severance benefits ................................ 34,100 4,500 32,000 29,600 (27,500)
Employee profit sharing and pension contributions ............................................................. 15,740 12,000 36,470 3,740 (24,470)
Contract acquisition payments................................ 14,230 17,029 70,169 (2,799) (53,140)
Severance payments ................................................................ 9,606 5,092 9,573 4,514 (4,481) Net cash used by investing activities for 2007 was $22.2 million lower than 2006 due to payments in 2006 for
the Johnson Group acquisition, proceeds from the sale of our industrial packaging product line in 2007 and lower capital asset purchases in 2007. Net cash used by financing activities for 2007 was $20.3 million higher than 2006 due to the pay-off of a $325.0 million long-term debt maturity and share repurchases of $11.3 million completed in 2007. These increases in cash used were partially offset by net proceeds from the 2007 issuance of $200.0 million of long-term notes, higher payments on short-term debt in 2006, pay-off of a long-term debt maturity of $50.0 million in 2006 and lower dividend payments in 2007 resulting from the decision to lower our quarterly dividend rate from $0.40 to $0.25 per share in the third quarter of 2006. Net cash provided by investing activities of discontinued operations in 2006 was $3.0 million due to the sale of our remaining facility in Europe.
Net cash used by investing activities for 2006 was $22.7 million lower than 2005, primarily due to the
redemption of company-owned life insurance policies in 2006, lower capital expenditures and higher cash proceeds from facility sales. Partially offsetting these items were payments of $16.5 million for the acquisition of the Johnson Group in the fourth quarter of 2006, as discussed earlier under Executive Overview. Net cash used by financing activities for 2006 was $61.8 million higher than 2005 due to increased payments on short-term debt, as we continued to focus on reducing our debt level, as well as a $50.0 million payment on long-term debt which matured in the third quarter of 2006. These increases were partially offset by a $14.3 million reduction in dividend payments, as we lowered our quarterly dividend amount from $0.40 per share to $0.25 per share in the third quarter of 2006. Net cash provided by investing activities of discontinued operations for 2006 was $12.8 million lower than 2005 due to the sale of our apparel business in 2005, partially offset by the sale of our remaining facility in Europe during 2006.

34
Significant cash inflows, excluding those related to operating activities, for each year were as follows:
Change
(in thousands)
2007 2006
2005
2007 vs. 2006
2006 vs. 2005
Proceeds from sales of marketable securities(1) ...............................................................$ 1,057,460 $ — $ — $ 1,057,460 $ —
Proceeds from issuance of long-term debt, net of debt issuance costs................................ 196,239 — — 196,239 —
Proceeds from sale of product line and facilities................................................................ 19,214 9,247 2,618 9,967 6,629
Proceeds from issuing shares under employee plans .......................................................... 15,923 8,936 11,247 6,987 (2,311)
Proceeds from redemptions of life insurance policies ...................................................... — 15,513 — (15,513) 15,513
Net proceeds from sale of discontinued operations ................................................................ — 2,971 15,779 (2,971) (12,808)
(1) During 2007, we purchased short-term marketable securities using the proceeds from the $200.0 million debt we issued in May 2007, as well as using cash generated from operating activities. On October 1, 2007, we sold our remaining marketable securities and borrowed $120.0 million from our credit facility primarily to repay our $325.0 million debt maturity plus accrued interest.
Significant cash outflows, excluding those related to operating activities, for each year were as follows:
Change
(in thousands)
2007
2006
2005
2007 vs. 2006
2006 vs. 2005
Purchases of marketable securities(1) ...........................$ 1,057,460 $ — $ — $ 1,057,460 $ —
Payments on long-term debt ................................ 326,582 51,362 26,338 275,220 25,024
Cash dividends paid to shareholders............................ 52,048 66,973 81,271 (14,925) (14,298)
Net payments on short-term debt ................................ 45,460 99,686 51,654 (54,226) 48,032
Purchases of capital assets ................................ 32,328 41,324 55,653 (8,996) (14,329)
Payments for common shares repurchased .................. 11,288 — — 11,288 —
Payments for acquisitions, net of cash acquired ................................................................ 2,316 16,521 2,888 (14,205) 13,633
(1) During 2007, we purchased short-term marketable securities using the proceeds from the $200.0 million debt we issued in May 2007, as well as using cash generated from operating activities. On October 1, 2007, we sold our remaining marketable securities and borrowed $120.0 million from our credit facility primarily to repay our $325.0 million debt maturity plus accrued interest.
We believe future cash flows provided by operating activities and our available credit capacity are sufficient
to support our operations, including capital expenditures, required debt service and dividend payments, for the next 12 months.

35
CAPITAL RESOURCES Our total debt was $844.0 million as of December 31, 2007, a decrease of $171.7 million from December 31,
2006.
Capital Structure
December 31,
(in thousands) 2007 2006 Change
Amounts drawn on credit facilities ..............................$ 67,200 $ 112,660 $ (45,460)
Current portion of long-term debt................................ 1,754 326,531 (324,777)
Long-term debt ........................................................... 775,086 576,590 198,496
Total debt................................................................ 844,040 1,015,781 (171,741)
Shareholders’ equity (deficit)................................ 42,162 (65,673) 107,835
Total capital................................................................$ 886,202 $ 950,108 $ (63,906)
As of December 31, 2006, we were in a shareholders’ deficit position due to the required accounting
treatment for share repurchases, completed primarily in 2002 and 2003. Under the laws of Minnesota, our state of incorporation, shares which we repurchase are considered to be authorized and unissued shares. Thus, share repurchases are not presented as a separate treasury stock caption in our consolidated balance sheets, but are recorded as direct reductions of common shares, additional paid-in capital and retained earnings.
We have an outstanding authorization from our board of directors to purchase up to 10 million shares of our
common stock. This authorization has no expiration date, and 7.5 million shares remained available for purchase under this authorization as of December 31, 2007. We repurchased 0.4 million shares during 2007 for $11.3 million, and we repurchased an additional 0.6 million shares for $13.6 million through February 21, 2008. No shares were repurchased in 2006 or 2005. Further information regarding changes in shareholders’ equity (deficit) can be found in the consolidated statements of shareholders’ equity (deficit) appearing in Item 8 of this report.
Debt Structure
December 31,
2007 2006
(in thousands) Amount
Weighted- average interest
rate Amount
Weighted- average interest
rate Change
Fixed interest rate ........................................................$ 773,646 5.7% $ 898,345 4.5% $ (124,699 )
Floating interest rate .................................................... 67,200 5.6% 112,660 6.0% (45,460 )
Capital leases ............................................................... 3,194 10.4% 4,776 10.4% (1,582 )
Total debt................................................................$ 844,040 5.7% $ 1,015,781 4.7% $ (171,741 )
Further information concerning our outstanding debt can be found under the caption “Note 13: Debt” of the
Notes to Consolidated Financial Statements appearing in Item 8 of this report. We do not anticipate retiring outstanding long-term debt as we believe that is not the best use of our financial
resources at this time. However, we may, from time to time, consider retiring outstanding debt through open market purchases, privately negotiated transactions or otherwise. Any such repurchases or exchanges would depend on prevailing market conditions, our liquidity requirements, contractual restrictions and other factors.
We currently have a $500.0 million commercial paper program in place which is supported by two committed
lines of credit. Given our current credit ratings, the commercial paper market is not available to us. As necessary, we utilize our $500.0 million committed lines of credit to meet our working capital requirements. The credit agreements governing the lines of credit contain customary covenants requiring a ratio of earnings before interest and taxes to

36
interest expense of 3.0 times, as well as limits on levels of subsidiary indebtedness. We were in compliance with all debt covenants as of December 31, 2007, and we expect to remain in compliance with all debt covenants throughout the next 12 months.
As of December 31, 2007, amounts were available under our committed lines of credit for borrowing or for
support of commercial paper, as follows:
(in thousands)
Total available
Expiration
date Commitment
fee
Five year line of credit................................................................$ 275,000 July 2010 .175%
Five year line of credit................................................................225,000 July 2009 .225%
Total committed lines of credit ................................ 500,000
Amounts drawn on credit facilities................................ (67,200)
Outstanding letters of credit ..............................................................(11,225)
Net available for borrowing as of December 31, 2007 ................................................................$ 421,575
Our current debt ratings as determined by Moody’s Investors Service (Moody’s) are Ba2 for our long-term
debt and Ba2 for our corporate family rating with a stable outlook. In May 2007, Moody’s changed the rating outlook on our corporate family rating to stable from negative. Moody’s indicated that the change was due to our improved liquidity position and expectations that improving revenue performance and savings realized from our cost reduction program will continue to stabilize earnings. Our current long-term debt rating determined by Standard & Poor’s Ratings Services (S&P) is BB- with a stable outlook. In July 2007, S&P revised our rating outlook to stable from negative. S&P stated that the revision reflects stabilizing operating trends and adequate flexibility to sustain credit measures in line with the current rating over the intermediate term. Our credit agreements do not include covenants or events of default tied directly to our credit ratings. The $200.0 million notes we issued in May 2007 place a limitation on restricted payments, including increases in dividend levels and share repurchases. This limitation does not apply if the notes are upgraded to an investment-grade credit rating.
CONTRACT ACQUISITION COSTS
Other non-current assets include contract acquisition costs of our Financial Services segment. These costs, which are essentially pre-paid product discounts, are recorded as non-current assets upon contract execution and are amortized, generally on the straight-line basis, as reductions of revenue over the related contract term. Cash payments made for contract acquisition costs were $14.2 million in 2007, $17.0 million in 2006 and $70.2 million in 2005. Changes in contract acquisition costs for the last three years were as follows:
(in thousands) 2007 2006 2005
Balance, beginning of year ................................................................$ 71,721 $ 93,664 $ 83,825
Additions ................................................................ 11,984 14,633 50,177
Amortization................................................................ (28,189) (36,576) (34,731)
Refunds from contract terminations................................ — — (5,607)
Balance, end of year ................................................................$ 55,516 $ 71,721 $ 93,664
The number of checks being written has been in decline since the mid-1990s, which has contributed to increased competitive pressure when attempting to retain or acquire clients. Both the number of financial institution clients requesting contract acquisition payments and the amount of the payments increased in the mid-2000s, and has fluctuated significantly from year to year. Although we anticipate that we will selectively continue to make contract acquisition payments, we cannot quantify future amounts with certainty. The amount paid depends on numerous factors such as the number and timing of contract executions and renewals, competitors’ actions, overall product

37
discount levels and the structure of up-front product discount payments versus providing higher discount levels throughout the term of the contract. When the overall discount level provided for in a contract is unchanged, contract acquisition costs do not result in lower net revenue. The impact of these costs is the timing of cash flows. An up-front cash payment is made rather than providing higher product discount levels throughout the term of the contract. Beginning in 2006, we sought to reduce the use of up-front product discounts by structuring new contracts with incentives throughout the duration of the contract. We plan to continue this strategy.
Liabilities for contract acquisition payments are recorded upon contract execution. These obligations are
monitored for each contract and are adjusted as payments are made. Contract acquisition payments due within the next year are included in accrued liabilities in our consolidated balance sheets. These accruals were $2.5 million as of December 31, 2007 and $2.7 million as of December 31, 2006. Accruals for contract acquisition payments included in other non-current liabilities in our consolidated balance sheets were $3.4 million as of December 31, 2007 and $5.4 million as of December 31, 2006.
OFF-BALANCE SHEET ARRANGEMENTS, GUARANTEES AND CONTRACTUAL OBLIGATIONS
It is not our general business practice to enter into off-balance sheet arrangements or to guarantee the performance of third parties. In the normal course of business we periodically enter into agreements that incorporate general indemnification language. These indemnifications encompass such items as product or service defects, including breach of security, intellectual property rights, governmental regulations and/or employment-related matters. Performance under these indemnities would generally be triggered by our breach of the terms of the contract. In disposing of assets or businesses, we often provide representations, warranties and/or indemnities to cover various risks including, for example, unknown damage to the assets, environmental risks involved in the sale of real estate, liability to investigate and remediate environmental contamination at waste disposal sites and manufacturing facilities, and unidentified tax liabilities and legal fees related to periods prior to disposition. We do not have the ability to estimate the potential liability from such indemnities because they relate to unknown conditions. However, we have no reason to believe that any likely liability under these indemnities would have a material adverse effect on our financial position, annual results of operations or annual cash flows. We have recorded liabilities for known indemnifications related to environmental matters. Further information can be found under the caption “Note 14: Other commitments and contingencies” of the Notes to Consolidated Financial Statements appearing in Item 8 of this report.
We are not engaged in any transactions, arrangements or other relationships with unconsolidated entities or
other third parties that are reasonably likely to have a material effect on our liquidity, or on our access to, or requirements for capital resources. In addition, we have not established any special purpose entities.
As of December 31, 2007, our contractual obligations were as follows:
(in thousands)
Total
2008
2009 and 2010
2011 and 2012
2013 and thereafter
Long-term debt and related interest ................................................................$ 1,054,396 $ 43,844 $ 87,688 $ 387,063 $ 535,801
Amounts drawn on credit facilities ................................................................ 67,200 67,200 — — —
Capital lease obligation and related interest ................................ 3,507 2,004 1,503 — —
Operating lease obligations ................................ 23,857 8,233 12,590 3,032 2
Purchase obligations................................ 159,145 59,829 64,893 32,958 1,465
Other long-term liabilities................................ 46,633 21,395 15,824 3,336 6,078
Total ................................................................$ 1,354,738 $ 202,505 $ 182,498 $ 426,389 $ 543,346

38
Purchase obligations include amounts due under contracts with third party service providers. These contracts are primarily for information technology services. Additionally, purchase obligations include amounts due under Direct Checks direct mail advertising agreements and Direct Checks and Financial Services royalty agreements. We routinely issue purchase orders to numerous vendors for the purchase of inventory and other supplies. These purchase orders are not included in the purchase obligations presented here, as our business partners typically allow us to cancel these purchase orders as necessary to accommodate business needs. Certain of the contracts with third party service providers allow for early termination upon the payment of early termination fees. If we were to terminate these agreements, we would have incurred early termination fees of $37.5 million as of December 31, 2007.
Other long-term liabilities consist primarily of amounts due for our postretirement benefit plans and liabilities for uncertain tax positions, deferred compensation and workers’ compensation. Of the $86.8 million reported as other long-term liabilities in our consolidated balance sheet as of December 31, 2007, $61.5 million is excluded from the obligations shown in the table above. The excluded amounts include the following:
• Benefit payments for postretirement benefit plans – We have contributed funds to these plans for the purpose of funding our obligations. Thus, we have the option of paying benefits from the assets of the plans or from the general funds of the company. Additionally, we expect the plan assets to earn income over time. As such, we cannot predict when or if payments from the general funds of the company will be required. As of December 31, 2007, three of our postretirement benefit plans were underfunded by a total of $34.7 million.
• Payments for uncertain tax positions – Due to the nature of the underlying liabilities and the extended time often needed to resolve income tax uncertainties, we cannot make reliable estimates of the amount or timing of cash payments that may be required to settle these liabilities. Our liability for uncertain tax positions, including accrued interest and penalties, was $19.2 million as of December 31, 2007.
• A portion of the amount due under our deferred compensation plan – Under this plan, employees begin
receiving payments upon the termination of employment or disability, and we cannot predict when these events will occur.
• Insured environmental remediation costs – As of December 31, 2007, the majority of the costs
included in our environmental accruals are covered by an environmental insurance policy which we purchased in 2002. The insurance policy does not cover properties acquired in acquisitions subsequent to 2002. The insurance policy covers pre-existing conditions from third-party claims and cost overruns through 2032 at certain owned, leased and divested sites, as well as any new conditions discovered at certain owned or leased sites through 2012. As a result, we expect to receive reimbursements from the insurance company for environmental remediation costs we incur for these insured sites. The related receivables from the insurance company are reflected in other current assets and other non-current assets in our consolidated balance sheets based on the amounts of our environmental accruals for insured sites.
• Items which will not be paid in cash, such as a deferred gain resulting from a 1999 sale-leaseback transaction with an unaffiliated third party.
Total contractual obligations do not include the following:
• Payments to our defined contribution pension and 401(k) plans – The amounts payable under our
defined contribution pension and 401(k) plans are dependent on the number of employees providing services throughout the year, their wage rates and in the case of the 401(k) plans, whether employees elect to participate in the plans.
• Profit sharing and cash bonus payments – Amounts payable under our profit sharing and cash bonus
plans are dependent on our operating performance.
• Income tax payments which will be remitted on our earnings.

39
RELATED PARTY TRANSACTIONS
We have not entered into any material related party transactions during the past three years.
CRITICAL ACCOUNTING POLICIES
Management’s discussion and analysis of our financial condition and results of operation is based upon our
consolidated financial statements, which have been prepared in accordance with generally accepted accounting principles (GAAP) in the United States of America. We review the accounting policies used in reporting our financial results on a regular basis. The preparation of these financial statements requires us to make estimates and judgments that affect the reported amounts of assets, liabilities, revenues and expenses and the related disclosure of contingent assets and liabilities. We base our estimates on historical experience and on various other assumptions that we believe are reasonable under the circumstances, the result of which forms the basis for making judgments about the carrying values of assets and liabilities that are not readily apparent from other sources. Results may differ from these estimates due to actual outcomes being different from those on which we based our assumptions. The estimates and judgments utilized are reviewed by management on an ongoing basis and by the audit committee of our board of directors at the end of each quarter prior to the public release of our financial results. During the first quarter of 2007, we adopted Statement of Financial Accounting Standards (SFAS) No. 157, Fair Value Measurements and Financial Accounting Standards Board (FASB) Interpretation (FIN) No. 48, Accounting for Uncertainty in Income Taxes. Further information concerning the adoption of these standards can be found under the caption “Note 1: Significant accounting policies” of the Notes to Consolidated Financial Statements appearing in Item 8 of this report.
APPLICATION OF CRITICAL ACCOUNTING POLICIES
Goodwill and Indefinite-Lived Trade Names
As of December 31, 2007, goodwill was comprised of the following:
(in thousands)
Acquisition of NEBS in June 2004..................................................................... $ 493,889
Acquisition of Designer Checks, Inc. in February 2000..................................... 77,970
Acquisition of the Johnson Group in October 2006........................................... 7,320
Acquisition of Direct Checks in December 1987 ............................................... 4,267
Acquisition of Dots and Pixels, Inc. in July 2005 .............................................. 1,044
Acquisition of All Trade Computer Forms, Inc. in February 2007.................... 804
Goodwill.......................................................................................................... $ 585,294
Further information regarding the acquisitions which occurred during the past three years can be found under
the caption “Note 4: Acquisitions and disposition” of the Notes to Consolidated Financial Statements appearing in Item 8 of this report. Goodwill is tested for impairment on at least an annual basis and between annual evaluations if events or circumstances occur which could indicate impairment. As discussed earlier under Segment Results, our Direct Checks segment has been impacted by the decline in check usage, lower customer retention and lower direct mail consumer response rates. To date, we have been able to offset to a large degree the impact of the resulting volume decline through cost management efforts and revenue from new accessories and services. The impairment analysis completed during the third quarter of 2007 indicated no impairment of goodwill.
We also have two indefinite-lived trade names, totaling $59.4 million as of December 31, 2007, related to the
NEBS acquisition. We continually evaluate the remaining useful lives of these assets to determine whether events and circumstances continue to support an indefinite useful life. If we subsequently determine that one or both of these assets has a finite useful life, we will first test the asset for impairment and then amortize the asset over its estimated remaining useful life. Indefinite-lived trade names are tested for impairment on at least an annual basis and

40
between annual evaluations if events or circumstances occur which could indicate that the asset is impaired. The annual impairment analysis completed during the third quarter of 2007 found no indication of impairment. The valuation determined that the fair value of these assets was $74.5 million, compared to the carrying value of $59.4 million. In determining the fair value, we assumed a discount rate of 10.3% and royalty rates of 2% and 5%. A one percentage point increase in the discount rate would reduce the indicated fair value of the assets by $8.3 million and a one percentage point decrease in the royalty rates would reduce the indicated fair value of the assets by $26.7 million. We are currently reassessing our branding strategy. Once this assessment is complete, we will evaluate the impact, if any, on the carrying value of our trade name intangible assets. An impairment loss may be required if future events cause a decrease in the indicated fair value of these assets.
The evaluation of asset impairment requires us to make assumptions about future cash flows over the life of
the asset being evaluated. These assumptions require significant judgment and actual results may differ from assumed or estimated amounts. If these estimates and assumptions change, we may be required to recognize impairment losses in the future.
Income Taxes
When preparing our consolidated financial statements, we are required to estimate our income taxes in each of the jurisdictions in which we operate. This process involves estimating our actual current tax obligations based on expected taxable income, statutory tax rates and tax credits allowed in the various jurisdictions in which we operate. In interim reporting periods, we use an estimate of our annual effective tax rate based on the facts available at the time. Changes in the mix or estimated amount of annual pre-tax income could impact our estimated effective tax rate in interim periods. In the event there is a significant unusual or one-time item recognized in our results of operations, the tax attributable to that item is separately calculated and recorded in the interim period the unusual or one-time item occurred. The actual effective tax rate is calculated at year-end.
Tax law requires certain items to be included in our tax return at different times than the items are reflected in
our results of operations. As a result, the annual effective tax rate reflected in our results of operations is different than that reported on our tax return (i.e., our cash tax rate). Some of these differences are permanent, such as expenses that are not deductible in our tax return, and some are temporary differences that will reverse over time, such as depreciation expense on capital assets. These temporary differences result in deferred tax assets and liabilities, which are included within our consolidated balance sheets. Deferred tax assets generally represent items that can be used as a tax deduction or credit in our tax return in future years for which we have already recorded the expense in our statements of income. We must assess the likelihood that our deferred tax assets will be realized through future taxable income, and to the extent we believe that realization is not likely, we must establish a valuation allowance against those deferred tax assets. Deferred tax liabilities generally represent items for which we have already taken a deduction in our tax return, but we have not yet recognized the items as expense in our results of operations. Significant judgment is required in evaluating our tax positions, and in determining our provision for income taxes, our deferred tax assets and liabilities and any valuation allowance recorded against our net deferred tax assets. We had deferred tax assets in excess of deferred tax liabilities of $4.7 million as of December 31, 2007 and $2.5 million as of December 31, 2006, including valuation allowances of $0.6 million as of December 31, 2007 and $0.7 million as of December 31, 2006. The valuation allowances relate to Canadian operating loss carryforwards which we do not expect to realize.
On January 1, 2007, we adopted FIN No. 48, Accounting for Uncertainty in Income Taxes. The new standard
defines the threshold for recognizing the benefits of tax return positions in the financial statements as “more-likely-than-not” to be sustained by the taxing authorities based solely on the technical merits of the position. If the recognition threshold is met, the tax benefit is measured and recognized as the largest amount of tax benefit that, in our judgment, is greater than 50% likely to be realized. Further information regarding the impact of adopting this new standard can be found under the caption “Note 1: Significant accounting policies” of the Notes to Consolidated Financial Statements appearing in Item 8 of this report. The total amount of unrecognized tax benefits as of December 31, 2007 was $14.4 million, excluding accrued interest and penalties. If the unrecognized tax benefits were recognized in our consolidated financial statements, $7.2 million would affect our effective tax rate. Interest and penalties recorded for uncertain tax positions are included in our income tax provision. As of December 31, 2007, $4.8 million of interest and penalties was accrued, excluding the tax benefits of deductible interest.

41
Examinations of our federal income tax returns for years prior to 2000 have been closed. Federal income tax returns for 2000 through 2004 have been examined by the Internal Revenue Service (IRS), while our federal income tax returns for 2005 through 2007 remain subject to IRS examination. In general, income tax returns for the years 2003 through 2007 remain subject to examination by major state and city tax jurisdictions. In the event that we have determined not to file tax returns with a particular state or city, all years remain subject to examination by the tax jurisdictions. The ultimate outcome of tax matters may differ from our estimates and assumptions. Unfavorable settlement of any particular issue would require the use of cash and could result in increased income tax expense. Favorable resolution would result in reduced income tax expense.
Changes in unrecognized tax benefits during 2007 can be found under the caption: “Note 9: Income tax
provision” of the Notes to Consolidated Financial Statements appearing in Item 8 of this report. Within the next 12 months, it is reasonably possible that our unrecognized tax benefits will change in the range of a decrease of $7.0 million to an increase of $1.1 million as we attempt to settle certain federal and state matters or as federal and state statutes of limitations expire. We are not able to predict what, if any, impact these changes may have on our effective tax rate or cash flows.
During 2006, we reduced our income tax provision $1.5 million for net accrual reversals related to settled
issues, primarily resulting from the expiration of the statutes of limitations in various state income tax jurisdictions. Also during 2006, we reduced our income tax provision $5.0 million for the true-up of certain deferred income tax balances. As this item was not material to 2006 or prior periods, we recorded a one-time, discrete benefit to our provision for income taxes for 2006. No significant adjustments to our provision for income taxes related to reserves for contingent tax liabilities or deferred income taxes were recorded during 2005.
Postretirement Benefits
Detailed information regarding our postretirement benefit plan, including a description of the plan, its related future cash flows, plan assets and the actuarial assumptions used in accounting for the plan, can be found under the caption: “Note 12: Pension and other postretirement benefits” of the Notes to Consolidated Financial Statements appearing in Item 8 of this report.
Our net postretirement benefit expense was $4.8 million for 2007 and $7.8 million for 2006 and 2005. Our
business segments record postretirement benefit expense in cost of goods sold and SG&A expense, based on the composition of their workforces. Our postretirement benefit expense and liability are calculated utilizing various actuarial assumptions and methodologies. These assumptions include, but are not limited to, the discount rate, the expected long-term rate of return on plan assets, the expected health care cost trend rate and the average remaining life expectancy of plan participants. We analyze the assumptions used each year when we complete our actuarial valuation of the plan. If the assumptions utilized in determining our postretirement benefit expense and liability differ from actual events, our results of operations for future periods could be impacted.
Discount rate – The discount rate is used to reflect the time value of money. It is the assumed rate at which
future postretirement benefits could be effectively settled. The discount rate assumption is based on the rates of return on high-quality, fixed-income instruments currently available whose cash flows match the timing and amount of expected benefit payments. In determining the discount rate, we utilize yield curve approaches to discount each cash flow stream at an interest rate specifically applicable to the timing of each respective cash flow. The present value of each cash flow stream is aggregated and used to impute a weighted-average discount rate. Additionally, we consider Moody’s high quality corporate bond rates when selecting our discount rate. In measuring the accumulated postretirement benefit obligation as of December 31, 2007, we assumed a discount rate of 6.2%. A 0.25 point change in the discount rate would increase or decrease our annual postretirement benefit expense by approximately $0.2 million and would increase or decrease our postretirement benefit obligation by approximately $2.9 million.
Expected long-term rate of return on plan assets – The long-term rate of return on plan assets reflects the
average rate of earnings expected on the funds invested or to be invested to provide for expected benefit payments. We base this assumption on an evaluation of our historical trends and experience, taking into account current and expected market conditions. In measuring the net postretirement benefit expense for 2007, we assumed an expected

42
long-term rate of return on plan assets of 8.75%. A 0.25 point change in this assumption would increase or decrease our annual postretirement benefit expense by approximately $0.3 million.
Expected health care cost trend rate – The health care cost trend rate represents the expected annual rate of
change in the cost of health care benefits currently provided due to factors other than changes in the demographics of plan participants. In measuring the accumulated postretirement benefit obligation as of December 31, 2007, our initial health care inflation rate for 2008 was assumed to be 8.25% for participants under the age of 65 and 9.25% for participants over the age of 65. Our ultimate health care inflation rate was assumed to be 5.25% in 2012 and beyond for participants under the age of 65 and 5.25% in 2014 and beyond for participants over the age of 65. A one percentage point increase in the health care inflation rate for each year would increase the accumulated postretirement benefit obligation by $2.8 million and the service and interest cost components of our annual postretirement benefit expense by $0.2 million. A one percentage point decrease in the health care inflation rate for each year would decrease the accumulated postretirement benefit obligation by $2.5 million and the service and interest cost components of our annual postretirement benefit expense by $0.1 million.
Average remaining life expectancy of plan participants – In determining the average remaining life
expectancy of plan participants, our actuaries use a mortality table which includes estimated death rates for each age. We use the RP-2000 Combined Healthy Participant Mortality Table in determining this assumption.
When actual events differ from our assumptions or when we change the assumptions used, an unrecognized actuarial gain or loss results. Unrecognized gains and losses are reflected in postretirement benefit expense over the average remaining service period of plan participants, which is currently 8.8 years. As of December 31, 2007 and 2006, our unrecognized net actuarial loss was $96.7 million and $97.9 million, respectively, and was comprised of the following:
(in thousands) 2007 2006
Claims experience................................................................$ 23,938 $ 18,454
Health care cost trend ................................................................21,242 23,620
Discount rate assumption................................................................19,105 27,246
Return on plan assets ................................................................9,148 10,271
Other................................................................................................23,299 18,326
Unrecognized net actuarial loss ................................$ 96,732 $ 97,917
Restructuring Accruals
Over the past several years, we have recorded restructuring accruals as a result of facility closings and other cost management efforts. Cost management is one of our strategic objectives and we are continually seeking ways to lower our cost structure. The 2004 acquisition of NEBS resulted in even larger restructuring accruals as we combined the two companies and exited certain activities. These accruals primarily consist of employee termination benefits payable under our ongoing severance benefit plan. We record accruals for employee termination benefits when it is probable that a liability has been incurred and the amount of the liability is reasonably estimable. As such, judgment is involved in determining when it is appropriate to record restructuring accruals. Additionally, we are required to make estimates and assumptions in calculating the restructuring accruals, as many times employees choose to voluntarily leave the company prior to their termination date or they secure another position within the company. In these situations, the employees do not receive termination benefits. To the extent our assumptions and estimates differ from our actual costs, subsequent adjustments to restructuring accruals have been and will be required. We reversed previously recorded restructuring accruals of $2.6 million in 2007, $0.2 million in 2006 and $0.6 million in 2005 primarily as a result of fewer employees receiving severance benefits than originally estimated. Further information regarding our restructuring accruals can be found under the caption “Note 6: Restructuring accruals” of the Notes to Consolidated Financial Statements appearing in Item 8 of this report.

43
NEW ACCOUNTING PRONOUNCEMENTS
Information regarding the accounting pronouncements adopted during 2007 can be found under the caption: “Note 1: Significant accounting policies” of the Notes to Consolidated Financial Statements appearing in Item 8 of this report.
In December 2007, the FASB issued SFAS No. 141(R), Business Combinations, which modifies the required
accounting for business combinations. This guidance applies to all transactions or other events in which an entity (the acquirer) obtains control of one or more businesses (the acquiree), including those sometimes referred to as “true mergers” or “mergers of equals.” SFAS No. 141(R) changes the accounting for business acquisitions and will impact financial statements at the acquisition date and in subsequent periods. We are required to apply the new guidance to any business combinations completed on or after January 1, 2009.
In December 2007, the Securities and Exchange Commission (SEC) issued Staff Accounting Bulletin (SAB) No.
110. This guidance allows companies, in certain circumstances, to utilize a simplified method in determining the expected term of stock option grants when calculating the compensation expense to be recorded under SFAS No. 123(R), Share-Based Payment. The simplified method can be used after December 31, 2007 only if a company’s stock option exercise experience does not provide a reasonable basis upon which to estimate the expected option term. Through 2007, we utilized the simplified method to determine the expected option term, based upon the vesting and original contractual terms of the option. Beginning in 2008, we will utilize a more detailed calculation of the expected option term based on our historical option exercise data.
CAUTIONARY STATEMENT REGARDING FORWARD-LOOKING STATEMENTS
The Private Securities Litigation Reform Act of 1995 (the Reform Act) provides a “safe harbor” for forward-looking statements to encourage companies to provide prospective information. We are filing this cautionary statement in connection with the Reform Act. When we use the words or phrases “should result,” “believe,” “intend,” “plan,” “are expected to,” “targeted,” “will continue,” “will approximate,” “is anticipated,” “estimate,” “project” or similar expressions in this Annual Report on Form 10-K, in future filings with the SEC, in our press releases and in oral statements made by our representatives, they indicate forward-looking statements within the meaning of the Reform Act.
We want to caution you that any forward-looking statements made by us or on our behalf are subject to
uncertainties and other factors that could cause them to be incorrect. The material uncertainties and other factors known to us are discussed in Item 1A of this report and are incorporated into this Item 7 of the report as if fully stated herein. Although we have attempted to compile a comprehensive list of these important factors, we want to caution you that other factors may prove to be important in affecting future operating results. New factors emerge from time to time, and it is not possible for us to predict all of these factors, nor can we assess the impact each factor or combination of factors may have on our business.
You are further cautioned not to place undue reliance on those forward-looking statements because they speak
only of our views as of the date the statements were made. We undertake no obligation to publicly update or revise any forward-looking statements, whether as a result of new information, future events or otherwise.

44
Item 7A. Quantitative and Qualitative Disclosures About Market Risk.
We are exposed to changes in interest rates primarily as a result of the borrowing activities used to support our capital structure, maintain liquidity and fund business operations. We do not enter into financial instruments for speculative or trading purposes. During 2007, we used our committed lines of credit to fund working capital and debt service requirements. Additionally, we issued $200.0 million of fixed-rate long-term debt in May 2007. The nature and amount of debt outstanding can be expected to vary as a result of future business requirements, market conditions and other factors. As of December 31, 2007, our total debt was comprised of the following:
(in thousands) Carrying amount Fair value(1)
Weighted-average interest
rate
Long-term notes maturing December 2012 ................................$ 299,062 $ 261,000 5.00%
Long-term notes maturing October 2014................................ 274,584 229,625 5.13%
Long-term notes maturing June 2015 ................................ 200,000 199,250 7.38%
Amounts drawn on credit facilities ................................ 67,200 67,200 5.62%
Capital lease obligation maturing through September 2009................................................................ 3,194 3,194 10.41%
Total debt ................................................................$ 844,040 $ 760,269 5.67%
(1) Based on quoted market rates as of December 31, 2007, except for our capital lease obligations which are shown at carrying value.
Although the fair value of our long-term debt is less than its carrying amount, we do not anticipate settling our
outstanding debt at its reported fair value. We do not believe that settling our long-term notes is the best use of our financial resources at this time.
Based on the outstanding variable rate debt in our portfolio, a one percentage point increase in interest rates
would have resulted in additional interest expense of $0.5 million for 2007. We are exposed to changes in foreign currency exchange rates. Investments in and loans and advances to foreign
subsidiaries and branches, as well as the operations of these businesses, are denominated in foreign currencies, primarily the Canadian dollar. The effect of exchange rate changes is expected to have a minimal impact on our results of operations and cash flows, as our foreign operations represent a relatively small portion of our business.
Item 8. Financial Statements and Supplementary Data.
Report of Independent Registered Accounting Firm
To the Shareholders and Board of Directors of Deluxe Corporation:
In our opinion, the accompanying consolidated balance sheets and the related consolidated statements of
income, comprehensive income, shareholders’ equity (deficit) and cash flows present fairly, in all material respects,
the financial position of Deluxe Corporation and its subsidiaries at December 31, 2007 and December 31, 2006, and
the results of their operations and their cash flows for each of the three years in the period ended December 31, 2007
in conformity with accounting principles generally accepted in the United States of America. Also in our opinion, the
Company maintained, in all material respects, effective internal control over financial reporting as of December 31,
2007 based on criteria established in Internal Control - Integrated Framework issued by the Committee of
Sponsoring Organizations of the Treadway Commission (COSO). The Company’s management is responsible for
these financial statements, for maintaining effective internal control over financial reporting and for its assessment of
the effectiveness of internal control over financial reporting, included in the accompanying Management’s Report on

45
Internal Control over Financial Reporting. Our responsibility is to express opinions on these financial statements and
on the Company’s internal control over financial reporting based on our integrated audits (which were integrated
audits in 2007 and 2006). We conducted our audits in accordance with the standards of the Public Company
Accounting Oversight Board (United States). Those standards require that we plan and perform the audits to obtain
reasonable assurance about whether the financial statements are free of material misstatement and whether effective
internal control over financial reporting was maintained in all material respects. Our audits of financial statements
included examining, on a test basis, evidence supporting the amounts and disclosures in the financial statements,
assessing the accounting principles used and significant estimates made by management, and evaluating the overall
financial statement presentation. Our audit of internal control over financial reporting included obtaining an
understanding of internal control over financial reporting, assessing the risk that a material weakness exists, and
testing and evaluating the design and operating effectiveness of internal control based on the assessed risk. Our
audits also included performing such other procedures as we considered necessary in the circumstances. We believe
that our audits provide a reasonable basis for our opinions.
As discussed in Note 1 to the consolidated financial statements, the Company changed the manner in which it
accounts for share-based compensation in 2006 and the manner in which it accounts for the funded status of its
defined benefit pension and other postretirement benefit plans effective December 31, 2006. As discussed in Note 1
to the consolidated financial statements, effective January 1, 2007, the Company changed the manner in which it
accounts for uncertain income tax positions and the Company changed the measurement date it uses to measure the
funded status of its defined benefit pension and other postretirement benefit plans. A company’s internal control over financial reporting is a process designed to provide reasonable assurance
regarding the reliability of financial reporting and the preparation of financial statements for external purposes in accordance with generally accepted accounting principles. A company’s internal control over financial reporting includes those policies and procedures that (i) pertain to the maintenance of records that, in reasonable detail, accurately and fairly reflect the transactions and dispositions of the assets of the company; (ii) provide reasonable assurance that transactions are recorded as necessary to permit preparation of financial statements in accordance with generally accepted accounting principles, and that receipts and expenditures of the company are being made only in accordance with authorizations of management and directors of the company; and (iii) provide reasonable assurance regarding prevention or timely detection of unauthorized acquisition, use, or disposition of the company’s assets that could have a material effect on the financial statements.
Because of its inherent limitations, internal control over financial reporting may not prevent or detect misstatements. Also, projections of any evaluation of effectiveness to future periods are subject to the risk that controls may become inadequate because of changes in conditions, or that the degree of compliance with the policies or procedures may deteriorate.
PricewaterhouseCoopers LLP
Minneapolis, Minnesota
February 22, 2008

46
DELUXE CORPORATION
CONSOLIDATED BALANCE SHEETS
(in thousands, except share par value)
December 31, 2007 2006
ASSETS Current Assets: Cash and cash equivalents ......................................................................... $ 21,615 $ 11,599 Trade accounts receivable-net of allowances for uncollectible accounts... 85,687 103,014 Inventories and supplies ............................................................................ 32,279 42,854 Deferred income taxes............................................................................... 14,901 18,776 Cash held for customers ............................................................................ 23,285 13,758 Other current assets ................................................................................... 14,178 12,116
Total current assets............................................................................... 191,945 202,117 Long-Term Investments (including $3,025 of investments at fair value in 2007 – see Note 1) ........................................................................................ 36,013 35,985
Property, Plant, and Equipment-net of accumulated depreciation................... 139,245 142,247 Intangibles-net of accumulated amortization................................................... 148,487 178,537 Goodwill.......................................................................................................... 585,294 590,543 Other Non-Current Assets ............................................................................... 109,771 117,703
Total assets ....................................................................................... $ 1,210,755 $ 1,267,132
LIABILITIES AND SHAREHOLDERS’ EQUITY (DEFICIT) Current Liabilities: Accounts payable....................................................................................... $ 78,871 $ 78,489 Accrued liabilities...................................................................................... 149,763 146,823 Short-term debt.......................................................................................... 67,200 112,660 Long-term debt due within one year .......................................................... 1,754 326,531
Total current liabilities ......................................................................... 297,588 664,503 Long-Term Debt.............................................................................................. 775,086 576,590 Deferred Income Taxes ................................................................................... 10,194 16,315 Other Non-Current Liabilities.......................................................................... 86,780 75,397 Commitments and Contingencies (Notes 9, 13 and 14) Shareholders’ Equity (Deficit): Common shares $1 par value (authorized: 500,000 shares; issued: 2007 – 51,887; 2006 – 51,519) .................................................. 51,887 51,519 Additional paid-in capital .......................................................................... 65,796 50,101 Accumulated deficit................................................................................... (37,530) (125,420) Accumulated other comprehensive loss..................................................... (39,046) (41,873)
Total shareholders’ equity (deficit) ...................................................... 41,107 (65,673)
Total liabilities and shareholders’ equity (deficit) .......................... $ 1,210,755 $ 1,267,132
See Notes to Consolidated Financial Statements

47
DELUXE CORPORATION
CONSOLIDATED STATEMENTS OF INCOME
(in thousands, except per share amounts)
Year Ended December 31, 2007 2006 2005
Revenue ................................................................................................$ 1,606,367 $ 1,639,654 $ 1,716,294 Cost of goods sold................................................................ 586,561 613,279 608,361
Gross Profit ................................................................................................ 1,019,806 1,026,375 1,107,933 Selling, general and administrative expense................................ 756,034 787,960 803,633 Asset impairment loss ................................................................ — 44,698 — Net gain on sale of product line and assets held
for sale ................................................................................................ (3,773) (4,582) (539)
Operating Income................................................................ 267,545 198,299 304,839 Interest expense................................................................ (55,294) (56,661) (56,604) Other income................................................................ 5,403 903 2,499
Income Before Income Taxes ................................................................ 217,654 142,541 250,734 Income tax provision................................................................ 74,139 41,983 92,771
Income From Continuing Operations................................ 143,515 100,558 157,963 Income (Loss) From Discontinued Operations ................................ — 396 (442)
Net Income................................................................................................$ 143,515 $ 100,954 $ 157,521
Basic Earnings per Share: Income from continuing operations ...........................$ 2.79 $ 1.97 $ 3.12 Income (loss) from discontinued operations .............. — 0.01 (0.01) Basic earnings per share............................................. 2.79 1.98 3.11 Diluted Earnings per Share: Income from continuing operations ...........................$ 2.76 $ 1.95 $ 3.10 Income (loss) from discontinued operations .............. — 0.01 (0.01) Diluted earnings per share.......................................... 2.76 1.96 3.09 Cash Dividends per Share ................................................................$ 1.00 $ 1.30 $ 1.60
See Notes to Consolidated Financial Statements

48
DELUXE CORPORATION
CONSOLIDATED STATEMENTS OF COMPREHENSIVE INCOME
(in thousands)
Year Ended December 31, 2007 2006 2005
Net Income................................................................................................$ 143,515 $ 100,954 $ 157,521 Other Comprehensive Income, Net of Tax:
Reclassification of loss on derivative instruments from other comprehensive income to net income ................................ 2,281 2,559 2,576
Pension and postretirement benefit plans: Minimum pension liability adjustment................................ — (269) — Net actuarial loss arising during the period................................ (6,094) — — Reclassification of amounts from other comprehensive
income to net income: Amortization of prior service credit ................................ (2,468) — — Amortization of net actuarial loss ................................ 6,156 — —
Unrealized foreign currency translation adjustment................................ 3,263 255 114
Unrealized gains on securities: Unrealized holding gains arising during the year ................................ — 268 99 Less reclassification adjustments for gains included in net income........................................................................................... — (89) (146)
Other Comprehensive Income ............................................................... 3,138 2,724 2,643
Comprehensive Income................................................................$ 146,653 $ 103,678 $ 160,164
Related Tax (Expense) Benefit of Other Comprehensive Income Included in Above Amounts:
Reclassification of loss on derivative instruments from other comprehensive income to net income ................................$ (1,356) $ (1,493) $ (1,500)
Pension and postretirement benefit plans: Minimum pension liability adjustment................................ — 151 — Net actuarial loss arising during the period................................ 3,659 — — Reclassification of amounts from other comprehensive
income to net income: Amortization of prior service credit................................ 1,491 — — Amortization of net actuarial loss ................................ (3,708) — —
Unrealized gains on securities: Unrealized holding gains arising during the year ................................ — (191) (67) Less reclassification adjustments for gains included in net income........................................................................................... — 63 99
See Notes to Consolidated Financial Statements
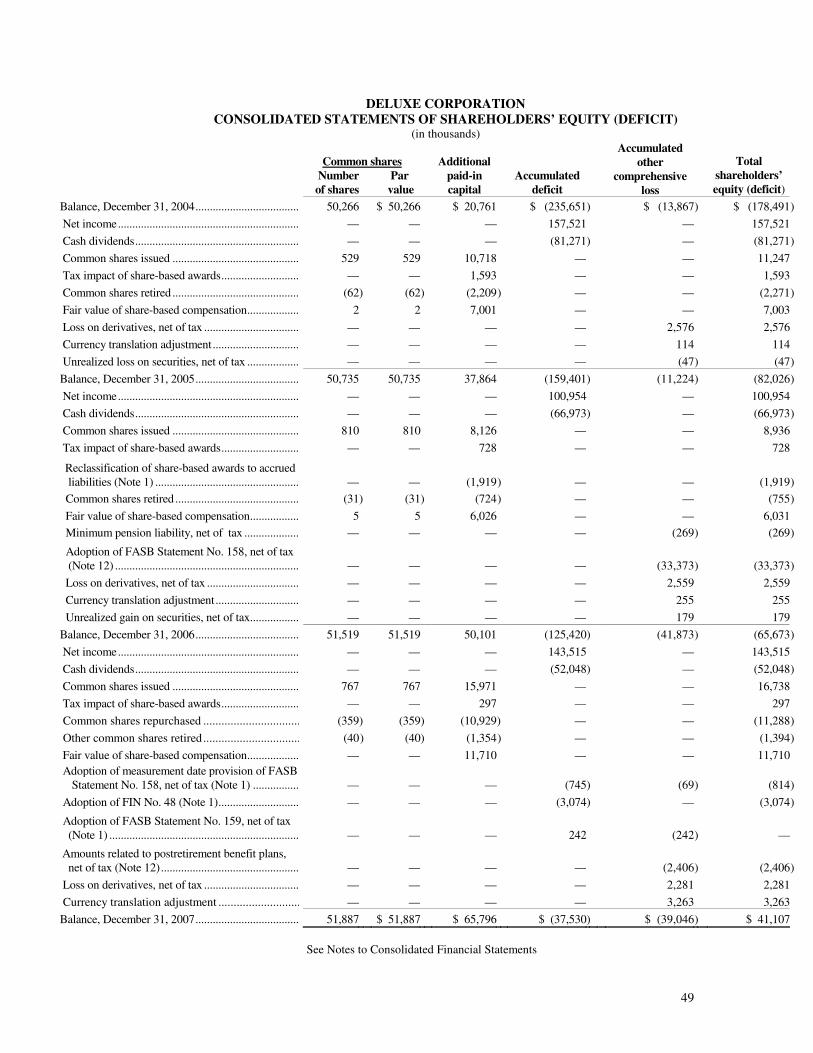
49
DELUXE CORPORATION CONSOLIDATED STATEMENTS OF SHAREHOLDERS’ EQUITY (DEFICIT)
(in thousands)
Common shares Number Par of shares value
Additional paid-in capital
Accumulated deficit
Accumulated other
comprehensive loss
Total shareholders’ equity (deficit)
Balance, December 31, 2004................................................................ 50,266 $ 50,266 $ 20,761 $ (235,651) $ (13,867) $ (178,491)
Net income................................................................ — — — 157,521 — 157,521
Cash dividends................................................................ — — — (81,271) — (81,271)
Common shares issued ................................................................ 529 529 10,718 — — 11,247
Tax impact of share-based awards................................ — — 1,593 — — 1,593
Common shares retired ................................................................ (62) (62) (2,209 ) — — (2,271)
Fair value of share-based compensation................................ 2 2 7,001 — — 7,003
Loss on derivatives, net of tax ................................................................ — — — — 2,576 2,576
Currency translation adjustment................................ — — — — 114 114
Unrealized loss on securities, net of tax ................................ — — — — (47) (47)
Balance, December 31, 2005................................................................ 50,735 50,735 37,864 (159,401) (11,224) (82,026)
Net income................................................................ — — — 100,954 — 100,954
Cash dividends................................................................ — — — (66,973) — (66,973)
Common shares issued ................................................................ 810 810 8,126 — — 8,936
Tax impact of share-based awards................................ — — 728 — — 728
Reclassification of share-based awards to accrued liabilities (Note 1) ................................................................ — — (1,919 ) — — (1,919)
Common shares retired ................................................................ (31) (31) (724 ) — — (755)
Fair value of share-based compensation................................ 5 5 6,026 — — 6,031
Minimum pension liability, net of tax ................................ — — — — (269) (269)
Adoption of FASB Statement No. 158, net of tax (Note 12) ................................................................................................ — — — — (33,373) (33,373)
Loss on derivatives, net of tax ................................................................ — — — — 2,559 2,559
Currency translation adjustment................................ — — — — 255 255
Unrealized gain on securities, net of tax................................ — — — — 179 179
Balance, December 31, 2006................................................................ 51,519 51,519 50,101 (125,420) (41,873) (65,673)
Net income................................................................ — — — 143,515 — 143,515
Cash dividends................................................................ — — — (52,048) — (52,048)
Common shares issued ................................................................ 767 767 15,971 — — 16,738
Tax impact of share-based awards................................ — — 297 — — 297
Common shares repurchased ................................ (359) (359) (10,929 ) — — (11,288)
Other common shares retired................................ (40) (40) (1,354 ) — — (1,394)
Fair value of share-based compensation................................ — — 11,710 — — 11,710
Adoption of measurement date provision of FASB Statement No. 158, net of tax (Note 1) ................................ — — — (745) (69) (814)
Adoption of FIN No. 48 (Note 1)................................ — — — (3,074) — (3,074)
Adoption of FASB Statement No. 159, net of tax (Note 1) ................................................................................................ — — — 242 (242) —
Amounts related to postretirement benefit plans, net of tax (Note 12)................................................................ — — — — (2,406) (2,406)
Loss on derivatives, net of tax ................................................................ — — — — 2,281 2,281
Currency translation adjustment ................................ — — — — 3,263 3,263
Balance, December 31, 2007................................................................ 51,887 $ 51,887 $ 65,796 $ (37,530) $ (39,046) $ 41,107
See Notes to Consolidated Financial Statements

50
DELUXE CORPORATION
CONSOLIDATED STATEMENTS OF CASH FLOWS (in thousands)
Year Ended December 31, 2007 2006 2005 Cash Flows from Operating Activities: Net income ............................................................................................................... $ 143,515 $ 100,954 $ 157,521
Adjustments to reconcile net income to net cash provided by operating activities of continuing operations: Net (income) loss from discontinued operations ........................................... — (396) 442 Depreciation .................................................................................................. 21,981 25,483 28,993 Amortization of intangibles ........................................................................... 45,910 59,387 79,355 Asset impairment loss.................................................................................... — 44,698 — Amortization of contract acquisition costs .................................................... 28,189 36,576 34,731 Employee share-based compensation expense............................................... 13,533 6,191 7,003 Deferred income taxes ................................................................................... 5,280 (37,375) (11,923) Other non-cash items, net .............................................................................. 15,097 4,018 12,671
Changes in assets and liabilities, net of effects of acquisitions, product line disposition and discontinued operations:
Trade accounts receivable....................................................................... 6,563 (2,154) (2,594) Inventories and supplies ......................................................................... (779) (505) (2,030) Other current assets ................................................................................ 3,785 28,921 (5,716) Non-current assets .................................................................................. (1,989) (7,153) 8,325 Accounts payable.................................................................................... 189 (7,852) (5,035) Contract acquisition payments................................................................ (14,230) (17,029) (70,169) Other accrued and other non-current liabilities ...................................... (22,328) 5,577 (53,295)
Net cash provided by operating activities of continuing operations ...................... 244,716 239,341 178,279
Cash Flows from Investing Activities: Purchases of capital assets....................................................................................... (32,328) (41,324) (55,653) Payments for acquisitions, net of cash acquired ...................................................... (2,316) (16,521) (2,888) Purchases of marketable securities .......................................................................... (1,057,460) — — Proceeds from sales of marketable securities........................................................... 1,057,460 — — Proceeds from sale of product line and facilities ..................................................... 19,214 9,247 2,618 Proceeds from redemptions of life insurance policies ............................................. — 15,513 — Other........................................................................................................................ 4,459 (89) 6
Net cash used by investing activities of continuing operations ............................. (10,971) (33,174) (55,917)
Cash Flows from Financing Activities: Net payments on short-term debt............................................................................ (45,460) (99,686) (51,654) Proceeds from issuance of long-term debt, net of debt issuance costs.................... 196,329 — — Payments on long-term debt ................................................................................... (326,582) (51,362) (26,338) Change in book overdrafts...................................................................................... (3,006) 3,285 5,200 Proceeds from issuing shares under employee plans .............................................. 15,923 8,936 11,247 Excess tax benefit from share-based employee awards........................................... 1,242 1,213 — Payments for common shares repurchased ............................................................. (11,288) — — Cash dividends paid to shareholders ...................................................................... (52,048) (66,973) (81,271)
Net cash used by financing activities of continuing operations ........................... (224,890) (204,587) (142,816)
Effect of Exchange Rate Change on Cash ................................................................... 1,161 158 202 Cash Provided (Used) by Operating Activities of Discontinued Operations ............... — 23 (4,152) Cash Provided by Investing Activities – Net Proceeds from Sale ............................... — 2,971 15,779
Net Change in Cash and Cash Equivalents.................................................................. 10,016 4,732 (8,625) Cash and Cash Equivalents: Beginning of Year ......................................... 11,599 6,867 15,492
End of Year ................................................... $ 21,615 $ 11,599 $ 6,867
See Notes to Consolidated Financial Statements
51
DELUXE CORPORATION NOTES TO CONSOLIDATED FINANCIAL STATEMENTS
Note 1: Significant accounting policies
Consolidation – The consolidated financial statements include the accounts of Deluxe Corporation and all majority owned subsidiaries. All intercompany accounts, transactions and profits have been eliminated.
Use of estimates – We have prepared the accompanying consolidated financial statements in conformity with accounting principles generally accepted in the United States of America. In this process, it is necessary for us to make certain assumptions and estimates affecting the amounts reported in the consolidated financial statements and related notes. These estimates and assumptions are developed based upon all available information. However, actual results can differ from assumed and estimated amounts.
Foreign currency translation – The financial statements of our foreign subsidiaries are measured in the
respective subsidiaries’ functional currencies, primarily Canadian dollars, and are translated into U.S. dollars. Assets and liabilities are translated using the exchange rates in effect at the balance sheet date. Revenue and expenses are translated at the average exchange rates during the year. The resulting translation gains and losses are reflected in accumulated other comprehensive loss in the shareholders’ equity (deficit) section of our consolidated balance sheets. Foreign currency transaction gains and losses are recorded in other income in our consolidated statements of income.
Cash and cash equivalents – We consider all cash on hand and other highly liquid investments with original
maturities of three months or less to be cash and cash equivalents. The carrying amounts reported in the consolidated balance sheets for cash and cash equivalents approximate fair value. As a result of our cash management system, checks issued by us but not presented to the banks for payment may create negative book cash balances. Such negative balances are included in accounts payable and totaled $13.5 million as of December 31, 2007 and $16.5 million as of December 31, 2006.
Marketable securities – Marketable securities which were purchased and sold during 2007 consisted of investments in tax-exempt mutual funds. They were classified as available for sale and were carried at fair value on the consolidated balance sheet, based on quoted prices in active markets for identical assets. The cost of securities sold was determined using the specific identification method.
Trade accounts receivable – Trade accounts receivable are initially recorded at fair value upon the sale of goods or services to customers. They are stated net of allowances for uncollectible accounts, which represent estimated losses resulting from the inability of customers to make the required payments. When determining the allowances for uncollectible accounts, we take several factors into consideration including the overall composition of accounts receivable aging, our prior history of accounts receivable write-offs, the type of customer and our day-to-day knowledge of specific customers. Changes in the allowances for uncollectible accounts are included in selling, general and administrative (SG&A) expense in our consolidated statements of income. The point at which uncollected accounts are written off varies by type of customer, but does not exceed one year from the date of sale.
Inventories and supplies – Inventories and supplies are stated at the lower of average cost or market. Average cost approximates computation on a first-in, first-out basis. Supplies consist of items not used directly in the production of goods, such as maintenance and janitorial supplies utilized in the production area.
Cash held for customers – As part of our Canadian payroll services business, we collect funds from clients to pay their payroll and related taxes. We hold these funds temporarily until payments are remitted to the clients’ employees and the appropriate taxing authorities. These funds are reported as cash held for customers in our consolidated balance sheets. The corresponding liability for these obligations is included in accrued liabilities in our consolidated balance sheets.
Long-term investments – Long-term investments consist primarily of cash surrender values of life insurance contracts. The carrying amounts reported in the consolidated balance sheets for these investments approximate fair

52
value. Additionally, long-term investments include investments in domestic mutual funds totaling $3.0 million as of December 31, 2007 and $3.3 million as of December 31, 2006. Effective January 1, 2007, we elected to report these investments using the fair value option under Statement of Financial Accounting Standards (SFAS) No. 159, The
Fair Value Option for Financial Assets and Financial Liabilities. As such, these investments were reported as trading securities as of December 31, 2007, and unrealized gains and losses generated during 2007 were reflected in other income in our consolidated statement of income. As of December 31, 2006, the mutual fund investments were classified as available for sale securities, and unrealized gains and losses, net of tax, were reported in accumulated other comprehensive loss in the shareholders’ equity (deficit) section of our consolidated balance sheet. The investments are carried at fair value, based on quoted prices in active markets for identical assets. Changes in the fair value of these investments have historically been insignificant and were insignificant during 2007. Realized gains and losses and permanent declines in value are included in other income in our consolidated statements of income. The cost of securities sold is determined using the average cost method.
Property, plant and equipment – Property, plant and equipment, including leasehold and other improvements
that extend an asset’s useful life or productive capabilities, are stated at historical cost. Buildings are assigned 40-year lives and machinery and equipment are generally assigned lives ranging from one to 11 years, with a weighted-average life of 8.3 years as of December 31, 2007. Buildings, machinery and equipment are generally depreciated using accelerated methods. Leasehold and building improvements are depreciated on the straight-line basis over the estimated useful life of the property or the life of the lease, whichever is shorter. Maintenance and repairs are expensed as incurred. Gains or losses resulting from the disposition of property, plant and equipment are included in SG&A expense in the consolidated statements of income, with the exception of facility sales. Such sales are reported separately in the consolidated statements of income.
Intangibles – Intangible assets are stated at historical cost. Amortization expense is generally determined on
the straight-line basis over periods ranging from one to 15 years, with a weighted-average life of 5.8 years as of December 31, 2007. Customer lists and distributor contracts are amortized using accelerated methods. Certain trade name assets have been assigned indefinite lives. As such, these assets are not amortized, but are subject to impairment testing on at least an annual basis. Gains or losses resulting from the disposition of intangibles are included in SG&A expense in the consolidated statements of income.
We capitalize costs of software developed or obtained for internal use, including website development costs,
once the preliminary project stage has been completed, management commits to funding the project and it is probable that the project will be completed and the software will be used to perform the function intended. Capitalized costs include only (1) external direct costs of materials and services consumed in developing or obtaining internal-use software, (2) payroll and payroll-related costs for employees who are directly associated with and who devote time to the internal-use software project, and (3) interest costs incurred, when significant, while developing internal-use software. Costs incurred in populating websites with information about the company or products are expensed as incurred. Capitalization of costs ceases when the project is substantially complete and ready for its intended use. The carrying value of internal-use software is reviewed in accordance with our policy on impairment of long-lived assets and amortizable intangibles.
Impairment of long-lived assets and amortizable intangibles – We evaluate the recoverability of property,
plant, equipment and amortizable intangibles not held for sale whenever events or changes in circumstances indicate that an asset’s carrying amount may not be recoverable. Such circumstances could include, but are not limited to, (1) a significant decrease in the market value of an asset, (2) a significant adverse change in the extent or manner in which an asset is used or in its physical condition, or (3) an accumulation of costs significantly in excess of the amount originally expected for the acquisition or construction of an asset. We measure the carrying amount of the asset against the estimated undiscounted future cash flows associated with it. If the sum of the expected future net cash flows is less than the carrying value of the asset being evaluated, an impairment loss would be recognized. The impairment loss would be calculated as the amount by which the carrying value of the asset exceeds the fair value of the asset. As quoted market prices are not available for the majority of our assets, the estimate of fair value is based on various valuation techniques, including the discounted value of estimated future cash flows.
We evaluate the recoverability of property, plant, equipment and intangibles held for sale by comparing the
asset’s carrying amount with its fair value less costs to sell. Should the fair value less costs to sell be less than the

53
carrying value of the long-lived asset, an impairment loss would be recognized. The impairment loss would be calculated as the amount by which the carrying value of the asset exceeds the fair value of the asset less costs to sell.
The evaluation of asset impairment requires us to make assumptions about future cash flows over the life of
the asset being evaluated. These assumptions require significant judgment and actual results may differ from assumed and estimated amounts.
Impairment of non-amortizable intangibles and goodwill – In accordance with SFAS No. 142, Goodwill and
Other Intangible Assets, we evaluate the carrying value of non-amortizable trade names and goodwill during the third quarter of each year and between annual evaluations if events occur or circumstances change that would indicate a possible impairment. Such circumstances could include, but are not limited to, (1) a significant adverse change in legal factors or in business climate, (2) unanticipated competition, or (3) an adverse action or assessment by a regulator.
We compare the carrying amount of non-amortizable trade names to their estimated fair values. Should the
estimated fair value be less than the carrying value of the asset being evaluated, an impairment loss would be recognized. The impairment loss would be calculated as the amount by which the carrying value of the asset exceeds the fair value of the asset. The estimate of fair value is based on a relief from royalty method which calculates the cost savings associated with owning rather than licensing the trade name. An assumed royalty rate is applied to forecasted revenue and the resulting cash flows are discounted.
When evaluating whether goodwill is impaired, we compare the fair value of the reporting unit to which the
goodwill is assigned to its carrying amount. In calculating fair value, we use the income approach. The income approach is a valuation technique under which we estimate future cash flows using the reporting units’ financial forecasts from the perspective of an unrelated market participant. Future estimated cash flows are discounted to their present value to calculate fair value. For reasonableness, the summation of our reporting units’ fair values is compared to our market capitalization. If the carrying amount of a reporting unit exceeds its fair value, then the amount of the impairment loss must be measured. The impairment loss would be calculated by comparing the implied fair value of the reporting unit goodwill to its carrying amount. In calculating the implied fair value of goodwill, the fair value of the reporting unit is allocated to all of the other assets and liabilities of that unit based on their fair values. The excess of the fair value of a reporting unit over the amount assigned to its other assets and liabilities is the implied fair value of goodwill. An impairment loss would be recognized when the carrying amount of goodwill exceeds its implied fair value. The evaluations performed during 2007, 2006 and 2005 did not identify any goodwill impairment losses.
Contract acquisition costs – We record contract acquisition costs when we sign or renew certain contracts
with our financial institution clients. These costs, which are essentially pre-paid product discounts, consist of cash payments or accruals related to amounts owed to financial institution clients by our Financial Services segment. Contract acquisition costs are generally amortized as reductions of revenue on the straight-line basis over the related contract term. Currently, these amounts are being amortized over periods ranging from one to 10 years, with a weighted-average life of 5.6 years as of December 31, 2007. Whenever events or changes occur that impact the related contract, including significant declines in the anticipated profitability, we evaluate the carrying value of the contract acquisition costs to determine if impairment has occurred. Should a financial institution cancel a contract prior to the agreement's termination date, or should the volume of orders realized through a financial institution fall below contractually-specified minimums, we generally have a contractual right to a refund of the remaining unamortized contract acquisition costs. These costs are included in other non-current assets in the consolidated balance sheets.
Advertising costs – Deferred advertising costs include materials, printing, labor and postage costs related to direct response advertising programs of our Direct Checks and Small Business Services segments. These costs are amortized as SG&A expense over periods (not exceeding 18 months) that correspond to the estimated revenue streams of the individual advertisements. The actual revenue streams are analyzed at least annually to monitor the propriety of the amortization periods. Judgment is required in estimating the future revenue streams, especially with regard to check re-orders which can span an extended period of time. Significant changes in the actual revenue streams would require the amortization periods to be modified, thus impacting our results of operations during the

54
period in which the change occurred and in subsequent periods. For our Direct Checks segment, approximately 82% of the costs of individual advertisements are expensed within six months of the advertisement. The majority of the deferred advertising costs of our Small Business Services segment are fully amortized within six months of the advertisement. Deferred advertising costs are included in other non-current assets in the consolidated balance sheets, as portions are amortized over periods in excess of one year.
Non-direct response advertising projects are expensed the first time the advertising takes place. Catalogs
provided to financial institution clients of the Financial Services segment are accounted for as prepaid assets until they are shipped to financial institutions. The total amount of advertising expense for continuing operations was $123.3 million in 2007, $118.1 million in 2006 and $135.2 million in 2005.
Restructuring accruals – Over the past several years, we have recorded restructuring accruals as a result of
facility closings and cost management efforts. These accruals primarily consist of employee termination benefits payable under our ongoing severance benefit plan. We record accruals for employee termination benefits when it is probable that a liability has been incurred and the amount of the liability is reasonably estimable. As such, judgment is involved in determining when it is appropriate to record restructuring accruals. Additionally, we are required to make estimates and assumptions in calculating the restructuring accruals, as many times employees choose to voluntarily leave the company prior to their termination date or they secure another position within the company. In these situations, the employees do not receive termination benefits. To the extent our assumptions and estimates differ from actual employee behavior, subsequent adjustments to restructuring accruals have been and will be required. Restructuring accruals are included in accrued liabilities and other non-current liabilities in our consolidated balance sheets.
Deferred income taxes – Deferred income taxes result from temporary differences between the financial
reporting basis of assets and liabilities and their respective tax reporting bases. Current deferred tax assets and liabilities are netted in the consolidated balance sheets, as are long-term deferred tax assets and liabilities. Future tax benefits are recognized to the extent that realization of such benefits is more likely than not.
Derivative financial instruments – In the past, we have used derivative financial instruments to hedge interest rate exposures related to the issuance of long-term debt (see Note 8). We do not use derivative financial instruments for speculative or trading purposes.
We recognize all derivative financial instruments in the consolidated financial statements at fair value
regardless of the purpose or intent for holding the instrument. Changes in the fair value of derivative financial instruments are recognized periodically either in income or in shareholders’ equity (deficit) as a component of accumulated other comprehensive loss, depending on whether the derivative financial instrument qualifies for hedge accounting, and if so, whether it qualifies as a fair value hedge or a cash flow hedge. Generally, changes in fair values of derivatives accounted for as fair value hedges are recorded in income along with the portion of the change in the fair value of the hedged items that relate to the hedged risk. Changes in fair values of derivatives accounted for as cash flow hedges, to the extent they are effective as hedges, are recorded in accumulated other comprehensive loss net of tax. We present amounts used to settle cash flow hedges as financing activities in our consolidated statements of cash flows. Changes in fair values of derivatives not qualifying as hedges are reported in income.
Revenue recognition – We recognize revenue when (1) persuasive evidence of an arrangement exists, (2) delivery has occurred or services have been rendered, (3) the sales price is fixed or determinable, and (4) collectibility is reasonably assured. The majority of our revenues are generated from the sale of products for which revenue is recognized upon shipment or customer receipt, based upon the transfer of title. Our services, which account for the remainder of our revenue, consist primarily of fraud prevention and payroll services. We recognize these service revenues as the services are provided.
Revenue includes amounts billed to customers for shipping and handling and pass-through costs, such as
marketing materials for which our financial institution clients reimburse us. Costs incurred for shipping and handling and pass-through costs are reflected in cost of goods sold. While we do provide our customers with a right of return, revenue is not deferred. Rather, a reserve for sales returns is recorded in accordance with SFAS No. 48, Revenue
Recognition When Right of Return Exists, based on significant historical experience.

55
At times, a financial institution client may terminate its contract with us prior to the end of the contract term.
In many of these cases, the financial institution is contractually required to remit a contract termination payment. Such payments are recorded as revenue when the termination agreement is executed, provided that we have no further service or contractual obligations, and collection of the funds is assured.
Revenue is presented in the consolidated statements of income net of rebates, discounts, amortization of contract acquisition costs and sales tax. We enter into contractual agreements with financial institution clients for rebates on certain products we sell. We record these amounts as reductions of revenue in the consolidated statements of income and as accrued liabilities in the consolidated balance sheets when the related revenue is recorded. At times we may also sell products at discounted prices or provide free products to customers when they purchase a specified product. Discounts are recorded as reductions of revenue when the related revenue is recorded. The cost of free products is recorded as cost of goods sold when the revenue for the related purchase is recorded. Additionally, reported revenue for our Financial Services segment does not reflect the full retail price paid by end-consumers to their financial institutions. Revenue reflects the amounts paid to us by our financial institution clients.
Employee share-based compensation – On January 1, 2006, we adopted SFAS No. 123(R), Share-Based
Payment, using the modified prospective method. Prior to this, we were applying the fair value provisions of SFAS No. 123, Accounting for Stock-Based Compensation, in our accounting for employee share-based compensation awards. We adopted SFAS No. 123 on January 1, 2004, using the modified prospective method of adoption described in SFAS No. 148, Accounting for Stock-Based Compensation – Transition and Disclosure. As such, our results of operations for all periods presented include compensation expense for all outstanding employee share-based awards. The adoption of SFAS No. 123(R) had the following impacts on our consolidated financial statements:
• Effective January 1, 2006, a portion of our restricted stock unit awards were reclassified from shareholders’ deficit to accrued liabilities in our consolidated balance sheet. Certain of these awards may be settled in cash if an employee voluntarily chooses to leave the company. Under the provisions of SFAS No. 123(R), these awards must be classified as liabilities in the consolidated balance sheet and must be re-measured at fair value as of each balance sheet date. The amount reclassified as of January 1, 2006 totaled $1.9 million, which approximated the fair value of these awards on their grant dates. The re-measurement of these awards, including the effect of the change in accounting principle in 2006, resulted in a $14,000 decrease in SG&A expense in 2007 and a $0.6 million decrease in SG&A expense in 2006. The cumulative effect of the change in accounting principle in 2006 was not presented separately in the consolidated statement of income, as it was not material.
• We modified our method of recognizing compensation expense for share-based awards granted to individuals achieving “qualified retiree” status prior to completion of the options’ normal vesting period. Previously, we recognized expense for such awards over their applicable vesting period, with cost recognition accelerated if and when an employee retired with qualified retiree status. Upon adoption of SFAS No. 123(R), we are required to recognize the entire expense for these awards over the period from the date of grant until the date an employee is expected to achieve qualified retiree status under the terms of the applicable award agreement. This change is applied only to new awards granted after January 1, 2006. The terms of our awards granted subsequent to January 1, 2006 require that the compensation committee of our board of directors determine on an individual basis whether an employee is a qualified retiree upon their termination of employment with the company. As such, we do not accelerate the recognition of expense on these awards until the compensation committee makes this determination. If we had applied this expense recognition methodology to awards granted prior to January 1, 2006, it would have increased diluted earnings per share $0.01 for 2007 and 2006. This methodology would have had no impact on diluted earnings per share for 2005.
• In November 2005, the Financial Accounting Standards Board (FASB) issued FASB Staff Position (FSP) No. FAS 123(R)-3, Transition Election Related to Accounting for the Tax Effects of Share-Based Payment Awards. This FSP provides an alternative method for calculating the net excess tax benefits available to absorb tax deficiencies as required under SFAS No. 123(R). We elected to utilize the transition method outlined in this FSP

56
in accounting for the income tax consequences of employee share-based compensation awards. Upon the adoption of SFAS No. 123(R), we had a positive income tax windfall pool.
• SFAS No. 123(R) requires that the cash retained as a result of the tax deductibility of employee share-based awards be presented as a component of cash flows from financing activities in the consolidated statement of cash flows. In prior periods, we reported these amounts as a component of cash flows from operating activities. For 2005, $1.6 million was included in cash provided by operating activities of continuing operations for the excess tax benefit of employee share-based awards.
The adoption of SFAS No. 123(R) had the following dollar impacts on our 2006 consolidated statement of
income and our consolidated statement of cash flows:
(in thousands, except per share amounts) Increase
Income before income taxes................................................................ $ 649
Income from continuing operations ................................ 435
Net income............................................................................................... 435
Earnings per share – basic................................................................ 0.01
Earnings per share – diluted ................................................................ —
Cash provided by financing activities ................................ 1,213
Earnings per share – Basic earnings per share is based on the weighted-average number of common shares outstanding during the year. Diluted earnings per share is based on the weighted-average number of common shares outstanding during the year, adjusted to give effect to potential common shares such as stock options, restricted stock units and unvested restricted stock issued under our stock incentive plan (see Note 10). When determining the denominator for the diluted earnings per share calculation under the treasury stock method, we exclude from assumed proceeds the impact of pro forma deferred tax assets.
Comprehensive income – Comprehensive income includes charges and credits to shareholders’ equity (deficit) that are not the result of transactions with shareholders. Our total comprehensive income consists of net income, gains and losses on derivative instruments, changes in the funded status and amortization of amounts related to our pension and postretirement benefit plans, and foreign currency translation adjustments. In previous years, total comprehensive income also included minimum pension liability adjustments and unrealized gains and losses on securities. These items are no longer included in comprehensive income due to the adoption of SFAS No. 158, Employers’ Accounting for Defined Benefit Pension and Other Postretirement Plans, and SFAS No. 159, The Fair
Value Option for Financial Assets and Financial Liabilities. The items of comprehensive income, with the exception of net income, are included in accumulated other comprehensive loss in our consolidated balance sheets and statements of shareholders’ equity (deficit).

57
Recently adopted accounting pronouncements – On January 1, 2007, we adopted FASB Interpretation (FIN) No. 48, Accounting for Uncertainty in Income Taxes. The new standard defines the threshold for recognizing the benefits of tax return positions in the financial statements as “more-likely-than-not” to be sustained by the taxing authorities based solely on the technical merits of the position. If the recognition threshold is met, the tax benefit is measured and recognized as the largest amount of tax benefit that in our judgment is greater than 50% likely to be realized. The adoption of FIN No. 48 impacted our consolidated balance sheet as of January 1, 2007 as follows:
(in thousands)
Increase/(decrease)
Current deferred income taxes ..............................$ 59
Goodwill ............................................................... 576
Other non-current assets................................ 330
Accrued liabilities ................................................. (8,332)
Other non-current liabilities ................................ 20,139
Non-current deferred income taxes ....................... (7,768)
Accumulated deficit .............................................. 3,074 The total amount of unrecognized tax benefits as of January 1, 2007 was $16.2 million, excluding accrued
interest and penalties. If the unrecognized tax benefits were recognized in our consolidated financial statements, $8.6 million would affect our effective tax rate. Interest and penalties recorded for uncertain tax positions were included in our provision for income taxes in the consolidated statements of income prior to the adoption of FIN No. 48, and we continue this classification subsequent to the adoption of FIN No. 48. As of January 1, 2007, $4.7 million of interest and penalties was accrued, excluding the tax benefits of deductible interest.
On January 1, 2007, we adopted the measurement date provision of SFAS No. 158, Employers’ Accounting for
Defined Benefit Pension and Other Postretirement Plans. SFAS No. 158 requires companies to measure the funded status of a plan as of the date of its year-end balance sheet. We historically used a September 30 measurement date. To transition to a December 31 measurement date, we completed plan measurements for our postretirement benefit and pension plans as of December 31, 2006. In accordance with SFAS No. 158, postretirement benefit expense for the period from October 1, 2006 through December 31, 2006, as calculated based on the September 30, 2006 measurement date, was recorded as an increase to accumulated deficit of $0.7 million, net of tax, as of January 1, 2007. Additionally, we adjusted our postretirement assets and liabilities to reflect the funded status of the plans, as calculated based on the December 31, 2006 measurement date. This adjustment, along with the postretirement benefit expense for the period from October 1, 2006 through December 31, 2006, resulted in an increase in other comprehensive loss of $0.1 million, net of tax, as of January 1, 2007. Postretirement benefit expense reflected in our 2007 consolidated statement of income is based on the December 31, 2006 measurement date. Further information regarding the expense included in our consolidated statements of income can be found in Note 12: Pension and other postretirement benefits.
On January 1, 2007, we adopted SFAS No. 157, Fair Value Measurements. This new standard addresses how
companies should measure fair value when they are required to use a fair value measure for recognition or disclosure purposes under generally accepted accounting principles (GAAP) in the United States. In February 2008, the FASB issued FSP No. FAS 157-2, Effective Date of FASB Statement No. 157, which delays the effective date of SFAS No. 157 for nonfinancial assets and nonfinancial liabilities, except for items that are recognized or disclosed at fair value in the financial statements on a recurring basis. Because we adopted SFAS No. 157 on January 1, 2007, the delay outlined in FSP No. FAS 157-2 does not apply to us.
On a recurring basis we are required to measure the following assets at fair value: available for sale marketable
securities; a long-term mutual fund investment accounted for under the fair value option of SFAS No. 159, The Fair
Value Option for Financial Assets and Financial Liabilities; plan assets of our postretirement benefit and pension plans; indefinite-lived intangible assets; and goodwill. The fair values of marketable securities, the long-term mutual fund investment and substantially all of the plan assets of our postretirement benefit and pension plans are based on quoted prices in active markets for identical assets. Fair values for indefinite-lived intangible assets and goodwill are calculated as discussed in our accounting policy regarding impairment of non-amortizable intangibles and goodwill. During 2007,

58
only the required annual impairment analysis of indefinite-lived intangibles and goodwill was performed, as there were no indicators of impairment during the year. In addition, for disclosure purposes, we are required to measure the fair value of our outstanding debt, with the exception of our capital lease obligation. The fair value of debt is determined using quoted prices in active markets for identical liabilities. Information regarding the fair value of debt can be found in Note 13: Debt.
No marketable securities were held as of December 31, 2007. Information regarding the fair value of plan assets
of our postretirement benefit and pension plans can be found in Note 12: Pension and other postretirement benefits. Other assets measured at fair value during 2007 were as follows:
Fair value measurements using
(in thousands)
Fair value as of
measurement date
Quoted prices in active markets
for identical assets (Level 1)
Significant other
observable inputs (Level 2)
Significant unobservable
inputs (Level 3)
Long-term mutual fund investment ................................
$ 3,025 $ 3,025 $ — $ —
Indefinite-lived trade names................................
74,503 — — 74,503
Goodwill(1) ................................ 2,494,281 — — 2,494,281
(1) Fair value represents the fair value of reporting units to which goodwill is assigned. Because the fair value of our reporting units was greater than the carrying value of our reporting units, the implied fair value of goodwill was not required to be calculated.
Gains of $0.2 million for our long-term mutual fund investment were included in SG&A expense during 2007.
No gains or losses related to our other fair value measurements were recorded during 2007. Changes during 2007 in the fair value of assets valued using unobservable inputs we developed, known as Level
3 fair value measurements under SFAS No. 157, Fair Value Measurements, were as follows:
(in thousands)
Indefinite-lived
intangibles Goodwill
Total
Fair value, December 31, 2006................................................................$ 73,012 $ 1,939,403 $ 2,012,415
Unrealized gain(1)................................................................................... 1,491 554,878 556,369
Fair value, December 31, 2007................................................................$ 74,503 $ 2,494,281 $ 2,568,784
(1) The change in fair value is not reflected in our consolidated financial statements.
On January 1, 2007, we adopted SFAS No. 159, The Fair Value Option for Financial Assets and Financial
Liabilities. This new standard permits companies to choose to measure many financial instruments and certain other items at fair value that were not previously required to be measured at fair value. We have elected the fair value option for a mutual fund investment previously classified as available for sale. This investment was carried at fair value on our consolidated balance sheets. However, under the fair value option, unrealized gains and losses are now reflected in our consolidated statements of income, as opposed to being recorded in accumulated other comprehensive loss on the consolidated balance sheets. This investment corresponds to our liability under an officers’ deferred compensation plan. This deferred compensation plan is not available to new participants and is fully funded by the mutual fund investment. The liability under the plan equals the fair value of the mutual fund investment, so changes in the value of both the plan asset and the liability are now netted in the consolidated statements of income. This mutual fund investment had a fair value of $3.0 million as of December 31, 2007 and $3.3 million as of December 31, 2006, and is included in long-term investments on our consolidated balance sheets. The long-term investments caption on our consolidated balance sheet also includes life insurance policies which are recorded at their cash surrender values. The fair value of the mutual fund investment is determined using quoted prices in active markets for identical assets. Changes in the fair value of this investment have historically been

59
insignificant and were insignificant during 2007. As required by SFAS No. 159, the cumulative unrealized gain related to this mutual fund investment of $0.2 million, net of tax, as of January 1, 2007, was reclassified from accumulated other comprehensive loss to accumulated deficit as of January 1, 2007. The unrealized pre-tax gain on this investment as of January 1, 2007 was $0.4 million.
Accounting pronouncements not yet adopted – In December 2007, the FASB issued SFAS No. 141(R),
Business Combinations, which modifies the required accounting for business combinations. This guidance applies to all transactions or other events in which an entity (the acquirer) obtains control of one or more businesses (the acquiree), including those sometimes referred to as “true mergers” or “mergers of equals.” SFAS No. 141(R) changes the accounting for business acquisitions and will impact financial statements at the acquisition date and in subsequent periods. We are required to apply the new guidance to any business combinations completed on or after January 1, 2009.
In December 2007, the Securities and Exchange Commission (SEC) issued Staff Accounting Bulletin (SAB) No.
110. This guidance allows companies, in certain circumstances, to utilize a simplified method in determining the expected term of stock option grants when calculating the compensation expense to be recorded under SFAS No. 123(R), Share-Based Payment. The simplified method can be used after December 31, 2007 only if a company’s stock option exercise experience does not provide a reasonable basis upon which to estimate the expected option term. Through 2007, we utilized the simplified method to determine the expected option term, based upon the vesting and original contractual terms of the option. Beginning in 2008, we will utilize a more detailed calculation of the expected option term based on our historical option exercise data.
Note 2: Supplementary balance sheet and cash flow information
Marketable securities – Marketable securities purchased and sold during 2007 consisted of investments in tax-exempt mutual funds. The funds were comprised of variable rate demand notes, municipal bonds and notes, and commercial paper. The cost of these investments equaled their fair value due to the short-term duration of the underlying investments. No realized or unrealized gains or losses on marketable securities were generated during 2007. Purchases of and proceeds from sales of available for sale marketable securities were $1,057.5 million for 2007. We held no marketable securities at December 31, 2007.
Trade accounts receivable – Net trade accounts receivable was comprised of the following at December 31:
(in thousands) 2007 2006
Trade accounts receivable................................................................$ 92,881 $ 111,203
Allowances for uncollectible accounts................................(7,194) (8,189)
Trade accounts receivable – net................................$ 85,687 $ 103,014
Changes in the allowances for uncollectible accounts were as follows:
(in thousands) 2007 2006 2005
Balance, beginning of year ................................................................$ 8,189 $ 7,903 $ 5,199
Bad debt expense ................................................................8,448 8,956 8,808
Write-offs, net of recoveries ................................ (9,443) (8,670) (6,104)
Balance, end of year ................................................................$ 7,194 $ 8,189 $ 7,903

60
Inventories and supplies – Inventories and supplies were comprised of the following at December 31:
(in thousands) 2007 2006
Raw materials ................................................................$ 6,803 $ 7,663
Semi-finished goods................................................................10,886 13,761
Finished goods................................................................ 8,499 11,257
Total inventories................................................................26,188 32,681
Supplies, primarily production................................ 6,091 10,173
Inventories and supplies................................................................$ 32,279 $ 42,854
Property, plant and equipment – Property, plant and equipment was comprised of the following at December 31:
(in thousands) 2007 2006
Land and land improvements ................................$ 35,895 $ 35,593
Buildings and building improvements ................................133,852 132,771
Machinery and equipment................................................................296,240 291,838
Total................................................................ 465,987 460,202
Accumulated depreciation................................................................(326,742) (317,955)
Property, plant and equipment – net ................................$ 139,245 $ 142,247
Intangibles – Intangibles were comprised of the following at December 31:
2007 2006
(in thousands)
Gross carrying amount
Accumulated amortization
Net carrying amount
Gross carrying amount
Accumulated amortization
Net carrying amount
Indefinite-lived:
Trade names ................................$ 59,400 $ — $ 59,400 $ 59,400 $ — $ 59,400
Amortizable intangibles:
Internal-use software ................................ 278,802 (243,483 ) 35,319 264,847 (228,719 ) 36,128
Customer lists ................................ 110,165 (85,199 ) 24,966 114,344 (71,088 ) 43,256
Distributor contracts ................................ 30,900 (19,016 ) 11,884 30,900 (14,552 ) 16,348
Trade names ................................ 30,369 (16,708 ) 13,661 31,644 (12,350 ) 19,294
Other................................................................ 7,667 (4,410 ) 3,257 7,596 (3,485 ) 4,111
Amortizable intangibles................................ 457,903 (368,816 ) 89,087 449,331 (330,194 ) 119,137
Intangibles................................$ 517,303 $ (368,816 ) $ 148,487 $ 508,731 $ (330,194 ) $ 178,537

61
Total amortization of intangibles was $45.9 million in 2007, $59.4 million in 2006 and $79.4 million in 2005. Of these amounts, amortization of internal-use software was $16.6 million in 2007, $25.2 million in 2006 and $38.2 million in 2005. Based on the intangibles in service as of December 31, 2007, estimated amortization expense for each of the next five years ending December 31 is as follows:
(in thousands)
2008................................................................$ 36,842
2009................................................................ 24,464
2010................................................................ 10,056
2011................................................................ 5,403
2012................................................................ 2,605
We acquire internal-use software in the normal course of business. In conjunction with acquisitions (see Note
4), we also acquired certain other amortizable intangible assets. The following intangible assets were acquired during the years indicated:
2007 2006 2005
(in thousands)
Amount
Weighted-average
amortization period
Amount
Weighted-average
amortization period
Amount
Weighted-average
amortization period
Customer lists ................................$ — — $ 4,200 5 years $ 971 9 years
Internal-use software ................................ 17,398 4 years 18,984 3 years 38,220 5 years
Trade names ................................ — — 1,400 5 years — —
Other................................................................ — — — — 674 5 years
Acquired intangibles ................................$ 17,398 4 years $ 24,584 4 years $ 39,865 5 years
Goodwill – As of December 31, 2007, goodwill was comprised of the following:
(in thousands)
Acquisition of New England Business Service, Inc. (NEBS) in June 2004 ......... $ 493,889
Acquisition of Designer Checks, Inc. in February 2000(1)..................................... 77,970
Acquisition of the Johnson Group in October 2006 (see Note 4)(1) ...................... 7,320
Acquisition of Direct Checks in December 1987 .................................................. 4,267
Acquisition of Dots and Pixels, Inc. in July 2005 (see Note 4)............................. 1,044
Acquisition of All Trade Computer Forms, Inc. in February 2007 (see Note 4) .. 804
Goodwill............................................................................................................. $ 585,294
(1) This goodwill is deductible for tax purposes.

62
Changes in goodwill were as follows:
(in thousands)
Small Business Services
Direct Checks Total
Balance, December 31, 2005................................................................$ 498,886 $ 82,237 $ 581,123
Acquisition of Johnson Group (see Note 4)................................ 7,320 — 7,320
Adjustment to NEBS acquisition deferred income taxes ....................... 2,103 — 2,103
Currency translation adjustment ............................................................ (3) — (3)
Balance, December 31, 2006................................................................ 508,306 82,237 590,543
Sale of industrial packaging product line (see Note 4) .......................... (5,864) — (5,864)
Adjustment to NEBS acquisition income tax receivable and deferred income taxes ................................................................ (915) — (915)
Acquisition of All Trade Computer Forms, Inc. (see Note 4)................ 711 — 711
Adoption of FIN No. 48 (see Note 1) .................................................... 576 — 576
Currency translation adjustment ............................................................ 243 — 243
Balance, December 31, 2007................................................................$ 503,057 $ 82,237 $ 585,294
Other non-current assets – Other non-current assets as of December 31 were comprised of the following:
(in thousands) 2007 2006Contract acquisition costs (net of accumulated amortization of $82,976 and $97,910, respectively) ................................................................$ 55,516 $ 71,721
Deferred advertising costs................................................................ 26,009 27,891
Other................................................................................................28,246 18,091
Other non-current assets................................................................$ 109,771 $ 117,703
Changes in contract acquisition costs were as follows:
(in thousands) 2007 2006 2005
Balance, beginning of year ................................................................
$ 71,721 $ 93,664 $ 83,825
Additions(1) ................................................................ 11,984 14,633 50,177
Amortization................................................................ (28,189) (36,576) (34,731)
Refunds from contract terminations................................ — — (5,607)
Balance, end of year ................................................................$ 55,516 $ 71,721 $ 93,664
(1) Contract acquisition costs are accrued upon contract execution. Cash payments made for contract acquisition costs were $14,230 in 2007, $17,029 in 2006 and $70,169 in 2005.

63
Accrued liabilities – Accrued liabilities as of December 31 were comprised of the following:
(in thousands) 2007 2006
Employee profit sharing and pension................................$ 40,294 $ 20,890
Cash held for customers ................................................................23,285 13,758
Customer rebates................................................................ 20,397 19,314
Wages, including vacation ................................................................17,275 17,214
Interest ................................................................................................5,414 7,197
Restructuring due within one year (see Note 6)................................5,050 10,697
Income taxes................................................................ 3,396 25,219
Other................................................................................................34,652 32,534
Accrued liabilities ................................................................$ 149,763 $ 146,823
Supplemental cash flow disclosures – Cash payments for interest and income taxes were as follows for the years ended December 31:
(in thousands) 2007 2006 2005
Interest paid ................................................................$ 57,077 $ 57,035 $ 57,393
Income taxes paid ................................................................89,944 74,891 105,546 As of December 31, 2007, we had accounts payable of $3.9 million related to capital asset purchases. These
amounts were reflected in property, plant and equipment and intangibles in our consolidated balance sheet as of December 31, 2007, as we did receive the assets as of that date. The payment of these liabilities will be included in purchases of capital assets on the consolidated statements of cash flows when these liabilities are paid.
As of December 31, 2005, we had accounts payable of $8.5 million related to capital asset purchases. The
payment of these liabilities was included in purchases of capital assets on the consolidated statement of cash flows for the year ended December 31, 2006.
For 2007, other investing activities reported on the consolidated statement of cash flows was primarily
comprised of payments of $1.6 million received on a mortgage note receivable, benefits of $1.2 million received under life insurance policies and cash proceeds of $1.1 million received from the sale of miscellaneous fixed assets.

64
Note 3: Earnings per share
The following table reflects the calculation of basic and diluted earnings per share from continuing operations. During each period, certain options, as noted below, were excluded from the calculation of diluted earnings per share because their effect would have been antidilutive.
(in thousands, except per share amounts) 2007 2006 2005
Earnings per share – basic:
Income from continuing operations ................................$ 143,515 $ 100,558 $ 157,963
Weighted-average shares outstanding................................51,436 51,001 50,574
Earnings per share – basic................................................................$ 2.79 $ 1.97 $ 3.12
Earnings per share – diluted:
Income from continuing operations ................................$ 143,515 $ 100,558 $ 157,963
Re-measurement of share-based awards classified as liabilities................................................................(10) (584) —
Income available to common shareholders................................$ 143,505 $ 99,974 $ 157,963 Weighted-average shares outstanding................................51,436 51,001 50,574
Dilutive impact of options, restricted stock units, unvested restricted stock and employee stock purchase plan................................................................ 496 229 341
Shares contingently issuable ...........................................................— — 21
Weighted-average shares and potential dilutive shares outstanding ................................................................51,932 51,230
50,936 Earnings per share – diluted..............................................................$ 2.76 $ 1.95 $ 3.10
Weighted-average antidilutive options excluded from calculation................................................................ 2,124 3,028 1,860
Earnings per share amounts for continuing operations, discontinued operations and net income, as presented on the consolidated statements of income, are calculated individually and may not sum due to rounding differences.
Note 4: Acquisitions and disposition
2007 acquisition – In February 2007, we acquired all of the common stock of All Trade Computer Forms, Inc. (All Trade) for cash of $2.3 million, net of cash acquired. All Trade is a custom form printer based in Canada and is included in our Small Business Services segment. The acquisition was funded using availability on our existing credit facilities. All Trade’s operating results are included in our consolidated results of operations from the acquisition date. The allocation of the purchase price to the assets acquired and liabilities assumed resulted in goodwill of $0.7 million. We believe this acquisition resulted in goodwill due to All Trade’s expertise in custom printing which we expect will help us expand our core printing capabilities and product offerings for small businesses.
2007 disposition – In January 2007, we completed the sale of the assets of our Small Business Services industrial packaging product line for $19.2 million, realizing a pre-tax gain of $3.8 million. This sale had an insignificant impact on diluted earnings per share because the effective tax rate specifically attributable to the gain was higher since the goodwill written-off is not deductible for tax purposes. This product line generated approximately $51 million of

65
revenue in 2006. The disposition of this product line did not qualify to be reported as discontinued operations in our consolidated financial statements.
2006 acquisition – On October 25, 2006, we acquired the assets of the Johnson Group and its affiliated
companies for $16.5 million, net of cash acquired. The Johnson Group provides prepress, printing, mailing and fulfillment, and finishing services and is included in our Small Business Services segment. The acquisition was funded using availability on our existing credit facilities. The Johnson Group’s operating results are included in our consolidated results of operations from the acquisition date. The allocation of the purchase price to the assets acquired and liabilities assumed resulted in goodwill of $7.3 million, which is deductible for tax purposes. We believe this acquisition resulted in the recognition of goodwill primarily because of the opportunities it provides to expand our business in the custom, full color, digital and web-to-print space with our small business customers. It also provides potential opportunities longer term, specifically in the area of literature management, for financial institutions. Amortizable customer lists of $4.2 million are being amortized over five years using accelerated methods and amortizable trade names of $1.4 million are being amortized over five years on the straight-line basis. Other assets acquired consisted primarily of trade accounts receivable and property, plant and equipment.
2005 acquisition – In July 2005, we acquired all of the outstanding stock of Dots & Pixels, Inc. for $2.0 million, net of cash acquired. Dots & Pixels is a Canadian-based full-color digital printer and is included in our Small Business Services segment. The acquisition was funded using commercial paper borrowings. Dots & Pixels’ operating results are included in our consolidated results of operations from the acquisition date. The allocation of the purchase price to the assets acquired and liabilities assumed resulted in goodwill of $0.9 million. We believe this acquisition resulted in goodwill primarily due to Dots & Pixels’ proprietary printing capabilities and our ability to bring these technologies to our Canadian customers.
Note 5: Discontinued operations
Discontinued operations in 2006 consisted of the rental income and expenses associated with a building located in the United Kingdom related to NEBS European businesses which were sold in December 2004. The building was sold in the second quarter of 2006 for $3.0 million, resulting in a pre-tax gain of $0.5 million.
Discontinued operations in 2005 consisted of the NEBS apparel business known as PremiumWear, as well as the rental income and expenses associated with the building in the United Kingdom. The sale of PremiumWear was completed in the third quarter of 2005 for $15.8 million, resulting in a pre-tax gain of $0.8 million.
Revenue and income (loss) from discontinued operations for the years ended December 31 were as follows:
(in thousands) 2006 2005
Revenue.............................................................................................$ 51 $ 33,249
Income (loss) from operations ................................ $ 21 $ (1,066)
Gain on disposal................................................................ 543 798
Income tax expense ................................................................ (168) (174)
Income (loss) from discontinued operations................................$ 396 $ (442)

66
Note 6: Restructuring accruals
2007 restructuring charges – During 2007, we recorded restructuring accruals of $7.1 million for employee severance related to employee reductions across various functional areas resulting from our cost savings initiatives. The restructuring accruals included severance benefits for 236 employees. These employee reductions are expected to be completed by the end of 2008, with severance payments fully paid by mid-2009 using cash from operations. Also during 2007, we reversed $2.6 million of restructuring accruals due to fewer employees receiving severance benefits than originally estimated and the re-negotiation of operating lease obligations. These restructuring charges, net of reversals, were reflected as a $0.4 million reduction of cost of goods sold, an increase of $4.7 million in SG&A expense and a $0.2 million reduction of the gain recognized on the sale of our industrial packaging product line (see Note 4) in our 2007 consolidated statement of income.
2006 restructuring charges – During 2006, we recorded restructuring accruals of $11.1 million for employee severance related to employee reductions within our shared services functions of sales, marketing, customer care, fulfillment, information technology, human resources and finance, as well as the closing of our Financial Services customer service call center located in Syracuse, New York. The Syracuse facility was closed in January 2007 and the other employee reductions were substantially completed in the fourth quarter of 2007. These reductions were the result of our cost reduction initiatives. The restructuring accruals included severance payments for 501 employees, the majority of which were paid in 2007 utilizing cash from operations. Also during 2006, we reversed $0.2 million of previously recorded restructuring accruals. These restructuring charges, net of the reversals, were reflected as cost of goods sold of $1.2 million and SG&A expense of $9.7 million in our 2006 consolidated statement of income.
Acquisition-related restructuring – In conjunction with the NEBS acquisition in June 2004, we recorded restructuring accruals of $30.2 million related to NEBS activities which we decided to exit. The restructuring accruals included severance benefits and $2.8 million due under noncancelable operating leases on facilities which were vacated as we consolidated operations. The severance accruals included payments due to 701 employees. During the second quarter of 2005, we reduced the acquisition-related restructuring accruals by $0.5 million due to a change in estimate as to the number of employees who would receive severance benefits. This adjustment reduced goodwill, and thus, is not reflected in our 2005 consolidated statement of income. All severance benefits were fully paid during 2007 and the remaining payments due under the operating lease obligations will be paid through early 2009 utilizing cash from operations.

67
Restructuring accruals of $5.1 million as of December 31, 2007 are reflected in accrued liabilities in our consolidated balance sheet. Restructuring accruals of $11.2 million as of December 31, 2006 are reflected in accrued liabilities and other non-current liabilities in our consolidated balance sheet. By company initiative, our restructuring accruals were as follows:
(in thousands)
2003
initiatives
2004
initiatives
NEBS acquisition
related
2006
initiatives
2007
initiatives Total
Balance, December 31, 2004 ..................$ 4 $ 2,351 $ 14,556 $ — $ — $ 16,911
Restructuring charges ........................... 25 335 75 — — 435
Restructuring reversals.......................... — (397) (183) — — (580)
Acquisition adjustment ......................... — — (514) — — (514)
Payments, primarily severance.............. (29) (2,279) (7,401) — — (9,709)
Balance, December 31, 2005 .................. — 10 6,533 — — 6,543
Restructuring charges ........................... — — 438 10,701 — 11,139
Restructuring reversals.......................... — — — (229) — (229)
Payments, primarily severance.............. — (10) (5,146) (1,086) — (6,242)
Balance, December 31, 2006 .................. — — 1,825 9,386 — 11,211
Restructuring charges ........................... — — — 158 6,928 7,086
Restructuring reversals.......................... — — (656) (1,415) (562) (2,633)
Payments, primarily severance.............. — — (1,133) (7,804) (1,677) (10,614)
Balance, December 31, 2007 ..................$ — $ — $ 36 $ 325 $ 4,689 $ 5,050
Cumulative amounts:
Restructuring charges ...........................$ 11,999 $ 5,850 $ 30,243 $ 10,859 $ 6,928 $ 65,879
Restructuring reversals.......................... (1,320) (531) (839) (1,644) (562) (4,896)
Payments, primarily severance.............. (10,679) (5,319) (29,368) (8,890) (1,677) (55,933)
Balance, December 31, 2007 ................$ — $ — $ 36 $ 325 $ 4,689 $ 5,050

68
The components of our restructuring accruals, by segment, were as follows:
Employee severance benefits
Operating lease
obligations
(in thousands)
Small Business Services
Financial Services
Direct Checks
Corporate(1)
Small Business Services Total
Balance, December 31, 2004 ..................$ 11,820 $ 1,802 $ 204 $ 326 $ 2,759 $ 16,911
Restructuring charges ........................... — 25 171 164 75 435
Restructuring reversals.......................... (183) (388 ) — (9 ) — (580 )
Acquisition adjustment ......................... (514) — — — — (514 )
Payments............................................... (7,288) (1,439 ) (365) (481 ) (136 ) (9,709 )
Balance, December 31, 2005 .................. 3,835 — 10 — 2,698 6,543
Restructuring charges ........................... 2,754 3,261 128 4,949 47 11,139
Restructuring reversals.......................... (4) (165 ) — (60 ) — (229 )
Payments............................................... (4,281) (393 ) (10) (408 ) (1,150 ) (6,242 )
Balance, December 31, 2006 .................. 2,304 2,703 128 4,481 1,595 11,211
Restructuring charges ........................... 2,625 1,049 — 3,412 — 7,086
Restructuring reversals.......................... (233) (471 ) (142) (1,236 ) (551 ) (2,633 )
Inter-segment transfer ........................... 633 378 32 (1,043 ) — —
Payments............................................... (3,328) (2,706 ) (18) (3,554 ) (1,008 ) (10,614 )
Balance, December 31, 2007 ..................$ 2,001 $ 953 $ — $ 2,060 $ 36 $ 5,050
Cumulative amounts:
Restructuring charges ...........................$ 32,466 $ 18,521 $ 2,710 $ 9,264 $ 2,918 $ 65,879
Restructuring reversals.......................... (420) (2,380 ) (240) (1,305 ) (551 ) (4,896 )
Inter-segment transfer ........................... 633 378 32 (1,043 ) — —
Payments............................................... (30,678) (15,566 ) (2,502) (4,856 ) (2,331 ) (55,933 )
Balance, December 31, 2007 ................$ 2,001 $ 953 $ — $ 2,060 $ 36 $ 5,050
(1) As discussed in Note 17: Business segment information, corporate costs are allocated to our business segments based on segment revenue. As such, the net
Corporate restructuring charges are reflected in the business segment operating income presented in Note 17 in accordance with this allocation methodology.

69
The number of employees reflected in our restructuring accruals and reversals, by initiative, was as follows:
2003
initiatives
2004 initiatives
NEBS acquisition
related
2006 initiatives
2007 initiatives
Total
Balance, December 31, 2004 .................. 3 40 625 — — 668
Restructuring charges ........................... — 3 4 — — 7
Restructuring reversals.......................... — (18) (188) — — (206)
Employees severed................................ (3 ) (25) (175) — — (203)
Balance, December 31, 2005 .................. — — 266 — — 266
Restructuring charges ........................... — — 3 605 — 608
Restructuring reversals.......................... — — (1) (54) — (55)
Employees severed................................ — — (265) (149) — (414)
Balance, December 31, 2006 .................. — — 3 402 — 405
Restructuring charges ........................... — — — — 236 236
Restructuring reversals.......................... — — (1) (50) (19 ) (70)
Employees severed................................ — — (2) (351) (125 ) (478)
Balance, December 31, 2007 .................. — — — 1 92 93
In addition to severance and remaining operating lease obligations, we also incurred other costs related to facility
closures, including equipment moves, training and travel. These costs were expensed as incurred and totaled $0.1 million for 2007, $1.5 million for 2006 and $2.2 million for 2005.
Note 7: Asset impairment loss
In June 2006, we determined that a software project intended to replace major portions of our existing order capture, billing and pricing systems would not meet our future business requirements in a cost-effective manner. Therefore, we made the decision to abandon the project. Accordingly, we wrote down the carrying value of the related internal-use software to zero during the second quarter of 2006. This resulted in a non-cash asset impairment loss of $44.7 million, of which $26.4 million was allocated to the Financial Services segment and $18.3 million was allocated to the Small Business Services segment.
Note 8: Derivative financial instruments
During 2004, we entered into $450.0 million of forward starting interest rate swaps to hedge, or lock-in, the
interest rate on a portion of the $600.0 million debt we issued in October 2004 (see Note 13). The termination of the lock agreements in 2004 yielded a deferred pre-tax loss of $23.6 million. During 2002, we entered into two forward rate lock agreements to effectively hedge the annual interest rate on $150.0 million of the $300.0 million notes issued in December 2002 (see Note 13). The termination of the lock agreements in December 2002 yielded a deferred pre-tax loss of $4.0 million. These losses are reflected, net of tax, in accumulated other comprehensive loss in our consolidated balance sheets and are being reclassified ratably to our statements of income as increases to interest expense over the term of the related debt.

70
Note 9: Income tax provision
The components of the income tax provision for continuing operations were as follows:
(in thousands) 2007 2006 2005
Current tax provision:
Federal ................................................................$ 59,595 $ 74,263 $ 95,484
State ................................................................................................ 9,264 5,095 9,210
Total ............................................................................................. 68,859 79,358 104,694
Deferred tax provision (benefit)................................ 5,280 (37,375) (11,923)
Provision for income taxes................................$ 74,139 $ 41,983 $ 92,771
Our income tax provision for 2005 included tax expense of $0.7 million related to the repatriation of $8.1
million from our Canadian operations under the foreign earnings repatriation provision within the American Jobs Creation Act of 2004. This new law provided for a special one-time deduction of 85% of certain foreign earnings that were repatriated and which met certain requirements.
The effective tax rate on pre-tax income from continuing operations differed from the U.S. federal statutory
tax rate of 35% as follows:
2007 2006 2005
Income tax at federal statutory rate................................ 35.0% 35.0% 35.0%
State income tax expense, net of federal income tax benefit ................................................................ 2.8% 0.5% 2.1%
Change in unrecognized tax benefits, including interest and penalties ................................................................0.2% — —
Change in tax contingencies(1)................................ — 0.7% (0.3%)
Deferred income tax adjustment(2) ................................ — (3.5%) —
Qualified production activity credit ................................ (1.8%) (1.6%) (0.9%)
Receivables for prior year tax returns(3) ................................(1.4%) — —
Other................................................................................................(0.7%) (1.6%) 1.1%
Income tax provision................................................................34.1% 29.5% 37.0%
(1) During 2006, accruals related to unresolved tax contingencies more than offset net accrual reversals of $1.5 million related to settled issues, primarily resulting from the expiration of the statute of limitations in various state income tax jurisdictions.
(2) During 2006, we reduced our provision for income taxes $5.0 million for the true-up of certain deferred income tax balances. As this item was not material to our current or prior periods, we recorded a one-time, discrete benefit to our provision for income taxes for the year ended December 31, 2006. (3) Relates to amendments to prior year income tax returns claiming refunds primarily associated with the funding of medical costs through our voluntary employee beneficiary association (VEBA) trust, as well as state income tax credits and related interest.

71
On January 1, 2007, we adopted FIN No. 48, Accounting for Uncertainty in Income Taxes (see Note 1). This new standard defines the threshold for recognizing the benefits of tax return positions in the financial statements. A reconciliation of the beginning and ending amount of unrecognized tax benefits, excluding accrued interest and penalties, is as follows:
(in thousands)
Balance, January 1, 2007.............................................................................$ 16,202
Additions for tax positions of current year ..................................... 898
Additions for tax positions of prior years ....................................... 979
Reductions for tax positions of prior years ..................................... (1,159 )
Settlements ...................................................................................... (2,131 )
Lapse of statutes of limitations........................................................ (394 )
Balance, December 31, 2007 ............................................................ $ 14,395
If the unrecognized tax benefits were recognized in our consolidated financial statements, $7.2 million would
affect our effective tax rate. Our income tax provision included expense for interest and penalties of $0.9 million in 2007. Our accruals for interest and penalties, excluding the tax benefits of deductible interest, were $4.8 million as of December 31, 2007. Examinations of our federal income tax returns for years prior to 2000 have been closed. Federal income tax returns for 2000 through 2004 have been examined by the Internal Revenue Service (IRS), while our federal income tax returns for 2005 through 2007 remain subject to IRS examination. In general, income tax returns for the years 2003 through 2007 remain subject to examination by major state and city tax jurisdictions. In the event that we have determined not to file tax returns with a particular state or city, all years remain subject to examination by the tax jurisdiction.
Within the next 12 months, it is reasonably possible that our unrecognized tax benefits will change in the
range of a decrease of $7.0 million to an increase of $1.1 million as we attempt to settle certain federal and state tax matters or as federal and state statutes of limitations expire. We are not able to predict what, if any, impact these changes may have on our effective tax rate.
The ultimate outcome of tax matters may differ from our estimates and assumptions. Unfavorable settlement
of any particular issue would require the use of cash and could result in increased income tax expense. Favorable resolution would result in reduced income tax expense.
Prior to the adoption of FIN No. 48 on January 1, 2007, we established reserves for income tax contingencies
when, despite our belief that the tax return positions were fully supportable, certain positions were likely to be challenged. We adjusted these reserves in light of changing facts and circumstances, such as the closing of a tax audit. Our effective tax rate for 2006 and 2005 included the impact of reserve provisions and changes to reserves, as well as related interest and penalties. Our reserve for contingent tax liabilities totaled $8.9 million as of December 31, 2006 and is included in accrued liabilities in our consolidated balance sheet.

72
Tax-effected temporary differences which gave rise to deferred tax assets and liabilities at December 31 were as follows:
2007 2006
(in thousands)
Deferred tax assets
Deferred tax
liabilities Deferred tax assets
Deferred tax
liabilities
Intangible assets...........................................................$ — $ 24,326 $ — $ 29,555
Goodwill................................................................ — 21,793 — 17,073
Property, plant and equipment................................ 2,840 — — 772
Deferred advertising costs ........................................... — 9,800 — 9,106
Employee benefit plans(1) ............................................ 33,106 — 34,445 —
Interest rate lock agreements (see Note 8)................... 5,279 — 6,514 —
Reserves and accruals.................................................. 10,959 — 15,156 —
Federal benefit of state uncertain tax positions............ 4,982 — — —
Inventories ................................................................ 2,137 — 3,123 —
All other................................................................ 4,995 3,040 4,362 3,981
Total deferred taxes ................................................. 64,298 58,959 63,600 60,487
Valuation allowance .................................................... (632 ) — (652 ) —
Net deferred taxes....................................................$ 63,666 $ 58,959 $ 62,948 $ 60,487
(1) Deferred income taxes were impacted by the adoption of the recognition provisions of SFAS No. 158, Employers’ Accounting for Defined
Benefit Pension and Other Postretirement Plans, as of December 31, 2006. Further information can be found in Note 12.
Deferred income taxes have not been recognized on unremitted earnings of our foreign subsidiaries, as these
amounts are intended to be reinvested indefinitely in the operations of those subsidiaries. The valuation allowances relate to Canadian operating loss carryforwards which we do not expect to realize.
As of December 31, 2007, we had Canadian operating loss carryforwards of $1.8 million which expire at various dates between 2010 and 2013. We also had state net operating loss carryforwards of $1.9 million which expire at various dates up to 2026.
Note 10: Share-based compensation plans
Our employee share-based compensation plans consist of our employee stock purchase plan and our stock
incentive plan. Under our stock incentive plan, we currently have non-qualified stock options, restricted stock units and restricted share awards outstanding. There are 8.5 million shares of common stock reserved for issuance under the stock incentive plan, with 2.8 million of these shares remaining available for issuance as of December 31, 2007.

73
The following amounts were recognized in our consolidated statements of income for share-based compensation plans:
(in thousands) 2007 2006 2005
Stock options ................................................................$ 2,766 $ 2,025 $ 3,448
Restricted shares and restricted stock units ................................10,425 3,379 2,325
Employee stock purchase plan................................ 342 787 810
Performance share plan(1) ................................................................— — 420
Total share-based compensation expense................................$ 13,533 $ 6,191 $ 7,003
Income tax benefit ................................................................$ 4,709 $ 1,826 $ 2,591
(1) No awards were earned under our performance share plan. As such, no expense for this plan was recorded in 2007 or 2006. Expense was recorded in 2005 based on our estimate at that time of the awards that would be earned. As a portion of the award was based on market conditions, this expense could not be reversed in accordance with SFAS No. 123(R), Share-Based Payment.
As of December 31, 2007, the total compensation expense for unvested awards not yet recognized in our
consolidated statements of income was $10.5 million, net of the effect of estimated forfeitures. This amount is expected to be recognized over a weighted-average period of 1.5 years.
Non-qualified stock options – All options allow for the purchase of shares of common stock at prices equal to the
stock’s market value at the date of grant. Options become exercisable beginning one year after the grant date, with one-third vesting each year over three years. Options may be exercised up to seven years following the date of grant. In the case of qualified retirement, death, disability or involuntary termination without cause, options vest immediately and the period over which the options can be exercised is shortened. Employees forfeit unvested options when they voluntarily terminate their employment with the company, and they have up to three months to exercise vested options before they are cancelled. In the case of involuntary termination with cause, the entire unexercised portion of the award is cancelled. All options vest immediately upon a change of control, as defined in the award agreement. We determine the fair value of options using the Black-Scholes option pricing model. The estimated fair value of options, including the effect of estimated forfeitures, is recognized as expense on the straight-line basis over the options’ vesting periods. The following weighted-average assumptions were used in the Black-Scholes model in determining the fair value of stock options granted:
2007 2006 2005
Risk-free interest rate (%)................................................................4.8 4.6 3.9
Dividend yield (%) ................................................................4.4 4.2 3.9
Expected volatility (%)................................................................26.1 22.1 20.5
Weighted-average option life (years)................................ 4.5 4.7 5.7 The risk-free interest rate for periods within the expected option life is based on the U.S. Treasury yield curve in
effect at the grant date. Expected volatility is based on the historical volatility of our stock. We utilized the simplified method to determine the expected option term, based upon the vesting and original contractual terms of the option. Beginning in 2008, we will utilize a more detailed calculation of the expected option term based on our historical option exercise data.

74
Information regarding options issued under the current and all previous plans was as follows:
Number of option shares
Weighted-
average exercise price
Aggregate intrinsic value (in
thousands)
Weighted- average
remaining contractual term (years)
Outstanding at December 31, 2004................................3,250,496 $ 36.84
Granted ................................................................239,087 39.63
Exercised ................................................................(325,858) 25.29
Forfeited or expired ................................ (203,340) 36.62
Outstanding at December 31, 2005................................2,960,385 38.46
Granted ................................................................795,700 25.83
Exercised ................................................................(295,485) 19.19
Forfeited or expired ................................ (393,642) 36.53
Outstanding at December 31, 2006................................3,066,958 37.27
Granted ................................................................914,425 32.73
Exercised ................................................................(425,777) 31.36
Forfeited or expired ................................ (271,377) 37.89
Outstanding at December 31, 2007................................3,284,229 36.85 $ 5,306 3.4
Exercisable at December 31, 2005 ................................2,256,758 $ 38.12
Exercisable at December 31, 2006 ................................2,265,244 40.46
Exercisable at December 31, 2007 ................................1,988,907 40.78 $ 2,235 1.8 The weighted-average grant-date fair value of options granted was $6.01 per share for 2007, $4.17 per share for
2006 and $6.13 per share for 2005. The intrinsic value of a stock award is the amount by which the fair value of the underlying stock exceeds the exercise price of the award. The total intrinsic value of options exercised was $3.5 million for 2007, $2.1 million for 2006 and $4.4 million for 2005.
Restricted stock units – Certain employees have the option to receive a portion of their bonus payment in the form of restricted stock units. When employees elect this payment method, we provide an additional matching amount of restricted stock units equal to one-half of the restricted stock units earned under the bonus plan. These awards vest two years from the date of grant. In the case of approved retirement, death, disability or change of control, the units vest immediately. In the case of involuntary termination without cause or voluntary termination, employees receive a cash payment for the units earned under the bonus plan, but forfeit the company-provided matching amount. The fair value of these awards is determined on the date of grant based on the market value of our common stock. Compensation expense, including the effect of estimated forfeitures, is recognized over the applicable service period. Because the bonus portion of these awards may be settled in cash upon voluntary termination of employment, this portion of the awards is included in accrued liabilities in our consolidated balance sheets, and is re-measured at each reporting period based on the current market value of our common stock. The company-provided match portion of the awards is never settled in cash. As such, this portion of the awards is recorded in equity at the grant date fair value and is not re-measured each reporting period.
In addition to awards granted to employees, non-employee members of our board of directors can elect to receive all or a portion of their fees in the form of restricted stock units. Directors are issued shares in exchange for the units upon the earlier of the tenth anniversary of February 1st of the year following the year in which the non-employee director ceases to serve on the board or such other objectively determinable date pre-elected by the director. The fair value of these unit awards is based on the market value of our common stock on the date of grant. Compensation expense is recognized immediately, as the awards are for past services.

75
Each restricted stock unit is convertible into one share of common stock upon completion of the vesting period. Information regarding our restricted stock units was as follows:
Number of units
Weighted-
average grant date fair value
Aggregate intrinsic value (in
thousands)
Weighted- average
remaining contractual term (years)
Outstanding at December 31, 2004................................40,905 $ 38.45 Granted ................................................................154,356 35.54 Vested ................................................................(63,362) 37.14 Forfeited ................................................................(5,798) 35.44
Outstanding at December 31, 2005................................126,101 35.68 Granted ................................................................15,938 22.38 Vested ................................................................(20,307) 35.44
Forfeited ................................................................(41,875) 35.23
Outstanding at December 31, 2006................................79,857 33.31 Granted ................................................................10,743 34.71 Vested ................................................................(37,490) 34.53
Outstanding at December 31, 2007................................53,110 32.73 $ 1,747 5.6
Of the awards outstanding as of December 31, 2007, 554 restricted stock units are classified as liabilities in our
consolidated balance sheet at a value of $18 thousand. As of December 31, 2007, these units had a fair value of $32.89 per unit and a weighted-average remaining contractual term of 0.1 year.
The total intrinsic value of restricted stock units vesting was $1.1 million for 2007, $0.4 million for 2006 and
$2.1 million for 2005. We made cash payments to settle share-based liabilities of $0.1 million in 2007, $0.5 million in 2006 and $0.1 million in 2005.
Restricted shares – We currently have two types of restricted share awards outstanding. Certain of these awards have a set vesting period at which time the restrictions on the shares lapse. The vesting period on these awards currently ranges from two to three years. The fair value of these awards is based on the market value of an unrestricted share on the grant date and is recognized, net of the effect of estimated forfeitures, over the vesting period. We have also granted performance-accelerated restricted shares. The restrictions on these awards lapse three years from the grant date. However, if the performance criteria are met, the restrictions on one-half of the awards will lapse one year from the grant date. Fair value is based on the market value of an unrestricted share on the date of grant and is recognized, net of the effect of estimated forfeitures, over the vesting period.
For both types of restricted share awards, the restrictions lapse immediately in the case of qualified retirement,
death or disability. In the case of involuntary termination without cause or a change of control, restrictions on a pro-rata portion of the shares lapse based on how much of the vesting period has passed. In the case of voluntary termination of employment or termination with cause, the remaining restricted shares are forfeited.

76
Information regarding unvested restricted shares was as follows:
Number of
shares
Weighted- average grant date fair value
Unvested at December 31, 2004 ................................ 44,803 $ 42.36 Granted ........................................................................... 51,925 39.47 Vested ............................................................................. (9,746) 41.66 Forfeited ......................................................................... (4,099) 41.16
Unvested at December 31, 2005 ................................ 82,883 40.70 Granted ........................................................................... 401,630 25.51 Vested ............................................................................. (20,958) 36.90 Forfeited ......................................................................... (85,462) 28.99
Unvested at December 31, 2006 ................................ 378,093 27.52 Granted ........................................................................... 250,150 33.00 Vested ............................................................................. (87,133) 29.09 Forfeited ......................................................................... (36,977) 30.10
Unvested at December 31, 2007 ................................ 504,133 29.78
The total fair value of restricted shares vesting was $3.3 million for 2007, $0.4 million for 2006 and $0.3 million
for 2005.
Employee stock purchase plan – Under our employee stock purchase plan, eligible employees may purchase Deluxe common stock at 85% of its market value at the end of each six-month purchase period. Prior to August 1, 2006, the plan contained a “look-back” provision under which the purchase price was calculated as 85% of the lower of the stock’s market value at the beginning or end of the six-month purchase period.
During 2007, 90,452 shares were issued under this plan at prices of $25.44 and $32.10. During 2006, 180,277
shares were issued under this plan at prices of $22.76 and $14.45. During 2005, 91,902 shares were issued at prices of $32.53 and $32.99. Prior to August 1, 2006, we utilized the Black-Scholes option pricing model to calculate the fair value of these awards. This fair value plus the 15% discount amount was recognized as compensation expense over the six-month purchase period. Subsequent to August 1, 2006, the 15% discount amount is recognized as compensation expense over the six-month purchase period.
Note 11: Employee benefit plans
Profit sharing, defined contribution and 401(k) plans – We maintain a profit sharing plan, a defined contribution pension plan and a plan established under section 401(k) of the Internal Revenue Code to provide retirement benefits for certain employees. These plans cover substantially all full-time and some part-time employees. Employees are eligible to participate in the plans on the first day of the quarter following their first full year of service. We also provide cash bonus programs under which employees may receive an annual cash bonus payment based on our annual operating performance.
Contributions to the profit sharing and defined contribution plans are made solely by Deluxe and are remitted
to the plans’ respective trustees. Benefits provided by the plans are paid from accumulated funds of the trusts. In 2007, 2006 and 2005, contributions to the defined contribution pension plan equaled 4% of eligible compensation. Contributions to the profit sharing plan vary based on the company’s performance. Under the 401(k) plan, employees under the age of 50 could contribute up to the lesser of $15,500 or 50% of eligible wages during 2007. Employees 50 years of age or older could make contributions of up to $20,500 during 2007. Beginning on the first day of the quarter following an employee’s first full year of service, we match 100% of the first 1% of wages contributed by employees and 50% of the next 4% of wages contributed. All employee and employer contributions are remitted to

77
the plans’ respective trustees and benefits provided by the plans are paid from accumulated funds of the trusts. Payments made under the cash bonus programs vary based on the company’s performance and are paid in cash directly to employees.
Employees are provided a broad range of investment options to choose from when investing their profit
sharing, defined contribution and 401(k) plan funds. Investing in our common stock is not one of these options, although funds selected by employees may at times hold our common stock.
Expense recognized in the consolidated statements of income for these plans was as follows:
(in thousands) 2007 2006 2005
Profit sharing/cash bonus plans ................................$ 23,379 $ 3,845 $ 976
Defined contribution pension plan................................ 10,761 11,313 10,975
401(k) plan ................................................................ 6,482 7,065 8,084
Deferred compensation plan – We have a non-qualified deferred compensation plan that allows eligible employees to defer a portion of their compensation. Participants can elect to defer up to a maximum of 100 percent of their base salary plus up to 50 percent of their bonus for the year. The compensation deferred under this plan is credited with earnings or losses measured by the mirrored rate of return on investments elected by plan participants. Each participant is fully vested in all deferred compensation and earnings. A participant may elect to receive deferred amounts in one payment or in monthly installments upon termination of employment or disability. Our total liability under this plan was $10.2 million as of December 31, 2007 and $11.4 million as of December 31, 2006. These amounts are reflected in accrued liabilities and other long-term liabilities in the consolidated balance sheets. We fund this liability through investments in company-owned life insurance policies, as well as investments in domestic mutual funds. These investments are included in long-term investments in the consolidated balance sheets and totaled $16.3 million as of December 31, 2007 and $15.7 million as of December 31, 2006.
Voluntary employee beneficiary association trust – We have formed a VEBA trust to fund employee and
retiree medical costs and severance benefits. Contributions to the VEBA trust are tax deductible, subject to limitations contained in the Internal Revenue Code. VEBA assets primarily consist of fixed income investments. Historically, we made the majority of our contributions to the trust in the first quarter of the year and funded our obligations from the trust assets throughout the year. During 2006, we decided to change this practice. We now fund the VEBA trust throughout the year because the tax benefit from pre-funding the trust no longer exceeds the interest cost associated with the pre-funding. We made contributions to the VEBA trust of $34.1 million in 2007 and $4.5 million in 2006. Our liability for incurred but not reported medical claims exceeded the prepaid balance in the VEBA trust by $3.1 million as of December 31, 2007 and $0.3 million as of December 31, 2006. These amounts are reflected in accrued liabilities in our consolidated balance sheets.
Note 12: Pension and other postretirement benefits
We have historically provided certain health care benefits for a large number of retired employees. Employees hired prior to January 1, 2002 become eligible for benefits if they attain the appropriate years of service and age prior to retirement. Employees hired on January 1, 2002 or later are not eligible to participate in our retiree health care plan. In addition to our retiree health care plan, we also have supplemental executive retirement plans (SERP’s) in the United States and Canada and a pension plan which covers certain Canadian employees. These pension plans were acquired as part of the NEBS acquisition in 2004.

78
On December 31, 2006, we adopted the recognition provisions of SFAS No. 158, Employers’ Accounting for
Defined Benefit Pension and Other Postretirement Plans. This standard required companies to recognize the overfunded or underfunded status of a defined benefit postretirement plan as an asset or liability on the balance sheet and to recognize changes in that funded status in the year in which the change occurs through comprehensive income. The adjustments required to reflect the funded status of our postretirement benefit and pension plans as of December 31, 2006 were as follows:
(in thousands)
Before application
of SFAS No. 158 Adjustments
After application
of SFAS No. 158
Deferred income taxes ................................................................$ 20,080 $ (1,304) $ 18,776 Other non-current assets ................................................................139,509 (21,806) 117,703 Total assets ................................................................ 1,290,242 (23,110) 1,267,132 Accrued liabilities................................................................150,802 (3,979) 146,823 Deferred income taxes ................................................................37,074 (20,759) 16,315 Other non-current liabilities................................................................40,396 35,001 75,397 Total liabilities................................................................1,322,542 10,263 1,332,805 Accumulated other comprehensive loss................................(8,500) (33,373) (41,873) Total shareholders’ deficit ................................................................(32,300) (33,373) (65,673)
SFAS No. 158 also requires companies to measure the funded status of a plan as of the date of its year-end
balance sheet beginning no later than December 31, 2008. We historically used September 30 as our measurement date. Effective January 1, 2007, we changed to a December 31 measurement date (see Note 1).
In July 2006, we adopted an amendment to our postretirement benefit plan. The amendment limits the total
amount we will pay toward retiree medical costs. The limit was set at 150% of the average cost per retiree in 2006. Medical costs incurred above the pre-determined limit will be paid by retirees. We expect the cap will be reached in four to six years. We completed a plan re-measurement as of July 31, 2006 to calculate the impact of this plan amendment. This change reduced our accumulated postretirement benefit obligation by $29.5 million. This amount will be recognized as a reduction of our postretirement benefit expense over a period of 22 years, the average remaining life of plan participants. This change resulted in a $0.7 million reduction in our postretirement benefit expense for 2006.

79
Obligations and funded status – The following table summarizes the change in benefit obligation, plan assets and funded status during 2007 and 2006:
(in thousands)
Postretirement benefit plan Pension plans
Change in benefit obligation:
Benefit obligation, December 31, 2005................................$ 143,195 $ 9,691
Service cost................................................................ 1,000 209
Interest cost................................................................ 7,338 473
Actuarial loss – net ................................................................11,273 4
Benefits paid from plan assets, the VEBA trust (see Note 11) and company funds................................(13,803) (446)
Plan amendments ................................................................(29,525) —
Currency translation adjustment ................................ — (30)
Benefit obligation, December 31, 2006................................119,478 9,901
Service cost................................................................ 156 222
Interest cost................................................................ 7,011 514
Actuarial loss (gain) – net................................ 15,775 (185)
Benefits paid from plan assets, the VEBA trust (see Note 11) and company funds ................................(10,779) (557)
Change in measurement date (see Note 1)................................1,664 338
Currency translation adjustment ................................ — 1,095
Benefit obligation, December 31, 2007................................$ 133,305 $ 11,328
Change in plan assets:
Fair value of plan assets, December 31, 2005 ................................$ 90,589 $ 4,869
Actual return on plan assets ................................ 7,996 555
Company contributions................................................................— 776
Benefits and expenses paid................................ (10,342) (152)
Currency translation adjustment ................................ — (49)
Fair value of plan assets, December 31, 2006 ................................88,243 5,999
Actual return on plan assets ................................ 14,504 109
Company contributions................................................................— 463
Benefits and expenses paid................................ — (234)
Currency translation adjustment ................................ — 1,025
Fair value of plan assets, December 31, 2007 ................................$ 102,747 $ 7,362
Funded status, December 31, 2006................................$ (31,235) $ (3,902)
Funded status, December 31, 2007................................$ (30,558) $ (3,966)
Plan assets of our postretirement medical plan do not include the assets of the VEBA trust discussed in Note
11. Plan assets consist only of those assets invested in a trust established under section 401(h) of the Internal Revenue Code. These assets can be used only to pay retiree medical benefits, whereas the assets of the VEBA trust may be used to pay medical and severance benefits for both active and retired employees.
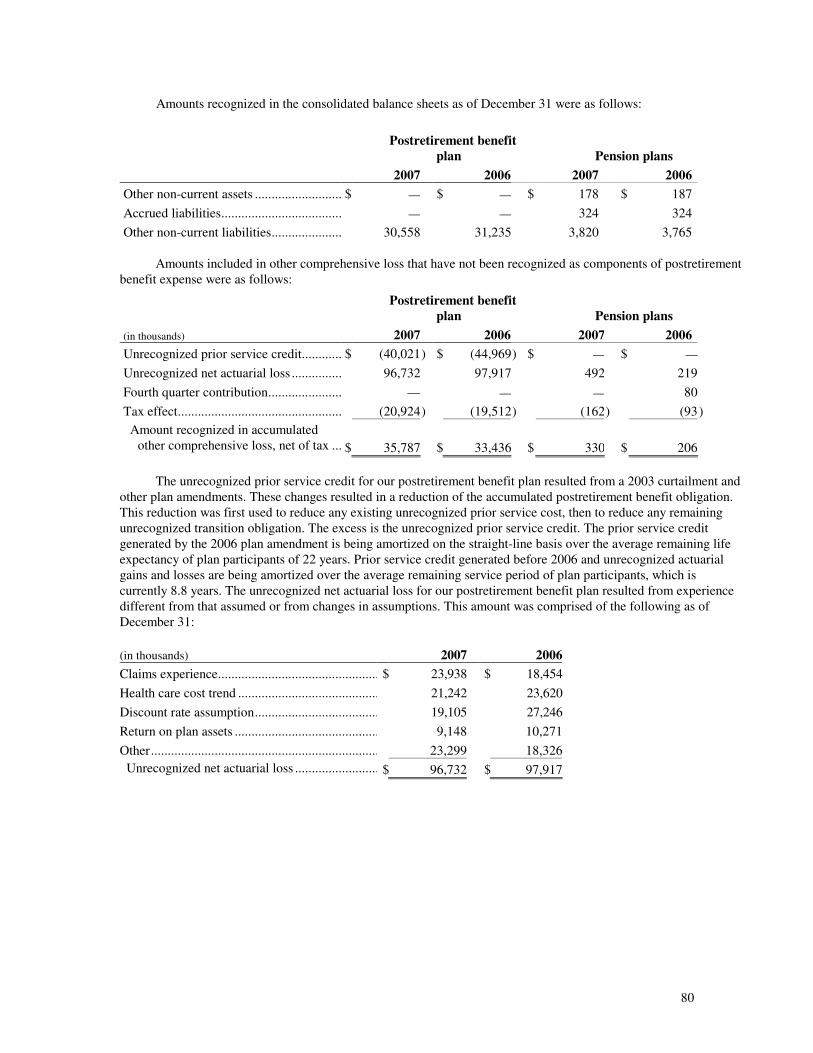
80
Amounts recognized in the consolidated balance sheets as of December 31 were as follows:
Postretirement benefit
plan Pension plans
2007 2006 2007 2006
Other non-current assets ................................$ — $ — $ 178 $ 187
Accrued liabilities............................................................. — — 324 324
Other non-current liabilities................................ 30,558 31,235 3,820 3,765 Amounts included in other comprehensive loss that have not been recognized as components of postretirement
benefit expense were as follows:
Postretirement benefit
plan Pension plans
(in thousands) 2007 2006 2007 2006
Unrecognized prior service credit................................$ (40,021) $ (44,969) $ — $ —
Unrecognized net actuarial loss ................................ 96,732 97,917 492 219
Fourth quarter contribution................................ — — — 80
Tax effect................................................................ (20,924) (19,512) (162) (93 )
Amount recognized in accumulated other comprehensive loss, net of tax ............................$ 35,787 $ 33,436 $ 330
$ 206
The unrecognized prior service credit for our postretirement benefit plan resulted from a 2003 curtailment and
other plan amendments. These changes resulted in a reduction of the accumulated postretirement benefit obligation. This reduction was first used to reduce any existing unrecognized prior service cost, then to reduce any remaining unrecognized transition obligation. The excess is the unrecognized prior service credit. The prior service credit generated by the 2006 plan amendment is being amortized on the straight-line basis over the average remaining life expectancy of plan participants of 22 years. Prior service credit generated before 2006 and unrecognized actuarial gains and losses are being amortized over the average remaining service period of plan participants, which is currently 8.8 years. The unrecognized net actuarial loss for our postretirement benefit plan resulted from experience different from that assumed or from changes in assumptions. This amount was comprised of the following as of December 31:
(in thousands) 2007 2006
Claims experience................................................................$ 23,938 $ 18,454
Health care cost trend ................................................................21,242 23,620
Discount rate assumption................................................................19,105 27,246
Return on plan assets ................................................................9,148 10,271
Other................................................................................................23,299 18,326
Unrecognized net actuarial loss ................................$ 96,732 $ 97,917

81
Amounts included in accumulated other comprehensive loss as of December 31, 2007 which we expect to
recognize in postretirement benefit expense during 2008 are as follows:
(in thousands)
Postretirement benefit plan
Pension plans
Prior service credit ...........................................................$ (3,959) $ —
Net actuarial loss .............................................................. 9,478 134
Total ...............................................................................$ 5,519 $ 134
The accumulated benefit obligation (ABO) for all of our pension plans was $11.3 million as of December 31,
2007 and $9.9 million as of December 31, 2006. The ABO differs from the projected benefit obligation because it does not include an assumption as to future compensation levels.
As of December 31, 2007 and 2006, two of our three pension plans, the United States SERP plan and the
Canadian pension plan, had accumulated benefit obligations in excess of plan assets, as follows:
(in thousands) 2007 2006
Projected benefit obligation................................................................$ 10,448 $ 9,129
Accumulated benefit obligation................................ 10,448 9,101
Fair value of plan assets................................................................6,304 5,039 Net pension and postretirement benefit expense – Net pension and postretirement benefit expense for the
years ended December 31 consisted of the following components:
Postretirement benefit plan Pension plans
(in thousands) 2007 2006 2005 2007 2006 2005
Service cost................................................................$ 156 $ 1,000 $ 782 $ 223 $ 209 $ 289
Interest cost................................................................ 7,011 7,338 6,915 514 473 588
Expected return on plan assets................................ (8,264) (7,690) (6,695) (262 ) (300 ) (263)
Amortization of prior service credit................................ (3,959) (2,841) (2,617) — — —
Amortization of net actuarial losses................................ 9,857 9,992 9,375 7 9 —
Total periodic benefit expense................................ 4,801 7,799 7,760 482 391 614
Curtailment loss................................................................ — — — — — 139
Net periodic benefit expense ................................$ 4,801 $ 7,799 $ 7,760 $ 482 $ 391 $ 753
Actuarial assumptions – Effective January 1, 2007 we changed to a December 31 measurement date when completing the calculations related to our pension and postretirement benefit plans (see Note 1). Historically, we used a September 30 measurement date.
In measuring benefit obligations as of December 31, the following assumptions were used:
Postretirement benefit plan Pension plans 2007 2006 2007 2006
Discount rate................................................................ 6.20% 5.75% 4.43% - 6.20% 4.60% - 5.75%
Rate of compensation increase ................................ — — — 3.50% The discount rate assumption is based on the rates of return on high-quality, fixed-income instruments
currently available whose cash flows match the timing and amount of expected benefit payments. In determining the discount rate, we utilize yield curve approaches to discount each cash flow stream at an interest rate specifically applicable to the timing of each respective cash flow. The present value of each cash flow stream is aggregated and

82
used to impute a weighted-average discount rate. Additionally, we consider Moody’s high quality corporate bond rates when selecting our discount rate.
In measuring net periodic benefit expense for the years ended December 31, the following assumptions were
used:
Postretirement benefit plan Pension plans
(in thousands) 2007 2006 2005 2007 2006 2005
Discount rate................................................................ 5.75% 5.50% 5.75% 4.43% - 5.75% 4.50% -5.50% 5.75% - 6.25%
Expected return on plan assets................................ 8.75% 8.75% 8.75% 4.50% 6.25% 6.00%
Rate of compensation increase ................................ — — — — 3.50% 3.50% In determining the expected long-term rate of return on plan assets, we first study historical markets. We then
use this data to estimate future returns assuming that long-term historical relationships between equity and fixed income investments are consistent with the widely accepted capital market principle that assets with higher volatility generate a greater return over the long run. We evaluate current market factors such as inflation and interest rates before we determine long-term capital market assumptions. We also review historical returns to check for reasonableness and appropriateness.
In measuring the benefit obligation for our postretirement medical plan, the following assumptions for health
care cost trend rates were used:
2007 2006 2005
Participants under age 65
Participants over age 65
Participants under age 65
Participants over age 65
All participants
Health care cost trend rate assumed for next year ................................................................
8.25%
9.25%
9.00%
10.00%
9.75%
Rate to which the cost trend rate is assumed to decline (the ultimate trend rate) ................................................................
5.25%
5.25%
5.25%
5.25%
5.25%
Year that the rate reaches the ultimate trend rate ................................................................
2012
2014
2012
2014
2011
Assumed health care cost trend rates have a significant effect on the amounts reported for health care plans. A
one-percentage-point change in assumed health care cost trend rates would have the following effects:
(in thousands)
One-percentage-
point increase
One-percentage-
point decrease
Effect on total of service and interest cost ................................$ 163 $ (145)
Effect on benefit obligation ...................................................... 2,826 (2,526)
Plan assets – The allocation of plan assets by asset category as of the measurement date was as follows:
Postretirement benefit plan
Pension plans
2007 2006 2007 2006
Equity securities ................................................................ 79% 85% 7% 8% Debt securities ................................................................ 21% 15% 86% 84% Cash and cash equivalents ....................................................... — — 7% 8%
Total 100% 100% 100% 100%

83
Our postretirement health care plan and the Canadian pension plans have assets that are intended to meet
long-term obligations. In order to meet these obligations, we employ a total return investment approach which considers cash flow needs and balances long-term projected returns against expected asset risk, as measured using projected standard deviations. Risk tolerance is established through careful consideration of projected plan liabilities, the plan’s funded status, projected liquidity needs and current corporate financial condition.
For our postretirement health care plan, we adopted new asset allocation targets in September 2007 based on
our liability and asset projections. As such, the current allocation of plan assets is 80% equity securities and 20% fixed income securities. Within the equity securities category, the allocation is: 59% large capitalization equities, 29% international equities and 12% small and mid-capitalization equities. Through most of 2007 our allocation of plan assets was 76% equity securities and 24% fixed income securities. Within the equity securities category, the allocation was: 42% large capitalization equities, 33% small and mid-capitalization equities and 25% international equities. Through most of 2006, we targeted an allocation of plan assets of 80% equity securities and 20% fixed income securities for our postretirement medical plan. Within equity securities, we targeted the following allocation: 35% large capitalization equities, 25% small capitalization equities, 20% mid-capitalization equities and 20% international equities. Plan assets are not invested in real estate, private equity or hedge funds and are not leveraged beyond the market value of the underlying investments. Investment risk is measured and monitored on an ongoing basis through quarterly investment portfolio reviews, annual liability measurements and periodic asset/liability studies.
Through June 30, 2006, the defined benefit component of the Canadian pension plan invested in a pooled
balance fund. The plan was frozen on July 1, 2006 and is expected to be fully settled in 2010. As such, its assets as of December 31, 2007 were invested in fixed income investments. The investments utilized by this plan conform to our Statement of Investment Policies & Procedures and are overseen by an investment committee. The committee reviews our policies and liability structure annually and reviews the performance of plan assets on a quarterly basis. In December 2007, we decided to terminate the Canadian SERP plan. Benefits due under this plan are expected to be fully settled in 2008. As of December 31, 2007, one-half of the assets of this plan were held by the Canada Revenue Agency in a refundable non-interest bearing account and one-half of the assets were invested in a global equity fund.
Cash flows – We are not contractually obligated to make contributions to the assets of our postretirement
medical benefit plan, and we do not anticipate making any such contributions during 2008. However, we do anticipate that we will pay net retiree medical benefits of $10.0 million during 2008.
We have fully funded the United States SERP obligation with investments in company-owned life insurance
policies. The cash surrender value of these policies is included in long-term investments in the consolidated balance sheets and totaled $5.3 million as of December 31, 2007 and $5.2 million as of December 31, 2006. We plan to pay pension benefits of $1.5 million during 2008, including final settlement of the Canadian SERP plan. We plan to make contributions of $0.2 million to the defined benefit component of the Canadian pension plan during 2008.
The following benefit payments are expected to be paid during the years indicated:
Postretirement benefit plan Pension
plans
(in thousands)
Gross benefit
payments
Expected Medicare subsidy
Net benefit
payments
Gross benefit
payments
2008 ................................................................$ 11,000 $ 1,000 $ 10,000 $ 1,516
2009 ................................................................ 11,400 1,200 10,200 533
2010 ................................................................ 12,000 1,300 10,700 7,582
2011 ................................................................ 12,600 1,400 11,200 310
2012 ................................................................ 13,100 1,500 11,600 300
2013 – 2017 ......................................................... 66,100 8,900 57,200 1,440

84
Note 13: Debt
Debt outstanding as of December 31 was as follows:
(in thousands) 2007 2006
5.0% senior, unsecured notes due December 15, 2012, net of discount ...... $ 299,062 $ 298,872
5.125% senior, unsecured notes due October 1, 2014, net of discount........ 274,584 274,523
7.375% senior, unsecured notes due June 1, 2015 ....................................... 200,000 —
Long-term portion of capital lease obligations ............................................. 1,440 3,195
Long-term portion of debt........................................................................ 775,086 576,590
3.5% senior, unsecured notes repaid October 1, 2007, net of discount ....... $ — $ 324,950
Amounts drawn on credit facilities ............................................................... 67,200 112,660
Capital lease obligations due within one year............................................... 1,754 1,581
Short-term portion of debt........................................................................ 68,954 439,191
Total debt .............................................................................................. $ 844,040 $ 1,015,781
Our senior, unsecured notes include covenants that place restrictions on the issuance of additional debt, the
execution of certain sale-leaseback agreements and limitations on certain liens. Discounts from par value are being amortized ratably as increases to interest expense over the term of the related debt.
In May 2007, we issued $200.0 million of 7.375% senior, unsecured notes maturing on June 1, 2015. The
notes were issued via a private placement under Rule 144A of the Securities Act of 1933. These notes were subsequently registered with the SEC via a registration statement which became effective on June 29, 2007. Interest payments are due each June and December. The notes place a limitation on restricted payments, including increases in dividend levels and share repurchases. This limitation does not apply if the notes are upgraded to an investment-grade credit rating. Principal redemptions may be made at our election at any time on or after June 1, 2011 at redemption prices ranging from 100% to 103.688% of the principal amount. We may also redeem up to 35% of the notes at a price equal to 107.375% of the principal amount plus accrued and unpaid interest using the proceeds of certain equity offerings completed before June 1, 2010. In addition, at any time prior to June 1, 2011, we may redeem some or all of the notes at a price equal to 100% of the principal amount plus accrued and unpaid interest and a make-whole premium. If we sell certain of our assets or experience specific types of changes in control, we must offer to purchase the notes at 101% of the principal amount. Proceeds from the offering, net of offering costs, were $196.3 million. These proceeds were used to repay amounts drawn on our credit facility and to invest in marketable securities. On October 1, 2007, we used proceeds from liquidating all of our marketable securities and certain cash equivalents, together with a $120.0 million advance on our credit facilities, primarily to repay $325.0 million of 3.5% unsecured notes plus accrued interest. The fair market value of the notes issued in May 2007 was $199.3 million as of December 31, 2007, based on quoted market prices.
In October 2004, we issued $325.0 million of 3.5% senior, unsecured notes which matured and were repaid
on October 1, 2007 and $275.0 million of 5.125% senior, unsecured notes maturing on October 1, 2014. The notes were issued via a private placement under Rule 144A of the Securities Act of 1933. These notes were subsequently registered with the SEC via a registration statement which became effective on November 23, 2004. Interest payments are due each April and October. Proceeds from the offering, net of offering costs, were $595.5 million. These proceeds were used to pay off commercial paper borrowings used for the acquisition of NEBS. The fair market value of the $275.0 million notes was $229.6 million as of December 31, 2007, based on quoted market prices.
In December 2002, we issued $300.0 million of 5.0% senior, unsecured notes maturing on December 15,
2012. These notes were issued under our shelf registration statement covering up to $300.0 million in medium-term notes, thereby exhausting that registration statement. Interest payments are due each June and December. Proceeds from the offering, net of offering costs, were $295.7 million. These proceeds were used for general corporate

85
purposes, including funding share repurchases, capital asset purchases and working capital. The fair value of these notes was $261.0 million as of December 31, 2007, based on quoted market prices.
Our capital lease obligation bears interest at a rate of 10.4% and is due through 2009. We also have operating
leases on certain facilities and equipment. Future minimum lease payments under our capital obligation and noncancelable operating leases as of December 31, 2007 were as follows:
(in thousands)
Capital lease
Operating leases
2008.................................................................. $ 2,004 $ 8,233
2009.................................................................. 1,503 7,658
2010.................................................................. — 4,932
2011.................................................................. — 2,635
2012.................................................................. — 397
2013 and thereafter ........................................... — 2
Total minimum lease payments ...................... 3,507 $ 23,857
Less portion representing interest ..................... (313)
Present value of minimum lease payments ..... 3,194
Less current portion.......................................... (1,754)
Long-term portion of obligation ..................... $ 1,440
Total future minimum lease payments under capital and noncancelable operating leases have not been reduced
by minimum sublease rentals due under noncancelable subleases. As of December 31, 2007, minimum future sub-lease rentals were $3.5 million for our capital lease and $0.5 million for operating leases.
The composition of rent expense for the years ended December 31 was as follows:
(in thousands) 2007 2006 2005
Minimum rentals................................................................$ 9,143 $ 11,024 $ 14,398
Sublease rentals ................................................................ (2,058) (2,200 ) (1,764)
Net rental expense .........................................................$ 7,085 $ 8,824 $ 12,634
Depreciation of the asset under our capital lease is included in depreciation expense in the consolidated
statements of cash flows. The balance of the leased asset as of December 31 was as follows:
(in thousands) 2007 2006
Buildings and building improvements ................................$ 11,574 $ 11,574
Accumulated depreciation................................................................(9,821) (8,819)
Net assets under capital leases ................................$ 1,753 $ 2,755

86
As of December 31, 2007, we had a $500.0 million commercial paper program in place. Given our current credit ratings, the commercial paper market is not available to us. We also have committed lines of credit which are available for borrowing and to support our commercial paper program. The credit agreements governing the lines of credit contain customary covenants requiring a ratio of earnings before interest and taxes to interest expense of 3.0 times, as well as limits on the levels of subsidiary indebtedness. No commercial paper was outstanding during 2007. The daily average amount outstanding under our lines of credit during 2007 was $45.5 million at a weighted-average interest rate of 5.57%. As of December 31, 2007, $67.2 million was outstanding at an interest rate of 5.62%. The daily average amount outstanding under our commercial paper program and lines of credit during 2006 was $162.5 million at a weighted-average interest rate of 5.34%. As of December 31, 2006, no commercial paper was outstanding and $112.7 million was outstanding under our lines of credit at a weighted-average interest rate of 6.01%. As of December 31, 2007, amounts were available under our committed lines of credit for borrowing or for support of commercial paper, as follows:
(in thousands)
Total available
Expiration date
Commitment fee
Five year line of credit ................................................................$ 275,000 July 2010 .175%
Five year line of credit ................................................................225,000 July 2009 .225%
Total committed lines of credit ................................ 500,000
Amounts drawn on credit facilities ................................ (67,200 )
Outstanding letters of credit ................................ (11,225 )
Net available for borrowing as of December 31, 2007 ................................................................$ 421,575
Absent certain defined events of default under our debt instruments, and as long as our ratio of earnings
before interest, taxes depreciation and amortization to interest expense is in excess of two to one, our debt covenants do not restrict our ability to pay cash dividends at our current rate.
Note 14: Other commitments and contingencies
Indemnifications – In the normal course of business we periodically enter into agreements that incorporate general indemnification language. These indemnifications encompass such items as product or service defects, including breach of security, intellectual property rights, governmental regulations and/or employment-related matters. Performance under these indemnities would generally be triggered by our breach of the terms of the contract. In disposing of assets or businesses, we often provide representations, warranties and/or indemnities to cover various risks including, for example, unknown damage to the assets, environmental risks involved in the sale of real estate, liability to investigate and remediate environmental contamination at waste disposal sites and manufacturing facilities, and unidentified tax liabilities and legal fees related to periods prior to disposition. We do not have the ability to estimate the potential liability from such indemnities because they relate to unknown conditions. However, we have no reason to believe that any likely liability under these indemnities would have a material adverse effect on our financial position, annual results of operations or cash flows. We have recorded liabilities for known indemnifications related to environmental matters.
Environmental matters – We are currently involved in environmental compliance, investigation and remediation activities at some of our current and former sites, primarily printing facilities of our Financial Services and Small Business Services segments which have been sold over the past several years. Remediation costs are accrued on an undiscounted basis when the obligations are either known or considered probable and can be reasonably estimated. Remediation or testing costs that result directly from the sale of an asset and which we would not have otherwise incurred, are considered direct costs of the sale of the asset. As such, they are included in our assessment of the carrying value of the asset.
Accruals for environmental matters were $8.3 million as of December 31, 2007 and $5.0 million as of
December 31, 2006, primarily related to facilities which have been sold. These accruals are included in accrued

87
liabilities and other long-term liabilities in the consolidated balance sheets. Accrued costs consist of direct costs of the remediation activities, primarily fees which will be paid to outside engineering and consulting firms. Although recorded accruals include our best estimates, our total costs cannot be predicted with certainty due to various factors such as the extent of corrective action that may be required, evolving environmental laws and regulations and advances in environmental technology. Where the available information is sufficient to estimate the amount of the liability, that estimate is used. Where the information is only sufficient to establish a range of probable liability and no point within the range is more likely than any other, the lower end of the range is used. We do not believe that the range of possible outcomes could have a material effect on our financial condition, results of operations or liquidity.
As of December 31, 2007, substantially all costs included in our environmental accruals are covered by an
environmental insurance policy which we purchased during 2002. The insurance policy does not cover properties acquired in acquisitions subsequent to 2002. However, costs included in our environmental accruals for such properties were minor as of December 31, 2007. As such, we do not anticipate any significant net cash outlays for environmental matters in 2008. The policy covers up to $12.9 million of remediation costs, of which $2.8 million has been paid through December 31, 2007. The insurance policy also covers up to $10.0 million of third-party claims through 2032 at certain owned, leased and divested sites, as well as any new conditions discovered at certain owned or leased sites through 2012. We consider the realization of recovery under the insurance policy to be probable based on the insurance contract in place with a reputable and financially-sound insurance company. As our environmental accruals include our best estimates of these costs, we have recorded receivables from the insurance company within other current assets and other non-current assets based on the amounts of our environmental accruals for insured sites.
Self-insurance – We are self-insured for certain costs, primarily workers’ compensation claims and medical
and dental benefits. The liabilities associated with these items represent our best estimate of the ultimate obligations for reported claims plus those incurred, but not reported. The liability for worker’s compensation, which totaled $9.9 million as of December 31, 2007 and 2006, is accounted for on a present value basis. The difference between the discounted and undiscounted workers’ compensation liability was $0.8 million as of December 31, 2007 and $0.9 million as of December 31, 2006. We record liabilities for medical and dental benefits payable for active employees and those employees on long-term disability. Our liability for active employees is not accounted for on a present value basis as we expect the benefits to be paid in a relatively short period of time. Our liability for those employees on long-term disability is accounted for on a present value basis and in accordance with SFAS No. 112, Employers’
Accounting for Postemployment Benefits. Our total liability for these medical and dental benefits totaled $8.5 million as of December 31, 2007 and $7.9 million as of December 31, 2006. The difference between the discounted and undiscounted medical and dental liability was $1.0 million as of December 31, 2007 and $1.5 million as of December 31, 2006.
Our self-insurance liabilities are estimated, in part, by considering historical claims experience, demographic
factors and other actuarial assumptions. The estimated accruals for these liabilities, portions of which are calculated by third party actuarial firms, could be significantly affected if future events and claims differ from these assumptions and historical trends.
Litigation – We are party to legal actions and claims arising in the ordinary course of business. We record accruals for legal matters when the expected outcome of these matters is either known or considered probable and can be reasonably estimated. Our accruals do not include related legal and other costs expected to be incurred in defense of legal actions. Based upon information presently available, we believe that it is unlikely that any identified matters, either individually or in the aggregate, will have a material adverse effect on our annual results of operations, financial position or liquidity.
Litigation of income tax matters is accounted for under the provisions of FIN No. 48, Accounting for
Uncertainty in Income Taxes. Further information can be found in Note 9: Income tax provision.

88
Note 15: Common stock purchase rights
In February 1988, we adopted a shareholder rights plan under which common stock purchase rights automatically attach to each share of common stock we issue. The rights plan is governed by a rights agreement between us and Wells Fargo Bank, National Association, as rights agent. This agreement most recently was amended and restated as of December 20, 2006 (Restated Agreement).
Pursuant to the Restated Agreement, upon the occurrence of certain events, each right will entitle the holder to purchase one share of common stock at an exercise price of $100. The exercise price may be adjusted from time to time upon the occurrence of certain events outlined in the Restated Agreement. In certain circumstances described in the Restated Agreement, if (i) any person becomes the beneficial owner of 20% or more of the company’s common stock, (ii) the company is acquired in a merger or other business combination or (iii) upon the occurrence of other events, each right will entitle its holder to purchase a number of shares of common stock of the company, or the acquirer or the surviving entity if the company is not the surviving corporation in such a transaction. The number of shares purchasable at the then-current exercise price will be equal to the exercise price of the right divided by 50% of the then-current market price of one share of common stock of the company, or other surviving entity, subject to adjustments provided in the Restated Agreement. The rights expire December 31, 2016, and may be redeemed by the company at a price of $.01 per right at any time prior to the occurrence of the circumstances described above. The Restated Agreement requires an independent director review of the plan at least once every three years.
Note 16: Shareholders’ equity (deficit)
As of December 31, 2006, we were in a shareholders’ deficit position due to the required accounting treatment for share repurchases, completed primarily in 2002 and 2003. Share repurchases are reflected as reductions of shareholders’ equity in the consolidated balance sheets. Under the laws of Minnesota, our state of incorporation, shares which we repurchase are considered to be authorized and unissued shares. Thus, share repurchases are not presented as a separate treasury stock caption in our consolidated balance sheets, but are recorded as direct reductions of common shares, additional paid-in capital and retained earnings.
We have an outstanding authorization from our board of directors to purchase up to 10 million shares of our
common stock. This authorization has no expiration date, and 7.5 million shares remain available for purchase under this authorization as of December 31, 2007. We repurchased 0.4 million shares during 2007 for $11.3 million, and we repurchased an additional 0.6 million shares for $13.6 million through February 21, 2008. No shares were repurchased in 2006 or 2005.
Accumulated other comprehensive loss as of December 31 was comprised of the following:
(in thousands) 2007 2006 2005
Postretirement and defined benefit pension plans:
Unrealized prior service credit................................$ 25,305 $ 28,398 $ —
Unrealized net actuarial losses................................ (61,422) (61,993) —
Fourth quarter plan contributions................................ — (47) —
Postretirement and defined benefit pension plans, net of tax ................................................................(36,117) (33,642) —
Loss on derivatives, net of tax................................................................(8,881) (11,162) (13,721)
Unrealized gain on securities, net of tax................................ — 242 63
Currency translation adjustment ................................ 5,952 2,689 2,434
Accumulated other comprehensive loss................................$ (39,046) $ (41,873) $ (11,224)
89
Note 17: Business segment information
We operate three business segments: Small Business Services, Financial Services and Direct Checks. Small Business Services sells business checks, printed forms, promotional products, marketing materials and related services and products to small businesses and home offices through direct response marketing, financial institution referrals, sales representatives, independent distributors and the internet. Financial Services sells personal and business checks, check-related products and services, stored value gift cards and customer loyalty, retention and fraud monitoring/protection services to financial institutions. Direct Checks sells personal and business checks and related products and services directly to consumers through direct response marketing and the internet. All three segments operate primarily in the United States. Small Business Services also has operations in Canada. No single customer accounted for more than 10% of revenue in 2007, 2006 or 2005.
The accounting policies of the segments are the same as those described in Note 1. We allocate corporate costs to
our business segments, including costs of our executive management, human resources, supply chain, finance, information technology and legal functions. Generally, where costs incurred are directly attributable to a business segment, primarily within the areas of information technology, supply chain and finance, those costs are reported in that segment’s results. Due to our shared services approach to many of our functions, certain costs are not directly attributable to a business segment. These costs are allocated to our business segments based on segment revenue, as revenue is a measure of the relative size and magnitude of each segment and indicates the level of corporate shared services consumed by each segment. Corporate asset balances are not allocated to the segments. Depreciation and amortization expense related to corporate assets which was allocated to the segments was $31.9 million in 2007, $18.9 million in 2006 and $14.7 million in 2005. Corporate assets consist primarily of property, plant and equipment, internal-use software, inventories and supplies related to our corporate shared services functions of manufacturing, information technology and real estate. Additionally, corporate assets include long-term investments and deferred income taxes.
Effective January 1, 2007, we reclassified as corporate assets the property, plant and equipment, internal-use
software, inventories and supplies related to our corporate shared services functions of manufacturing, information technology and real estate. These assets had previously been managed as business segment assets and were reported within our business segments. Because we realigned our organization and implemented a shared services approach for most functions, these assets are now managed as corporate assets which we do not allocate to our business segments. Asset and capital expenditure information for prior periods has been recast to reflect this change.
Upon the acquisition of NEBS in June 2004, we did not begin allocating corporate costs to the NEBS portion of
Small Business Services, as NEBS continued to utilize its legacy systems and organizations as we developed and implemented plans for the integration of the businesses. On April 1, 2005, NEBS implemented certain of our corporate information systems and began utilizing most of our corporate shared services functions. As such, we began allocating corporate costs to the NEBS portion of the Small Business Services segment for those corporate functions being utilized by the NEBS business. As of January 1, 2006, NEBS was fully integrated into all of our corporate functions and we began allocating our corporate costs to all of our business segments, based on segment revenue.
We are an integrated enterprise, characterized by substantial intersegment cooperation, cost allocations and the
sharing of assets. Therefore, we do not represent that these segments, if operated independently, would report the operating income and other financial information shown.

90
The following is our segment information as of and for the years ended December 31:
Reportable business segments
(in thousands)
Small Business Services
Financial Services
Direct Checks Corporate Consolidated
Revenue from external customers: 2007 ................................ $ 939,139 $ 457,292 $ 209,936 $ — $ 1,606,367
2006 ................................ 969,809 458,118 211,727 — 1,639,654
2005 ................................ 932,286 537,525 246,483 — 1,716,294
Operating income: 2007 ................................ 130,462 74,305 62,778 — 267,545
2006 ................................ 86,764 46,613 64,922 — 198,299
2005 ................................ 105,118 119,677 80,044 — 304,839
Depreciation and amortization 2007 ................................ 53,161 9,936 4,794 — 67,891 expense: 2006 ................................ 63,214 14,548 7,108 — 84,870
2005 ................................ 72,165 27,708 8,475 — 108,348
Asset impairment loss: 2007 ................................ — — — — —
2006 ................................ 18,285 26,413 — — 44,698 2005 ................................ — — — — —
Total assets: 2007 ................................ 750,483 66,475 102,452 291,345 1,210,755 2006 ................................ 784,815 90,075 105,041 287,201 1,267,132 2005 ................................ 804,591 112,977 107,047 401,260 1,425,875
Capital asset purchases: 2007 ................................ — — — 32,328 32,328
2006 ................................ — — — 41,324 41,324
2005 ................................ — — — 55,653 55,653
During 2007, we modified the manner in which we classify our revenue by product type. The change in
classification was primarily comprised of removing certain deposit slip items from accessories and promotional products and including them in other printed products, including forms. Prior year information has been recast to reflect the current year classification. Revenue by product was as follows:
(in thousands) 2007 2006 2005
Checks and related services ................................$ 1,045,008 $ 1,041,523 $ 1,110,695
Other printed products, including forms............................ 380,632 375,025 377,756
Accessories and promotional products .............................. 129,169 134,618 144,693
Packaging supplies and other................................ 51,558 88,488 83,150
Total revenue................................................................$ 1,606,367 $ 1,639,654 $ 1,716,294
The following information is based on the geographic locations of our subsidiaries:
(in thousands) 2007 2006 2005
Revenue from external customers:
United States................................................................$ 1,534,804 $ 1,570,824 $ 1,656,633
Canada................................................................ 71,563 68,830 59,661
Total revenue...............................................................$ 1,606,367 $ 1,639,654 $ 1,716,294
Long-lived assets:
United States................................................................$ 1,005,145 $ 1,052,257 $ 1,195,112
Foreign, primarily Canada ................................ 13,665 12,758 16,825
Total long-lived assets ................................$ 1,018,810 $ 1,065,015 $ 1,211,937

91
DELUXE CORPORATION
SUMMARIZED QUARTERLY FINANCIAL DATA (UNAUDITED)
(in thousands, except per share amounts)
2007 Quarter Ended
March 31(1) June 30 September 30(2) December 31(3)
Revenue ........................................................$ 403,834 $ 399,871 $ 388,636 $ 414,026Gross profit................................................... 254,517 257,077 245,138 263,074Net income.................................................... 35,228 35,975 32,160 40,152Earnings per share: Basic .......................................................... 0.69 0.70 0.62 0.78 Diluted ....................................................... 0.68 0.69 0.62 0.77Cash dividends per share .............................. 0.25 0.25 0.25 0.25
2006 Quarter Ended
March 31 June 30(4) September 30(5) December 31(6)
Revenue ........................................................$ 411,430 $ 402,959 $ 398,087 $ 427,178Gross profit................................................... 255,454 251,291 248,358 271,272Net income (loss).......................................... 24,668 (2,367) 31,163 47,490Earnings (loss) per share: Basic .......................................................... 0.49 (0.05) 0.61 0.93 Diluted ....................................................... 0.48 (0.05) 0.61 0.92Cash dividends per share .............................. 0.40 0.40 0.25 0.25
(1) 2007 first quarter results include income tax expense of $1.2 million for discrete items, primarily the non-deductible write-off
of goodwill related to the sale of our industrial packaging product line, partially offset by the final settlement of an uncertain tax position.
(2) 2007 third quarter results include a $1.3 million reduction in income tax expense for discrete items, primarily the
reconciliation of our 2006 federal income tax return to our 2006 income tax provision. Results also include net pre-tax restructuring accruals of $2.1 million related to various employee reductions.
(3) 2007 fourth quarter results include a $1.8 million reduction in income tax expense for discrete items, primarily adjustments to
receivables related to prior year income tax returns. Results also include net pre-tax restructuring accruals of $2.7 million related to various employee reductions.
(4) 2006 second quarter results include a pre-tax asset impairment loss of $44.7 million related to the abandonment of a software project.
(5) 2006 third quarter results include a $2.9 million reduction in income tax expense related to changes in our legal entity
structure and the settlement of prior period tax audits. Results also include net pre-tax restructuring accruals of $2.1 million related to various employee reductions.
(6) 2006 fourth quarter results include a pre-tax gain of $11.0 million from the termination of an underperforming outsourced
payroll services contract, a $5.0 million reduction in income tax expense related to one-time deferred tax adjustments, as well as net pre-tax restructuring accruals of $8.4 million related to various employee reductions.

92
Item 9. Changes in and Disagreements with Accountants on Accounting and Financial Disclosure.
None.
Item 9A. Controls and Procedures.
Disclosure Controls and Procedures – As of the end of the period covered by this report (the Evaluation Date), we carried out an evaluation, under the supervision and with the participation of management, including the Chief Executive Officer and the Chief Financial Officer, of the effectiveness of the design and operation of our disclosure controls and procedures (as defined in Rule 13a-15(e) of the Securities Exchange Act of 1934, as amended (the 1934 Act)). Based upon that evaluation, the Chief Executive Officer and the Chief Financial Officer concluded that, as of the Evaluation Date, our disclosure controls and procedures were effective to ensure that information required to be disclosed in the reports that we file or submit under the Exchange Act is (i) recorded, processed, summarized and reported within the time periods specified in applicable rules and forms, and (ii) accumulated and communicated to our management, including our Chief Executive Officer and Chief Financial Officer, to allow timely decisions regarding required disclosure.
Internal Control Over Financial Reporting – There were no changes in our internal control over financial
reporting identified in connection with our evaluation during the quarter ended December 31, 2007, which have materially affected, or are reasonably likely to materially affect, our internal control over financial reporting.
Management’s Report on Internal Control over Financial Reporting – Management of Deluxe Corporation is responsible for establishing and maintaining adequate internal control over financial reporting. Internal control over financial reporting is a process designed to provide reasonable assurance regarding the reliability of financial reporting and the preparation of financial statements for external purposes in accordance with generally accepted accounting principles in the United States of America.
Because of its inherent limitations, internal control over financial reporting may not prevent or detect
misstatements. Also, projections of any evaluation of effectiveness to future periods are subject to the risk that controls may become inadequate because of changes in conditions, or that the degree of compliance with the policies or procedures may deteriorate.
Management assessed the effectiveness of our internal control over financial reporting as of December 31, 2007.
In making this assessment, it used the criteria set forth by the Committee of Sponsoring Organizations of the Treadway Commission (COSO) in Internal Control – Integrated Framework. Based on this assessment we have concluded that, as of December 31, 2007, our internal control over financial reporting was effective based on those criteria. The attestation report on our internal control over financial reporting issued by PricewaterhouseCoopers LLP appears in Item 8 of this report.
Item 9B. Other Information.
None.

93
PART III
Except where otherwise noted, the information required by Items 10 through 14 is incorporated by reference from our definitive proxy statement, to be filed with the Securities and Exchange Commission within 120 days of our fiscal year-end, with the exception of the executive officers section of Item 10, which is included in Part I, Item 1 of this report.
Item 10. Directors, Executive Officers and Corporate Governance.
See Part I, Item 1 of this report “Executive Officers of the Registrant.” The sections of the proxy statement entitled “Item 1: Election of Directors,” “Board Structure and Governance—Audit Committee Expertise; Complaint-Handling Procedures,” “Board Structure and Governance—Meetings and Committees of the Board of Directors—Audit Committee,” “Stock Ownership and Reporting—Section 16(a) Beneficial Ownership Reporting Compliance” and “Board Structure and Governance—Code of Ethics and Business Conduct” are incorporated by reference to this report.
The full text of our Code of Ethics and Business Conduct (Code of Ethics) is posted on the Investor Relations
page of our website at www.deluxe.com under the “Corporate Governance” caption. We intend to satisfy the disclosure requirement under Item 5.05 of Form 8-K regarding an amendment to, or waiver from, a provision of the Code of Ethics that applies to our principal executive officer, principal financial officer, principal accounting officer or controller or persons performing similar functions by posting such information on our website at the address and location specified above.
Item 11. Executive Compensation.
The sections of the proxy statement entitled “Compensation Committee Report,” “Executive Compensation,” “Director Compensation” and “Board Structure and Governance—Compensation Committee Interlocks and Insider Participation” are incorporated by reference to this report.
Item 12. Security Ownership of Certain Beneficial Owners and Management and Related Stockholder Matters.
The section of the proxy statement entitled “Stock Ownership and Reporting—Security Ownership of Certain Beneficial Owners and Management” is incorporated by reference to this report. The information required pursuant to Item 201(d) of Regulation S-K is incorporated by reference to this report from the section of the proxy statement entitled “Item 4: Approval of the 2008 Stock Incentive Plan—Equity Compensation Plan Information.”
Item 13. Certain Relationships and Related Transactions, and Director Independence.
None of our directors or officers, nor any known person who beneficially owns, directly or indirectly, five
percent of our common stock, nor any member of the immediate family of any of the foregoing persons has any material interest, direct or indirect, in any transaction since January 1, 2007 or in any presently proposed transaction which, in either case, has affected or will materially affect us. None of our directors or officers is indebted to us.
The sections of the proxy entitled “Board Structure and Governance—Board Oversight and Director
Independence” and “Board Structure and Governance—Related Party Transaction Policy and Procedures” are incorporated by reference to this report.

94
Item 14. Principal Accounting Fees and Services.
The sections of the proxy statement entitled “Fiscal Year 2007 Audit and Independent Registered Public Accounting Firm—Fees Paid to Registered Public Accounting Firm” and “Fiscal Year 2007 Audit and Independent Registered Public Accounting Firm—Policy on Audit Committee Pre-Approval of Accounting Firm Fees and Services” are incorporated by reference to this report.
PART IV
Item 15. Exhibits, Financial Statement Schedules. (a) Financial Statements and Schedules
The financial statements are set forth under Item 8 of this Annual Report on Form 10-K. Financial statement
schedules have been omitted since they are either not required or not applicable, or the required information is shown in the consolidated financial statements or notes.
(b) Exhibit Listing
The following exhibits are filed as part of or are incorporated in this report by reference:
Exhibit Method of
Number Description Filing
1.1 Purchase Agreement, dated September 28, 2004, by and among us and J.P.
Morgan Securities Inc. and Wachovia Capital Markets, LLC, as
representatives of the several initial purchasers listed in Schedule 1 of the
Purchase Agreement (incorporated by reference to Exhibit 1.1 to the Current
Report on Form 8-K filed with the Commission on October 4, 2004)
*
2.1 Agreement and Plan of Merger, dated as of May 17, 2004, by and among us,
Hudson Acquisition Corporation and New England Business Service, Inc.
(incorporated by reference to Exhibit (d)(1) to the Deluxe Corporation
Schedule TO-T filed with the Commission on May 25, 2004)
*
3.1 Articles of Incorporation (incorporated by reference to the Annual Report on
Form 10-K for the year ended December 31, 1990)
*
3.2 Bylaws (incorporated by reference to Exhibit 3.2 to the Quarterly Report on
Form 10-Q for the quarter ended June 30, 2006)
*
4.1 Amended and Restated Rights Agreement, dated as of December 20, 2006, by
and between us and Wells Fargo Bank, National Association, as Rights Agent,
which includes as Exhibit A thereto, the Form of Rights Certificate
(incorporated by reference to Exhibit 4.1 to the Current Report on Form 8-K
filed with the Commission on December 21, 2006)
*
4.2 First Supplemental Indenture dated as of December 4, 2002, by and between
us and Wells Fargo Bank Minnesota, N.A. (formerly, Norwest Bank
Minnesota, National Association), as trustee (incorporated by reference to
Exhibit 4.1 to the Form 8-K filed with the Commission on December 5, 2002)
*

95
4.3 Indenture, dated as of April 30, 2003, by and between us and Wells Fargo
Bank Minnesota, N.A. (formerly Norwest Bank Minnesota, National
Association), as trustee (incorporated by reference to Exhibit 4.8 to the
Registration Statement on Form S-3 (Registration No. 333-104858) filed with
the Commission on April 30, 2003)
*
4.4 Form of Officer’s Certificate and Company Order authorizing the 2014 Notes,
series B (incorporated by reference to Exhibit 4.9 to the Registration
Statement on Form S-4 (Registration No. 333-120381) filed with the
Commission on November 12, 2004)
*
4.5 Specimen of 5 1/8% notes due 2014, series B (incorporated by reference to
Exhibit 4.10 to the Registration Statement on Form S-4 (Registration No. 333-
120381) filed with the Commission on November 12, 2004)
*
4.6 Indenture, dated as of May 14, 2007, by and between us and the The Bank of New York Trust Company, N.A., as trustee (including form of 7.375% Senior Notes due 2015) (incorporated by reference to Exhibit 4.1 to the Current Report on Form 8-K filed with the Commission on May 15, 2007)
*
4.7 Registration Rights Agreement, dated May 14, 2007, by and between us and J.P. Morgan Securities Inc., as representative of the several initial purchasers listed in Schedule I to the Purchase Agreement related to the 7.375% Senior Notes due 2015 (incorporated by reference to Exhibit 4.2 to the Current Report on Form 8-K filed with the Commission on May 15, 2007)
*
4.8 Specimen of 7.375% Senior Notes due 2015 (included in Exhibit 4.6)
*
10.1 Deluxe Corporation 2004 Annual Incentive Plan (incorporated by reference to
Exhibit 10.1 to the Quarterly Report on Form 10-Q for the quarter ended June
30, 2004)**
*
10.2 Deluxe Corporation 2000 Stock Incentive Plan, as Amended (incorporated by
reference to Exhibit 10.2 to the Quarterly Report on Form 10-Q for the
quarter ended June 30, 2002)**
*
10.3 Annex I to the Deluxe Corporation 2000 Stock Incentive Plan, Non-employee
Director Stock and Deferral Plan, as Amended (incorporated by reference to
Exhibit 10.3 to the Annual Report on Form 10-K for the year ended December
31, 2006)**
*
10.4 Amended and Restated 2000 Employee Stock Purchase Plan (incorporated by
reference to Exhibit 10.18 to the Annual Report on Form 10-K for the year
ended December 31, 2001)**
*
10.5 Deluxe Corporation Deferred Compensation Plan (2001 Restatement)
(incorporated by reference to Exhibit 10.1 to the Quarterly Report on Form
10-Q for the quarter ended March 31, 2001)**
*
10.6 First Amendment of the Deluxe Corporation Deferred Compensation Plan
(2001 Restatement) (incorporated by reference to Exhibit 4.3 to the Form S-8
filed January 7, 2002)**
*

96
10.7 Second Amendment of the Deluxe Corporation Deferred Compensation Plan
(2001 Restatement) (incorporated by reference to Exhibit 10.19 to the Annual
Report on Form 10-K for the year ended December 31, 2002)**
*
10.8 Third Amendment of the Deluxe Corporation Deferred Compensation Plan
(2001 Restatement) (incorporated by reference to Exhibit 10.7 to the Annual
Report on Form 10-K for the year ended December 31, 2005)**
*
10.9 Deluxe Corporation Deferred Compensation Plan Trust (incorporated by
reference to Exhibit 4.3 to the Form S-8 filed January 7, 2002)**
*
10.10 Deluxe Corporation Executive Deferred Compensation Plan for Employee
Retention and Other Eligible Arrangements (incorporated by reference to
Exhibit 10.24 to the Quarterly Report on Form 10-Q for the quarter ended
June 30, 2000)**
*
10.11 Deluxe Corporation Supplemental Benefit Plan (incorporated by reference to
Exhibit (10)(B) to the Annual Report on Form 10-K for the year ended
December 31, 1995)**
*
10.12 First Amendment to the Deluxe Corporation Supplemental Benefit Plan (2001
Restatement) (incorporated by reference to Exhibit 10.19 to the Annual
Report on Form 10-K for the year ended December 31, 2001)**
*
10.13 Description of modification to the Deluxe Corporation Non-Employee
Director Retirement and Deferred Compensation Plan (incorporated by
reference to Exhibit 10.10 to the Annual Report on Form 10-K for the year
ended December 31, 1997)**
*
10.14 Description of Non-employee Director Compensation Arrangements, updated
January 1, 2008**
Filed
herewith
10.15 Form of Severance Agreement entered into between Deluxe and the following
executive officers: Anthony Scarfone, Luann Widener, Terry Peterson,
Leanne Branham, Mike Degeneffe, Richard Greene, Lynn Koldenhoven and
Jeff Stoner (incorporated by reference to Exhibit 10.17 to the Annual Report
on Form 10-K for the year ended December 31, 2000)**
*
10.16 Form of Executive Retention Agreement entered into between Deluxe and the
following executive officers: Anthony Scarfone, Luann Widener, Mike
Degeneffe, Richard Greene and Jeff Stoner (incorporated by reference to
Exhibit 10.19 to the Annual Report on Form 10-K for the year ended
December 31, 2000)**
*
10.17 Form of Executive Retention Agreement between Deluxe and Lee Schram
(incorporated by reference to Exhibit 99.2 to the Current Report on Form 8-K
filed with the Commission on April 17, 2006)**
*
10.18 Form of Executive Retention Agreement, dated as of August 8, 2007, by and
between Deluxe and Lee J. Schram (incorporated by reference to Exhibit 99.1
to the Current Report on Form 8-K filed with the Commission on August 10,
2007)**
*

97
10.19 Form of Executive Retention Agreement, dated as of August 8, 2007, by and
between Deluxe and each Senior Vice President (incorporated by reference to
Exhibit 99.2 to the Current Report on Form 8-K filed with the Commission on
August 10, 2007)**
*
10.20 Form of Executive Retention Agreement, dated as of August 8, 2007, by and
between Deluxe and each of three Vice Presidents (incorporated by reference
to Exhibit 99.3 to the Current Report on Form 8-K filed with the Commission
on August 10, 2007)**
*
10.21 Form of Agreement for Awards Payable in Restricted Stock Units
(incorporated by reference to Exhibit 10.1 to the Current Report on Form 8-K
filed with the Commission on January 28, 2005)**
*
10.22 Form of Non-employee Director Non-qualified Stock Option Agreement
(incorporated by reference to Exhibit 10.19 to the Annual Report on Form 10-
K for the year ended December 31, 2004)**
*
10.23 Form of Non-employee Director Restricted Stock Award Agreement
(incorporated by reference to Exhibit 10.20 to the Annual Report on Form 10-
K for the year ended December 31, 2004)**
*
10.24 Form of Agreement as to Award of Restricted Common Stock (Non-
Employee Director Grants) (incorporated by reference to Exhibit 10.1 to the
Current Report on Form 8-K filed with the Commission on October 27,
2006)**
*
10.25 Form of Non-Employee Director Restricted Stock Award Agreement (ver.
4/07) (incorporated by reference to Exhibit 10.1 to the Quarterly Report on
Form 10Q for the quarter ended March 31, 2007)**
*
10.26 Form of Non-qualified Stock Option Agreement (as amended February 2006)
(incorporated by reference to Exhibit 10.1 to the Current Report on Form 8-K
filed with the Commission on February 21, 2006)**
*
10.27 Form of Non-qualified Stock Option Agreement (incorporated by reference to
Exhibit 10.21 to the Annual Report on Form 10-K for the year ended
December 31, 2004)**
*
10.28 Form of Performance Award Agreement (incorporated by reference to Exhibit
10.22 to the Annual Report on Form 10-K for the year ended December 31,
2004)**
*
10.29 Form of Restricted Stock Award Agreement (Two-Year Retention Term)
(incorporated by reference to Exhibit 10.3 to the Current Report on Form 8-K
filed with the Commission on February 21, 2006)**
*
10.30 Form of Restricted Stock Award Agreement (incorporated by reference to
Exhibit 10.23 to the Annual Report on Form 10-K for the year ended
December 31, 2004)**
*
10.31 Form of Performance Accelerated Restricted Stock Award Agreement (2006
grants) (incorporated by reference to Exhibit 10.2 to the Current Report on
Form 8-K filed with the Commission on February 21, 2006)**
*
98
10.32 Form of Non-Qualified Stock Option Agreement (version 2/07) (incorporated by reference to exhibit 10.28 to the Annual Report on Form 10-K for the year ended December 31, 2006)**
*
10.33 Form of Performance Accelerated Restricted Stock Award Agreement
(version 2/07) (incorporated by reference to Exhibit 10.29 to the Annual
Report on Form 10-K for the year ended December 31, 2006)**
*
10.34 Employment Agreement dated as of April 10, 2006, between Deluxe and Lee
Schram (incorporated by reference to Exhibit 99.1 to the Current Report on
Form 8-K filed with the Commission on April 17, 2006)**
*
10.35 Offer letter, dated as of September 15, 2006, between Deluxe and Richard S.
Greene (incorporated by reference to Exhibit 10.1 to the Quarterly Report on
Form 10-Q for the quarter ended September 30, 2006)**
*
12.1 Statement re: Computation of Ratios
Filed
herewith
21.1 Subsidiaries of the Registrant
Filed
herewith
23.1 Consent of Independent Registered Public Accounting Firm Filed
herewith
24.1 Power of Attorney Filed
herewith
31.1 CEO Certification of Periodic Report pursuant to Section 302 of the
Sarbanes-Oxley Act of 2002
Filed herewith
31.2 CFO Certification of Periodic Report pursuant to Section 302 of the Sarbanes-Oxley Act of 2002
Filed herewith
32.1 CEO and CFO Certification of Periodic Report pursuant to Section 906 of the Sarbanes-Oxley Act of 2002
Furnished herewith
*Incorporated by reference **Denotes compensatory plan or management contract
Note to recipients of Form 10-K: Copies of exhibits will be furnished upon written request and payment of reasonable expenses in furnishing such copies.

99
SIGNATURES
Pursuant to the requirements of Section 13 or 15(d) of the Securities Exchange Act of 1934, the registrant has duly caused this report to be signed on its behalf by the undersigned, thereunto duly authorized.
DELUXE CORPORATION
Date: February 22, 2008 By: /s/ Lee Schram
Lee Schram Chief Executive Officer
Pursuant to the requirements of the Securities Exchange Act of 1934, this report has been signed below by the
following persons on behalf of the registrant and in the capacities indicated on February 22, 2008.
Signature Title
By /s/ Lee Schram Chief Executive Officer Lee Schram (Principal Executive Officer)
By /s/ Richard S. Greene Senior Vice President, Chief Financial Officer Richard S. Greene (Principal Financial Officer)
By /s/ Terry D. Peterson Vice President, Investor Relations and Chief Accounting
Terry D. Peterson Officer (Principal Accounting Officer)
*
Ronald C. Baldwin Director
* Charles A. Haggerty Director *
Isaiah Harris, Jr. Director *
Don J. McGrath Director *
Cheryl Mayberry McKissack Director *
Neil J. Metviner Director

100
* Stephen P. Nachtsheim Director *
Mary Ann O’Dwyer Director
* Martyn R. Redgrave Director
*By: /s/ Lee Schram Lee Schram Attorney-in-Fact

101
EXHIBIT INDEX
Exhibit No. Description
10.14 Description of Non-employee Director Compensation Arrangements, updated January 1, 2008
12.1 Statement re: Computation of Ratios
21.1 Subsidiaries of the Registrant
23.1 Consent of Independent Registered Public Accounting Firm
24.1 Power of Attorney
31.1 CEO Certification of Periodic Report pursuant to Section 302 of the Sarbanes-Oxley Act of 2002
31.2 CFO Certification of Periodic Report pursuant to Section 302 of the Sarbanes-Oxley Act of 2002
32.1 CEO and CFO Certification of Periodic Report pursuant to Section 906 of the Sarbanes-Oxley Act of 2002