our mobile apps are the - investor's business daily
TRANSCRIPT


OUR MOBILE APPS ARE THE PERFECT COMPANIONS TO MARKETSMITH DESKTOP.
With today’s fast-moving market, easy access to your
investments and watch lists is more important than ever.
MarketSmith phone and tablet apps offer exceptional
speed and clarity, so your stock research can be as
mobile as you are.
MarketSmith trials and memberships include access on
all three platforms.
STAY ON TOP OF THE MARKETANYWHERE

Stock Guide // 2017 Q3
At MarketSmith, we believe a solid investment research routine is the key making money in the market. A regular routine helps you stay prepared and focused on the stock markets best opportunities. Whether you are a day trader or a weekend warrior, it’s important to have a regular research routine. This Stock Guide outlines a suggested weekend and weekday research routine, along with recommended screens and MarketSmith pre-set reports to support them. This quarter’s customer success story comes from Mike Scott in Thousand Oaks, California. He discusses a valuable lesson he learned about overcoming emotions to buyback a stock after a shakeout. Mike also shares one of the stock screens he uses to find winning stocks. Coaches Corner is a new feature in this edition. We introduce you to MarketSmith product coach, Irusha Peiris, who’s been with MarketSmith 7 years and an avid investor for over 13 years. As always, if you have any questions or comments about your investing research or any MarketSmith features, please call one of our product coaches at (800) 831-2525 or email us at [email protected]. We’re here to help you make more money in the market. Best Returns, The MarketSmith Team
2
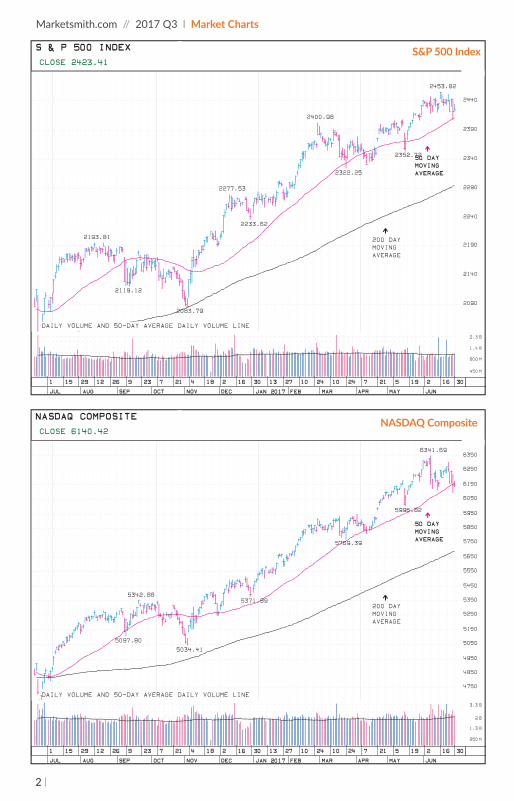
Marketsmith.com // 2017 Q3 l Market Charts
S & P 500 INDEXCLOSE 2423.41
2193.81
2277.53
2400.98
2453.82
2119.12
2083.79
2233.62
2322.25
2352.7250 DAY MOVING AVERAGE
200 DAY MOVING AVERAGE
2453.822453.822453.82
50 DAY MOVING AVERAGE
2453.82
50 DAY MOVING AVERAGE
50 DAY MOVING AVERAGE
2352.722352.7250 DAY 2352.7250 DAY MOVING AVERAGE
2352.722352.72
200 DAY
AVERAGE
200 DAY MOVING AVERAGE
200 DAY MOVING AVERAGE
200 DAY MOVING AVERAGE
2322.252322.252322.252322.25
2400.982400.982400.98
2233.622233.622233.62
2277.53
2233.62
2277.532277.532277.532277.53
2083.792083.792083.79
2119.122119.122119.122119.12
2193.812193.812193.812193.812193.812193.812193.812193.81
MOVING
2277.532277.532277.532277.532277.53
50 DAY
2090
2140
2190
2240
2290
2340
2390
2440
DAILY VOLUME AND 50-DAY AVERAGE DAILY VOLUME LINE
450 M
800 M
1.4 B
2.3 B
3016219521724102410271330162184217239261229151
JUNMAYAPRMARFEBJAN 2017DECNOVOCTSEPAUGJUL
NASDAQ COMPOSITECLOSE 6140.42
5342.88
6341.69
5097.80
5034.41
5371.89
5769.39
5996.82
50 DAY MOVING AVERAGE
200 DAY MOVING AVERAGE
6341.696341.69
50 DAY MOVING AVERAGE
6341.696341.69
50 DAY MOVING AVERAGE
6341.696341.69
50 DAY MOVING AVERAGE
5996.82
50 DAY MOVING AVERAGE
5996.825996.82
200 DAY 200 DAY
AVERAGE
200 DAY 200 DAY MOVING AVERAGE
200 DAY 200 DAY MOVING AVERAGE
200 DAY 200 DAY MOVING AVERAGE
5769.395769.395769.395769.395769.395769.395769.39
5371.895371.895371.895371.895371.89
5034.415034.415034.41
5342.885342.88
5097.80
5342.88
5097.805097.805097.80
MOVING
5371.895371.895371.895371.895371.89
5769.395769.395769.395769.395769.395769.39
4750
4850
4950
5050
5150
5250
5350
5450
5550
5650
5750
5850
5950
6050
6150
6250
6350
DAILY VOLUME AND 50-DAY AVERAGE DAILY VOLUME LINE
850 M
1.3 B
2 B
3.3 B
3016219521724102410271330162184217239261229151
JUNMAYAPRMARFEBJAN 2017DECNOVOCTSEPAUGJUL
S&P 500 Index
NASDAQ Composite

3
*All screen results are computer-generated and were run on June 30, 2017.
Market Charts . . . . . . . . . . . . . . . . . . . . . . . . . . . . . . . . . . . . . . . . . . . . . . . . . 2
Research Routines - Weekend Routine . . . . . . . . . . . . . . . . . . . . . . . . . . . 4
Research Routines - Weekday Routine . . . . . . . . . . . . . . . . . . . . . . . . . . . 7
Weekly Watch List Refresh* . . . . . . . . . . . . . . . . . . . . . . . . . . . . . . . . . . . . 10
Control4 Corporation (CTRL) . . . . . . . . . . . . . . . . . . . . . . . . . . . . . . . . . .11
Arista Networks Inc (ANET) . . . . . . . . . . . . . . . . . . . . . . . . . . . . . . . . . .11
Universal Display Corp (OLED) . . . . . . . . . . . . . . . . . . . . . . . . . . . . . . . .12
Logitech Intl Sa (LOGI) . . . . . . . . . . . . . . . . . . . . . . . . . . . . . . . . . . . . . . .12
Ollie’s Bargain Outlet (OLLI) . . . . . . . . . . . . . . . . . . . . . . . . . . . . . . . . . . .13
T A L Education Gp A Ads (TAL) . . . . . . . . . . . . . . . . . . . . . . . . . . . . . . . .13
Customer Success Story: Mike Scott . . . . . . . . . . . . . . . . . . . . . . . . . . . . . 14
High Growth Stocks* . . . . . . . . . . . . . . . . . . . . . . . . . . . . . . . . . . . . . . . . . . . 16
Supernus Pharmaceuticals (SUPN) . . . . . . . . . . . . . . . . . . . . . . . . . . . . .17
Weibo Corp Cl A Ads (WB) . . . . . . . . . . . . . . . . . . . . . . . . . . . . . . . . . . . .17
MarketSmith Coaches Corner . . . . . . . . . . . . . . . . . . . . . . . . . . . . . . . . . . . 18
Relative Strength Super Screen* . . . . . . . . . . . . . . . . . . . . . . . . . . . . . . . . . 20
Petmed Express Inc (PETS) . . . . . . . . . . . . . . . . . . . . . . . . . . . . . . . . . . . .21
Lantheus Holdings Inc (LNTH) . . . . . . . . . . . . . . . . . . . . . . . . . . . . . . . . .21
Baozun Inc Cl A Ads (BZUN). . . . . . . . . . . . . . . . . . . . . . . . . . . . . . . . . . .22
R H (RH) . . . . . . . . . . . . . . . . . . . . . . . . . . . . . . . . . . . . . . . . . . . . . . . . . . . .22
Nvidia Corp (NVDA) . . . . . . . . . . . . . . . . . . . . . . . . . . . . . . . . . . . . . . . . .23
Autohome Inc Cl A Ads (ATHM). . . . . . . . . . . . . . . . . . . . . . . . . . . . . . . .23
MarketSmith Features . . . . . . . . . . . . . . . . . . . . . . . . . . . . . . . . . . . . . . . . . 24
Resources . . . . . . . . . . . . . . . . . . . . . . . . . . . . . . . . . . . . . . . . . . . . . . . . . . . . . 26
Connect with Us . . . . . . . . . . . . . . . . . . . . . . . . . . . . . . . . . . . . . . . . . . . . . . . 27
Table of Contents

4
Marketsmith.com // 2017 Q3 l Research Routines
WEEKEND ROUTINE: Preparing your watch list for the week aheadWhether you have 20 minutes or an hour, you’ll be more effective during the week if you’ve already set on the proper targets. Try this weekend research routine to identify new stocks and stay on top of your current targets. As the saying goes, time is money.
Step One: Clean Up Your Watch List
Use the MarketSmith Checklist feature to delete any stocks from your watch list that are no longer relevant. Stocks falling below a certain percentage of checklist requirements should be removed. Try using any of the guru checklists, your own screens, or the MarketSmith Growth or Value Checklist found in the Shared Screens section of the Community.
Checklists are located in the Related Information panel on the right side of our stock chart.

5
Step Two: Refresh Your Watch List with New Ideas
Use one or more screens or lists to re-populate your watch list with fresh ideas. Start with the Stock Ideas butt on to get quick access to the most popular reports and screens.
If you are short on ti me, run the Weekly Watch List Refresh screen on page 10.
*All screen results are computer-generated and were run on June 30, 2017.
• Growth 250• Breaking Out Today• Near Pivot• Up on Volume• William J. O’Neil
Stock Ideas butt on is on top right of stock chart.

6
Marketsmith.com // 2017 Q3 l Research Routines
Step Three: Add Another Layer Using Time-Sensitive Criteria
Make your watch list more comprehensive by adding stocks from recent events, such as earnings or price gaps.
Step Four: Identify the Best Opportunities
Sort your watch list by RS rating and use the play button to review your watch list. Choose 5 to 10 stocks closest to a recognizable buy point. Move these stocks to another watch list called “Ready to Go.”
Step Five: Identify Buy Points
Turn on Pattern Recognition and see if a pattern is forming. If a pattern is there, identify the pivot point and set an alert.
• Breakaway Gap• Earnings Gap Up• RS Line New High • Earnings Reported
Pattern Recognition button is on top right under the MarketSmith logo.
7
Once you’ve completed your weekend research, you’re ready to capitalize on the week’s opportunities. If you’re pressed for time, steps 1, 2, 3 will keep you on top of your stocks during the week. With more time, add steps 4 and 5.
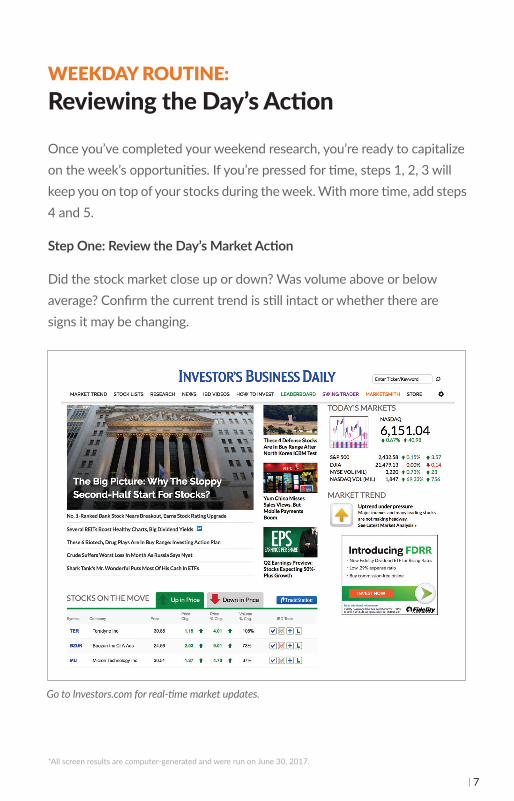
Step One: Review the Day’s Market Action
Did the stock market close up or down? Was volume above or below average? Confirm the current trend is still intact or whether there are signs it may be changing.
WEEKDAY ROUTINE: Reviewing the Day’s Action
*All screen results are computer-generated and were run on June 30, 2017.
Go to Investors.com for real-time market updates.
8
Marketsmith.com // 2017 Q3 l Research Routines
*All screen results are computer-generated and were run on June 30, 2017.
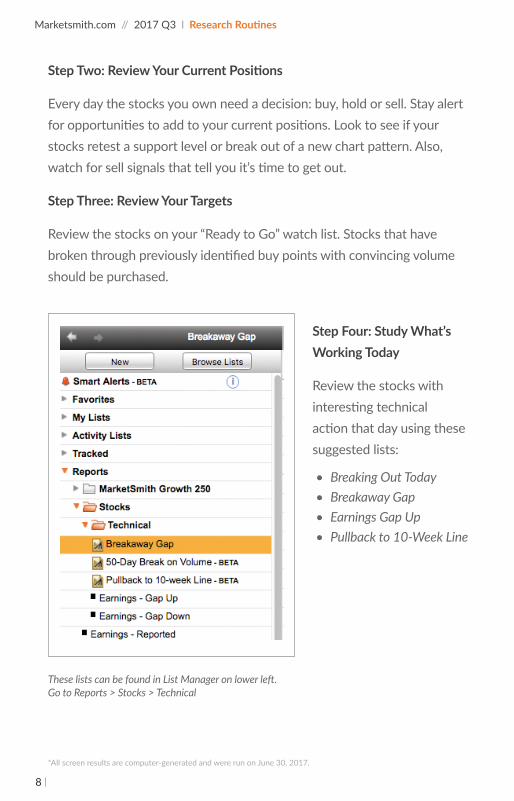
Step Two: Review Your Current Positions
Every day the stocks you own need a decision: buy, hold or sell. Stay alert for opportunities to add to your current positions. Look to see if your stocks retest a support level or break out of a new chart pattern. Also, watch for sell signals that tell you it’s time to get out.
Step Three: Review Your Targets
Review the stocks on your “Ready to Go” watch list. Stocks that have broken through previously identified buy points with convincing volume should be purchased.
Step Four: Study What’s Working Today
Review the stocks with interesting technical action that day using these suggested lists:
• Breaking Out Today• Breakaway Gap• Earnings Gap Up• Pullback to 10-Week Line
These lists can be found in List Manager on lower left. Go to Reports > Stocks > Technical

9
Step Five: Check for Rising Opportunities
Sort your watch list by Price % Change or Volume % Change to see if any stocks were moving that day or any buy points were reached. Move any stocks approaching buy point over to your “Ready to Go” list if necessary.
If you need more help, call a MarketSmith product coach at (800) 831-2525. We also invite you to check out our Resources section on page 26. MarketSmith gives members access to video tutorials, weekly webinars and many other educational features.
Click on any data column heading to sort.
10
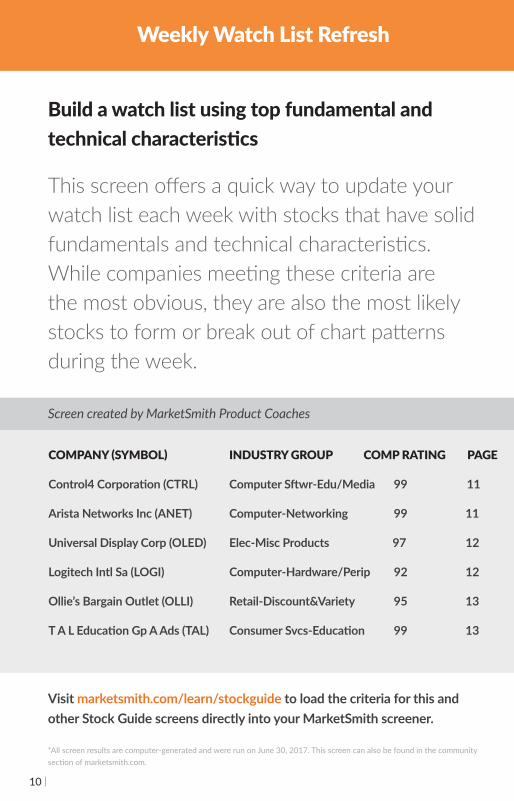
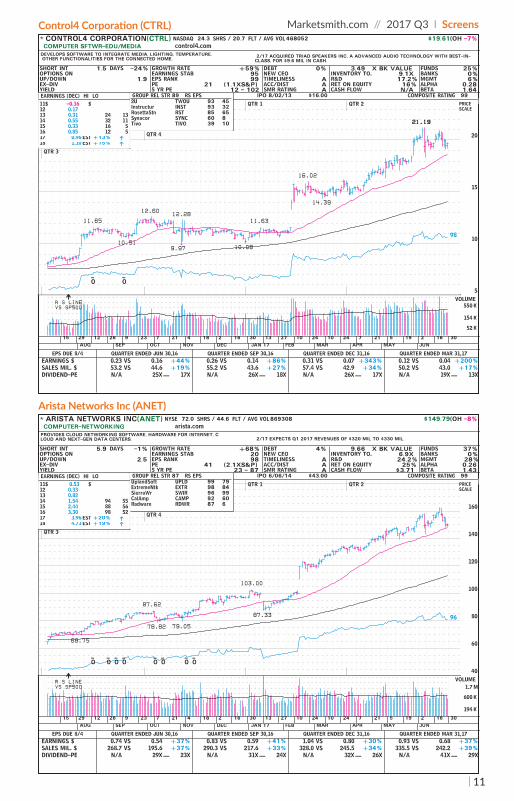
Build a watch list using top fundamental and technical characteristi cs
This screen off ers a quick way to update your watch list each week with stocks that have solid fundamentals and technical characteristi cs. While companies meeti ng these criteria are the most obvious, they are also the most likely stocks to form or break out of chart patt erns during the week.
Weekly Watch List Refresh
COMPANY (SYMBOL) INDUSTRY GROUP COMP RATING PAGE
Control4 Corporati on (CTRL) Computer Sft wr-Edu/Media 99 11
Arista Networks Inc (ANET) Computer-Networking 99 11
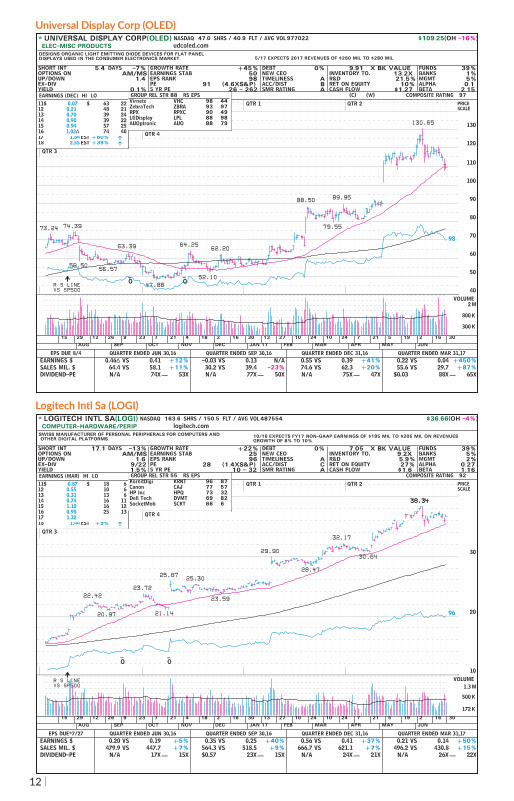
Universal Display Corp (OLED) Elec-Misc Products 97 12
Logitech Intl Sa (LOGI) Computer-Hardware/Perip 92 12
Ollie’s Bargain Outlet (OLLI) Retail-Discount&Variety 95 13
T A L Educati on Gp A Ads (TAL) Consumer Svcs-Educati on 99 13
Visit marketsmith.com/learn/stockguide to load the criteria for this and other Stock Guide screens directly into your MarketSmith screener.
*All screen results are computer-generated and were run on June 30, 2017. This screen can also be found in the community secti on of marketsmith.com.
Screen created by MarketSmith Product Coaches
11
Marketsmith.com // 2017 Q3 l ScreensControl4 Corporation (CTRL)
Arista Networks Inc (ANET)
* CONTROL4 CORPORATION(CTRL) NASDAQ 24.3 SHRS / 20.7 FLT / AVG VOL 468052 $19.61(OH -7%)COMPUTER SFTWR-EDU/MEDIA control4.com
DEVELOPS SOFTWARE TO INTEGRATE MEDIA, LIGHTING, TEMPERATURE, OTHER FUNCTIONALITIES FOR THE CONNECTED HOME. 2/17 ACQUIRED TRIAD SPEAKERS INC, A ADVANCED AUDIO TECHNOLOGY WITH BEST-IN-
CLASS, FOR $9.6 MIL IN CASH.
SHORT INT 1.5 DAYS -24%OPTIONS ONUP/DOWN 1.9EX-DIVYIELD
GROWTH RATE +59%EARNINGS STAB 95EPS RANK 99PE 21 (1.1XS&P)5 YR PE 12 - 102
DEBT 0%NEW CEOTIMELINESS AACC/DIST ASMR RATING A
3.49 X BK VALUEINVENTORY TO. 9.1XR&D 17.2%RET ON EQUITY 16%CASH FLOW N/A
FUNDS 25%BANKS 0%MGMT 6%ALPHA 0.28BETA 1.64
11.65
12.60 12.2811.63
16.02
21.1921.19
10.519.97 10.08
14.39
98
QTR 2QTR 1
QTR 4
QTR 3
-O
-O
5
10
15
20
PRICE SCALE
99COMPOSITE RATING$16.00IPO 8/02/13
11$ -0.16 $12 0.1713 0.31 24 1314 0.55 32 1115 0.33 16 516 0.85 12 517 0.96 EST +13% ↑18 1.10 EST +15% ↑
EARNINGS (DEC) HI LO2U TWOU 93 45Instructur INST 93 32RosettaStn RST 85 65Synacor SYNC 60 8Tivo TIVO 39 10
GROUP REL STR 89 RS EPS
301621952172410241027133016218421723926122915JUNMAYAPRMARFEBJAN 17DECNOVOCTSEPAUG
EARNINGS $SALES MIL. $DIVIDEND-PE
0.23 VS 0.16 +44%53.2 VS 44.6 +19%N/A 25X -- 17X
0.26 VS 0.14 +86%55.2 VS 43.6 +27%N/A 26X -- 18X
0.31 VS 0.07 +343%57.4 VS 42.9 +34%N/A 26X -- 17X
0.12 VS 0.04 +200%50.2 VS 43.0 +17%N/A 19X -- 13X
EPS DUE 8/4 QUARTER ENDED JUN 30,16 QUARTER ENDED SEP 30,16 QUARTER ENDED DEC 31,16 QUARTER ENDED MAR 31,17
R S LINE VS SP500
VOLUME
52 K
154 K
550 K
* ARISTA NETWORKS INC(ANET) NYSE 72.0 SHRS / 44.6 FLT / AVG VOL 869308 $149.79(OH -8%)COMPUTER-NETWORKING arista.com
PROVIDES CLOUD NETWORKING SOFTWARE, HARDWARE FOR INTERNET, CLOUD AND NEXT-GEN DATA CENTERS. 2/17 EXPECTS Q1 2017 REVENUES OF $320 MIL TO $330 MIL.
SHORT INT 5.9 DAYS -1%OPTIONS ONUP/DOWN 2.5EX-DIVYIELD
GROWTH RATE +68%EARNINGS STAB 20EPS RANK 98PE 41 (2.1XS&P)5 YR PE 23 - 87
DEBT 4%NEW CEOTIMELINESS AACC/DIST ASMR RATING A
9.66 X BK VALUEINVENTORY TO. 6.9XR&D 24.2%RET ON EQUITY 25%CASH FLOW $3.71
FUNDS 37%BANKS 0%MGMT 28%ALPHA 0.26BETA 1.43
87.62
103.00
68.75
78.82 79.05
87.33 96
QTR 2QTR 1
QTR 4
QTR 3
-O
-O
-O
-O
-O
-O
-O
-O
40
60
80
100
120
140
160
PRICE SCALE
99COMPOSITE RATING$43.00IPO 6/06/14
11$ 0.53 $12 0.3313 0.8214 1.54 94 5515 2.44 88 5616 3.30 98 5217 3.96 EST +20% ↑18 4.73 EST +19% ↑
EARNINGS (DEC) HI LOUplandSoft UPLD 99 79ExtremeNtk EXTR 98 84SierraWr SWIR 96 99CalAmp CAMP 92 60Radware RDWR 87 6
GROUP REL STR 87 RS EPS
301621952172410241027133016218421723926122915JUNMAYAPRMARFEBJAN 17DECNOVOCTSEPAUG
EARNINGS $SALES MIL. $DIVIDEND-PE
0.74 VS 0.54 +37%268.7 VS 195.6 +37%N/A 29X -- 23X
0.83 VS 0.59 +41%290.3 VS 217.6 +33%N/A 31X -- 24X
1.04 VS 0.80 +30%328.0 VS 245.5 +34%N/A 32X -- 26X
0.93 VS 0.68 +37%335.5 VS 242.2 +39%N/A 41X -- 29X
EPS DUE 8/4 QUARTER ENDED JUN 30,16 QUARTER ENDED SEP 30,16 QUARTER ENDED DEC 31,16 QUARTER ENDED MAR 31,17
R S LINE VS SP500
VOLUME
194 K
600 K
1.7 M
12
Universal Display Corp (OLED)
Logitech Intl Sa (LOGI)
* UNIVERSAL DISPLAY CORP(OLED) NASDAQ 47.0 SHRS / 40.9 FLT / AVG VOL 977022 $109.25(OH -16%)ELEC-MISC PRODUCTS udcoled.com
DESIGNS ORGANIC LIGHT EMITTING DIODE DEVICES FOR FLAT PANEL DISPLAYS USED IN THE CONSUMER ELECTRONICS MARKET. 5/17 EXPECTS 2017 REVENUES OF $260 MIL TO $280 MIL.
SHORT INT 5.4 DAYS -7%OPTIONS ON AM/MSUP/DOWN 1.4EX-DIVYIELD 0.1%
GROWTH RATE +45%EARNINGS STAB 50EPS RANK 98PE 91 (4.6XS&P)5 YR PE 26 - 262
DEBT 0%NEW CEOTIMELINESS AACC/DIST BSMR RATING A
9.91 X BK VALUEINVENTORY TO. 13.2XR&D 21.5%RET ON EQUITY 10%CASH FLOW $1.27
FUNDS 39%BANKS 1%MGMT 5%ALPHA 0.1BETA 2.15
73.24 74.39
63.39 64.2562.20
88.50 89.95
130.65
58.50 56.57
47.8852.10
79.55
98
QTR 2QTR 1
QTR 4
QTR 3
-O
-O
40
50
60
70
80
90
100
110
120
130
PRICE SCALE
97COMPOSITE RATING(W)(C)
11$ 0.07 $ 63 2212 0.21 48 2113 0.70 39 2414 0.90 39 2215 0.94 57 2516 1.02∆ 74 4017 1.84 EST +80% ↑18 2.55 EST +39% ↑
EARNINGS (DEC) HI LOVirnetx VHC 98 44ZebraTech ZBRA 93 97RPX RPXC 90 49LGDisplay LPL 88 98AUOptronic AUO 88 79
GROUP REL STR 88 RS EPS
301621952172410241027133016218421723926122915JUNMAYAPRMARFEBJAN 17DECNOVOCTSEPAUG
EARNINGS $SALES MIL. $DIVIDEND-PE
0.46∆ VS 0.41 +12%64.4 VS 58.1 +11%N/A 74X -- 53X
-0.03 VS 0.13 N/A30.2 VS 39.4 -23%N/A 77X -- 50X
0.55 VS 0.39 +41%74.6 VS 62.3 +20%N/A 75X -- 47X
0.22 VS 0.04 +450%55.6 VS 29.7 +87%
$0.03 88X -- 65X
EPS DUE 8/4 QUARTER ENDED JUN 30,16 QUARTER ENDED SEP 30,16 QUARTER ENDED DEC 31,16 QUARTER ENDED MAR 31,17
R S LINE VS SP500
VOLUME
300 K
800 K
2 M
* LOGITECH INTL SA(LOGI) NASDAQ 163.6 SHRS / 150.5 FLT / AVG VOL 487554 $36.66(OH -4%)COMPUTER-HARDWARE/PERIP logitech.com
SWISS MANUFACTURER OF PERSONAL PERIPHERALS FOR COMPUTERS AND OTHER DIGITAL PLATFORMS. 10/16 EXPECTS FY17 NON-GAAP EARNINGS OF $195 MIL TO $205 MIL ON REVENUES
GROWTH OF 8% TO 10%.
SHORT INT 17.1 DAYS -13%OPTIONS ON AM/MSUP/DOWN 1.6EX-DIV 9/22YIELD 1.5%
GROWTH RATE +22%EARNINGS STAB 25EPS RANK 96PE 28 (1.4XS&P)5 YR PE 10 - 32
DEBT 0%NEW CEOTIMELINESS AACC/DIST CSMR RATING A
7.05 X BK VALUEINVENTORY TO. 9.2XR&D 5.9%RET ON EQUITY 27%CASH FLOW $1.6
FUNDS 39%BANKS 5%MGMT 2%ALPHA 0.27BETA 1.16
22.4223.72
25.87 25.30
29.90
32.17
38.3438.34
20.97 21.14
23.59
28.47
30.64
96
QTR 2QTR 1
QTR 4
QTR 3
-O
-O
10
20
30
PRICE SCALE
92COMPOSITE RATING
11$ 0.87 $ 18 612 0.55 10 613 0.31 13 614 0.74 16 1115 1.10 16 1216 0.98 25 1317 1.3218 1.44 EST +9% ↑
EARNINGS (MAR) HI LOKornitDigi KRNT 96 87Canon CAJ 77 57HP Inc HPQ 73 32Dell Tech DVMT 69 82SocketMob SCKT 66 6
GROUP REL STR 55 RS EPS
301621952172410241027133016218421723926122915JUNMAYAPRMARFEBJAN 17DECNOVOCTSEPAUG
EARNINGS $SALES MIL. $DIVIDEND-PE
0.20 VS 0.19 +5%479.9 VS 447.7 +7%N/A 17X -- 15X
0.35 VS 0.25 +40%564.3 VS 518.5 +9%$0.57 23X -- 15X
0.56 VS 0.41 +37%666.7 VS 621.1 +7%N/A 24X -- 21X
0.21 VS 0.14 +50%496.2 VS 430.8 +15%N/A 26X -- 22X
EPS DUE*7/27 QUARTER ENDED JUN 30,16 QUARTER ENDED SEP 30,16 QUARTER ENDED DEC 31,16 QUARTER ENDED MAR 31,17
R S LINE VS SP500
VOLUME
172 K
500 K
1.3 M

13
Marketsmith.com // 2017 Q3 l ScreensOllie’s Bargain Outlet (OLLI)
T A L Education Gp A Ads (TAL)
* OLLIE'S BARGAIN OUTLET(OLLI) NASDAQ 61.1 SHRS / 47.1 FLT / AVG VOL 744526 $42.60(OH -3%)RETAIL-DISCOUNT&VARIETY ollies.us
OPERATES 234 OLLIE'S BARGAIN RETAIL OUTLETS IN 19 STATES.OFFERS A BROAD SELECTION OF BRAND NAME 3/17 EXPECTS FY18 CAPITAL EXPENDITURES OF $18 MIL TO $20 MIL.
SHORT INT 11.5 DAYS -13%OPTIONS ONUP/DOWN 1.0EX-DIVYIELD
GROWTH RATE +43%EARNINGS STAB 19EPS RANK 96PE 42 (2.1XS&P)5 YR PE 28 - 46
DEBT 29%NEW CEOTIMELINESS CACC/DIST BSMR RATING A
3.95 X BK VALUEINVENTORY TO. 4.4XR&D N/ARET ON EQUITY 10%CASH FLOW $1.19
FUNDS 62%BANKS 0%MGMT 22%ALPHA 0.15BETA 1.38
28.60
32.7533.45
44.0844.08
24.12
25.65
27.75
30.5595
QTR 2QTR 1
QTR 4
QTR 3
-O
-O
-O
-O
PSO
SO
-O
-O
20
25
30
35
40
45
PRICE SCALE
95COMPOSITE RATING$16.00IPO 7/16/15
11$ 0.33 $12 0.2913 0.3314 0.3315 0.47 22 1416 0.68 32 1617 0.9718 1.17 EST +21% ↑
EARNINGS (JAN) HI LOFive Below FIVE 78 96BigLots BIG 28 80DollarGn n DG 26 76DollarTree DLTR 13 81
GROUP REL STR 40 RS EPS
301621952172410241027133016218421723926122915JUNMAYAPRMARFEBJAN 17DECNOVOCTSEPAUG
EARNINGS $SALES MIL. $DIVIDEND-PE
0.21 VS 0.14 +50%211.3 VS 181.9 +16%N/A 39X -- 29X
0.17 VS 0.11 +55%202.0 VS 174.6 +16%N/A 37X -- 29X
0.39 VS 0.32 +22%283.4 VS 243.4 +16%N/A 39X -- 31X
0.25 VS 0.20 +25%227.6 VS 193.7 +17%N/A 40X -- 33X
EPS DUE 8/31 QUARTER ENDED JUL 31,16 QUARTER ENDED OCT 31,16 QUARTER ENDED JAN 31,17 QUARTER ENDED APR 30,17
R S LINE VS SP500 VOLUME
250 K
750 K
2.3 M
* T A L EDUCATION GP A ADS(TAL) NYSE 80.9 SHRS / 44.5 FLT / AVG VOL 772722 $122.31(OH -8%)CONSUMER SVCS-EDUCATION eduu.com
PROVIDES K-12 AFTER-SCHOOL TUTORING TO 3.9 MIL STUDENTS VIA 507 LEARNING CENTERS IN 30 CITIES. 5/17 OFFERED 2.50% OF CONVERTIBLE SENIOR NOTES DUE 2019.
SHORT INT 4.3 DAYS -40%OPTIONS ON PHUP/DOWN 1.0EX-DIVYIELD
GROWTH RATE +44%EARNINGS STAB 25EPS RANK 98PE 72 (3.7XS&P)5 YR PE 16 - 61
DEBT 0%NEW CEOTIMELINESS AACC/DIST BSMR RATING A
22.94 X BK VALUEINVENTORY TO. 1083.3XR&D N/ARET ON EQUITY 28%CASH FLOW $0.93
FUNDS 37%BANKS 2%MGMT 44%ALPHA 0.22BETA 0.9
66.38
83.68
132.29 134.00134.00
57.63 59.20
70.0066.11
111.82
97
QTR 2QTR 1
QTR 4
QTR 3
50
60
70
80
90
100
110
120
130
PRICE SCALE
99COMPOSITE RATING$10.00IPO 10/20/10
11$ 0.33 $ 15 712 0.41 11 613 0.27 22 814 0.86 37 1915 1.03∆ 48 2616 1.49∆ 83 4117 1.68∆18 2.09 EST +24% ↑
EARNINGS (FEB) HI LOBrdgpntEd BPI 98 50Chegg CHGG 98 42GrandCanyn LOPE 96 96OrientlEdT EDU 95 90StrayerEd STRA 95 27
GROUP REL STR 84 RS EPS
301621952172410241027133016218421723926122915JUNMAYAPRMARFEBJAN 17DECNOVOCTSEPAUG
EARNINGS $SALES MIL. $DIVIDEND-PE
0.25 VS 0.28 -11%195.1 VS 129.4 +51%N/A 41X -- 32X
0.70∆ VS 0.78∆ -10%271.1 VS 173.3 +56%N/A 46X -- 35X
0.26∆ VS 0.19 +37%260.6 VS 142.2 +83%N/A 61X -- 41X
0.47∆ VS 0.23 +104%316.3 VS 175.1 +81%N/A 61X -- 48X
EPS DUE*7/26 QUARTER ENDED MAY 31,16 QUARTER ENDED AUG 31,16 QUARTER ENDED NOV 30,16 QUARTER ENDED FEB 28,17
R S LINE VS SP500 VOLUME
186 K
450 K
950 K

14
Marketsmith.com // 2017 Q3 l Customer Success Story
An active investor, Mike Scott leads the IBD Meetup in Thousand Oaks, California. He’s an IBD subscriber and was an early adopter of Daily Graphs, the predecessor to MarketSmith. He began using the MarketSmith platform when it launched in September 2010.
With years of investing under his belt, Mike has found that stocks with very strong earnings tend to make the largest gains, so he developed a MarketSmith screen that looks for annual earnings greater than 50% and quarterly earnings greater than 100%. Mike also takes into account a composite rating of 80 or higher, sales growth and liquidity.
Mike acknowledges this is a tight screen, so it doesn’t produce a large number of stocks. But using these parameters, he’s discovered that many of the qualifying stocks will double within a year. Every time earnings season comes around, Mike runs this screen to focus on the top stocks. (A description of Mike’s earnings screen is included plus the screen has been posted on MarketSmith in Shared Screens)
One particular stock that showed up on this screen was Acacia Communications (ACIA). Prior to Acacia’s IPO on 5/13/2016 the company had reported 7 out of 9 prior quarters of triple digit EPS gains! Pull up ACIA on a MarketSmith weekly chart and you’ll see these impressive EPS gains beginning in March, 2014: +999%, +999%, +999%, +700%, +27%, +55% +136% +313% +214%.
In June 2016, Mike established a position in ACIA which didn’t last long when ACIA fell well below the buy point. Early in his trading career, Mike wouldn’t go back to a stock if he got shaken out. But experience has taught
This Investor Kept Emotions in Check for a 100% Gain on the Buyback
Customer Success Story: MIKE SCOTT

15
him if he had a reason to buy a stock initi ally, then it was worth watching for another entry point.
As a result, Mike stayed tuned into ACIA’s movement, buying the stock back in July 2016. He held the stock through its major run exiti ng the positi on in October 2016. Mike’s gain in ACIA was more than 100% from the point he bought the stock a second ti me aft er his initi al shake-out.
“Not all trades work. If half of your trades work, you will steadily make money. When a trade fails, don’t take the stock off of your watch list. You need the courage to go back in.” – Mike Scott
*All screen results are computer-generated and were run on June 30, 2017.
Buying Acacia (ACAI)

16
Looks for stocks with the best year over year EPS plus strong sales growth
A study conducted in the 1990’s identi fi ed large annual EPS growth coupled with large quarterly EPS growth reliably identi fi ed stocks with the shortest ti me to a price double. This screen uses EPS and sales growth to fi nd stocks with potenti al to double in 12 months.
High Growth Stocks
COMPANY (SYMBOL) INDUSTRY GROUP COMP RATING PAGE
Supernus Pharmaceuti cals (SUPN) Medical-Biomed/Biotech 99 17
Weibo Corp Cl A Ads (WB) Internet-Content 98 17
Visit marketsmith.com/learn/stockguide to load the criteria for this and other Stock Guide screens directly into your MarketSmith screener.
*All screen results are computer-generated and were run on June 30, 2017. This screen can also be found in the community secti on of marketsmith.com.
Screen created by Mike Scott , MarketSmith member since 2010

17
Marketsmith.com // 2017 Q3 l ScreensSupernus Pharmaceuticals (SUPN)
Weibo Corp Cl A Ads (WB)
SUPERNUS PHARMACEUTICALS(SUPN) NASDAQ 50.2 SHRS / 46.7 FLT / AVG VOL642196 $43.10(OH -4%)MEDICAL-BIOMED/BIOTECH supernus.comDEVELOPS SPECIALTY PHARMACEUTICALS FOR THE TREATMENT OF EPILEPSY AND ATTENTION DEFICIT HYPERACTIVITY DISORDER.
12/16 Q4 2016 INCLUDES $289,000 CHARGE FOR EXTINGUISHMENT OF DEBT.
SHORT INT 5.9 DAYS +19%OPTIONS ONUP/DOWN 1.5EX-DIVYIELD
GROWTH RATEEARNINGS STABEPS RANK 79PE 42 (2.1XS&P)5 YR PE 5 - 233
DEBT 2%NEW CEOTIMELINESS AACC/DIST ASMR RATING A
11.42 X BK VALUEINVENTORY TO. 14.6XR&D 19.9%RET ON EQUITY 36%CASH FLOW $1.07
FUNDS 47%BANKS 0%MGMT 7%ALPHA 0.2BETA 2.16
24.00
26.84
24.75
27.50 27.95
30.37
20.80
17.25
23.10
29.95
98
QTR 2QTR 1
QTR 4
QTR 3
-O10
20
30
40
PRICE SCALE
99COMPOSITE RATING(W)(C)$5.00IPO 5/01/1211$ -16.60 $12 -2.00 16 413 -2.47 9 414 -0.24 11 715 0.28∆ 23 716 0.97∆ 27 917 1.08EST +11% ↑18 1.67EST +55% ↑
EARNINGS (DEC) HI LOEvotec EVTCY 99 79PortolaPha PTLA 99 39ClovisOncl CLVS 99 37ExactSci EXAS 99 37AveoPhrm AVEO 99 34
GROUP REL STR 94 RS EPS
301621952172410241027133016218421723926122915JUNMAYAPRMARFEBJAN 17DECNOVOCTSEPAUG
EARNINGS $SALES MIL. $DIVIDEND-PE
0.18 VS 0.04 +350%51.6 VS 35.7 +45%N/A 64X-- 42X
0.40 VS 0.08 +400%56.8 VS 39.4 +44%N/A 67X-- 43X
0.26∆ VS 0.14 +86%62.4 VS 43.7 +43%N/A 56X-- 36X
0.19 VS 0.08∆ +138%57.6 VS 44.2 +30%N/A 57X-- 27X
EPS DUE 8/2 QUARTER ENDED JUN 30,16 QUARTER ENDED SEP 30,16 QUARTER ENDED DEC 31,16 QUARTER ENDED MAR 31,17
R S LINE VS SP500 VOLUME
300K
700K
1.6M
WEIBO CORP CL A ADS(WB ) NASDAQ 99.7 SHRS / 14.0 FLT / AVG VOL2.87MIL $66.47(OH -19%)INTERNET-CONTENT weibo.comPROVIDER OF SOCIAL NETWORKING PLATFORM FOR PEOPLE TO CREATE, DISTRIBUTE AND DISCOVER CHINESE-LANGUAGE CONTENT
5/17 EXPECTS Q2 2017 REVENUES OF $240 MIL TO $250 MIL.
SHORT INT 3.8 DAYS -48%OPTIONS ONUP/DOWN 1.1EX-DIVYIELD
GROWTH RATEEARNINGS STABEPS RANK 79PE 66 (3.4XS&P)5 YR PE 47 - 1035
DEBT 0%NEW CEOTIMELINESS AACC/DIST DSMR RATING A
19.80 X BK VALUEINVENTORY TO.R&D 23.5%RET ON EQUITY 27%CASH FLOW $0.91
FUNDS 11%BANKS 0%MGMT 6%ALPHA 0.28BETA 1.84
52.29
55.9352.49
58.79
53.72
82.28
41.26 40.12
47.36
97
QTR 2QTR 1
QTR 4
QTR 3
20
30
40
50
60
70
80
PRICE SCALE
98COMPOSITE RATING$17.00IPO 4/17/1411$ -0.58 $12 -0.5113 -0.1514 -0.01 26 1315 0.32 20 816 0.82 55 1217 1.51EST +84% ↓18 2.32EST +54% ↑
EARNINGS (DEC) HI LOMomo A MOMO 99 84Autohome A ATHM 98 95Truecar TRUE 98 58AngiesList ANGI 98 40IACInterct IAC 97 49
GROUP REL STR 98 RS EPS
301621952172410241027133016218421723926122915JUNMAYAPRMARFEBJAN 17DECNOVOCTSEPAUG
EARNINGS $SALES MIL. $DIVIDEND-PE
0.16 VS 0.05 +220%146.9 VS 107.8 +36%N/A 80X-- 57X
0.24 VS 0.10 +140%176.9 VS 124.7 +42%N/A 109X-- 75X
0.34 VS 0.15 +127%212.8 VS 149.0 +43%N/A 117X-- 65X
0.26 VS 0.07 +271%199.2 VS 119.3 +67%N/A 95X-- 58X
EPS DUE 8/8 QUARTER ENDED JUN 30,16 QUARTER ENDED SEP 30,16 QUARTER ENDED DEC 31,16 QUARTER ENDED MAR 31,17
R S LINE VS SP500
VOLUME
600K
1.6M
5M

18
Marketsmith.com // 2017 Q3 l MarketSmith Coaches Corner
With over 13 years of investing experience, Irusha Peiris became a MarketSmith product coach in 2009. He is a national speaker, presenting at the IBD Trading Summits and IBD meetup groups. Irusha is a graduate of Tufts University, has an M.S. in Investment Management from Boston University, and an M.B.A. from the University of Southern California.
IBD Market Commentator Amy Smith talked with Irusha about investing and how he finds winning stocks.
AS: How did you get interested in investing?
IP: Coming out of college, I wanted to invest, but I didn’t know much about stocks except for what a few friend’s had told me. It was the 1997 bull market and making money in the market seemed much easier in the late 90’s.
Early on, I got recommendations from brokers. These were big blue chip names like Wal-Mart, GE, and Oracle. What woke me up was the 2000 crash. All of a sudden the buy and hold approach wasn’t working at all.
AS: How did you learn about IBD and MS?
IP: I saw a TV commercial on CNBC and took a free trial to IBD. But I didn’t read a single newspaper. I shoved them in a closet where they began to stack up. As a free gift, IBD also sent William O’Neil’s book, 24 Essential Lessons for Investment Success.
MarketSmith Coaches Corner: IRUSHA PEIRIS

19
I didn’t read the book then, but after the 2000 crash I found it in my closet and read it in one sitting. Bill O’Neil talked about the market in a way I hadn’t heard before. It was then that I became a die-hard IBD subscriber, following Bill’s methods and teaching.
AS: Talk about one of your biggest winners using MarketSmith.
IP: FB, Breakaway Gap, 2013 on earnings!
I bought Facebook on a breakaway gap in 2013 on a strong earnings report. The move was so powertful that Facebook shot up 29% after reporting. I had seen many breakaway gaps prior to this so I knew this was a major move for Facebook and that it had the potential to be a big leader in the stock market.
I had been watching Facebook since its IPO debut but never committed to buying it because of a lack of earnings. MarketSmith developed the Breakaway Gap screen because market leaders often gap up dramatically after reporting stellar earnings.
AS: What are your favorite MS screens? What do you use the most?
IP: The Breakaway Gap and the Earnings Gap reports are two screens that I look at the most. On the weekends, I go through the Growth 250 to develop a feel for the overall market. For instance, at the beginning of this year there were several stocks setting up in bases, so I knew there was a chance for a successful uptrend. It was a matter of waiting for a follow-through-day and successful breakouts.
AS: In a strong maket such as this is one, what’s the hardest aspect to manage?
IP: It’s tempting to buy everything. Patience and building a good watch list are important. I look for big volume on the breakout, relative strength at new highs and strong earnings and sales. I then narrow the list down to companies that are really changing the way we live.
______________________________________________________________________________

20
Find stocks outperforming the market
To fi nd strong stocks that are more likely to grow exponenti ally with less risk, Product Coach Irusha Peiris looks at the relati ve strength of a stock. This screen uses Relati ve Strength New High coupled with 3, 6, and 12-month RS Rati ngs to fi nd stocks that conti nue to outperform the current market.
COMPANY (SYMBOL) INDUSTRY GROUP COMP RATING PAGE
Petmed Express Inc (PETS) Retail-Internet 99 21
Lantheus Holdings Inc (LNTH) Medical-Products 99 21
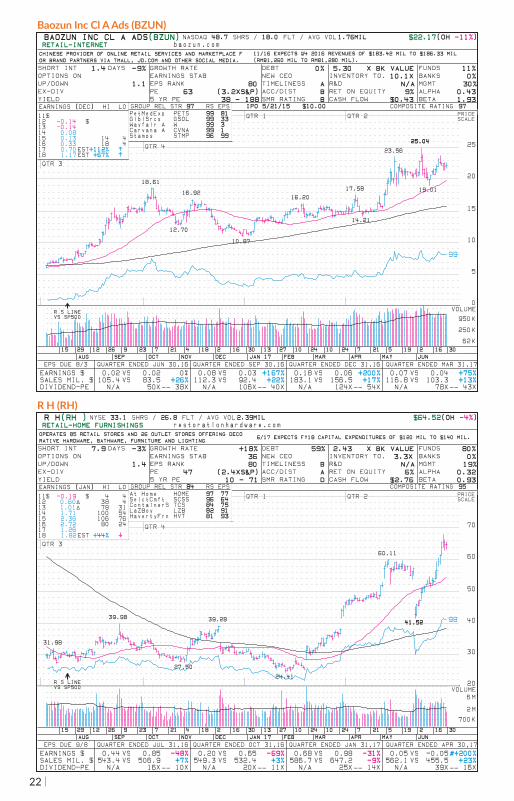
Baozun Inc Cl A Ads (BZUN) Retail-Internet 99 22
R H (RH) Retail-Home Furnishings 98 22
Nvidia Corp (NVDA) Elec-Semicondctor Fablss 98 23
Autohome Inc Cl A Ads (ATHM) Internet-Content 98 23
Visit marketsmith.com/learn/stockguide to load the criteria for this and other Stock Guide screens directly into your MarketSmith screener.
*All screen results are computer-generated and were run on June 30, 2017. This screen can also be found in the community secti on of marketsmith.com.
Relati ve Strength Super Screen
Screen created by Irusha Peiris, MarketSmith Product Coach

21
Marketsmith.com // 2017 Q3 l ScreensPetmed Express Inc (PETS)
Lantheus Holdings Inc (LNTH)
PETMED EXPRESS INC(PETS) NASDAQ 20.5 SHRS / 19.7 FLT / AVG VOL572326 $40.60(OH -2%)RETAIL-INTERNET 1800petmeds.comOFFERS PRESCRIPTION/NON-PRESCRIPTION MEDICATIONS AND OTHER HEALTH PRODUCTS FOR DOGS/CATS VIA 1-800-PETSMEDS BRAND NAME.
11/10 TO REPURCHASE AN ADDITIONAL $20 MIL WORTH OF COMMON STOCK OUTSTANDING.
SHORT INT 6 DAYS -21%OPTIONS ON AM/NYUP/DOWN 2.0EX-DIV 5/17YIELD 2.0%
GROWTH RATE +7%EARNINGS STAB 3EPS RANK 81PE 35 (1.7XS&P)5 YR PE 12 - 22
DEBT 0%NEW CEOTIMELINESS BACC/DIST ASMR RATING A
8.91 X BK VALUEINVENTORY TO. 10.9XR&D N/ARET ON EQUITY 27%CASH FLOW $1.23
FUNDS 31%BANKS 1%MGMT 4%ALPHA 0.27BETA 0.75
21.16 21.09
23.78
21.56
19.54 18.90
20.6219.21
99
QTR 2QTR 1
QTR 4
QTR 3
-O-O-O-O10
20
30
40
PRICE SCALE
97COMPOSITE RATING11$ 0.92 $ 18 812 0.80 14 913 0.86 17 1014 0.90 16 1215 0.92 18 1316 1.02 23 1517 1.1718 1.29EST +10% ↑
EARNINGS (MAR) HI LOBaozun A BZUN 99 80GlblSrcs GSOL 99 33Wayfair A W 99 3Carvana A CVNA 99 1Stamps STMP 96 99
GROUP REL STR 97 RS EPS
301621952172410241027133016218421723926122915JUNMAYAPRMARFEBJAN 17DECNOVOCTSEPAUG
EARNINGS $SALES MIL. $DIVIDEND-PE
0.32 VS 0.29 +10%72.5 VS 71.6 +1%$0.19 20X-- 17X
0.24 VS 0.22 +9%60.8 VS 56.7 +7%$0.19 20X-- 18X
0.24 VS 0.24 0%52.9 VS 50.9 +4%$0.19 22X-- 18X
0.37 VS 0.27 +37%63.0 VS 55.4 +14%$0.19 22X-- 18X
EPS DUE*7/25 QUARTER ENDED JUN 30,16 QUARTER ENDED SEP 30,16 QUARTER ENDED DEC 31,16 QUARTER ENDED MAR 31,17
R S LINE VS SP500 VOLUME
80K
300K
1M
LANTHEUS HOLDINGS INC(LNTH) NASDAQ 37.3 SHRS / 20.9 FLT / AVG VOL863804 $17.65(OH -1%)MEDICAL-PRODUCTS lantheus.comDEVELOPS DIAGNOSTIC MEDICAL IMAGING AGENTS AND PRODUCTS FOR THE DIAGNOSIS OF CARDIOVASCULAR AND OTHER DISEASES.
5/17 EXPECTS Q2 2017 ADJUSTED EBITDA OF $18 MIL TO $20 MIL.
SHORT INT 2.3 DAYS+142%OPTIONS ONUP/DOWN 1.4EX-DIVYIELD
GROWTH RATEEARNINGS STABEPS RANK 82PE 21 (1.0XS&P)5 YR PE 4 - 96
DEBTNEW CEO 8/15TIMELINESS AACC/DIST ASMR RATING
-6.12 X BK VALUEINVENTORY TO. 18.2XR&D 4.0%RET ON EQUITY N/ACASH FLOW $1.18
FUNDS 21%BANKS 0%MGMT 2%ALPHA 0.5BETA 3.65
5.17
10.10 10.3010.85
9.45
14.25
17.45
3.46
7.61 7.95
11.05 10.65
14.60
99
QTR 2QTR 1
QTR 4
QTR 3
SO
PSO
SO
PSO
PO
PPO
PO
PPO
0
5
10
15
20
PRICE SCALE
91COMPOSITE RATING$6.00IPO 6/25/1511$ -4.56 $12 -1.3913 -2.04∆14 -0.07∆15 0.46∆ 8 216 0.72∆ 10 117 0.93EST +29% ↑18 1.06EST +14% ↑
EARNINGS (DEC) HI LOOrasureTec OSUR 99 78Novocure NVCR 99 45IntersectE XENT 99 34Nuvectra NVTR 99 1MiMdx Grp MDXG 98 69
GROUP REL STR 94 RS EPS
301621952172410241027133016218421723926122915JUNMAYAPRMARFEBJAN 17DECNOVOCTSEPAUG
EARNINGS $SALES MIL. $DIVIDEND-PE
0.24∆ VS 0.03∆ +700%78.0 VS 73.3 +6%N/A 9X-- 4X
0.15∆ VS 0.18∆ -17%73.1 VS 74.1 -1%N/A 14X-- 5X
0.18∆ VS 0.13∆ +38%74.4 VS 71.2 +4%N/A 16X-- 11X
0.28∆ VS 0.15∆ +87%81.4 VS 76.5 +6%N/A 20X-- 12X
EPS DUE 8/4 QUARTER ENDED JUN 30,16 QUARTER ENDED SEP 30,16 QUARTER ENDED DEC 31,16 QUARTER ENDED MAR 31,17
R S LINE VS SP500
VOLUME
76K
250K
850K
22
Baozun Inc Cl A Ads (BZUN)
R H (RH)
BAOZUN INC CL A ADS(BZUN) NASDAQ 48.7 SHRS / 18.0 FLT / AVG VOL1.76MIL $22.17(OH -11%)RETAIL-INTERNET baozun.comCHINESE PROVIDER OF ONLINE RETAIL SERVICES AND MARKETPLACE FOR BRAND PARTNERS VIA TMALL, JD.COM AND OTHER SOCIAL MEDIA.
11/16 EXPECTS Q4 2016 REVENUES OF $183.42 MIL TO $186.33 MIL (RMB1,260 MIL TO RMB1,280 MIL).
SHORT INT 1.4 DAYS -9%OPTIONS ONUP/DOWN 1.1EX-DIVYIELD
GROWTH RATEEARNINGS STABEPS RANK 80PE 63 (3.2XS&P)5 YR PE 38 - 188
DEBT 0%NEW CEOTIMELINESS AACC/DIST BSMR RATING B
5.30 X BK VALUEINVENTORY TO. 10.1XR&D N/ARET ON EQUITY 9%CASH FLOW $0.43
FUNDS 11%BANKS 0%MGMT 30%ALPHA 0.43BETA 1.93
18.61
16.9216.20
17.58
23.56
25.0425.04
12.70
10.87
14.21
19.01
99
QTR 2QTR 1
QTR 4
QTR 3
0
5
10
15
20
25
PRICE SCALE
97COMPOSITE RATING$10.00IPO 5/21/1511$12 -0.14 $13 -0.1414 0.0815 0.13 14 416 0.33 18 417 0.70EST+112% ↑18 1.17EST +67% ↑
EARNINGS (DEC) HI LOPetMedExp PETS 99 81GlblSrcs GSOL 99 33Wayfair A W 99 3Carvana A CVNA 99 1Stamps STMP 96 99
GROUP REL STR 97 RS EPS
301621952172410241027133016218421723926122915JUNMAYAPRMARFEBJAN 17DECNOVOCTSEPAUG
EARNINGS $SALES MIL. $DIVIDEND-PE
0.02 VS 0.02 0%105.4 VS 83.5 +26%N/A 50X-- 38X
0.08 VS 0.03 +167%112.3 VS 92.4 +22%N/A 106X-- 40X
0.18 VS 0.06 +200%183.1 VS 156.5 +17%N/A 124X-- 54X
0.07 VS 0.04 +75%116.8 VS 103.3 +13%N/A 78X-- 43X
EPS DUE 8/3 QUARTER ENDED JUN 30,16 QUARTER ENDED SEP 30,16 QUARTER ENDED DEC 31,16 QUARTER ENDED MAR 31,17
R S LINE VS SP500
VOLUME
62K
250K
950K
R H(RH ) NYSE 33.1 SHRS / 26.8 FLT / AVG VOL2.39MIL $64.52(OH -4%)RETAIL-HOME FURNISHINGS restorationhardware.comOPERATES 85 RETAIL STORES AND 26 OUTLET STORES OFFERING DECORATIVE HARDWARE, BATHWARE, FURNITURE AND LIGHTING
6/17 EXPECTS FY18 CAPITAL EXPENDITURES OF $120 MIL TO $140 MIL.
SHORT INT 7.9 DAYS -3%OPTIONS ONUP/DOWN 1.4EX-DIVYIELD
GROWTH RATE +18%EARNINGS STAB 36EPS RANK 80PE 47 (2.4XS&P)5 YR PE 10 - 71
DEBT 59%NEW CEOTIMELINESS BACC/DIST ASMR RATING D
2.43 X BK VALUEINVENTORY TO. 3.3XR&D N/ARET ON EQUITY 6%CASH FLOW $2.76
FUNDS 80%BANKS 0%MGMT 19%ALPHA 0.32BETA 0.93
31.98
39.98 39.28
60.11
27.50
24.41
41.5241.52 98
QTR 2QTR 1
QTR 4
QTR 3
20
30
40
50
60
70
PRICE SCALE
95COMPOSITE RATING11$ -0.19 $ 4 412 0.60∆ 38 413 1.01∆ 78 3114 1.71 100 5415 2.36 106 7616 2.72 80 2417 1.2618 1.82EST +44% ↓
EARNINGS (JAN) HI LOAt Home HOME 97 77SelctCmft SCSS 96 64ContainerS TCS 84 75LaZBoy LZB 82 91HavertyFrn HVT 81 93
GROUP REL STR 84 RS EPS
301621952172410241027133016218421723926122915JUNMAYAPRMARFEBJAN 17DECNOVOCTSEPAUG
EARNINGS $SALES MIL. $DIVIDEND-PE
0.44 VS 0.85 -48%543.4 VS 506.9 +7%N/A 16X-- 10X
0.20 VS 0.65 -69%549.3 VS 532.4 +3%N/A 20X-- 11X
0.68 VS 0.98 -31%586.7 VS 647.2 -9%N/A 25X-- 14X
0.05 VS -0.05#+200%562.1 VS 455.5 +23%N/A 39X-- 16X
EPS DUE 9/8 QUARTER ENDED JUL 31,16 QUARTER ENDED OCT 31,16 QUARTER ENDED JAN 31,17 QUARTER ENDED APR 30,17
R S LINE VS SP500 VOLUME
700K
2M
6M

23
Marketsmith.com // 2017 Q3 l ScreensNvidia Corp (NVDA)
Autohome Inc Cl A Ads (ATHM)
NVIDIA CORP(NVDA) NASDAQ 595.0 SHRS / 559.3 FLT / AVG VOL22.38MIL $144.56(OH -14%)ELEC-SEMICONDCTOR FABLSS nvidia.comDESIGNS GRAPHIC PROCESSING UNITS USED IN PERSONAL COMPUTERS, WORKSTATIONS, GAME CONSOLES AND MOBILE DEVICES.
2/17 EXPECTS Q1 FY18 REVENUES OF ABOUT $1.90 BIL PLUS OR MINUS TWO PERCENT.
SHORT INT 1.5 DAYS -20%OPTIONS ON AM/MSUP/DOWN 1.5EX-DIV 5/19YIELD 0.4%
GROWTH RATE +20%EARNINGS STAB 26EPS RANK 97PE 48 (2.3XS&P)5 YR PE 10 - 62
DEBT 35%NEW CEOTIMELINESS AACC/DIST BSMR RATING A
14.38 X BK VALUEINVENTORY TO. 11.4XR&D 21.2%RET ON EQUITY 33%CASH FLOW $3.21
FUNDS 40%BANKS 1%MGMT 5%ALPHA 0.39BETA 1.65
63.50
119.93 120.92
110.00
168.50
57.31
99.1195.17 95.49
98
QTR 2QTR 1
QTR 4
QTR 3
-O-O
DIVINC
-O-O-O-O-O-O-O-O20
40
60
80
100
120
140
160
PRICE SCALE
97COMPOSITE RATING(C)11$ 0.81 $ 26 1112 1.19 16 1113 0.90 16 1114 0.74 21 1515 1.12 33 1816 1.08∆ 119 2417 2.5718 3.09EST +20% ↑
EARNINGS (JAN) HI LOPixelwrks PXLW 97 79Sequans SQNS 96 38AdvaMcrDv AMD 95 56CEVA CEVA 94 81MarvellTec MRVL 89 78
GROUP REL STR 74 RS EPS
301621952172410241027133016218421723926122915JUNMAYAPRMARFEBJAN 17DECNOVOCTSEPAUG
EARNINGS $SALES MIL. $DIVIDEND-PE
0.41 VS 0.05∆ +720%1428 VS 1153 +24%$0.12 48X-- 29X
0.83 VS 0.44∆ +89%2004 VS 1305 +54%$0.12 50X-- 37X
0.99 VS 0.35∆ +183%2173 VS 1401 +55%$0.14 62X-- 34X
0.79 VS 0.35 +126%1937 VS 1305 +48%$0.14 62X-- 37X
EPS DUE 8/11 QUARTER ENDED JUL 31,16 QUARTER ENDED OCT 31,16 QUARTER ENDED JAN 31,17 QUARTER ENDED APR 30,17
R S LINE VS SP500
VOLUME
7M
17M
40M
*AUTOHOME INC CL A ADS(ATHM) NYSE 51.5 SHRS / 41.2 FLT / AVG VOL1.43MIL $45.36(OH -2%)INTERNET-CONTENT autohome.com.cnCHINESE PROVIDER OF INDEPENDENT AND INTERACTIVE CONTENT TO AUTOMOBILE BUYERS VIA AUTOHOME.COM.CN/CHE168.COM.
11/16 EXPECTS Q4 2016 REVENUES OF $305.8 MIL (RMB2,039 MIL) TO $318.1 MIL (RMB2,121 MIL).
SHORT INT 3.7 DAYS +4%OPTIONS ONUP/DOWN 1.4EX-DIVYIELD
GROWTH RATE +54%EARNINGS STAB 17EPS RANK 95PE 24 (1.2XS&P)5 YR PE 12 - 68
DEBT 0%NEW CEO 6/16TIMELINESS BACC/DIST ASMR RATING A
7.01 X BK VALUEINVENTORY TO. 62.0XR&D 7.9%RET ON EQUITY 26%CASH FLOW $1.94
FUNDS 7%BANKS 0%MGMT 19%ALPHA 0.25BETA 1.32
27.2028.34 28.88
35.29 36.01
46.4846.48
19.32
21.90 22.07
24.71
28.63
98
QTR 2QTR 1
QTR 4
QTR 3
10
20
30
40
PRICE SCALE
99COMPOSITE RATING$17.00IPO 12/11/1311$ 0.20 $12 0.3213 0.76 37 2614 1.16 57 2815 1.51 56 2816 1.84 35 1917 2.10EST +14% ↑18 2.53EST +20% ↑
EARNINGS (DEC) HI LOMomo A MOMO 99 84Truecar TRUE 98 58AngiesList ANGI 98 40Weibo A WB 97 79IACInterct IAC 97 49
GROUP REL STR 98 RS EPS
301621952172410241027133016218421723926122915JUNMAYAPRMARFEBJAN 17DECNOVOCTSEPAUG
EARNINGS $SALES MIL. $DIVIDEND-PE
0.51 VS 0.45 +13%207.5 VS 138.9 +49%N/A 21X-- 12X
0.38 VS 0.35 +9%221.1 VS 141.4 +56%N/A 17X-- 12X
0.55 VS 0.43 +28%289.9 VS 166.5 +74%N/A 17X-- 13X
0.45 VS 0.39 +15%195.7 VS 169.1 +16%N/A 21X-- 15X
EPS DUE 8/16 QUARTER ENDED JUN 30,16 QUARTER ENDED SEP 30,16 QUARTER ENDED DEC 31,16 QUARTER ENDED MAR 31,17
R S LINE VS SP500
VOLUME
300K
800K
2.3M

24
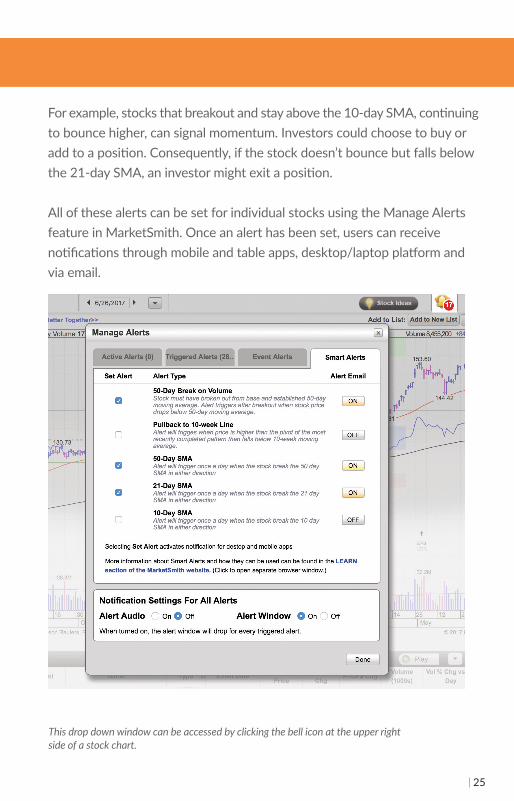
MarketSmith has expanded our Smart Alerts capability. Now investors have the ability to add 10/21/50 day Simple Moving Average (SMA) alerts to their Smart Alerts list. The goal of these new SMAs is to signal investors when their stocks are moving up or down in a way that might require a buy or sell decision.
The 50-day moving average alert is a price-based only alert - no volume is taken into account. This alert can trigger when the stock is moving down to or up to the 50-day line. This is a criti cal support area for insti tuti ons. If the stock is moving down, look to see if there’s insti tuti onal support to push the stock price up. Consequently, as a stock moves up to the 50-day SMA, this can affi rm a base is forming with strength to complete the patt ern, a sign of insti tuti onal support and possible breakout.
The 10-day and 21-day SMA alerts trigger on price (no volume criteria) when a stock is above the corresponding SMA and pulling back. These 2 alerts can be used when investors want to closely monitor a stock’s movement.
MarketSmith Features Highlight
*All screen results are computer-generated and were run on June 30, 2017.
25
For example, stocks that breakout and stay above the 10-day SMA, conti nuing to bounce higher, can signal momentum. Investors could choose to buy or add to a positi on. Consequently, if the stock doesn’t bounce but falls below the 21-day SMA, an investor might exit a positi on.
All of these alerts can be set for individual stocks using the Manage Alerts feature in MarketSmith. Once an alert has been set, users can receive noti fi cati ons through mobile and table apps, desktop/laptop platf orm and via email.
This drop down window can be accessed by clicking the bell icon at the upper right side of a stock chart.

26
Weekly Market UpdatesDon’t miss our Take on the Market video hosted by senior product coaches discussing current market acti vity, the behavior of leading stocks, and strategies for staying on the right side of the acti on. View every Friday at: marketsmith.investors.com/webinaryoutube.com/user/marketsmith1__________________________________________________________________________________
Video Tutorials to Sharpen Your Investi ng Skills
From fundamental analysis to technical chart reading, Investor’s Business Daily and MarketSmith off er comprehensive libraries of investi ng and stock research videos designed to help you make more money in the market. Hosted by IBD experts and MarketSmith product
coaches, topics include upcoming earnings, breakaway gaps, fi nding growth stocks and more.
Check out our video libraries at: Investors.com/MSvideosInvestors.com/IBDvideos__________________________________________________________________________________
Free Stock Trading SummitsJoin us for complimentary investi ng educati on to learn about swing trading, investi ng in growth stocks and advanced screening techniques. You’ll get ti ps on essenti al investi ng strategies and learn how to streamline your stock research. Check our schedule for a Trading Summit near you.
Register now: Call (800) 831-2525 or visit Investors.com/TradingSummit
Resources
and strategies for staying on the right side of the
to learn about swing trading, investi ng in growth stocks and advanced screening techniques. You’ll get ti ps on essenti al investi ng strategies and learn how to streamline your stock research. Check our

27
Follow us for exclusive off ers, giveaways, & stock investi ng ti ps.
Get acti onable investi ng content and live videos with market updates and unique fi nancial stories on our Facebook page.
______________________________________________________________________
Get real-ti me updates on the stock market throughout the day on Twitt er. Tweet us @MarketSmith with your thoughts on the market.
______________________________________________________________________
IBD’s StockTwits allows you to connect with other stock traders to get ti ps on growing your portf olio.
______________________________________________________________________
Reach out & network with the IBD and MarketSmith team on LinkedIn to get in-depth investi ng knowledge.
______________________________________________________________________
Check out Friday’s market video update for our take on market acti on from the past week plus ti mely ti ps for your stock research routi ne.
______________________________________________________________________
Our Instagram gives you behind the scenes look at how IBD and MarketSmith work to help you succeed in the market.
Connect with Us

TALK TO A PRODUCT COACH AND JUMP-START YOUR INVESTING SUCCESSAny calls to MarketSmith Product Coaches are one-on-one and personalized for you. Our U.S. based team will explain any MarketSmith features or help you design a research routine for your investing style.
Our product coaches are here to help you every step of the way.
(800) 831-2525
WE WANT YOU TO
IN THE MARKETMAKE MORE MONEY

Copyright © 2017 Investor’s Business Daily, Inc., Investor’s Business Daily, IBD, CAN SLIM, and corresponding logos are registered trademarks owned by Investor’s Business Daily, Inc. MarketSmith is a registered trademark of MarketSmith, Incorporated.
The material contained herein is not to be reproduced, redistributed, published, stored in a retrieval system, or transmitted in any form or by any means, electronic mechanical, photocopying, recording, or otherwise, without prior written permission of Investor’s Business Daily, Inc. and MarketSmith Incorporated.
Data provided under license agreement by William O’Neil + Co. Incorporated. All material presented here has been obtained or derived from sources believed to be accurate, but Investor’s Business Daily, Inc., MarketSmith Inc., and William O’Neil + Company, Inc. do not guarantee its accuracy and it may possibly be incomplete and/or condensed. The contents are based on the study and interpretation of available data as it relates to our historical models of the best performing stocks. This is not a prospectus; no effort on our part with respect to sale or purchase of any securities is intended or implied. Any chart appearing in this material is for educational purposes and is not, and should not be construed as a recommendation or rating to buy or sell any security. It is possible that at this date or some subsequent date the officers, directors and/or shareholders of William O’Neil + Company, Inc., MarketSmith Inc. and Investor’s Business Daily, Inc. and their affiliates own securities or buy or sell securities listed in the following pages or those not mentioned.
Standard & Poor’s US Index Data
Copyright © 2017, Standard & Poor’s Financial Services LLC (“S&P”). Reproduction of S&P US Index Data in any form is prohibited except with the prior written permission of S&P. Because of the possibility of human or mechanical error by S&P’s sources, S&P or others, S&P does not guarantee the accuracy, adequacy, completeness, timeliness or availability of any information and is not responsible for any errors or omissions or for the results obtained from the use of such information. S&P GIVES NO EXPRESS OR IMPLIED WARRANTIES, INCLUDING, BUT NOT LIMITED TO, ANY WARRANTIES OF MERCHANTABILITY OR FITNESS FOR A PARTICULAR PURPOSE OR USE. In no event shall S&P or its affiliates be liable for any indirect, special or consequential damages in connection with subscriber’s or others’ use of S&P US Index Data. (2012)

1265
5 Be
atric
e St
reet
Los
Ange
les,
CA
9006
6
CO
NN
ECT
WIT
H U
S
STO
CK G
UID
E //
201
7 Q
3
STO
CK
RESE
ARCH
RO
UTI
NE