our safety in our hands in hospital. an integrated approach to patient safety...
TRANSCRIPT

Your Safety in Our Hands in Hospital
An Integrated Approach to Patient Safety Surveillance in WA Hospitals, Health Services and the Community: 2012
Delivering Safer Care Series Report Number 1
This publication has been produced by the: Patient Safety Surveillance Unit (PSSU)Performance DirectoratePerformance Activity and Quality DivisionDepartment of Health, Western Australia189 Royal Street EAST PERTH WA 6004Telephone (08) 9222 0294http://www.safetyandquality.health.wa.gov.au
Suggested citation: Patient Safety Surveillance Unit (2013). Your Safety in Our Hands in Hospital. An Integrated Approach to Patient Safety Surveillance in WA Hospitals, Health Services and the Community: 2012. Delivering Safer Care Series Report Number 1. Department of Health: Perth.
ISBN: 1-921841-07-9 Version 2:05/07/2013
DisclaimerAll information and content in this material is provided in good faith by the Department of Health, Western Australia, (DOH WA) and is based on sources believed to be reliable and accurate at the time of development. The State of Western Australia, the Department of Health, Western Australia and their respective officers, employees and agents, do not accept legal liability or responsibility for the material, or any consequences from its use. This report can be made available in alternative formats, on request. The data presented is correct as of 23/7/2012, except for complaints data which is correct as of 05/07/2013.
AcknowledgementsThe PSSU would like to thank and acknowledge the contribution of all clinical and administrative staff who have devoted their time and effort to notifying, reporting and investigating of clinical incidents with the goal to improve health care delivery.
We would also like to acknowledge the patients and their families who have experienced unintended harm whilst receiving care in our health system. By reporting, investigating, implementing change and sharing the lessons learned, we aim to reduce error and improve patients’ safety.

i
ForewordWhile each and every one of us who works in the WA Health system is committed to delivering safe care to all people, things can, and do, go wrong.
In WA we are prepared to face up to human errors and mistakes. We are prepared to not only take responsibility for preventable harm but also, work as hard as we can to prevent these events happening again. WA has made good progress in some areas but there remains much to do.
This report, which draws useful patient safety information from many parts of the health system, is a first for WA Health. The message is a tough one. Patient safety as measured by incident and adverse event reporting remains a problem.
I am confident the people who work in WA Health will continue their good work and ensure that patient centred quality improvement and risk management actions continue and are strengthened.
This is a leadership challenge for all of us – from the bedside clinical staff to the managers and executives. We must all act to improve patient safety in every way we can. In this way we will be transparent to the patients, families and carers who use our health services. We can then be confident in our message that we care for all patients at all times.
Kim SnowballDIreCtOr generAl

ii
PrefacePatient safety as measured by healthcare acquired harm - in other words a healthcare acquired injury that is not related to the patient’s presenting health condition - remains significant. Every year, preventable harm including permanent disability and death, occurs in all WA health services. This harm not only hurts patients, their carers and families unnecessarily, but adds significant cost to the episode of care.
Despite over two decades of international research and the implementation of targeted patient safety policy and program initiatives - the epidemiology of adverse events (AE) remains complex. Recent evidence from similar health care systems to WA has reinforced the original 1995 Australian evidence that the rate of AE in hospitals remains at about 10% of all admissions (See Appendix 1 for detailed summaries). On average, AE add an extra week of hospital stay. Furthermore trained clinician reviewers judge on average that up to 50% of reported AE are preventable. Australia has not yet repeated the original 1995 study to gauge how far we have come in these intervening decades. However, for the first time in WA, this report brings together a number of Clinical Incident Reporting and Management methodologies to describe a more integrated and clinically relevant patient safety landscape. In this way, WA Health intends to provide an overall picture or surveillance report on patient safety – so that everyone – at whichever part of the health system they work – can see useful, timely information to inform their priority quality improvement actions and activities.
Many clinicians shy away from “big brother” concepts such as surveillance but perhaps it is worth taking the opportunity to think again about our overall approach to patient safety in WA. As we build a comprehensive and systematic response to improving patient safety, we must integrate all available information into a systematic patient safety surveillance framework. In this way we can better plan and inform appropriate patient safety activities and actions wherever we work within the whole WA health system – such as a hospital or health service system or a specialty or ward clinical microsystem.
In WA we have made a real difference in some key areas such as healthcare acquired infection, hand hygiene, falls in hospital, wrong sided surgery and pressure injuries. However, these improvements tend to be patchy and vary between wards, clinical teams and health services. This variation in clinical practice needs to be better understood and remedied. Most of the remedies are in our own behaviours, leadership actions and change management processes.
This first report in the new WA Health Patient Safety series begins the integration of clinical incident reporting in WA. I hope that this report also starts the necessary and sometimes difficult conversations to deliver better patient safety outcomes. By understanding the complex issues of patient safety – we can further improve the reliability of care delivery so that we no longer cause unnecessary harm to 10% of our patients. We must focus on every patient, every time, everywhere. Delivering safe care is in our own hands.
Dr Dorothy jones
exeCutIve DIreCtOr
PerFOrmAnCe ACtIvItY AnD quAlItY DIvISIOn

iii
ContentsForeword i
Preface ii
list of Figures iv
list of tables v
Acronyms vi
Patient Safety 1
About this report 4
executive Summary 6
Clinical Incident management System Overall notifications 8
SAC 1 Clinical Incidents 11
Sentinel Event Notifications 13
Other SAC 1 Clinical Incident Notifications 16
SAC 1 Contributory Factor Analysis 18
Sentinel Events 20
Other SAC 1 Clinical Incidents 21
SAC 1 Case Study 26
Key SAC 1 Clinical Incident Messages 27
SAC 2 Clinical Incidents 28
SAC 2 Clinical Incident Focus 31
SAC 2 Case Studies 35
Key SAC 2 Clinical Incident Messages 36
SAC 3 Clinical Incidents 38
SAC 3 Clinical Incident Focus 41
SAC 3 Case Study 46
Key SAC 3 Clinical Incident Messages 47
Coronial review 48
Overview 48
Synopses 49
Western Australian review of mortality 54
Western Australian Audit of Surgical mortality 55
Complaints review 58
Quality of Clinical Care 59
Future Focus 61
iv
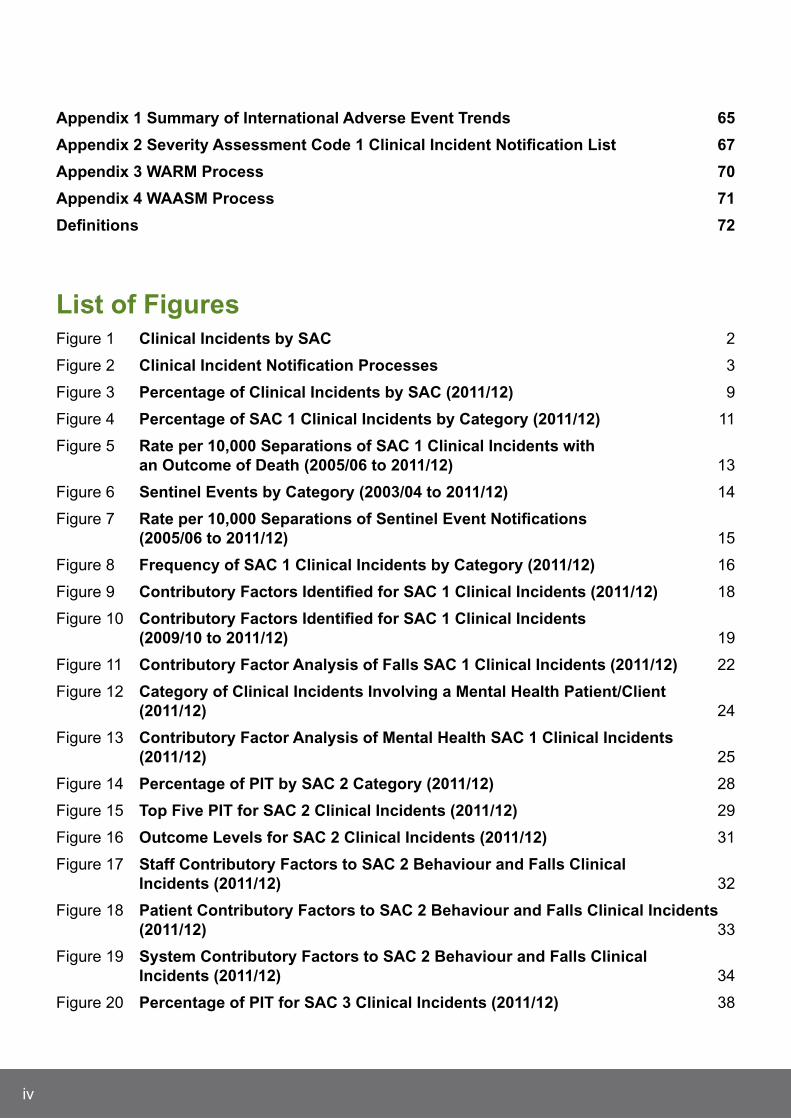
Appendix 1 Summary of International Adverse event trends 65
Appendix 2 Severity Assessment Code 1 Clinical Incident notification list 67
Appendix 3 WArm Process 70
Appendix 4 WAASm Process 71
Definitions 72
list of Figures Figure 1 Clinical Incidents by SAC 2
Figure 2 Clinical Incident notification Processes 3
Figure 3 Percentage of Clinical Incidents by SAC (2011/12) 9
Figure 4 Percentage of SAC 1 Clinical Incidents by Category (2011/12) 11
Figure 5 rate per 10,000 Separations of SAC 1 Clinical Incidents with an Outcome of Death (2005/06 to 2011/12) 13
Figure 6 Sentinel events by Category (2003/04 to 2011/12) 14
Figure 7 rate per 10,000 Separations of Sentinel event notifications (2005/06 to 2011/12) 15
Figure 8 Frequency of SAC 1 Clinical Incidents by Category (2011/12) 16
Figure 9 Contributory Factors Identified for SAC 1 Clinical Incidents (2011/12) 18
Figure 10 Contributory Factors Identified for SAC 1 Clinical Incidents (2009/10 to 2011/12) 19
Figure 11 Contributory Factor Analysis of Falls SAC 1 Clinical Incidents (2011/12) 22
Figure 12 Category of Clinical Incidents Involving a mental Health Patient/Client (2011/12) 24
Figure 13 Contributory Factor Analysis of mental Health SAC 1 Clinical Incidents (2011/12) 25
Figure 14 Percentage of PIt by SAC 2 Category (2011/12) 28
Figure 15 top Five PIt for SAC 2 Clinical Incidents (2011/12) 29
Figure 16 Outcome levels for SAC 2 Clinical Incidents (2011/12) 31
Figure 17 Staff Contributory Factors to SAC 2 Behaviour and Falls Clinical Incidents (2011/12) 32
Figure 18 Patient Contributory Factors to SAC 2 Behaviour and Falls Clinical Incidents (2011/12) 33
Figure 19 System Contributory Factors to SAC 2 Behaviour and Falls Clinical Incidents (2011/12) 34
Figure 20 Percentage of PIt for SAC 3 Clinical Incidents (2011/12) 38

v
Figure 21 top Five PIt for SAC 3 Clinical Incidents (2011/12) 39
Figure 22 Outcome levels for SAC 3 Clinical Incidents (2011/12) 41
Figure 23 ten most Frequently Cited medications Involved in SAC 3 medication Clinical Incidents (2011/12) 42
Figure 24 Staff Contributory Factors to SAC 3 Falls and medication Clinical Incidents (2011/12) 43
Figure 25 Patient Contributory Factors to SAC 3 Falls and medication Clinical Incidents (2011/12) 44
Figure 26 System Contributory Factors to SAC 3 Falls and medication Clinical Incidents (2011/12) 45
Figure 27 Health Complaint Issues relating to ‘quality of Clinical Care’ (2011/12) 59
Figure 28 mental Health Complaint Issues relating to ‘quality of Clinical Care’ (2011/12) 60
list of tablesTable 1 top Five SAC 1 Clinical Incident Categories (2011/12) 9
Table 2 top Five PIt (2011/12) 10
Table 3 Confirmed SAC 1 Clinical Incidents by national Sentinel event and Other SAC 1 Clinical Incident type (2003/04 to 2011/12) 12
Table 4 Confirmed SAC 1 Clinical Incidents other than Sentinel events (2003/04 to 2011/12) 17
Table 5 top Five PIt by nature of SAC 2 Clinical Incidents (2011/12) 30
Table 6 Demographic Data for SAC 2 Behaviour and Falls Clinical Incidents (2011/12) 31
Table 7 top Five PIt by nature of SAC 3 Clinical Incidents (2011/12) 40
Table 8 Demographic Data for SAC 3 Falls and medication Clinical Incidents (2011/12) 42
Table 9 Overview of Coronial liaison unit Activity (2009/10 to 2011/12) 48
Table 10 Western Australian review of mortality – WArm Indicators 54
Table 11 number of Ae Causing Death that were Considered Definitely Preventable (2002–2011) 55
Table 12 Adverse events Causing Death for 2010–2011 (includes events that were not considered preventable) 56
Table 13 most Frequently reported Ae Causing Death (2002–2011) (includes events that were not considered preventable) 57
Table 14 Summary table of International Ae trends 65
vi
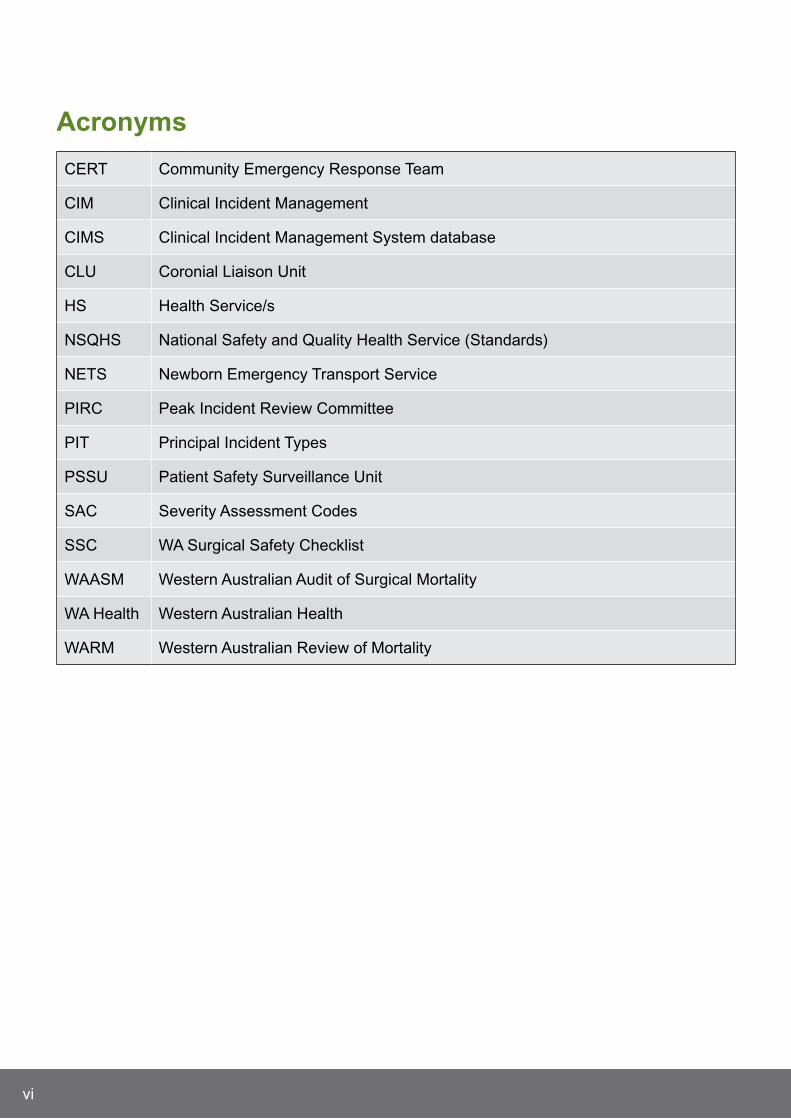
Acronyms
CERT Community Emergency Response Team
CIM Clinical Incident Management
CIMS Clinical Incident Management System database
CLU Coronial Liaison Unit
HS Health Service/s
NSQHS National Safety and Quality Health Service (Standards)
NETS Newborn Emergency Transport Service
PIRC Peak Incident Review Committee
PIT Principal Incident Types
PSSU Patient Safety Surveillance Unit
SAC Severity Assessment Codes
SSC WA Surgical Safety Checklist
WAASM Western Australian Audit of Surgical Mortality
WA Health Western Australian Health
WARM Western Australian Review of Mortality

1
Patient Safety Patient safety is an integral component of health care delivery, the goal of which is to improve the safety of patients as they progress along their health care journey by learning from our errors. The release of the seminal work by the Institute of Medicine in 19991, which quantified that clinical errors in the United States of America caused in excess of 98,000 deaths and more than 1 million injuries each year, clearly demonstrated how health care delivery can impact on the lives of patients and their families.
More recent overseas and national studies have reported that clinical incidents constitute between 6.9%2 and 18%3 of all hospital admissions. These clinical incidents not only impact on extended hospitalisation and higher financial costs but have also resulted in higher mortality and immense personal grief.2
Western Australian Health (WA Health) is committed to delivering safe and high quality health care which is achieved through the provision of health care that is:
evidence based;
efficient;
governed by sound clinical practice; and
focussed on preventing and reducing the impact of clinical incidents.
Clinical incidents for the purposes of reporting patient safety refer to an event or circumstance resulting from health care which could have, or did lead to unintended harm to a person, loss or damage. Clinical incidents include near misses, adverse events and sentinel events (please refer to the Definitions section for further details).
The Clinical Incident Management (CIM) Policy (2011) introduced to WA Health, the Severity Assessment Codes (SAC; see Figure 1), which are used to guide the appropriate level of incident analysis, action and escalation. Clinical incidents are categorised according to harm caused to the patient by the delivery of health care and not the patient’s underlying condition or illness.
1 Kohn, L., Corrigan, jM., Donaldson, M. 1999. To err is human: Building a safer health care system. Committee on Quality of Health Care in America. Institute of Medicine.
2 Ehsani, j., jackson, T., Duckett, S. 2006. The incidence and cost of adverse events in Victorian hospitals 2003-2004. Medical journal of Australia; 184: 551-555.
3 Landigran, C., Parry, G., Bones, C., Hackbath, A., Goldmann, D., Sharek, P. 2010. Temporal trends in rates of patient harm resulting from medical care. The New England journal of Medicine; 363: 2124-34.

2
Specifically a:
SAC 1 rating refers to clinical incidents resulting in serious harm/death/near miss, and includes the eight nationally reported clinical incidents known as sentinel events:
1. Procedure involving wrong patient or body part resulting in death or major permanent loss of function
2. Suicide of a patient in an inpatient unit (or whilst on leave)3. Retained instruments or other material after surgery requiring return to theatre4. Intravascular gas embolism resulting in death or neurological damage5. Haemolytic blood transfusion reaction resulting from ABO incompatibility6. Medication error resulting in death of a patient7. Maternal death or serious morbidity associated with labour or delivery8. Infant discharged to wrong family or infant abduction.
SAC 2 rating refers to clinical incidents resulting in moderate harm/near miss; and
SAC 3 rating refers to clinical incidents resulting in minimal/no harm/near miss.
Figure 1: Clinical Incidents by SAC
When a clinical incident is identified, immediate action is taken to provide care to the patient involved. Once this has occurred a clinical incident form is completed to notify senior staff and enable an appropriate investigation to take place. The incident is then assigned a SAC rating that guides the type of investigation method used (see Figure 2). Clinical incidents resulting in serious harm or death (SAC 1) require a detailed and rigorous investigation to be undertaken. Analysis of the clinical incident is then undertaken which results in the implementation of recommendations to prevent the clinical incident from recurring.
All clinical incidents are then captured in the Clinical Incident Management System (CIMS) database and the Severity Assessment Code 1 database. This clinical incident data is then used at a local and statewide level to review trends and identify areas where practice improvements can be achieved.
Additional strategies to further strengthen the clinical incident notification process include the WA Review of Mortality (WARM) and the WA Audit of Surgical Mortality (WAASM). The purpose of WARM and WAASM is to systematically review patient deaths to identify those that may have been preventable so that lessons can be learnt. These separate statewide review processes (SAC 1 incident notification, WARM, and WAASM) ensure that clinical incidents resulting in a patient’s death are captured, notified and investigated.
SAC 3: minimal or no harm
SAC 2: moderate harm
SAC 1: Consists of all clinical incidents which result in serious harm or death – includes the eight national Sentinel Event Categories
3
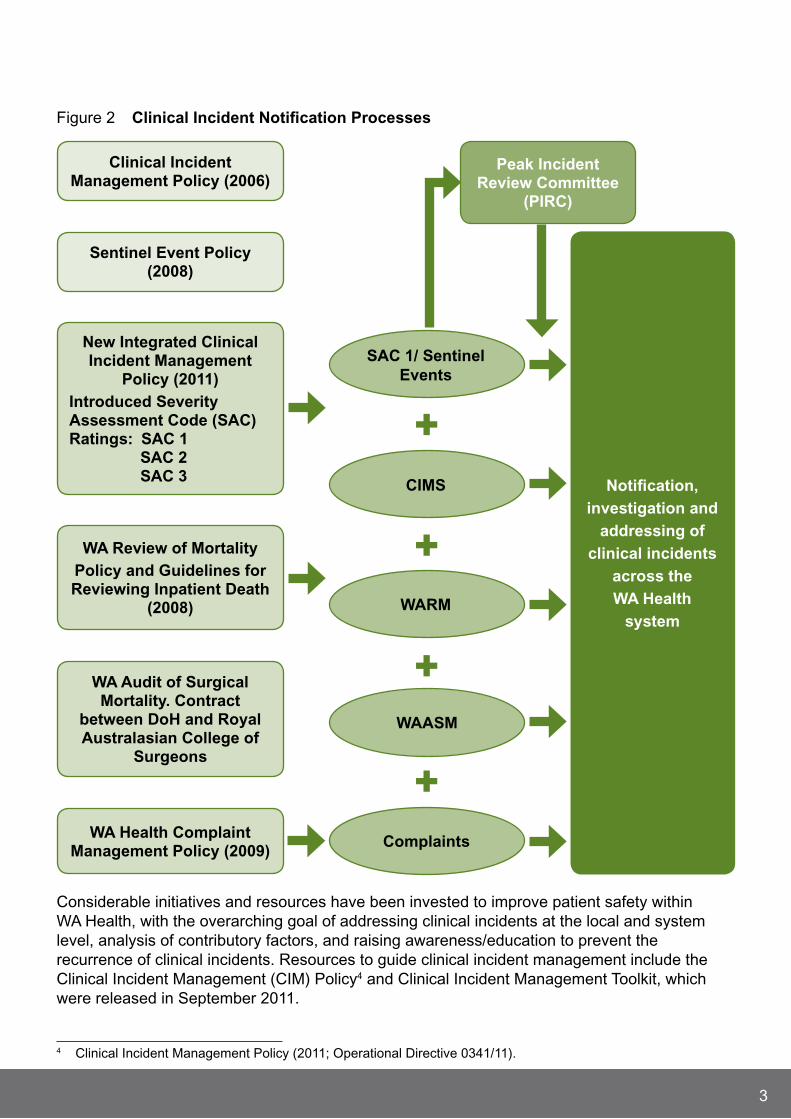
Figure 2 Clinical Incident notification Processes
Considerable initiatives and resources have been invested to improve patient safety within WA Health, with the overarching goal of addressing clinical incidents at the local and system level, analysis of contributory factors, and raising awareness/education to prevent the recurrence of clinical incidents. Resources to guide clinical incident management include the Clinical Incident Management (CIM) Policy4 and Clinical Incident Management Toolkit, which were released in September 2011.
4 Clinical Incident Management Policy (2011; Operational Directive 0341/11).
notification, investigation and
addressing of clinical incidents
across the WA Health
system
Clinical Incident management Policy (2006)
Sentinel event Policy (2008)
new Integrated Clinical Incident management
Policy (2011) Introduced Severity Assessment Code (SAC) ratings: SAC 1 SAC 2 SAC 3
Peak Incident review Committee
(PIrC)
WA review of mortalityPolicy and guidelines for reviewing Inpatient Death
(2008)
WA Audit of Surgical mortality. Contract
between DoH and royal Australasian College of
Surgeons
WA Health Complaint management Policy (2009)
Complaints
WAASm
WArm
CImS
SAC 1/ Sentinel events
+
+
+
+
4
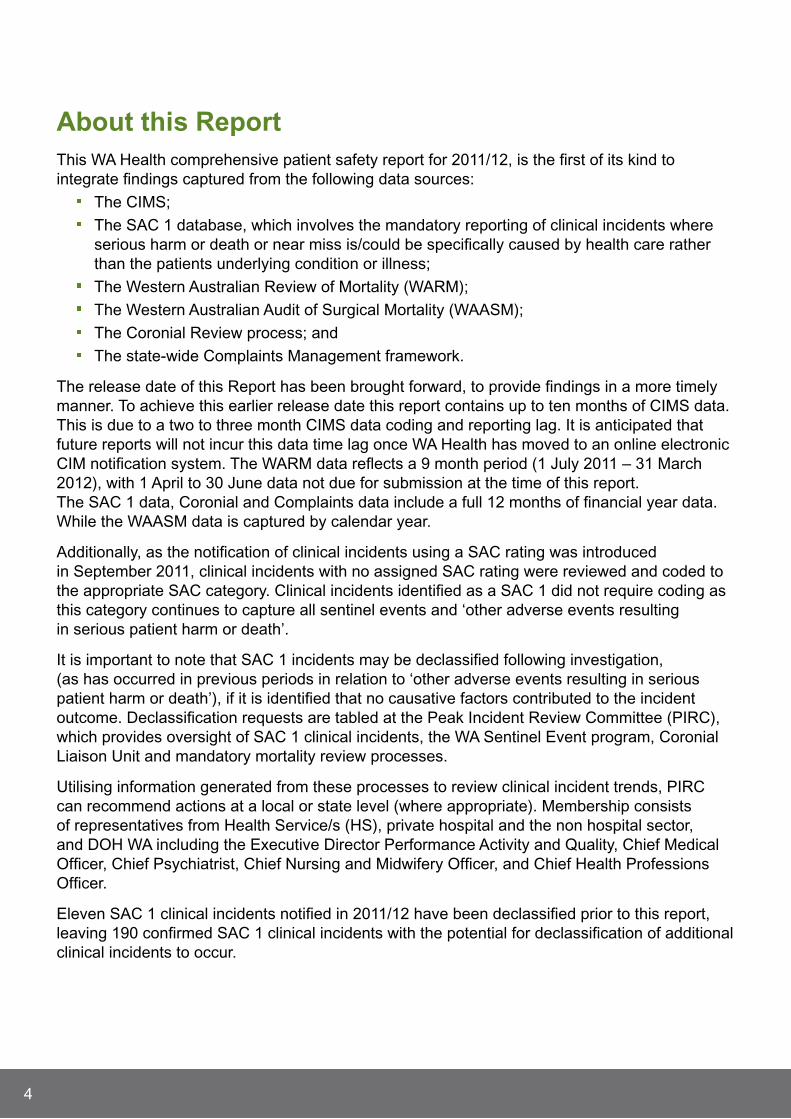
About this reportThis WA Health comprehensive patient safety report for 2011/12, is the first of its kind to integrate findings captured from the following data sources:
The CIMS;
The SAC 1 database, which involves the mandatory reporting of clinical incidents where serious harm or death or near miss is/could be specifically caused by health care rather than the patients underlying condition or illness;
The Western Australian Review of Mortality (WARM);
The Western Australian Audit of Surgical Mortality (WAASM);
The Coronial Review process; and
The state-wide Complaints Management framework.
The release date of this Report has been brought forward, to provide findings in a more timely manner. To achieve this earlier release date this report contains up to ten months of CIMS data. This is due to a two to three month CIMS data coding and reporting lag. It is anticipated that future reports will not incur this data time lag once WA Health has moved to an online electronic CIM notification system. The WARM data reflects a 9 month period (1 july 2011 – 31 March 2012), with 1 April to 30 june data not due for submission at the time of this report. The SAC 1 data, Coronial and Complaints data include a full 12 months of financial year data. While the WAASM data is captured by calendar year.
Additionally, as the notification of clinical incidents using a SAC rating was introduced in September 2011, clinical incidents with no assigned SAC rating were reviewed and coded to the appropriate SAC category. Clinical incidents identified as a SAC 1 did not require coding as this category continues to capture all sentinel events and ‘other adverse events resulting in serious patient harm or death’.
It is important to note that SAC 1 incidents may be declassified following investigation, (as has occurred in previous periods in relation to ‘other adverse events resulting in serious patient harm or death’), if it is identified that no causative factors contributed to the incident outcome. Declassification requests are tabled at the Peak Incident Review Committee (PIRC), which provides oversight of SAC 1 clinical incidents, the WA Sentinel Event program, Coronial Liaison Unit and mandatory mortality review processes.
Utilising information generated from these processes to review clinical incident trends, PIRC can recommend actions at a local or state level (where appropriate). Membership consists of representatives from Health Service/s (HS), private hospital and the non hospital sector, and DOH WA including the Executive Director Performance Activity and Quality, Chief Medical Officer, Chief Psychiatrist, Chief Nursing and Midwifery Officer, and Chief Health Professions Officer.
Eleven SAC 1 clinical incidents notified in 2011/12 have been declassified prior to this report, leaving 190 confirmed SAC 1 clinical incidents with the potential for declassification of additional clinical incidents to occur.

5
The inclusion of composite case studies for each of the three SAC categories is used to facilitate learning opportunities for staff by highlighting a few examples of the hundreds of quality improvement projects undertaken across WA Health, to address and prevent clinical incidents. Quality improvement projects included in the case study sections of this report were obtained from Sir Charles Gairdner Hospital, Fremantle Hospital and North Metropolitan Health Service Mental Health, who were invited to provide details of their frequent faller reduction programme, medication safety audit and seclusion and restraint quality improvement project.
While complaints data is an important aspect of the quality improvement cycle, it is important to know that a patient complaint is not usually associated with a reported adverse event/clinical incident. The inclusion of complaints data in this report is to reinforce the importance of one aspect of consumer engagement (via the complaints process) to assist HS in recognising and facilitating quality improvements from a consumer’s perspective.
Finally, this report reviews clinical incidents from a statewide perspective and examines the issues identified during the 2011/12 period. Specifically, this report seeks to inform the WA community of clinical incidents that have occurred within our health system, provide examples of the types of measures taken to prevent their recurrence and to identify areas where greater improvements can be achieved.
6
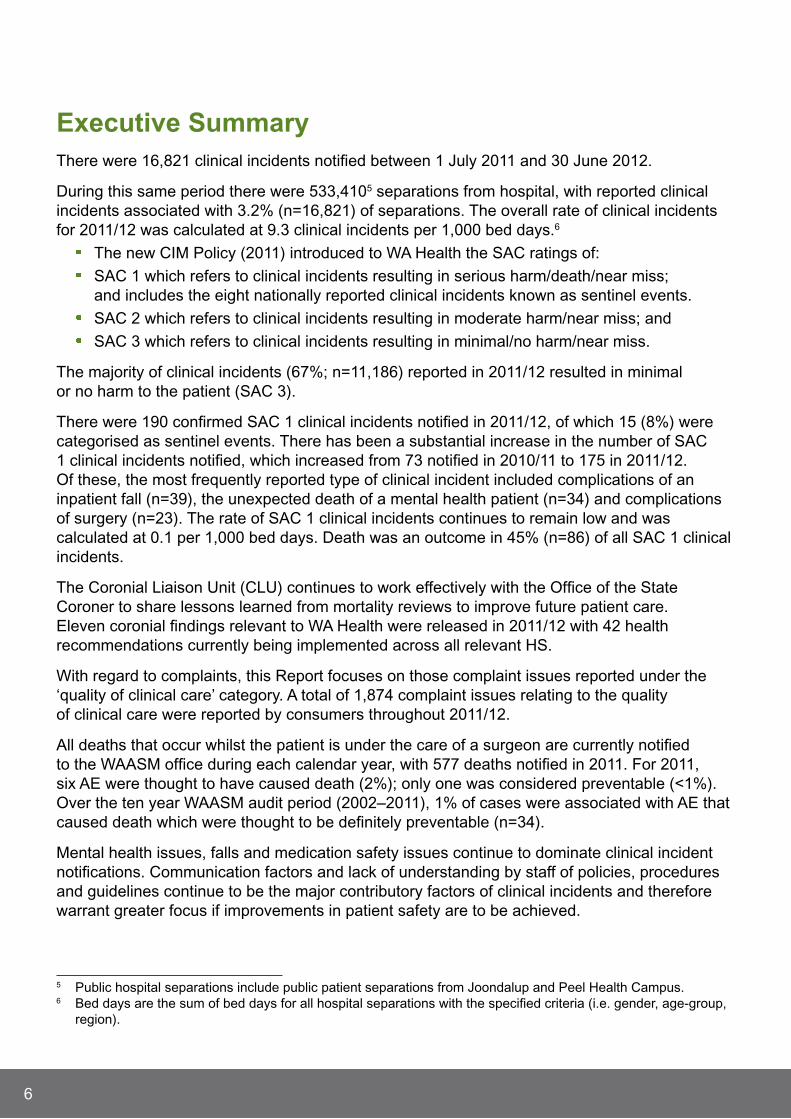
executive SummaryThere were 16,821 clinical incidents notified between 1 july 2011 and 30 june 2012.
During this same period there were 533,4105 separations from hospital, with reported clinical incidents associated with 3.2% (n=16,821) of separations. The overall rate of clinical incidents for 2011/12 was calculated at 9.3 clinical incidents per 1,000 bed days.6
The new CIM Policy (2011) introduced to WA Health the SAC ratings of:
SAC 1 which refers to clinical incidents resulting in serious harm/death/near miss; and includes the eight nationally reported clinical incidents known as sentinel events.
SAC 2 which refers to clinical incidents resulting in moderate harm/near miss; and
SAC 3 which refers to clinical incidents resulting in minimal/no harm/near miss.
The majority of clinical incidents (67%; n=11,186) reported in 2011/12 resulted in minimal or no harm to the patient (SAC 3).
There were 190 confirmed SAC 1 clinical incidents notified in 2011/12, of which 15 (8%) were categorised as sentinel events. There has been a substantial increase in the number of SAC 1 clinical incidents notified, which increased from 73 notified in 2010/11 to 175 in 2011/12. Of these, the most frequently reported type of clinical incident included complications of an inpatient fall (n=39), the unexpected death of a mental health patient (n=34) and complications of surgery (n=23). The rate of SAC 1 clinical incidents continues to remain low and was calculated at 0.1 per 1,000 bed days. Death was an outcome in 45% (n=86) of all SAC 1 clinical incidents.
The Coronial Liaison Unit (CLU) continues to work effectively with the Office of the State Coroner to share lessons learned from mortality reviews to improve future patient care. Eleven coronial findings relevant to WA Health were released in 2011/12 with 42 health recommendations currently being implemented across all relevant HS.
With regard to complaints, this Report focuses on those complaint issues reported under the ‘quality of clinical care’ category. A total of 1,874 complaint issues relating to the quality of clinical care were reported by consumers throughout 2011/12.
All deaths that occur whilst the patient is under the care of a surgeon are currently notified to the WAASM office during each calendar year, with 577 deaths notified in 2011. For 2011, six AE were thought to have caused death (2%); only one was considered preventable (<1%). Over the ten year WAASM audit period (2002–2011), 1% of cases were associated with AE that caused death which were thought to be definitely preventable (n=34).
Mental health issues, falls and medication safety issues continue to dominate clinical incident notifications. Communication factors and lack of understanding by staff of policies, procedures and guidelines continue to be the major contributory factors of clinical incidents and therefore warrant greater focus if improvements in patient safety are to be achieved.
5 Public hospital separations include public patient separations from joondalup and Peel Health Campus.6 Bed days are the sum of bed days for all hospital separations with the specified criteria (i.e. gender, age-group,
region).
7
Finally, patient safety is a critically important component of health care delivery. In 2011/12, WA Health provided care to 533,410 patients. Encouragingly, reported clinical incidents were associated with only 3.2% (n=16,821) of separations and an even lower figure was reported (n=190) for SAC 1 clinical incidents. Despite the voluntary nature of reporting for SAC 2 and SAC 3 clinical incidents, these findings are encouraging and show that WA Health’s commitment to patient safety is improving. However, more work in enhancing communication and engaging staff in adopting safer practices are required if further advancements in patient safety are to be achieved.

8
Clinical Incident management System Overall notificationsWA Health uses the CIMS, which is a voluntary reporting system whereby staff, patients, clients, carers or visitors who witness a clinical incident are encouraged to report the clinical incident. The CIMS is one of several reporting systems used by WA Health to capture clinical incidents. It facilitates the notification, investigation, analysis and monitoring of the clinical incidents that occur within all public hospitals in Western Australia.
A separate SAC 1 reporting system is also utilised to capture data on clinical incidents that result in serious harm/death or near miss. It is a mandatory requirement for all public hospitals/health services as well as all private licensed health care facilities and non government organisations to report SAC 1 clinical incidents.7
Between 1 july 2011 and 30 june 2012 there were 533,410 separations from public hospitals and public patients attending two private hospitals (Peel Health Campus and joondalup Health Campus). Reported clinical incidents were associated with 3.2% (n=16,821) of separations. The rate of clinical incidents per bed day for this year was calculated at 9.3 per 1,000 bed days, which is a lower rate than observed in the 2010/11 period (13 per 1,000 bed days). One explanation for this decreased incidence rate can be attributed to decreased clinical incident reporting which occurred after the expiration of the Commonwealth Qualified Privilege Scheme in june 2011. Further compounding this decrease in clinical incident notifications is the coding and reporting lags with the CIMS dataset containing only nine to ten months of data.
The rate of clinical incidents observed between july 2011 and june 2012 was calculated at:
0.1 per 1,000 bed days for SAC 1 clinical incidents;
3 per 1,000 bed days for SAC 2 clinical incidents; and
6.2 per 1,000 bed days for SAC 3 clinical incidents.
Clinical incidents categorised as SAC 3 (n=11,186; 67%), referring to minimal or no harm, were the most frequently reported category of clinical incidents (see Figure 3).
7 Further information on the licensing of private healthcare facilities can be found at: http://www.public.health.wa.gov.au/2/1350/2/licensing_of_private_healthcare_facilities.pm

9
Figure 3 Percentage of Clinical Incidents by SAC (2011/12)* †
1%
32%
67%
SAC 1 (Serious Harm or Death) (1%)
SAC 2 (Moderate Harm) (32%)
SAC 3 (Minimal or No Harm) (67%)
* CIMS clinical incidents include up to 10 months of data, due to a coding/reporting lag.† SAC 1 clinical incidents include clinical incidents from public and private hospitals and
non government organisations (in accordance with their license or contract with WA Health).
The five most frequently reported SAC 1 clinical incident categories representing 65.2% (n=124) of all SAC 1 clinical incidents are presented in Table 1.
Table 1 top Five SAC 1 Clinical Incident Categories (2011/12)
SAC 1 Category (n) (%)
Complication of an inpatient fall 39 20.5
Unexpected death of a mental health patient 34 17.9
Complication of surgery 23 12.1
Medication error not resulting in death 17 8.9
Hospital process issues 11 5.8
total 124 65.2
The five most frequently reported Principal Incident Type (PIT) categories, which represent 85.9% (n=14,455) of all clinical incidents reported during the 2011/12 period, are presented in Table 2. Falls continue to be the most frequently reported clinical incident accounting for 25.7% (n=4,317) of all clinical incidents in 2011/12, followed closely by medication incidents (n=3,592; 21.3%).

10
Table 2 top Five PIt (2011/12)*
Principal Incident type (n**) (%)
Falls 4,317 25.7
Medication 3,592 21.3
Behaviour 2,346 13.9
Other 2,287 13.6
Injury 1,913 11.4
total 14,455 85.9
*Note: Remaining PIT included: Blood, Oxygen, Gas clinical incidents, Documentation clinical incidents, Nutrition clinical incidents, Safety or Security incidents, and Therapeutic Devices incidents.
**CIMS clinical incidents include up to 10 months of data, due to a coding/reporting lag.

11
SAC 1 Clinical IncidentsIn previous reporting periods the Sentinel Event Policy (2008) specified the process of notification and investigation of clinical incidents that were ‘rare events that led to catastrophic patient outcomes’. These clinical incidents included the eight nationally reported sentinel events and an additional WA Health category, describing ‘other adverse events resulting in serious patient harm or death’.
The release of the CIM Policy (2011) introduced to WA Health SAC ratings with SAC 1 referring to all clinical incidents resulting in serious harm/death/near miss. The CIM policy also provided greater clarity as to what constitutes a SAC 1 clinical incident. This includes the notification of clinical incidents that occur in a non-hospital setting. The eight nationally reported clinical incidents known as sentinel events, and an expanded number of clinical incident types known previously as ‘other adverse events resulting in serious patient harm or death’ are now referred to as SAC 1 clinical incidents (see Appendix 2). Accordingly, caution must be exercised when comparing the number of SAC 1 clinical incidents (other than sentinel events) notified in 2011/12 with clinical incidents notified in previous periods.
The reporting of SAC 1 clinical incidents is mandatory for WA public hospitals, all private licensed health care facilities and non-government organisations (in accordance with their license or contract with WA Health). Accordingly analysis of SAC 1 clinical incidents reflects data provided by all notifiers and is not limited to WA Health hospitals or health services.
In 2011/12, 201 SAC 1 clinical incidents were notified by WA public, private licensed health care facilities, and non government organisations. Eleven clinical incidents were declassified with 190 SAC 1 clinical incidents confirmed. Fifteen clinical incident (8%) notifications reflected a sentinel event category, with the majority of clinical incidents (n=175; 92%) categorised as ‘other SAC 1 incidents’ (see Figure 4).
Figure 4 Percentage of SAC 1 Clinical Incidents by Category (2011/12)
92%
8%
Other SAC 1 Clinical Incidents (92%)
Sentinel Events (8%)

12
Table 3 illustrates confirmed SAC 1 clinical incidents notified by year from 2003/04 to 2011/12. As in previous periods, (irrespective of reporting structure), the majority of notified clinical incidents were those other than the eight sentinel event categories.
Table 3 Confirmed SAC 1 Clinical Incidents by national Sentinel event and Other SAC 1 Clinical Incident type (2003/04 to 2011/12)
SAC 1 Category
2003/04 2004/05 2005/06 2006/07 2007/08 2008/09 2009/10 2010/11 2011/12
Sentinel Events
4 19 13 15 36 25 11 17 15
Other SAC 1 Incidents
19 23 31 31 45 56 34 73 175
tOtAl 23 42 44 46 81 81 45 90 190
Death was an outcome in 45% (n=86) of confirmed SAC 1 clinical incidents notified in 2011/2012. Utilising inpatient separation data from all public hospital and private licensed hospitals/healthcare facilities this equates to a rate of 0.92 deaths per 10,000 hospital separations.8
8 Calculation includes all notified SAC 1 incidents with an outcome of death including those notified by non hospi-tal organisations. Separation data from non hospital organisations are not included in calculations.
13
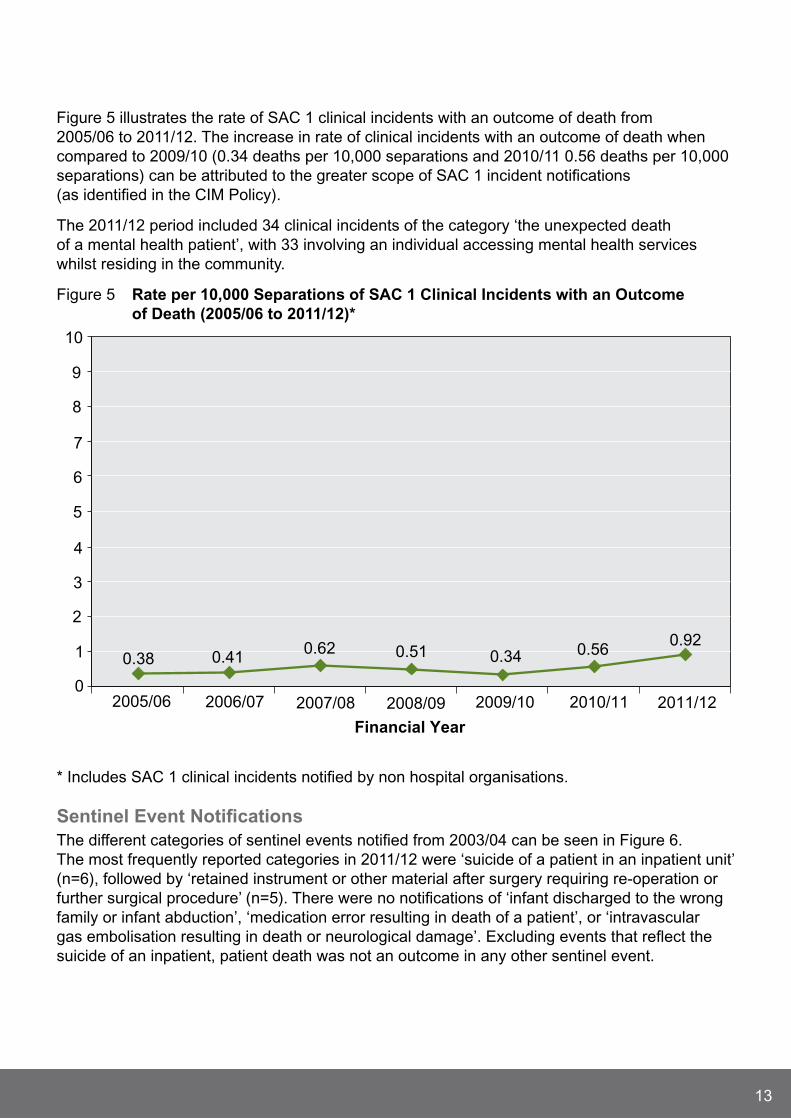
Figure 5 illustrates the rate of SAC 1 clinical incidents with an outcome of death from 2005/06 to 2011/12. The increase in rate of clinical incidents with an outcome of death when compared to 2009/10 (0.34 deaths per 10,000 separations and 2010/11 0.56 deaths per 10,000 separations) can be attributed to the greater scope of SAC 1 incident notifications (as identified in the CIM Policy).
The 2011/12 period included 34 clinical incidents of the category ‘the unexpected death of a mental health patient’, with 33 involving an individual accessing mental health services whilst residing in the community.
Figure 5 rate per 10,000 Separations of SAC 1 Clinical Incidents with an Outcome of Death (2005/06 to 2011/12)*
0
1
2
3
4
5
6
7
8
9
10
Financial Year
0.38 0.410.62 0.51 0.34 0.56
0.92
2005/06 2006/07 2007/08 2008/09 2009/10 2010/11 2011/12
* Includes SAC 1 clinical incidents notified by non hospital organisations.
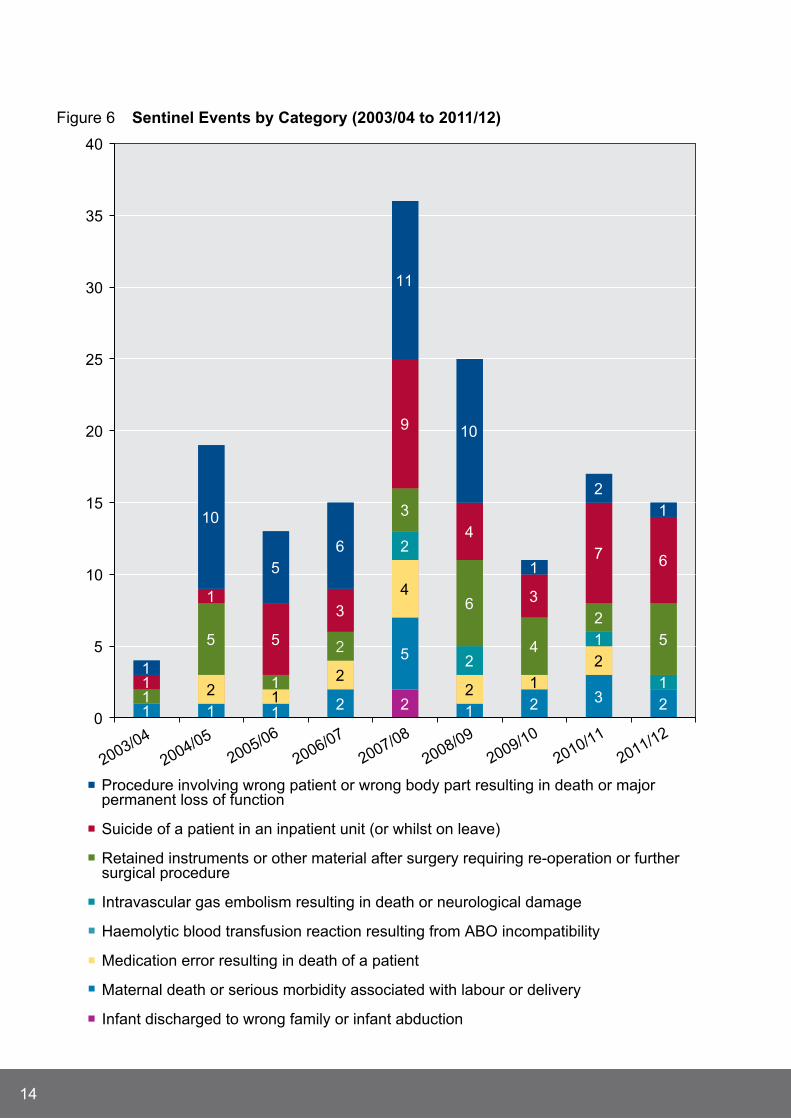
Sentinel event notificationsThe different categories of sentinel events notified from 2003/04 can be seen in Figure 6. The most frequently reported categories in 2011/12 were ‘suicide of a patient in an inpatient unit’ (n=6), followed by ‘retained instrument or other material after surgery requiring re-operation or further surgical procedure’ (n=5). There were no notifications of ‘infant discharged to the wrong family or infant abduction’, ‘medication error resulting in death of a patient’, or ‘intravascular gas embolisation resulting in death or neurological damage’. Excluding events that reflect the suicide of an inpatient, patient death was not an outcome in any other sentinel event.
14
Figure 6 Sentinel events by Category (2003/04 to 2011/12)
21 1 2
5
1 2 3 22 1
2
4
2 1
2
2
2
1
11
5
1
2
3
6
4
2
5
1
1
5
3
9
4
3
7 6
1
10
5
6
11
10
1
2
1
10
5
10
15
20
25
30
35
40
2003/04
2004/05
2005/06
2006/07
2007/08
2008/09
2009/10
2010/11
2011/12
Procedure involving wrong patient or wrong body part resulting in death or majorpermanent loss of function
Suicide of a patient in an inpatient unit (or whilst on leave)
Retained instruments or other material after surgery requiring re-operation or furthersurgical procedure
Intravascular gas embolism resulting in death or neurological damage
Haemolytic blood transfusion reaction resulting from ABO incompatibility
Medication error resulting in death of a patient
Maternal death or serious morbidity associated with labour or delivery
Infant discharged to wrong family or infant abduction

15
The large reduction in notifications of procedures involving the wrong patient or wrong body part from 2009/10 can be attributed to WA Health modifying this definition in line with national standards to only include clinical incidents resulting in death or major permanent loss of function.
Figure 7 illustrates the rate of sentinel events per 10,000 hospital separations (utilising separation data from public hospitals and private licensed hospital/healthcare facilities) for the period 2005/06 to 2011/12.
The rate of sentinel event occurrence across the WA public and private hospital system was 0.16 events per 10,000 separations, or approximately one event every 62,000 separations. This compares with 0.18 sentinel events per 10,000 separations notified in 2010/11 (approximately 1 event every 54,000 separations).
Figure 7 rate per 10,000 Separations of Sentinel event notifications (2005/06 to 2011/12)*
0
1
2
3
4
5
6
7
8
9
10
0.18 0.20 0.47 0.31 0.13 0.18 0.16
2005/06 2006/07 2007/08 2008/09 2009/10 2010/11 2011/12
* Includes sentinel events notified by non hospital organisations.
16
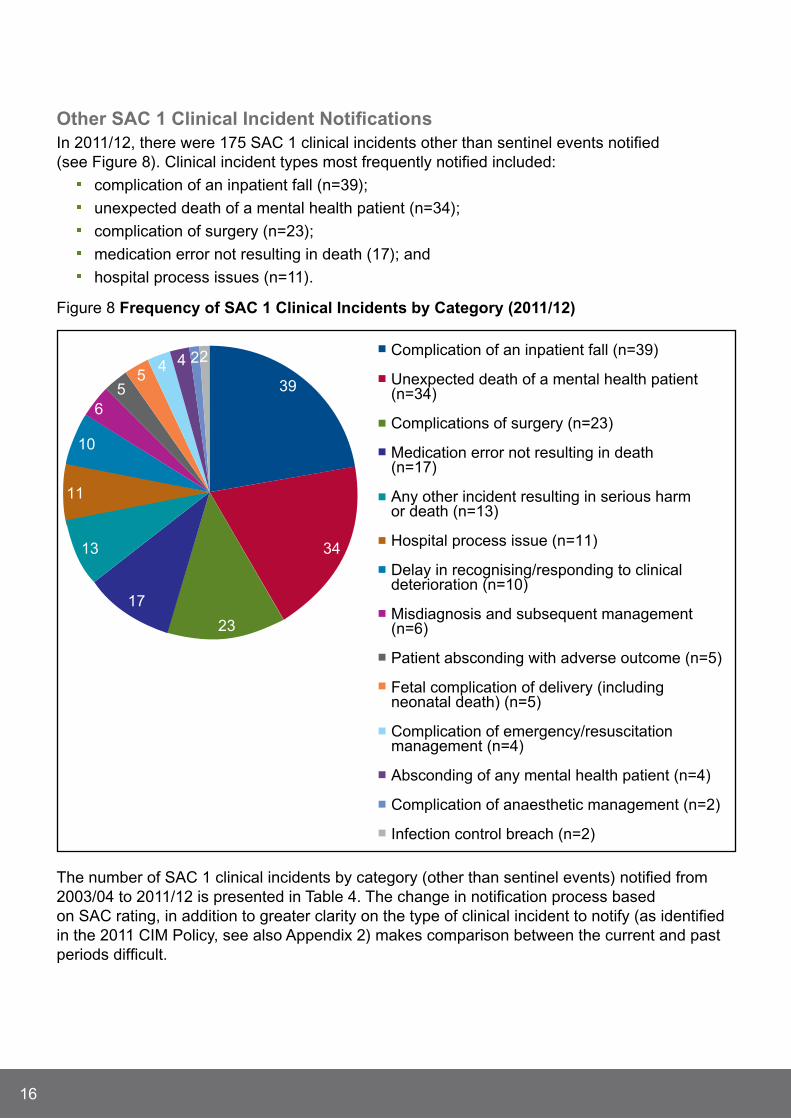
Other SAC 1 Clinical Incident notificationsIn 2011/12, there were 175 SAC 1 clinical incidents other than sentinel events notified (see Figure 8). Clinical incident types most frequently notified included:
complication of an inpatient fall (n=39);
unexpected death of a mental health patient (n=34);
complication of surgery (n=23);
medication error not resulting in death (17); and
hospital process issues (n=11).
Figure 8 Frequency of SAC 1 Clinical Incidents by Category (2011/12)
39
34
23
17
13
11
10
6
55
4 4 22 Complication of an inpatient fall (n=39)
Unexpected death of a mental health patient(n=34)
Complications of surgery (n=23)
Medication error not resulting in death(n=17)
Any other incident resulting in serious harmor death (n=13)
Hospital process issue (n=11)
Delay in recognising/responding to clinicaldeterioration (n=10)
Misdiagnosis and subsequent management(n=6)
Patient absconding with adverse outcome (n=5)
Fetal complication of delivery (includingneonatal death) (n=5)
Complication of emergency/resuscitationmanagement (n=4)
Absconding of any mental health patient (n=4)
Complication of anaesthetic management (n=2)
Infection control breach (n=2)
The number of SAC 1 clinical incidents by category (other than sentinel events) notified from 2003/04 to 2011/12 is presented in Table 4. The change in notification process based on SAC rating, in addition to greater clarity on the type of clinical incident to notify (as identified in the 2011 CIM Policy, see also Appendix 2) makes comparison between the current and past periods difficult.
17
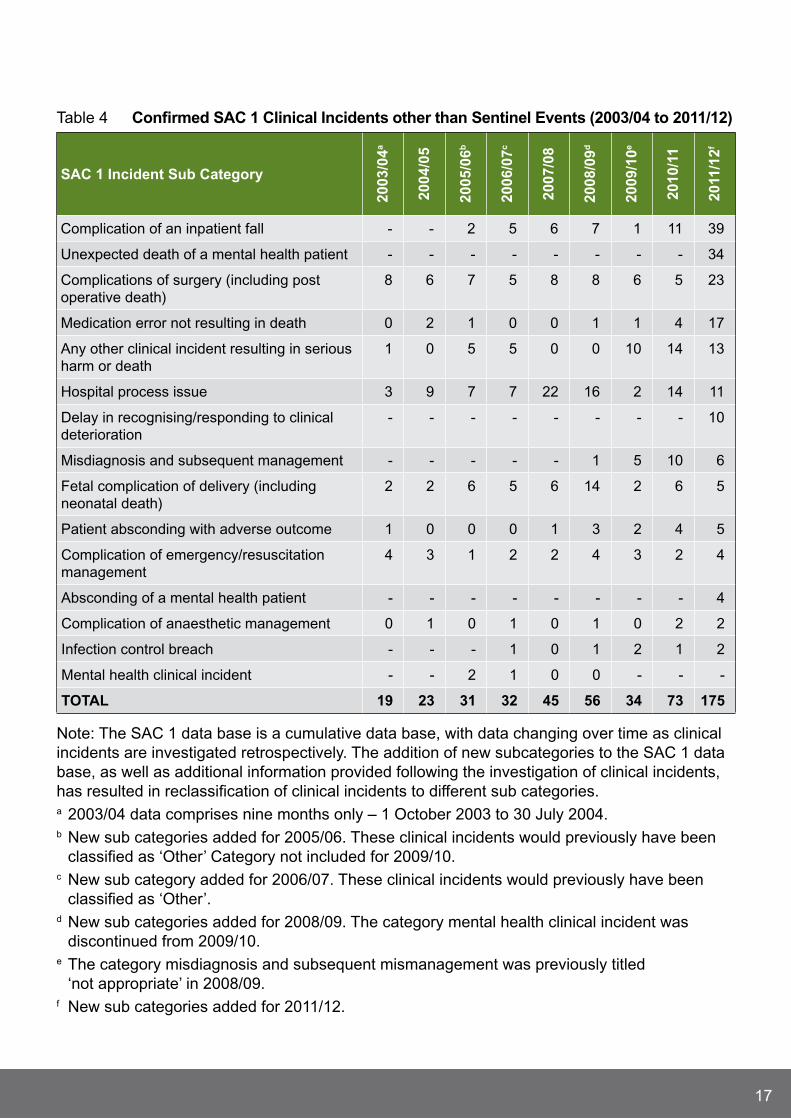
Table 4 Confirmed SAC 1 Clinical Incidents other than Sentinel events (2003/04 to 2011/12)
SAC 1 Incident Sub Category
2003
/04a
2004
/05
2005
/06b
2006
/07c
2007
/08
2008
/09d
2009
/10e
2010
/11
2011
/12f
Complication of an inpatient fall - - 2 5 6 7 1 11 39
Unexpected death of a mental health patient - - - - - - - - 34
Complications of surgery (including post operative death)
8 6 7 5 8 8 6 5 23
Medication error not resulting in death 0 2 1 0 0 1 1 4 17
Any other clinical incident resulting in serious harm or death
1 0 5 5 0 0 10 14 13
Hospital process issue 3 9 7 7 22 16 2 14 11
Delay in recognising/responding to clinical deterioration
- - - - - - - - 10
Misdiagnosis and subsequent management - - - - - 1 5 10 6
Fetal complication of delivery (including neonatal death)
2 2 6 5 6 14 2 6 5
Patient absconding with adverse outcome 1 0 0 0 1 3 2 4 5
Complication of emergency/resuscitation management
4 3 1 2 2 4 3 2 4
Absconding of a mental health patient - - - - - - - - 4
Complication of anaesthetic management 0 1 0 1 0 1 0 2 2
Infection control breach - - - 1 0 1 2 1 2
Mental health clinical incident - - 2 1 0 0 - - -
tOtAl 19 23 31 32 45 56 34 73 175
Note: The SAC 1 data base is a cumulative data base, with data changing over time as clinical incidents are investigated retrospectively. The addition of new subcategories to the SAC 1 data base, as well as additional information provided following the investigation of clinical incidents, has resulted in reclassification of clinical incidents to different sub categories. a 2003/04 data comprises nine months only – 1 October 2003 to 30 july 2004. b New sub categories added for 2005/06. These clinical incidents would previously have been
classified as ‘Other’ Category not included for 2009/10. c New sub category added for 2006/07. These clinical incidents would previously have been
classified as ‘Other’. d New sub categories added for 2008/09. The category mental health clinical incident was
discontinued from 2009/10. e The category misdiagnosis and subsequent mismanagement was previously titled
‘not appropriate’ in 2008/09.f New sub categories added for 2011/12.

18
SAC 1 Contributory Factor AnalysisFigure 9 shows the identified contributory factors of 123 SAC 1 clinical incidents following the completion and submission of investigation reports by notifying public hospitals, private licensed health care facilities and non government organisations (representing 65% of all confirmed incidents in 2011/12).
The most frequently identified contributory factors were those relating to policies, procedures and guidelines, identified in 62% (n=77) of investigated clinical incidents. This was followed by communication issues (61%, n=76), and other issues which included patient factors (for example the patients pre-existing medical condition; 48%, n=60).
Figure 9 Contributory Factors Identified for SAC 1 Clinical Incidents (2011/12)
0
0
0
0
2 (1.6%)
2 (1.6%)
16 (12.9%)
27 (21.8%)
36 (29.0%)
57 (46.0%)
60 (48.4%)
76 (61.3%)
77 (62.1%)
0 10 20 30 40 50 60 70 80 90
External Factors
Human Resources
Inter Hospital Issues
Transportation Issues
Health Information
Physical Environment
Equipment
Safety Mechanisms
Work Environment
Knowledge, Skills,Competence
Other (including patientfactors)
Communication
Policies, Procedures,Guidelines
Number of Clinical Incidents
Contributory factors identified in 2011/12 were compared with those identified in previous reporting periods (2009/10 to 2011/12; see Figure 10). Communication and factors relating to policies, procedures and guidelines were the most frequently identified contributory factors in each reporting period.

19
Figure 10 Contributory Factors Identified for SAC 1 Clinical Incidents (2009/10 to 2011/12)*
7.9% (n=3)
7.9% (n=3)
26.3% (n=10)
18.4% (n=7)
47.4% (n=18)
71.1% (n=27)
81.6% (n=31)
2.1% (=2)
18.8% (n=18)55.3% (n=21)
1.0% (n=1)
7.3% (n=7)
16.7% (n=16)
20.8% (n=20)
42.7% (n=41)
68.8% (n=66)
71.9% (n=69)
n/an/a
n/a
n/a
n/a
n/a
0
0
0
0
0
0
0
0
0
0
1.6% (n=2)
1.6% (n=2)
12.9% (n=16)
21.8% (n=27)
29.0% (n=36)
46.0% (n=57)
48.4% (n=60)
61.3% (n=76)
62.1% (n=77)
0 10 20 30 40 50 60 70 80 90
Translation
External Factors
Human Resources
Inter Hospital Issues
Transportation Issues
Health Information
Physical Environment
Equipment
Safety Mechanisms
Work Environment
Knowledge, Skills,Competence
Other (including patientfactors)
Communication
Policies, Procedures,Guidelines
Per cent
2009/10 2010/11 2011/12
* Due to administrative database modifications data for a number of contributory factors from 2009/11 were not available (n/a) at time of release.

20
Sentinel eventsFifteen sentinel events were notified in 2011/12, a slight decline in notifications compared to 2010/11 (n=17). The 12 investigation reports received (at the time of report) provided valuable information for local and system wide improvements. (Note: Discussion of clinical incidents involving the suicide of a patient while an inpatient or whilst on leave will occur in the mental health section of this report).
Procedure Involving the Wrong Patient or Body Part (Sentinel event Category 1)Similar to clinical incidents of this nature notified in previous reporting periods, the clinical incident investigation into the one notified event identified that the application of the WA Surgical Safety Checklist (SSC) required refinement. The hospital intends to re-engage clinician groups to ensure consistent involvement in the Team –Time – Out process of the SSC.
retained Instruments or Other material (Sentinel event Category 3)The five clinical incidents notified involved the retention of component parts of instruments (n=4) or other material (gauze; n=1).
In two clinical incidents, surgical teams were aware during the operation of a retained instrument component, electing to leave the part in situ. The investigation report of one clinical incident (the other not received at this time) identified that the component was subsequently retrieved, with a cause for the mechanical failure of the equipment undetermined.
Recommendations in relation to the three other clinical incidents concerned the refinement of processes to ensure a complete surgical count was performed (in one instance the inclusion of instrument components in the surgical count), and clarification of the type of equipment used for the procedure. The supplier of equipment utilised in one clinical incident was alerted by the notifying hospital to identify potential improvements in design.
To support system improvements the PSSU also informed the WA Health Product Evaluation Standardisation Committee of any medical device clinical incidents.
Haemolytic Blood transfusion reaction Involving ABO Incompatibility (Sentinel event Category 5)A number of contributory factors were identified following the one notified clinical incident of this type, including communication between clinicians, access to and knowledge of policies on the management of potential transfusion reactions, and work environment/scheduling. Recommendations addressing these factors, updating and improvements to policies, and clarification of roles and responsibilities of service providers were developed to prevent recurrence.
maternal Death or Serious morbidity Associated with labour (Sentinel event Category 7)The investigation report of one clinical incident identified contributory factors relating to interdisciplinary communication, access to equipment, and staff awareness of and adherence to policies and guidelines. Recommendations improving the content of and access to guidelines on post partum haemorrhage and transfusion protocols, and the provision of education to support the policy changes were formulated.

21
Other SAC 1 Clinical IncidentsSixty five per cent of SAC 1 clinical incidents (n=124) comprised one of five clinical incident types:
1. complication of an inpatient fall (n=39);
2. the unexpected death of a mental health patient (n=34);
3. complications of surgery (n=23);
4. medication errors not resulting in death (n=17); and
5. hospital process issues (n=11).
Whilst causative factors and recommendations are unique to each clinical incident, common themes are presented to assist in system wide learning.
Complication of an Inpatient FallAs stated clinical incidents relating to inpatient falls represented the largest SAC 1 category notified in 2011/12 (n=39; 21%). This is a substantial increase in notifications compared to 2010/11 (n=11) and 2009/10 (n=1). One explanation for this increase in notifications can be attributed to the introduction of the SAC ratings, and the identification of complications of an inpatient fall as a mandatory reporting SAC 1 clinical incident category. Previously this falls data were captured in the CIMS database.
Thirty clinical incidents resulted in the sustaining of a fracture, 13 of which involved a fracture to the neck of femur. Of the nine clinical incidents without an identified fracture, injuries to the patients head (lacerations, bruising) occurred on six occasions, with two resulting in a closed head injury. Fourteen clinical incidents involving falls had an outcome of death.
To date, only 29 investigation reports relating to falls clinical incidents have been received. The most common contributory factors identified were other factors (n=20; 69%; which included patient factors), communication (n=16; 55.2%), and policies, procedures and guidelines (n=14; 48.3%; see Figure 11).

22
Figure 11 Contributory Factor Analysis of Falls SAC 1 Clinical Incidents (2011/12)
0
0
0
0
0
0
3 (10.3%)
6 (20.7%)
7 (24.1%)
10 (34.5%)
14 (48.3%)
16 (55.2%)
20 (69.0%)
0 5 10 15 20 25
External Factors
Health Information
Human Resources
Inter Hospital Issues
Physical Environment
Transportation Issues
Safety Mechanisms
Equipment
Work Environment
Knowledge, Skills,Competence
Policies, Procedures,Guidelines
Communication
Other (including patientfactors)
Number of Clinical Incidents
A number of clinical incidents identified the need for improvement in the delivery of information between clinicians on the known falls risk status of patients as well as improved communication with the patient and their family/carer. Improving communication following a patient fall was also identified. Recommendations included engaging patients/carers in falls education and providing timely information on the mobility status of their hospitalised relative.
The use of Falls Risk Assessment/Management Tools were noted in the majority of clinical incidents, however the implementation of all appropriate prevention strategies were identified as deficient in a number of instances. Strategies to increase the awareness of these tools were a common theme.
The development of/or more consistent use of existing post falls management pathways was identified as a recommendation in multiple clinical incidents. This was also referred to in the recommendations to improve communication following a patient fall.
23
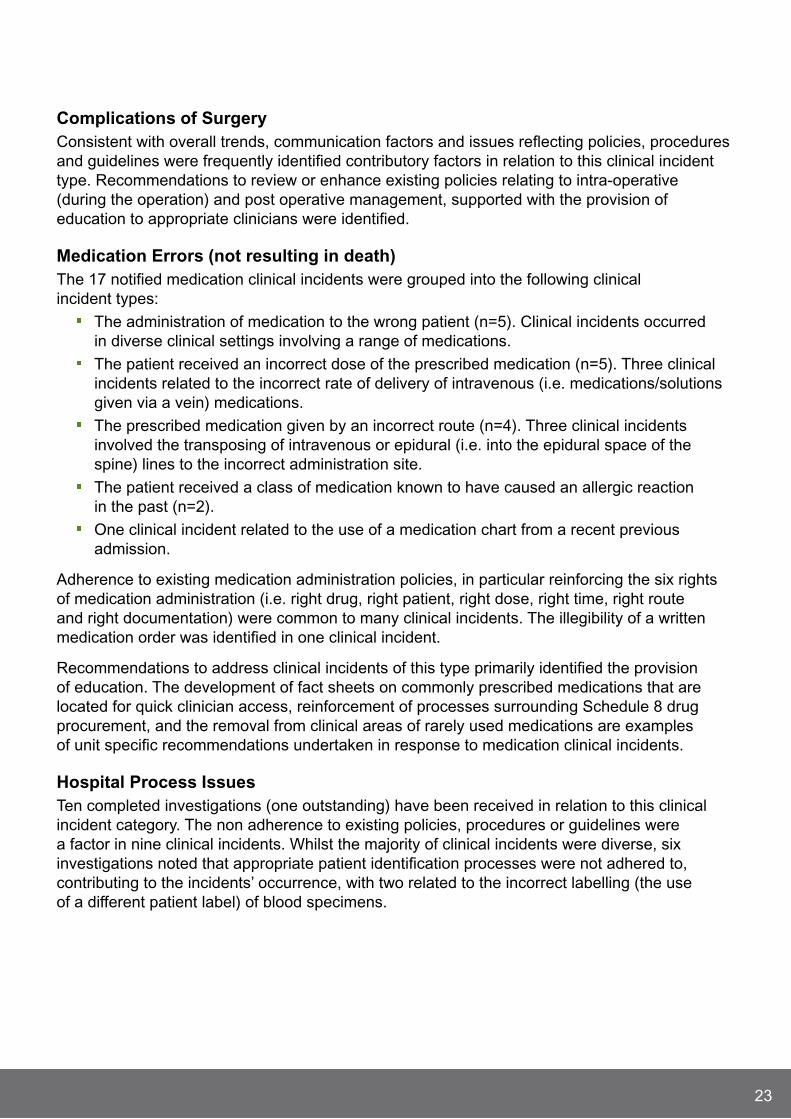
Complications of Surgery Consistent with overall trends, communication factors and issues reflecting policies, procedures and guidelines were frequently identified contributory factors in relation to this clinical incident type. Recommendations to review or enhance existing policies relating to intra-operative (during the operation) and post operative management, supported with the provision of education to appropriate clinicians were identified.
medication errors (not resulting in death)The 17 notified medication clinical incidents were grouped into the following clinical incident types:
The administration of medication to the wrong patient (n=5). Clinical incidents occurred in diverse clinical settings involving a range of medications.
The patient received an incorrect dose of the prescribed medication (n=5). Three clinical incidents related to the incorrect rate of delivery of intravenous (i.e. medications/solutions given via a vein) medications.
The prescribed medication given by an incorrect route (n=4). Three clinical incidents involved the transposing of intravenous or epidural (i.e. into the epidural space of the spine) lines to the incorrect administration site.
The patient received a class of medication known to have caused an allergic reaction in the past (n=2).
One clinical incident related to the use of a medication chart from a recent previous admission.
Adherence to existing medication administration policies, in particular reinforcing the six rights of medication administration (i.e. right drug, right patient, right dose, right time, right route and right documentation) were common to many clinical incidents. The illegibility of a written medication order was identified in one clinical incident.
Recommendations to address clinical incidents of this type primarily identified the provision of education. The development of fact sheets on commonly prescribed medications that are located for quick clinician access, reinforcement of processes surrounding Schedule 8 drug procurement, and the removal from clinical areas of rarely used medications are examples of unit specific recommendations undertaken in response to medication clinical incidents.
Hospital Process IssuesTen completed investigations (one outstanding) have been received in relation to this clinical incident category. The non adherence to existing policies, procedures or guidelines were a factor in nine clinical incidents. Whilst the majority of clinical incidents were diverse, six investigations noted that appropriate patient identification processes were not adhered to, contributing to the incidents’ occurrence, with two related to the incorrect labelling (the use of a different patient label) of blood specimens.
24
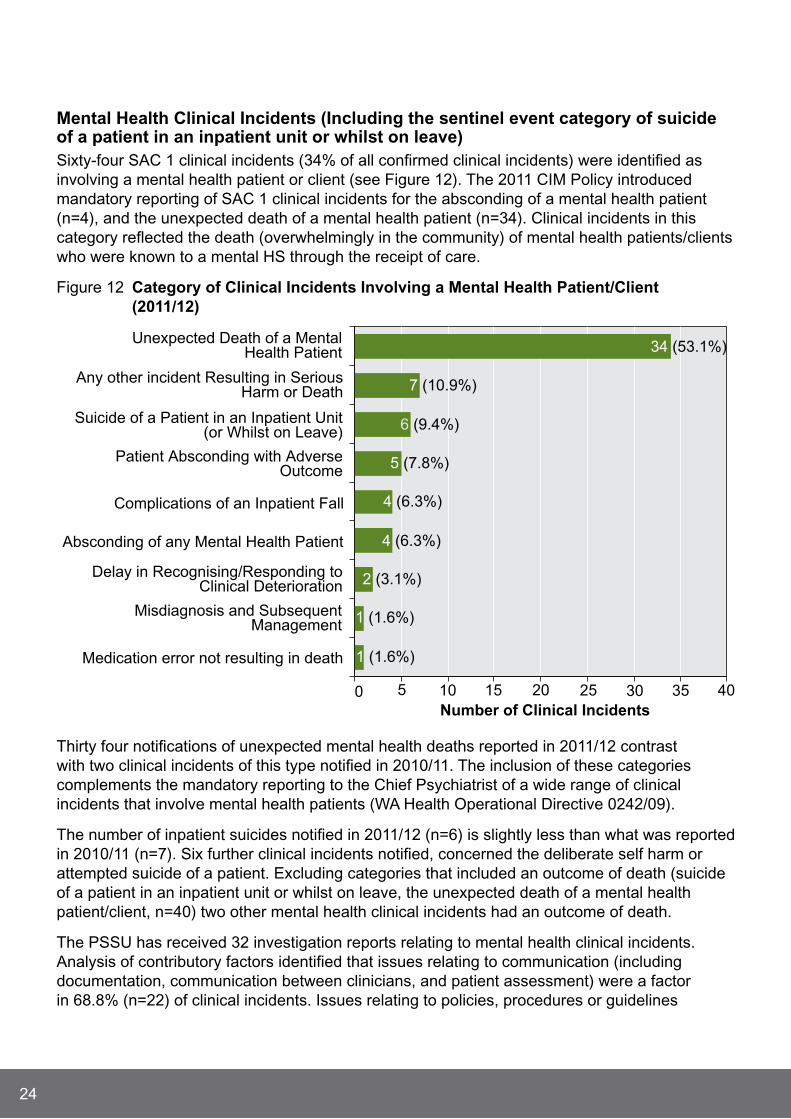
mental Health Clinical Incidents (Including the sentinel event category of suicide of a patient in an inpatient unit or whilst on leave)Sixty-four SAC 1 clinical incidents (34% of all confirmed clinical incidents) were identified as involving a mental health patient or client (see Figure 12). The 2011 CIM Policy introduced mandatory reporting of SAC 1 clinical incidents for the absconding of a mental health patient (n=4), and the unexpected death of a mental health patient (n=34). Clinical incidents in this category reflected the death (overwhelmingly in the community) of mental health patients/clients who were known to a mental HS through the receipt of care.
Figure 12 Category of Clinical Incidents Involving a mental Health Patient/Client (2011/12)
1 (1.6%)
1 (1.6%)
2 (3.1%)
4 (6.3%)
4 (6.3%)
5 (7.8%)
6 (9.4%)
7 (10.9%)
34 (53.1%)
0 5 10 15 20 25 30 35 40
Medication error not resulting in death
Misdiagnosis and SubsequentManagement
Delay in Recognising/Responding toClinical Deterioration
Absconding of any Mental Health Patient
Complications of an Inpatient Fall
Patient Absconding with AdverseOutcome
Suicide of a Patient in an Inpatient Unit(or Whilst on Leave)
Any other incident Resulting in SeriousHarm or Death
Unexpected Death of a MentalHealth Patient
Number of Clinical Incidents
Thirty four notifications of unexpected mental health deaths reported in 2011/12 contrast with two clinical incidents of this type notified in 2010/11. The inclusion of these categories complements the mandatory reporting to the Chief Psychiatrist of a wide range of clinical incidents that involve mental health patients (WA Health Operational Directive 0242/09).
The number of inpatient suicides notified in 2011/12 (n=6) is slightly less than what was reported in 2010/11 (n=7). Six further clinical incidents notified, concerned the deliberate self harm or attempted suicide of a patient. Excluding categories that included an outcome of death (suicide of a patient in an inpatient unit or whilst on leave, the unexpected death of a mental health patient/client, n=40) two other mental health clinical incidents had an outcome of death.
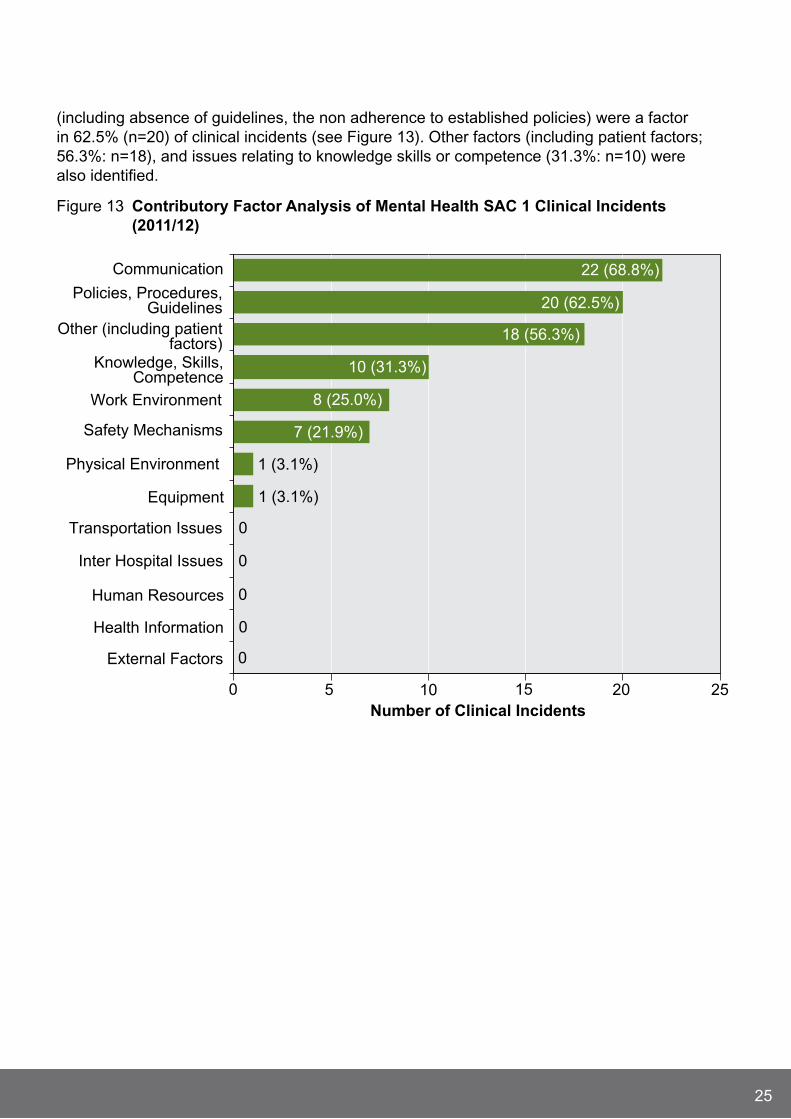
The PSSU has received 32 investigation reports relating to mental health clinical incidents. Analysis of contributory factors identified that issues relating to communication (including documentation, communication between clinicians, and patient assessment) were a factor in 68.8% (n=22) of clinical incidents. Issues relating to policies, procedures or guidelines
25
(including absence of guidelines, the non adherence to established policies) were a factor in 62.5% (n=20) of clinical incidents (see Figure 13). Other factors (including patient factors; 56.3%: n=18), and issues relating to knowledge skills or competence (31.3%: n=10) were also identified.
Figure 13 Contributory Factor Analysis of mental Health SAC 1 Clinical Incidents (2011/12)
0
0
0
0
0
1 (3.1%)
1 (3.1%)
7 (21.9%)
8 (25.0%)
10 (31.3%)
18 (56.3%)
20 (62.5%)
22 (68.8%)
0 5 10 15 20 25
External Factors
Health Information
Human Resources
Inter Hospital Issues
Transportation Issues
Equipment
Physical Environment
Safety Mechanisms
Work Environment
Knowledge, Skills,Competence
Other (including patientfactors)
Policies, Procedures,Guidelines
Communication
Number of Clinical Incidents

26
SAC 1 Case Study
this is a composite case study, using recommendations taken from several SAC 1 clinical incident investigation reports.
An investigation by the mental HS into Mr B’s care identified a number of contributory factors that may have impacted on this outcome including documentation, case and risk management, and communication.
The patient record showed no recent notation about Mr B’s suicidal risk. Documentation did not clearly identify if a risk assessment took place, with a number of incomplete and illegible entries.
No evidence was found of a multi-disciplinary team review or subsequently diagnostic formulations. The medical record showed neither the development of a multi-disciplinary case management plan nor a risk management plan.
The information regarding Mr B’s mental state was not communicated within the mental health team. The Community Mental HS was not provided with a discharge summary from the Acute Psychiatric Unit.
Strategies used by the HS to address these issues included: The Clinical Risk Assessment and Management
(CRAM) policy needed to be reinforced and monitored via audit.
Site guidelines and procedures for monitoring and supervising risk assessment and management plans were developed and implemented.
The case management process was revised and more frequent team meetings were implemented for a formal review of all cases.
The need to eliminate deficient documentation was addressed by staff training on applying existing documentation and reporting procedures. A system for auditing documentation was implemented.
A protocol for clinical handover and discharge was introduced, with education to support its introduction developed to ensure the provision of relevant information.
Mr B was a 42 year old man with a history of major depressive disorder, in addition to documented periods of suicidal ideation.
Mr B first accessed mental HS following a redundancy that led to a period of financial hardship.
For five years his care was managed by a Community Mental Health Clinic, with a well documented record of crisis management.
When Mr B relocated, his care was transferred to another mental health team. A year following relocation his partner contacted the Community Mental Health Centre regarding her concerns about Mr B’s deteriorating mental state.
Mr B was reviewed by the Community Emergency Response Team (CERT) and admitted to an Acute Psychiatric Unit, and was hospitalised for thirteen days.
The day following Mr B’s discharge he re-attended for a scheduled appointment.
A further appointment was made for one week’s time. In the interim Mr B took his own life.

27
The 2011 CIM policy, specifically the introduction of SAC ratings and clarity regarding clinical incidents to be reported as SAC 1, has led to a dramatic increase in notifications, including clinical incident types not captured under the previous sentinel event reporting process.
The inclusion of ‘unexpected death of a mental health patient’, and ‘absconscion of any mental health patient’ as SAC 1 categories will supplement the existing notification of mental health clinical incidents directly to the Office of the Chief Psychiatrist, reinforcing the importance of a clinical incident management policy applicable to all areas of WA Health.
The completed investigation of 65% of clinical incidents notified in 2011/12 has identified that key contributory factors to the occurrence of serious clinical incidents continue to be policies, procedures or guidelines (their adherence to, existence of, or need for modification), and communication between clinicians.
Concomitant with the increase in notification of SAC 1 clinical incidents (and associated investigations) is ensuring that lessons learnt locally are disseminated to a wider system audience. This will be a focus moving into the 2012/13 period.
Key SAC 1 Clinical Incident messages

28
SAC 2 Clinical IncidentsThe category SAC 2 includes all clinical incidents/near misses where moderate harm is/could be specifically caused by health care rather than the patient’s underlying condition or illness.
In 2011/12 there were 5,445 (32%) clinical incidents with a SAC 2 allocation. The PIT for this SAC 2 category are presented in Figure 14.
Findings revealed that behaviour clinical incidents (n=1,324; 24%) were the most frequently reported SAC 2 clinical incident followed by falls clinical incidents (n=1,302; 24%) and clinical incidents resulting in injury (n=956; 18%).
Figure 14 Percentage of PIt by SAC 2 Category (2011/12)*
24%
24%
18%
16%
11%
3%
1%1% 0.5% 0.3%
Behaviour (24%)
Fall (24%)
Injury (18%)
Other (16%)
Medication (11%)
Therapeutic Devices (4%)
Documentation (1%)
Safety or Security (1%)
Nutrition (0.5%)
Blood, Oxygen or Gas (0.3%)
* CIMS clinical incidents include up to 10 months of data, due to a coding/reporting lag.

29
Figure 15 shows the top five PIT, which accounted for 93% (n=5,082) of clinical incidents in this category.
Figure 15 top Five PIt for SAC 2 Clinical Incidents (2011/12)*
1324 (24.3%)
1302 (23.9%)
956 (17.9%)
881 (16.2%)
619 (11.4%)
0 200 400 600 800 1000 1200 1400
Behaviour
Fall
Injury
Other
Medication
Number of Clinical Incidents
* CIMS clinical incidents include up to 10 months of data, due to a coding/reporting lag.
The top five SAC 2 clinical incidents were reviewed to identify the nature of the clinical incidents. For each of the five categories, the three most frequently reported responses are shown in Table 5. Results showed that physical abuse, aggression or assault accounted for 13.9% (n=758) of all SAC 2 clinical incidents followed by no, wrong or delayed procedure, treatment or assessment (n=553; 10.2%).

30
Table 5 top Five PIt by nature of SAC 2 Clinical Incidents (2011/12)*
SAC 2 nature of Clinical Incident (n)* (%)
Behaviour
Physical abuse, aggression or assault
Absconding
Intended self harm
758
184
122
13.9
3.4
2.2
Falls Fall on same level
Transferring from bed, chair, toilet
Falls of unknown origin
327
325
265
6.0
6.0
4.9
Injury Unintended injury from procedure/treatment
Pressure injuries
Result of an impact/collision
311
242
157
5.7
4.4
2.9
Other No, wrong or delayed procedure, treatment or assessment
Other clinical incidents
Hospital acquired infection
553
128
72
10.2
2.4
1.3
Medication Overdose
Omission
Wrong medication, additive or fluid
174
126
93
3.2
2.3
1.7
total 3,837 70.5
* CIMS clinical incidents include up to 10 months of data, due to a coding/reporting lag.
Outcome levels9 for SAC 2 clinical incidents are assigned on completion of a clinical incident investigation. Figure 16 shows that the most frequent outcome level assigned for a SAC 2 clinical incident was Level 5, referring to moderate harm having occurred.
9 Outcome levels range from level 1 to level 8. Levels 1-3 refers to no harm having occurred, level 4 refers to minor harm, level 5-6 refers to moderate harm, level 7 refers to significant harm and level 8 refers to severe harm having occurred.

31
Figure 16 Outcome levels for SAC 2 Clinical Incidents (2011/12)*
2
15
4
368 (6.8%)
2730 (50.1%)
1452 (26.7%)
874 (16.1%)
0 500 1000 1500 2000 2500 3000
Level 1
Level 2
Level 3
Level 4
Level 5
Level 6
Level 7
Number of Clinical Incidents
* CIMS clinical incidents include up to 10 months of data, due to a coding/reporting lag.
SAC 2 Clinical Incident FocusThis section will focus specifically on SAC 2 behaviour and falls clinical incidents as nearly half (n=2,626; 48.2%) of all SAC 2 clinical incidents were captured in these two categories. The majority of SAC 2 behaviour (n=779) and falls (n=679) clinical incidents involved males (see Table 6). The mean age of patients involved in behaviour clinical incidents was 42 years which is considerably younger than for patients who sustained a fall.
Table 6 Demographic Data for SAC 2 Behaviour and Falls Clinical Incidents (2011/12)
Behaviour* % Falls* %
Male 779 60 679 53
Female 508 40 593 47
Age Range 10-108 Yrs SD 22 Yrs 1-108 Yrs SD 21 Yrs
Mean Age 42 Yrs 77 Yrs
*Behaviour clinical incidents missing data n=37; Falls clinical incidents missing data n=30.

32
Communication problems were the most frequently reported staff contributory factors associated with both behaviour and falls clinical incidents (see Figure 17).
Figure 17 Staff Contributory Factors to SAC 2 Behaviour and Falls Clinical Incidents (2011/12)*
0
0
33 (32%)
2 (2%)
15 (14.6%)
14 (13.6%)
22 (21.4%)
2 (2%)
4 (3.9%)
11 (10.7%)
49 (31.4%)
4 (2.6%)
14 (9.0%)
15 (9.6%)
23 (14.8%)
1 (0.6%)
15 (9.6%)
32 (21%)
0 10 20 30 40 50 60
Communication problem
Failure to follow advice/instructions
Failure to follow policy/procedure
Inadequate knowledge/inexperience
Insufficient/inadequate staffing
Medication not reviewed
No PRN medications ordered
Distraction/inattention
Poor teamwork/supervision
Staff Factors Behaviour Staff Factors Falls
Number of Clinical Incidents
*CIMS clinical incidents include up to 10 months of data, due to a coding/reporting lag.
Mental health problems were cited as the main patient contributory factors associated with behaviour clinical incidents while pathophysiological factors with regard to falls clinical incidents were the most frequently reported contributory factor (see Figure 18).

33
Figure 18 Patient Contributory Factors to SAC 2 Behaviour and Falls Clinical Incidents (2011/12)*
0
0
89
11
321
81
176
314
32
45
733
542
110
18 (1.2%)
42 (2.7%)
42 (2.7%)
2 (0.2%)
68 4.5%)
101 (6.6%)
3 (0.2%)
1079 (70.6%)
148 (9.7%)
17 (1.1%)
8 (0.5%)
120 (4.5%)
71 (2.7%)
0 200 400 600 800 1000 1200
Affected by medication
Alcohol/drug intoxication
Confusion/disorientation
CVA/TIA
Dementia
Failure to follow advice/instructions
Language/speech barriers
Mental health related
Pathophysiological factors
Physical impairments
Very ill/frail/debilitated
Unsteady on feet
No/wrong footwear
Patient Factors Behaviour Patient Factors Falls
Number of Clinical Incidents
* CIMS clinical incidents include up to 10 months of data, due to a coding/reporting lag.

34
For SAC 2 behaviour and falls clinical incidents, system contributory factors were not as frequently cited in comparison to staff and patient contributory factors. For falls clinical incidents environmental hazards were the most frequently cited contributory factor while security problems were the main system issue identified for behaviour clinical incidents (see Figure 19).
Figure 19 System Contributory Factors to SAC 2 Behaviour and Falls Clinical Incidents (2011/12)*
0
1 (10%)
2 (20%)
7 (70%)
4 (10%)
39 (90%)
0 10 20 30 40 50
Call bell/paging problem
Environmental Hazard/Hazardous Environment
Security problem
Number of Clinical Incidents
System Factors Behaviour System Factors Falls
* CIMS clinical incidents include up to 10 months of data, due to a coding/reporting lag.

35
SAC 2 Case Studies
SAC 2 Behaviour Case Study
reducing episodes of Seclusion and restraint Project north metropolitan Health Service, mental Health (nmHS mH)Since participating in the Australian Commission’s Beacon Project focusing on the reduction of seclusion and restraint, the NMHS MH have continued their focus on implementing sustainable strategies to further reduce episodes and the length of time spent in seclusion.
Strategies used by the HS to address this issue included:
The establishment of an Area Seclusion & Restraint Committee charged with reviewing data, identifying strategies to further reduce episodes (inclusive of Prevention and Management of Aggression; PMA training), and monitoring compliance to established seclusion policies and procedures.
Promotion of Patient Safety Plans and Post Seclusion Interviews.
Establishment of ‘Comfort Rooms’, ‘Chill out Rooms’ - low stimuli rooms that patients can access.
Each authorised site has an ‘Executive Review of Seclusion Committee’ responsible for reviewing individual seclusion episodes to monitor the effectiveness of procedures and identify additional preventative strategies or performance development requirements.
Prevention and Management of Aggression training with focus on preventative strategies. This training in various forms is mandatory for all staff, including non-clinical staff.
Development of NMHS MH Physical Restraint Policy and Physical Restraint Form which introduces the role of ‘Scribe’. This role monitors technique, position and time in restraint and ensures the patient is not physically compromised. Each authorised HS is required to conduct executive reviews of all restraint episodes.
Promotion of complaints acceptance and management by front-line staff, reducing potential triggers to aggressive behaviour.
The maintenance of a separate ‘Seclusion’ database that populates regular reports of seclusion episodes and length of time in seclusion. Reports are provided to HS weekly and Programme and MH Executive Group monthly.
The establishment and maintenance of executive review of the ‘Seclusion’ database with identified key performance indicators by some sites, which is distributed to clinical areas to assist in informing practice.
As a result of implementing these strategies seclusion rates and total time spent in seclusion, have continued to decline over the last three years.
Mr M is a 28 year man who has been living with schizophrenia for nine years.
Recent non compliance with medications resulted in the exacerbation of his illness and a subsequent admission to hospital.
On several occasions Mr M was found to be aggressive, shouting abuse at patients and staff.
After continually disrupting a therapy session Mr M was asked to leave and became violent shoving a fellow patient and throwing chairs at staff.
Staff were able to de-escalate the situation and encourage the use of the unit’s ‘chill out room’, a strategy identified in Mr M’s Patient Safety Plan as having a calming influence.

36
SAC 2 Fall Case Study
evaluation of the Frequent Faller and Injury reduction Programme (FFIrP) at north metropolitan HS Sir Charles gairdner Hospital (SCgH)
The FFIRP is a multidisciplinary programme designed to prevent high risk patients from having repeat falls during their hospital admission by reviewing and identifying falls risk factors such as: mobility, medications, medical conditions, cognition, elimination, nutrition, sleep patterns, vision problems, environmental factors etc (this list is not exhaustive).
Over the 12 month evaluation period, 67 patients were referred to the FFIRP at SCGH. Patient’s age ranged from 40 years to 99 years. Of those referred to the FFIRP, 87% (n=57) of patients had sustained one or more falls, with the remaining patients identified at high risk of falling. One patient had fallen more than eight times. Ten patients who were referred were unable to be reviewed due to being discharged, time constraints, refusal to participate or had clinically deteriorated.
All remaining patients had a medical history that placed them at high risk of falling and for 82% (n=47) of patients, medications were identified as a falls risk factor.
After a comprehensive patient consultation, specific interventions were then put in place to try and reduce further falls.
Strategies used by the HS to address this issue included: physiotherapy occupational therapy ophthalmology review surveillance dietetic review medication review call bell placed within reach patient/family/carer education using hip and head protectors equipment sensors using suitable footwear.
The FFIRP was found to be successful in preventing falls and fall injuries in 85% (n=49) of patients who did not have a repeat fall whilst in hospital. It was estimated that a fall resulting in a fractured hip cost $25,000 to treat and had an average length of stay of 9 days. Extrapolating these costs/figures to include results from the FFIRP programme, estimates show that $1,225,000 and 441 bed days were potentially saved by preventing further serious falls from occurring in this group of high risk patients.
Mrs j is an 89 year old patient who was admitted to hospital with pneumonia.
Mrs j had mobility issues after sustaining a cerebral vascular accident (stroke) five years previously.
This resulted in Mrs j having left leg weakness which required her to use a walking frame and need assistance when transferring.
On day two of admission, whilst walking to the bathroom, Mrs j slipped and fell but did not sustain a severe injury.
This fall incident resulted in Mrs j being referred to the Frequent Faller and Injury Reduction Programme (FFIRP).

37
Nearly one third (n=5,445; 32%) of clinical incidents that resulted in moderate harm to the patient were categorised a SAC 2 clinical incident.
Behaviour clinical incidents, falls, injury, medication and other clinical incidents were identified as the most frequently reported clinical incidents causing moderate harm to patients.
As such strategies targeting these specific areas should be the focus of future quality improvement projects undertaken locally as well as from a system perspective if patient safety within WA Health is to improve.
Key SAC 2 Clinical Incident messages
38
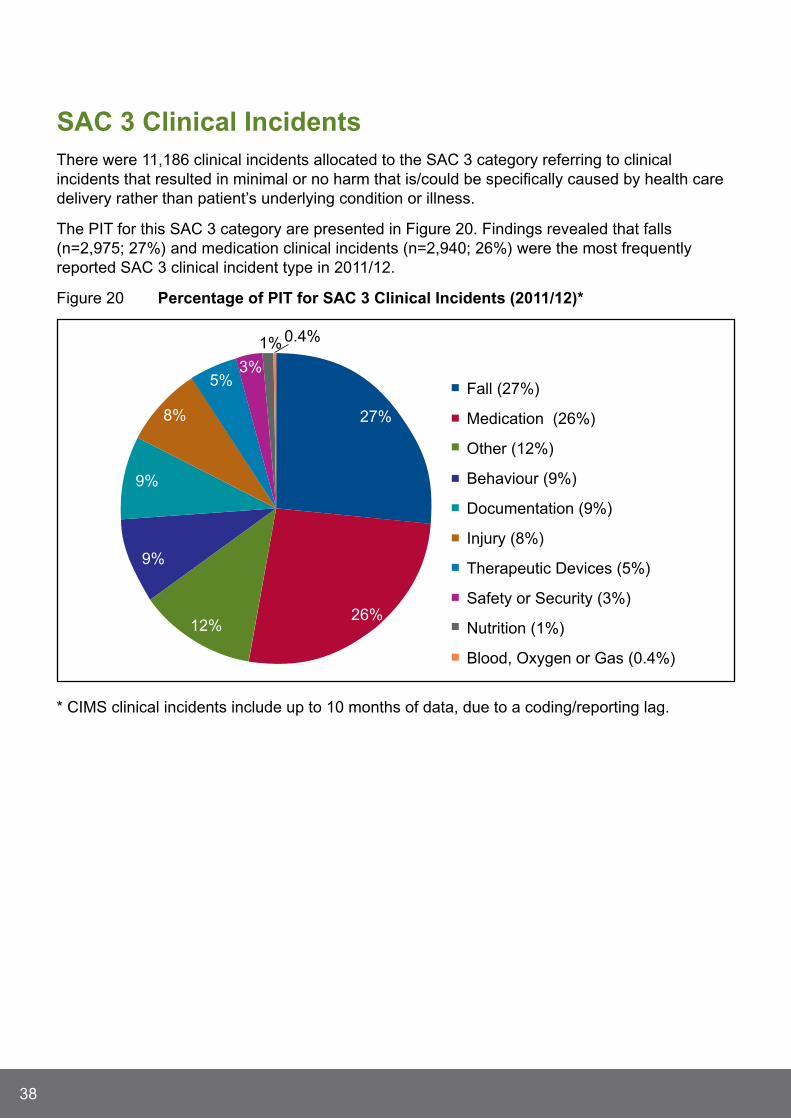
SAC 3 Clinical IncidentsThere were 11,186 clinical incidents allocated to the SAC 3 category referring to clinical incidents that resulted in minimal or no harm that is/could be specifically caused by health care delivery rather than patient’s underlying condition or illness.
The PIT for this SAC 3 category are presented in Figure 20. Findings revealed that falls (n=2,975; 27%) and medication clinical incidents (n=2,940; 26%) were the most frequently reported SAC 3 clinical incident type in 2011/12.
Figure 20 Percentage of PIt for SAC 3 Clinical Incidents (2011/12)*
27%
26%12%
9%
9%
8%
5%3%
1% 0.4%
Fall (27%)
Medication (26%)
Other (12%)
Behaviour (9%)
Documentation (9%)
Injury (8%)
Therapeutic Devices (5%)
Safety or Security (3%)
Nutrition (1%)
Blood, Oxygen or Gas (0.4%)
* CIMS clinical incidents include up to 10 months of data, due to a coding/reporting lag.
39
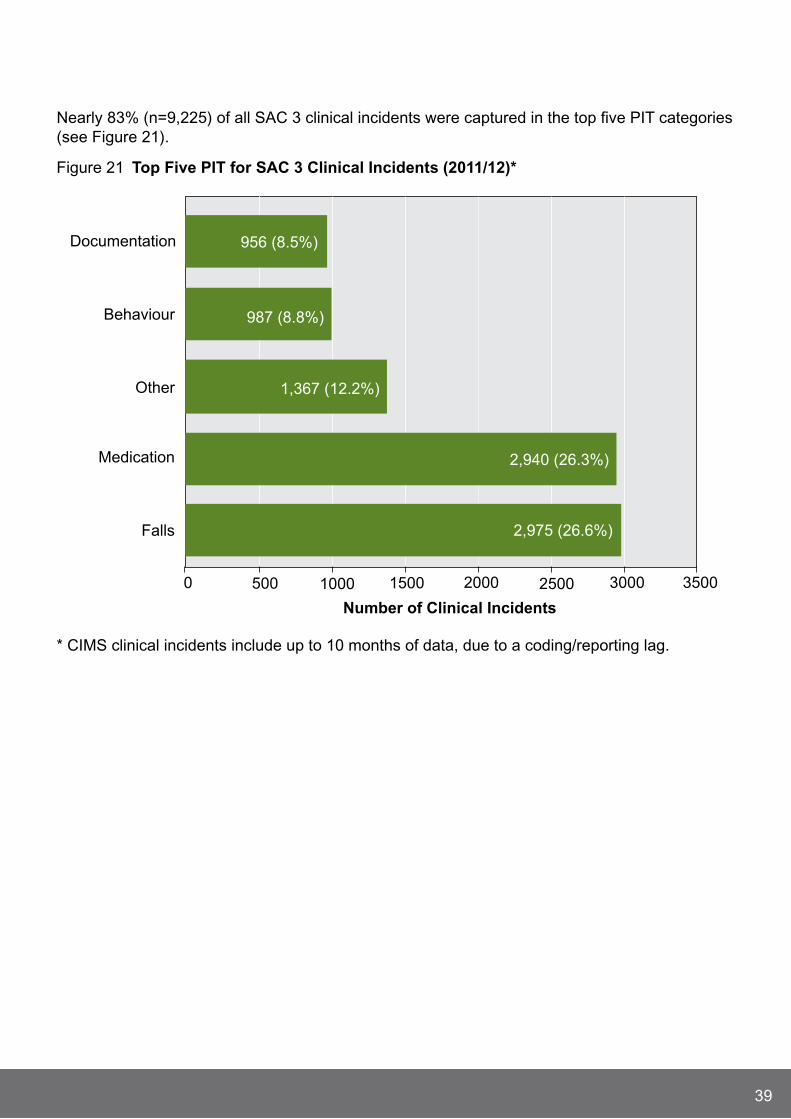
Nearly 83% (n=9,225) of all SAC 3 clinical incidents were captured in the top five PIT categories (see Figure 21).
Figure 21 top Five PIt for SAC 3 Clinical Incidents (2011/12)*
2,975 (26.6%)
2,940 (26.3%)
1,367 (12.2%)
987 (8.8%)
956 (8.5%)
0 500 1000 1500 2000 2500 3000 3500
Falls
Medication
Other
Behaviour
Documentation
Number of Clinical Incidents
* CIMS clinical incidents include up to 10 months of data, due to a coding/reporting lag.
40
The top five SAC 3 clinical incidents were reviewed to identify the nature of the clinical incident. For each of the top five SAC 3 categories, the three most frequently reported responses are shown in Table 7. Falls in general continue to be the most frequently reported clinical incident 15.7% (n=1,750) of SAC 3 clinical incidents, with documentation error, omission of information or incorrect or absent patient identification accounting for 6.7% (n=744) of all documentation clinical incidents.
Table 7 top Five PIt by nature of SAC 3 Clinical Incidents (2011/12)*
SAC3 type nature of Clinical Incident (n)* (%)
Falls On same level
Unknown origin
From bed or cot
738
522
490
6.6
4.7
4.4
Medication Omission
Overdose
Wrong medication, additive or fluid
831
525
437
7.4
4.7
3.9
Other No, wrong or delayed procedure, treatment or assessment
No or delayed admission, inappropriate bed or ward
Other
937
161
140
8.4
1.4
1.3
Behaviour Physical abuse, aggression or assault
Absconding
Intended self harm
520
163
72
4.6
1.5
0.6
Documentation Documentation error or omission
Patient ID incorrect or absent
Filed incorrectly
422
243
79
3.8
2.2
0.7
total 6,280 56.2
* CIMS clinical incidents include up to 10 months of data, due to a coding/reporting lag.
Outcome levels10 for SAC 3 clinical incidents are shown in Figure 22. Seventy seven per cent of SAC 3 outcomes were reported at Level 3 (n=4,352) or Level 4 (n=4,220). However, 18.3% (n=2,048) clinical incidents did have an outcome level of 5 indicating moderate harm.
10 Outcome levels range from level 1 to level 8. Levels 1-3 refers to no harm having occurred, level 4 refers to minor harm, level 5-6 refers to moderate harm, level 7 refers to significant harm and level 8 refers to severe harm having occurred.

41
Figure 22 Outcome levels for SAC 3 Clinical Incidents (2011/12)*
152 (1.4%)
194 (1.7%)
4352 (38.9%)
4220 (37.7%)
2048 (18.3%)
0 1000 2000 3000 4000 5000
Level 1
Level 2
Level 3
Level 4
Level 5
Number of Clinical Incidents
* CIMS clinical incidents include up to 10 months of data, due to a coding/reporting lag. Missing data =220.
SAC 3 Clinical Incident Focus This section will focus specifically on SAC 3 falls and medication clinical incidents which accounted for 53% (n=5,915) of all SAC 3 clinical incidents. Results showed that more males (n=1,511; 52%) were involved in falls compared to females, while more females were involved in medication clinical incidents (n=1,516; 55%; see Table 8).
Patients involved in a fall clinical incident were considerably older (mean age 77 years) than those involved in a medication clinical incident (mean age 64 years).

42
Table 8 Demographic Data for SAC 3 Falls and medication Clinical Incidents (2011/12)
Falls* % medication* %
Male 1,511 52 1,241 45
Female 1,371 48 1,516 55
Age Range 1-108 Yrs SD 22 Yrs 1-108 Yrs SD 21 Yrs
Mean Age 77 Yrs 64 Yrs
*Falls clinical incidents missing gender data n=93; Medication clinical incidents missing gender data n=183.
Medication clinical incidents were the second most frequently reported SAC 3 clinical incident with analgesia, antibiotics and anticoagulant medication cited in 33.6% (n=989) of all medication clinical incidents (see Figure 23).
Figure 23 ten most Frequently Cited medications Involved in SAC 3 medication Clinical Incidents (2011/12)*
71 (5.2%)
36 (2.6%)
139 (10.1%)
42 (3%)
96 (7%)
201 (14.6%)
130 (9.5%)
60 (4.4%)
336 (24.5%)
262 (19%)
0 50 100 150 200 250 300 350
Ophthalmic medication
Med
icati
on
Gro
up
s
Diuretics
Benzodiazepines
Hypoglycaemic agents
Insulin
Anticoagulants
Simple analgesics
Synthetic opioid-likeanalgesics
Opioid analgesics
Antibiotics
Number of Clinical Incidents
* CIMS clinical incidents include up to 10 months of data, due to a coding/reporting lag.

43
When it came to SAC 3 medication clinical incidents, staffing factors were the most frequently reported reason given compared to patient or system contributory factors. Figure 24 shows the main staff contributory factor was failure to follow policy or procedure with communication problems cited as the main contributory factor for SAC 3 falls clinical incidents.
Figure 24 Staff Contributory Factors to SAC 3 Falls and medication Clinical Incidents (2011/12)*
435 (8.8%)79 (28.6%)
283 (5.7%)41 (14.9%)
98 (2%)8 (2.9%)
1909 (38.5%)
120 (2.4%)3 (1.1%)
24 (8.7%)
545 (11%)20 (7.2%)
42 (0.8%)30 (10.9%)
6 (0.1%)
1048 (21.1%)
87 (1.8%)1 (0.4%)
5 (1.8%)
371 (7.5%)64 (23.2%)
13 (0.3%)0
6 (0.1%)1 (0.4%)
0 500 1000 1500 2000
Communication problem
Distraction/inattention
Failure to follow advice/instructions
Failure to follow policy/procedure
Fatigue/stress/unwell
Inadequate knowledge/inexperience
Insufficient/inadequate staffing
Medication not reviewed
Misread/ did not readdocumentation
Multiple staff/poor continuity
Poor teamwork/supervision
Pressure to proceed
Staff did not attend when required
Staff Factors Medication Staff Factors Falls
Number of Clinical Incidents
* CIMS clinical incidents include up to 10 months of data, due to a coding/reporting lag.
However, when it came to SAC 3 fall clinical incidents, patient factors were the most frequently reported reasons compared to other contributory factors. Specifically, physical impairment or pathophysiological factors were cited as the main contributory factors for falls clinical incidents (see Figure 25).

44
Figure 25 Patient Contributory Factors to SAC 3 Falls and medication Clinical Incidents (2011/12)*
0
0
0
0
0
0
147 (2.6%)
20 (0.4%)
500 (9%)
215 (3.9%)
402 (7.2%)
24 (0.4%)
695 (12.5%)
61 (1.1%)
128 (2.3%)
1501 (27%)
1240 (22.3%)
196 (3.5%)
259 (4.7%)
166 (3%)
13 (6.7%)
2 (1%)
15 (7.7%)
16 (8.2%)
4 (2.1%)
28 (14.4%)
111 (57.2%)
5 (2.6%)
0 200 400 600 800 1000 1200 1400 1600
Affected by medication
Alcohol/drug intoxication
Confusion/disoriented
CVA/TIA
Dementia
Distraction/inattention
Failure to follow advice/instructions
Language/speech barriers
Mental health related
Pathophysiological factors
Physical impairments
Unsteady on feet
Very ill/debilitated/deterioration
Wrong/no footwear
Patient Factors Falls Patient Factors Medication
Number of Clinical Incidents
* CIMS clinical incidents include up to 10 months of data, due to a coding/reporting lag.

45
System factors were cited less frequently as a contributory factor for either falls or medication clinical incidents (see Figure 26). Interestingly, environment hazards were the main system contributory factors for both falls and medication clinical incidents.
Figure 26 System Contributory Factors to SAC 3 Falls and medication Clinical Incidents (2011/12)*
9 (7.6%)
108 (90.7%)
2 (1.7%)
2 (29%)
4 (57%)
1 (14.2%)
0 20 40 60 80 100 120
Call bell/paging problem
Environmental hazard/hazardous environment
Security problem
System Factors Falls System Factors Medication
Number of Clinical Incidents
* CIMS clinical incidents include up to 10 months of data, due to a coding/reporting lag.
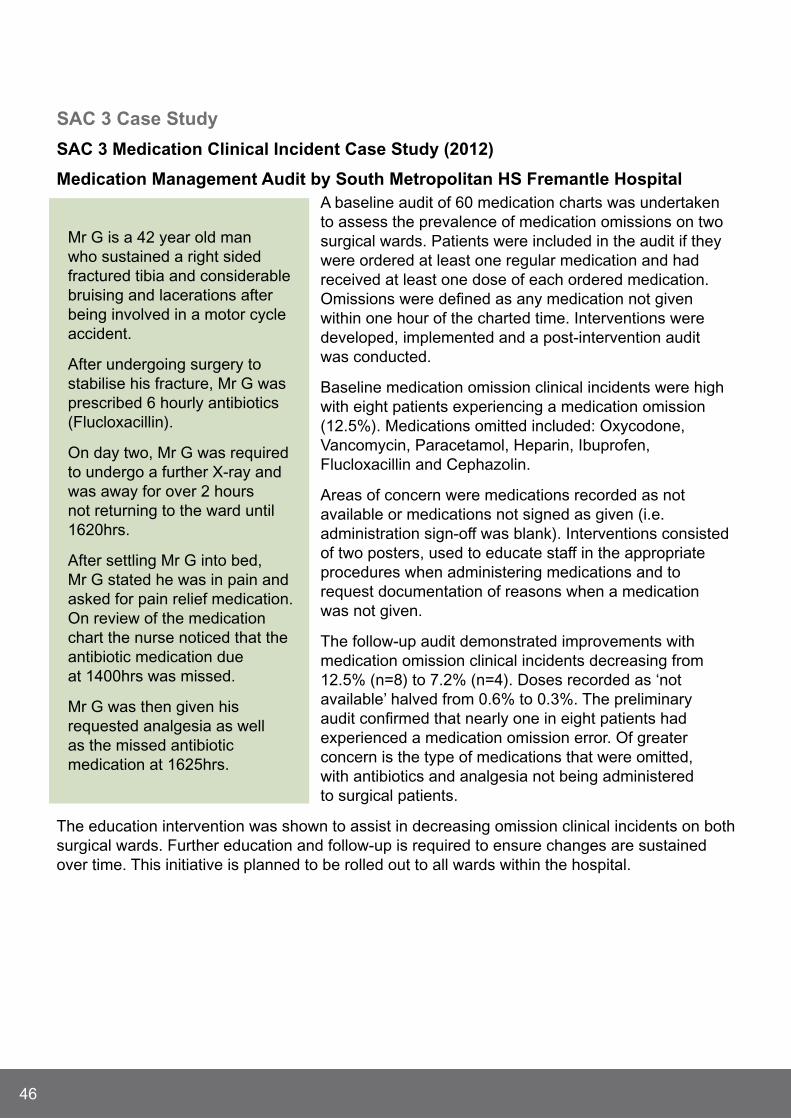
46
SAC 3 Case Study
SAC 3 medication Clinical Incident Case Study (2012)
medication management Audit by South metropolitan HS Fremantle Hospital A baseline audit of 60 medication charts was undertaken to assess the prevalence of medication omissions on two surgical wards. Patients were included in the audit if they were ordered at least one regular medication and had received at least one dose of each ordered medication. Omissions were defined as any medication not given within one hour of the charted time. Interventions were developed, implemented and a post-intervention audit was conducted.
Baseline medication omission clinical incidents were high with eight patients experiencing a medication omission (12.5%). Medications omitted included: Oxycodone, Vancomycin, Paracetamol, Heparin, Ibuprofen, Flucloxacillin and Cephazolin.
Areas of concern were medications recorded as not available or medications not signed as given (i.e. administration sign-off was blank). Interventions consisted of two posters, used to educate staff in the appropriate procedures when administering medications and to request documentation of reasons when a medication was not given.
The follow-up audit demonstrated improvements with medication omission clinical incidents decreasing from 12.5% (n=8) to 7.2% (n=4). Doses recorded as ‘not available’ halved from 0.6% to 0.3%. The preliminary audit confirmed that nearly one in eight patients had experienced a medication omission error. Of greater concern is the type of medications that were omitted, with antibiotics and analgesia not being administered to surgical patients.
The education intervention was shown to assist in decreasing omission clinical incidents on both surgical wards. Further education and follow-up is required to ensure changes are sustained over time. This initiative is planned to be rolled out to all wards within the hospital.
Mr G is a 42 year old man who sustained a right sided fractured tibia and considerable bruising and lacerations after being involved in a motor cycle accident.
After undergoing surgery to stabilise his fracture, Mr G was prescribed 6 hourly antibiotics (Flucloxacillin).
On day two, Mr G was required to undergo a further x-ray and was away for over 2 hours not returning to the ward until 1620hrs.
After settling Mr G into bed, Mr G stated he was in pain and asked for pain relief medication. On review of the medication chart the nurse noticed that the antibiotic medication due at 1400hrs was missed.
Mr G was then given his requested analgesia as well as the missed antibiotic medication at 1625hrs.

47
In 2011/12, the majority (n=11,186; 67%) of clinical incidents categorised as a SAC 3 clinical incidents resulted in no harm or minimal harm to the patient. While it was fortunate that patients weren’t seriously harmed, findings indicate that greater focus must occur to prevent these clinical incidents from even happening.
Patient falls is a complex and complicated issue but WA Health quality improvement projects and system changes (such as the use of fall risk assessments tools) are hugely beneficial by identifying those most at risk and enabling effective falls reduction strategies to be implemented and evaluated.
Medication omissions and overdoses are also frequently mentioned in this SAC 3 category. Strategies directed at reducing these types of clinical incidents have the potential to make a substantial difference to health care delivery within WA Health.
Key SAC 3 Clinical Incident messages

48
Coronial reviewOverviewThe Coronial Liaison Unit (CLU) was established in 2005 to improve communication between WA Health and the Office of the State Coroner. It allocates health related findings from coronial inquests for implementation in hospitals and health services to support the continuous improvement of health care.
Health Services provide advice and comments on coronial findings and an account of actions taken to improve patient safety. This feedback is communicated to the State Coroner in a biannual report.
The CLU continues to work effectively with the Office of the State Coroner to share lessons learned from mortality review to improve future patient care.
Table 9 provides a summary of WA Health activity and response to coronial recommendations for the last three years. Where coronial recommendations propose more than one strategy for improvement, they have been recorded as separate recommendations. Recommendations are not considered completed until they have been implemented in all applicable health services (ongoing recommendations may be partially implemented).
Table 9 Overview of Coronial liaison unit Activity (2009/10 to 2011/12)
2009/10 2010/11 2011/12
Total number of health related coronial inquest findings received by CLU
10 12 11
Total number of health related recommendations (including mental health)a
33 12 42
Number of mental health related recommendations
6 1 14
Number of total health related recommendations completed/closedb
28 6 3
a Health related findings that are within WA Health’s jurisdiction to action (targeted toward Health Services or Department of Health and not external agencies).
b Status as at most recent report to the State Coroner (August 2012).

49
SynopsesThe following synopses are provided for coronial inquests where recommendations have implications for WA Health and where findings have been released between july 2011 and june 2012.
All HS are encouraged to use these summaries to raise awareness of important messages to facilitate continuous quality improvement. All inquests summarised here can be accessed at the WA Health website: www.safetyandquality.health.wa.gov.au/mortality/inquest_finding.cfm
BAlgO Community (October 2011)An inquest was held for the deaths of five young Aboriginal members of the Balgo Community who died between june 2008 and july 2010.
Mr S, died on 17 june 2008 as a result of ligature compression of the neck (hanging), aged 13 years.
Mr N, died on 27 February 2009 as a result of ligature compression injury to the neck (hanging), aged 22 years.
Mr K, died on 27 june 2009 as a result of ligature compression injury to the neck (hanging), aged 19 years.
Mr M, died on 23 April 2009 as a result of ligature compression of the neck (hanging), aged 21 years.
Mr T, died between 29 june 2010 and 24 july 2010 in unascertainable circumstances, aged 18 years.
It has long been recognised that mental health issues are a risk factor for suicide and self-destructive behaviour and in these cases the mental health issues were of significance.
The Coroner found that deaths of Mr S, Mr N, Mr K, and Mr M arose by way of suicide; and that the death of Mr T arose by way of accident.
The Coroner made a number of recommendations, with two health recommendations relating to the treatment of substance abuse and review of facilities for the treatment of adolescents with mental illness in the Kimberley region.
It is clear that WA faces considerable practical difficulties in attempting to provide a comprehensive mental HS to Aboriginal communities throughout the Kimberley region. These issues have been explored in the Telethon Institute for Child Health Research’s Hear Our Voices11 research paper. This research describes the need to develop culturally relevant programs to support people to change their lives, with an urgent focus on young people.
11 Dudgeon, P., Cox, K., D’Anna, D.,Dunkley, C., Hams, K., Kelly, K., et al., (2012). ‘Hear our voices: Community consultations for the development of an empowerment, healing and leadership program for Aboriginal people living in the Kimberley, Western Australia: Final Research Report’, Australian Indigenous Health Bulletin, vol. 12, no. 3, jul 2012 - Sept 2012.

50
mr A (november 2011)Mr A was a 27 year old male who died on 12 October 2007. The deceased suffered from chronic paranoid schizophrenia, complicated by treatment resistance, non-compliance with medication and use of illicit substances and alcohol. At the time of his death, he was admitted as an involuntary patient at Graylands Hospital within the meaning of the Mental Health Act 1996 and was being transferred to a secure ward.
While issues were raised at the inquest in respect of whether the restraint process and methods used were optimal, the Coroner noted that, as a result of his serious mental illness, the deceased was behaving in a manner which required some form of restraint. The Coroner noted that the death was an unexpected result and was unintended on the part of those involved in restraining the deceased.
The Coroner made five recommendations relating to the monitoring of drug and alcohol usage among patients by means of searching; implementing restrictions for access to alcohol and illicit substances for involuntary patients on open wards; and the review of restraint procedures and training programs.
It was determined that the cause of death was consistent with cardiac arrhythmia during restraint. The Coroner found that death occurred by way of misadventure.
mr B (January 2012)Mr B was a 38 year old male who died on 27 April 2008. At the time of his death he was incarcerated at Acacia Prison. The deceased had a known history of polysubstance abuse, self harm and paranoid schizophrenia with fixed delusions. He was found in his cell with deep wounds to his arms during a cell check. Resuscitation efforts failed to revive him.
In the time leading up to his death, the deceased was undergoing mental health treatment but compliance was intermittent. The deceased seemed to respond well to treatment whilst on medication. Periods of medication non-compliance coincided with a decline in mental health which occasionally warranted his admission to the Frankland Centre at Graylands. He was non-compliant with his medication in the 12 days leading up to his death. The Deputy State Coroner made four recommendations relating to the facilities and treatment for incarcerated persons with mental illness.
Death occurred as a result of exsanguination due to penetration of arm veins. The Deputy State Coroner found that death arose by way of suicide.
ms t (march 2012)Ms T was a 63 year old female who died on 14 February 2006 at St john of God Hospital Bunbury. The deceased had been diagnosed with Acute Lymphoblastic Leukaemia (ALL) in early 2004 however, this was revised to the more aggressive and non-curable Prolymphocytic Leukaemia (PLL) in june 2004. The deceased was undergoing treatment at Fremantle Hospital but resided in Bunbury. The deceased was admitted to Bunbury Regional Hospital with a diagnosis of neutropaenic sepsis and died two days later.

51
The Deputy State Coroner noted that during the course of the evidence it became apparent that there were two miscommunications which, when taken together, contributed to the perception of a catastrophic outcome for the deceased. These miscommunications were related to patient education about diagnosis, and obtainability of blood products outside the metropolitan area.
The Coroner made seven recommendations relating to strategies to raise patients’ awareness of their diagnosis and treatment protocols, strategies for the communication of diagnoses to other health practitioners and tools for the ordering of blood products for remote areas.
A post mortem was not carried out, however the Coroner did not dispute the cause of death recorded on the death certificate and found that death arose by way of natural causes.
mr e (march 2012) Mr E was a 25 year old man with an approximate eight year history of illicit drug use and consequent mental health issues, which had deteriorated in the preceding six months prior to death. The deceased presented to Bentley Mental Health Unit the day of his death (31 july 2007) but he left the hospital before being assessed by the psychiatrist. The Armadale Community Emergency Response Team (CERT) and the Police were notified. The Police attended the residence that evening for a welfare check. He was found deceased by his father later that same evening.
The Coroner made seven recommendations relating to the opportunities for further training and development for triage duties in mental health facilities, availability of security staff, defining set criteria and responsibilities for responding to a mental health crisis and communication of policies to staff.
The Coroner determined that death arose by way of suicide. Death was caused by ligature compression of the neck.
miss l (April 2012)Miss L was born prematurely at 35 weeks gestation at Dalwallinu Hospital in the early hours of 20 March 2008. Transfer to an obstetric hospital was attempted but did not occur for a number of reasons. There were no apparent complications from the emergency delivery. Arrangements were made to transfer mother and baby to Northam Hospital, the nearest maternity facility. Observations were undertaken once whilst in the care of Dalwallinu Hospital, which indicated an elevated heart rate and high temperature. These observations were overlooked and no follow up observations were performed. Mother and baby were transferred via volunteer ambulance officers to Northam just after midday on 20 March 2008, where Miss L was found unresponsive upon arrival at Northam two hours later. Despite urgent treatment Miss L died that afternoon.
The Coroner made four recommendations in relation to the auditing of observations and medical notes, raising awareness of the Newborn Emergency Transport Service (NETS) and the induction and ongoing support of visiting medical practitioners.
Miss L died as a result of perinatal Pneumonia in association with untreated meconium aspiration. The Coroner found that death arose by way of misadventure.

52
miss B (April 2012)Miss B was the first born of twin girls, born at King Edward Memorial Hospital on 7 December 2007 and later transferred to Kalgoorlie Hospital for transitional care. At this time, the mother’s mental health deteriorated such that she required involuntary admission to Kalgoorlie Regional Hospital’s Mental Health Unit. The father was soon afterward taken into police custody, and the babies were placed into temporary care with a female relative. The parents later regained physical custody of the children with limited guidance or review from government agencies. Miss B died aged 6 months on 24 june 2008 after she was found unresponsive in bed whilst co-sleeping with her father. She was rushed to Kalgoorlie Hospital by the parents at the time; however attempts to resuscitate her were unsuccessful.
The Coroner made three recommendations, two of which were directed to WA Health. These recommendations related to the development and communication of a coherent message about the known risks of unexpected infant mortality.
At the inquest the pathologist revised earlier findings that found the death was consistent with Sudden Infant Death Syndrome because of continuing improvement of knowledge surrounding the issue of sudden infant deaths and declared that it was no longer appropriate to categorise the death in those terms. The Coroner found that the cause of death was unascertainable, and under the circumstances, made an Open Finding in relation to the manner of the death.
mr A (may 2012)Mr A was a 16 year old male who presented to Northam Regional Hospital following five days of viral symptoms that had become progressively worse. The deceased was seen at triage by a registered nurse who took a brief history and recorded a fever of 39.4 °C before diagnosing gastroenteritis, recommending oral rehydration solution and advising the deceased’s mother to take him home. Mr A was not seen by the doctor on duty at the time. He was found deceased by his mother the following morning, 17 September 2010.
The Coroner recognised that some improvements had been made with regard to triage competency training at the time of the inquest however, made eight further recommendations relating to training and awareness of preceptors, induction and training of staff and the ongoing implementation of the patient administration system.
Mr A died from severe Staphylococcus sepsis as a complication of H1N1 09 influenza A infection. The Coroner found that death arose by way of natural causes.
mr g (may 2012)Mr G was a 52 year old male, incarcerated as a medium security prisoner at Casuarina Prison. The deceased had previously been diagnosed with HIV and later, with a facial basal cell carcinoma, but he generally refused treatment other than for symptomatic relief. He was admitted to Royal Perth Hospital Emergency Department on 16 September 2010 as a result of unstoppable bleeding in his mouth, and remained there until his death on 2 October 2010.
The Coroner recommended that the Department of Health engage with the Department of Corrective Services in the development of “Not for Resuscitation” protocols in the custodial context, consent for the placement of prisoner/patients at end stage illness and facilitating the flow of medical information between agencies.

53
Death occurred as a result of HIV infection complicated by basal and squamous cell carcinoma. The Coroner found that death arose by way of natural causes.
mr l (June 2012)Mr L was a 37 year old male with a long history of mental health issues, and who was, at the time of his death on 15 july 2007, an involuntary patient within the meaning of the Mental Health Act 1996. The deceased died, under sedation, at a regional hospital whilst awaiting evacuation to Perth by the Royal Flying Doctor Service, for treatment at Graylands Hospital.
The Coroner made four recommendations in relation to the recruitment of security staff to aid in the care of agitated mental health patients, recording of the basis for undertaking treatment without consent, limiting sedation and/or restraint in cases where the patient has not provided consent and funding for the Royal Flying Doctor Service. The CLU is currently reviewing these recommendations.
The cause of death was consistent with respiratory arrest in association with medication effect and alcohol intoxication. The Coroner found that death arose by way of misadventure.
Operation lantana (June 2012)An inquest was held for the deaths of five people who had undergone alternative and unproven, cancer therapies and who died in May and july of 2005. The treatment was administered at a Mosman Park residence acting as clinic and coordinated by Dr Helfried Sartori (now known as Abdul-Haqq Sartori). The treatment consisted of a range of substances including caesium, Dimethyl Sulfoxide (an industrial solvent) and Laetrile. Four people commenced IV therapy on 14 May 2005 with the other commencing on 20 May 2005.
Ms M (age 52 years) died on 25 May 2005 as a result of gastro intestinal haemorrhage and metabolic derangement arising out of the administration of a treatment including caesium in a woman with widespread metastatic breast carcinoma.
Ms B (age 68 years) died on 26 May 2005 as a result of caesium induced arrhythmia in a woman with metastatic thyroid carcinoma.
Ms K (age 52 years) died on 27 May 2005 as a result of gastro intestinal haemorrhage and metabolic derangement arising out of the administration of a treatment including caesium in a woman with metastatic colonic carcinoma.
Ms G (age 42 years) died on 28 May 2005 as the result of sepsis arising out of the administration of a treatment including caesium in a woman with metastatic breast carcinoma.
Mr V (age 29 years) died on 1 july 2005 as the result of metastatic Ewing’s carcinoma. The deceased commenced IV therapy on 20 May 2005 and ceased it five days later. The Coroner found that death arose by way of natural causes.
The Coroner made recommendations relating to the restriction of access to caesium salts and the evaluation of information relating to the operation of the Kathi Preston Memorial Health Centre for education purposes. The CLU is currently reviewing these recommendations.

54
Western Australian review of mortalityThe purpose of the Western Australian Review of Mortality (WARM) policy is to reduce preventable deaths by ensuring all inpatient deaths (including deaths in the emergency department setting) are systematically reviewed, and that recommendations arising out of mortality reviews are considered regularly for implementation12 (See Appendix 3).
Private licensed health care facilities13, and HS (on behalf of WA Public hospitals) are required to inform the PSSU of the percentage of deaths where a completed mortality review has occurred, and the percentage of deaths referred for further investigation. Table 10 identified that 93% of inpatient deaths between july 1 and 31 March 2012 had a mortality review completed within 6 months of date of death. Of this group, 1.2% were referred for further investigation (to identify whether the death was potentially preventable).
Table 10 Western Australian review of mortality – WArm Indicators*
Indicator Outcome
Percentage of deaths with a completed review within six months of the date of death (reflecting deaths that occurred between 1/7/2011 - 31/3/2012)
93%
Percentage of deaths referred for further investigation 1.2%
*Data comprises public and private hospitals. A completed review includes a death:a) where no further investigation is required; b) with a completed WAASM audit; and c) notification of a sentinel event following confirmation of a preventable death.
Data from joondalup Health Campus reflects 01/07/2011 to 31/12/2011.
To provide another measure of the outcome of mortality review, hospitals/health services and non government agencies are also required to indicate if a death notified as a SAC 1 clinical incident occurred as a result of investigation via a mortality review process. In the 2011/2012 period, 70 SAC 1 clinical incidents reflected a clinical incident with an outcome of inpatient (or emergency department) death. Three notifications in this group occurred following a mortality review (4.3%). Data provided by the WARM and CIM processes is encouraging, with greater than 90% of inpatient deaths subject to a mortality review. The low percentage of SAC 1 clinical incidents (those involving inpatients with an outcome of death) notified via a WARM process is suggestive that hospital systems are proactive in the identification and prompt notification, of clinical incidents (with an outcome of death) that may be preventable.
12 Western Australian Review of Mortality: Policy and Guidelines for Reviewing of Inpatient Deaths. (2008: Operational Directive 0149/08).
13 More information about licensed facilities can be found at: http://www.public.health.wa.gov.au/2/1350/2/licensing_of_private_healthcare_facilities.pm

55
Western Australian Audit of Surgical mortalityThe Western Australian Audit of Surgical Mortality (WAASM) is an external, independent peer review of surgically related deaths. The WAASM is managed by the Royal Australasian College of Surgeons and funded by the WA Department of Health. The WAASM has been operating since 2002.
The WARM Policy 2008 outlines three investigative pathways to undertake mortality review; one of which is the WAASM. All deaths that occur whilst the patient is under the care of a surgeon are currently notified to the WAASM office. Participation in the WAASM fulfils mortality review obligations mandated by the WARM Policy 2008 (OD 0149/08).
The Royal Australasian College of Surgeons’ Continuing Professional Development (CPD) Manual mandates surgeons’ participation in the Australian and New Zealand Audit of Surgical Mortality if a surgeon is “in operative based practice, has a surgical death and an audit of surgical mortality is available in the surgeon’s hospital”.14 Non-participation jeopardises a surgeon’s registration with the Medical Board of Australia.15
All deaths that occur in WA hospitals (including private hospitals), where the patient was under the care of a surgeon, are audited. In 2011, 577 deaths were notified from 44 hospitals. Surgeons are sent a proforma to complete; and, are asked to identify when there has been an area for consideration16, an area of concern17 or an adverse event. Once returned, the case is de-identified and sent to a peer surgeon at a different hospital for review (first-line assessment). Second-line assessment is the process whereby cases are reviewed by a second peer surgeon along with the patient’s medical notes. Cases are only referred for second-line assessment if an area of concern or adverse event has been identified, or where there is the potential for lessons to be learned. In 2011, 20% (n=57) of completed cases were referred for second-line assessment. See Appendix 4 for an overview of the audit process.
For the WAASM, an adverse event is defined as “an unintended injury caused by medical management, rather than by the disease process, which is sufficiently serious to: lead to prolonged hospitalisation; lead to temporary or permanent impairment or disability of the patient at the time of discharge; or, contribute to, or cause death”. The WAASM Annual Report 2012 identified 12 adverse events that caused death in 2010 (two of these were considered preventable) and six adverse events that caused death in 201118 (one of these was considered preventable; see Table 11).
Table 11 number of Ae Causing Death that were Considered Definitely Preventable (2002–2011)*
2002 2003 2004 2005 2006 2007 2008 2009 2010 2011
5 2 3 7 3 4 4 3 2 1
1% 1% 1% 1% 1% 1% 1% 1% 1% <1%
* Includes cases complete as at March 1, 2012. Terminal cases are excluded.14 http://www.surgeons.org/for-health-professionals/audits-and-surgical-research/anzasm/ 15 Royal Australasian College of Surgeons (2012) WA Audit of Surgical Mortality (WAASM) Annual Report 2012.16 Area of consideration = clinician believes an area of care could have been improved17 Area of concern = clinician believes an area of care should have been better.18 Partial analysis – 2011 data includes that for which the audit process was complete at March 1, 2012.

56
In 2011, six adverse events causing death were identified, including deep vein thrombosis (DVT) related events (n=2), aspiration pneumonia, injury caused by fall, cardiovascular accident and missed diagnosis (all n=1; see Table 12).
Table 12 Adverse events Causing Death for 2010–2011 (includes events that were not considered preventable)*
Adverse event 2010 2011
Intra- or post-operative bleeding during or following open surgery 1 -
Aspiration pneumonia - 1
Deep Vein Thrombosis related events (including failure to use DVT prophylaxis)
- 2
Intra-operative bleeding during laparoscopic operation 1 -
Reaction to medication 1 -
Delay to surgery 1 -
Injury caused by fall in hospital 1 1
Pulmonary embolism 1 -
Post operative pancreatitis 1 -
Septicaemia (cause unspecified) 1 -
Anastomotic leak 2 -
Other, equipment related complication 1 -
Communication issues 1 -
Cardiovascular Accident (CVA) following open surgery - 1
Missed diagnosis - 1
Total 12 6
*2011 data includes those cases that were complete at 1 March 2012.
The most frequently reported AE by surgeon assessors over the entire audit period (2002-2011) were: anastomotic leaks (n=33), complication of surgery (n=28), bleeding associated with the operation (n=16), and infection (n=16; see Table 13).
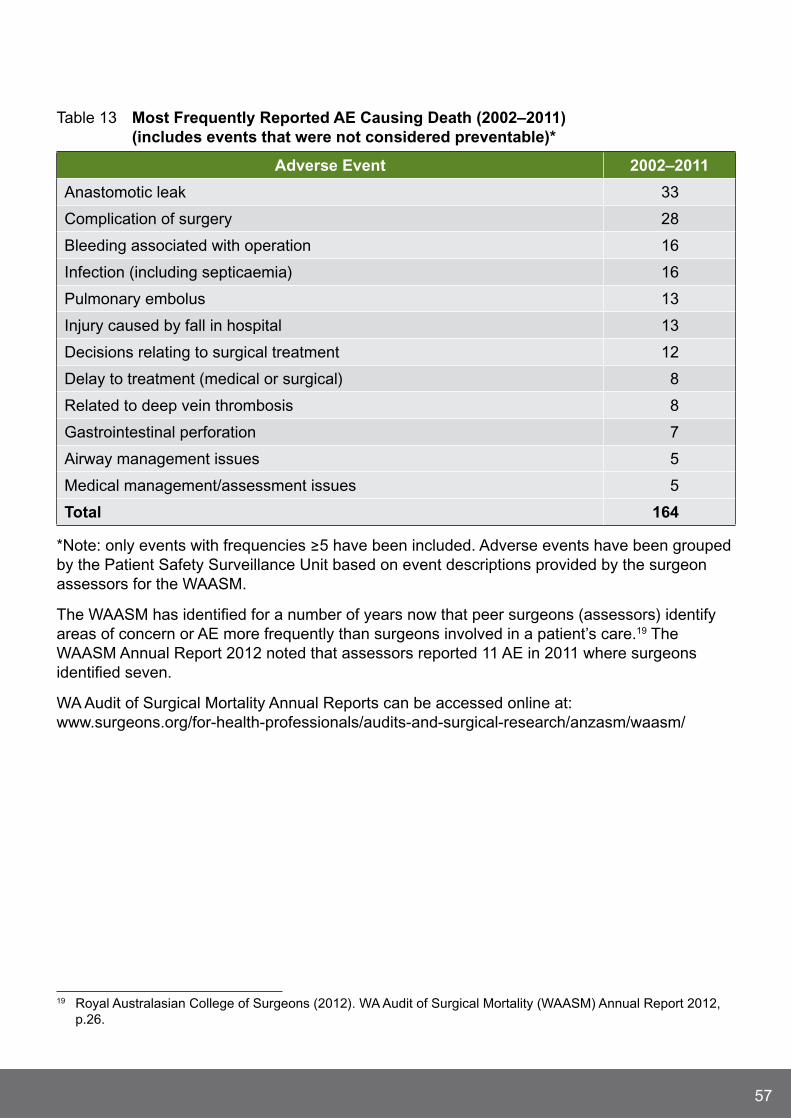
57
Table 13 most Frequently reported Ae Causing Death (2002–2011) (includes events that were not considered preventable)*
Adverse event 2002–2011
Anastomotic leak 33
Complication of surgery 28
Bleeding associated with operation 16
Infection (including septicaemia) 16
Pulmonary embolus 13
Injury caused by fall in hospital 13
Decisions relating to surgical treatment 12
Delay to treatment (medical or surgical) 8
Related to deep vein thrombosis 8
Gastrointestinal perforation 7
Airway management issues 5
Medical management/assessment issues 5
total 164
*Note: only events with frequencies ≥5 have been included. Adverse events have been grouped by the Patient Safety Surveillance Unit based on event descriptions provided by the surgeon assessors for the WAASM.
The WAASM has identified for a number of years now that peer surgeons (assessors) identify areas of concern or AE more frequently than surgeons involved in a patient’s care.19 The WAASM Annual Report 2012 noted that assessors reported 11 AE in 2011 where surgeons identified seven.
WA Audit of Surgical Mortality Annual Reports can be accessed online at: www.surgeons.org/for-health-professionals/audits-and-surgical-research/anzasm/waasm/
19 Royal Australasian College of Surgeons (2012). WA Audit of Surgical Mortality (WAASM) Annual Report 2012, p.26.

58
Complaints reviewWith the development of the National Safety and Quality Health Service Standards, there is an increased focus on the use of complaints data in the quality improvement cycle. Engaging with the consumer in the complaints process enables HS (including public patients at Peel Health Campus and joondalup Health Campus) to recognise and understand areas for improvement from a consumer’s perspective.
While complaints data is an important aspect of the quality improvement cycle, it is necessary to point out that not all complaints categories are relevant to the examination of a clinical incident. From those categories defined in the WA Complaints Management Policy, this report will only focus on ‘Quality of Clinical Care’ complaints. Nevertheless, these complaints should not be interpreted as an indication that a clinical incident has indeed occurred.
The following data was provided by:
North Metropolitan HS – King Edward Memorial Hospital, Osborne Park Hospital, Public Health and Ambulatory Care, Sir Charles Gairdner Hospital, Swan Kalamunda HS, North Metropolitan HS Mental Health;
South Metropolitan HS – Armadale HS, Bentley HS, Fremantle Hospital and HS, Rockingham General Hospital, Royal Perth Hospital;
Child and Adolescent HS – Princess Margaret Hospital;
WA Country HS – Goldfields, Great Southern, Kimberley, Midwest, Pilbara, South West and Wheatbelt regions;
joondalup Health Campus and Peel Health Campus (public patients);
Dental HS; and
Breastscreen WA.
For the purposes of this section, reference to health complaints excludes those pertaining to mental HS, as these will be discussed separately.

59
quality of Clinical CareA total of 1,680 health complaint issues relating to the quality of clinical care were reported by consumers throughout 2011/12, which constituted 30.6% of the total 5,486 health complaint issues. The most frequently reported issues under the ‘Quality of Clinical Care’ category related to: inadequate treatment or therapy (n=507; 9.2%), inadequate assessment (n=285; 5.2%) and discharge or transfer arrangements (n=217; 4.0%; see Figure 27).
Figure 27 Health Complaint Issues relating to ‘quality of Clinical Care’ (2011/12)*
534 (9.3%)
293 (5.1%)
217 (3.8%)
184 (3.2%)
158 (2.8%)
114 (2.0%)
93 (1.6%)
43 (0.7%)
37 (0.6%)
32 (0.6%)
30 (0.5%)
22 (0.4%)
0 100 200 300 400 500 600
Inadequate treatment/therapy
Inadequate assessment
Discharge or transfer arrangements
Poor co-ordination of treatment
Pain issues
Medication issues
Failure to provide safe environment
Inadequate infection control
Post surgery complications
Patient’s test results not followed up
Post procedure complications
Refusal to refer or assist to obtaina second opinion
Number of Clinical Incidents
*Percentages relate to total health complaint issues.
In relation to mental health complaints, a total of 194 mental health complaint issues relating to the quality of clinical care were reported by consumers throughout 2011/12, which constituted 28.4% of the total 684 mental health complaint issues. The most frequently reported issues under the ‘Quality of Clinical Care’ category related to: inadequate treatment or therapy (n=59; 8.6%), medication issues (n=50; 7.3%), and inadequate assessment (n=26; 3.8%; see Figure 28).

60
Figure 28 mental Health Complaint Issues relating to ‘quality of Clinical Care’ (2011/12)*
0
0
59 (8.6%)
50 (7.3%)
26 (3.8%)
23 (3.4%)
20 (2.9%)
13 (1.9%)
2 (0.3%)
1 (0.1%)
0
0
0 10 20 30 40 50 60 70
Inadequate treatment/therapy
Medication Issues
Inadequate assessment
Failure to provide safeenvironment
Discharge or transferarrangements
Poor co-ordinationof treatment
Refusal to refer or assistto obtain a second opinion
Patient’s test resultsnot followed up
Pain Issues
Inadequate infection control
Post surgery complications
Post procedure complications
Number of Clinical Incidents
* Percentages related to total mental health complaint issues.

61
Future FocusWA Health has moved into a new era with the introduction of an integrated clinical incident management report. This integration provides a comprehensive overview of the types of clinical incidents, mortality review and complaint issues that require greater focus, if further improvements in patient safety are to be achieved.
Findings have revealed that WA Health is providing exceptional and safe health care as demonstrated by the very low rate reported for the more serious SAC 1 clinical incidents in 2011/12 (0.1 per 1,000 bed days). Further supporting this statement is the low overall rate of clinical incidents (9.3 per 1,000 bed days) reported in 2011/12. Unfortunately, it is not currently possible to benchmark clinical incidents and in particular SAC 1 clinical incidents with other States primarily due to the different definitions used with clinical incident reporting. Specifically, SAC ratings used by Queensland Health20 defines SAC 1 clinical incidents as those “likely to cause permanent harm or death” while the New South Wales (NSW) Health Department21 and the South Australian Health Department define SAC 1 clinical incidents as resulting in “extreme risk”. Victoria does not use SAC but utilises a different rating system known as the “Incident Severity Rating” which consists of four score categories derived from a response to three consequence descriptor categories. For these reasons, WA Health will continue to undertake the analysis of WA clinical incident trends as the basis for identifying both improvements and challenges within the system.
With the exception of SAC 1 clinical incidents which require mandatory reporting, CIM in general is a voluntary reporting system which has been shown to be sensitive to changes within the health system. For example, noticeable decreases in clinical incident notifications were observed initially after the expiration of the Commonwealth Qualified Privilege Scheme in june 2011. While clinical incident reporting has tracked back to similar levels observed prior to june 2011, the voluntary nature of clinical incident reporting remains a considerable limitation.
At a national level these limitations with regard to the incompatibility of patient safety data are being addressed through the development of a National Patient Safety Measurement Model led by the Australian Commission of Safety and Quality in Health Care. The National Patient Safety Measurement Model proposes to:
“Monitor core, hospital-based outcome indicators with audits of significant variance;
Monitor adverse event trends from coded, admitted patient datasets consisting of hospital acquired diagnoses;
Conduct surveys of patient hospital experience;
Structured analyses of selected sets of incident types; and
Develop standards.”22
20 Patient Safety: From learning to action 2012. Fifth Queensland Health report on clinical incidents and sentinel events in the Queensland public health system 2009/10 and 2010/11. Available at: www.health.qld.gov.au/chi/psq/
21 Clinical Incident Management in the NSW Public Health System: Looking, Learning, Acting january-june 2010.22 Wakefield, j., jorm, C. 2009. Patient Safety- A balanced measurement framework. Australian Health
Review.33(3): 382-389.

62
Currently, WA Health is exploring the ability of local hospital morbidity data sets to identify adverse events. One such project is reviewing readmissions to hospital due to a venous-thrombo-embolism event following certain surgical procedures. This work will assist greatly in the eventual preparation/transition to the National Patient Safety Measurement Model.
Furthermore in 2011, the National Safety and Quality Health Service (NSQHS) Standards were endorsed by the Ministers of Health. These 10 standards provide a quality assurance framework to ensure that minimum standards in patient safety are in place across Australia. The ten NSQHS Standards include:
1 Governance for safety and quality in HS organisations;
2 Partnering with consumers;
3 Preventing and controlling health care associated infections;
4 Medication safety;
5 Patient identification and procedure matching;
6 Clinical handover;
7 Blood and blood products;
8 Preventing and managing pressure injuries;
9 Recognising and responding to clinical deterioration; and
10 Preventing falls and harm from falls.23
While the development of the National Patient Safety Measurement Model is to be commended, it is vital that local patient safety data systems are also scrutinised to enable the capture and provision of more detailed and useful data. Specifically, the health data that is currently captured needs to be reviewed to ensure that the information still meets the needs of the health system and is sufficient enough to ascertain the aetiology of clinical incidents and thereby enhance the analysis of clinical incidents.24
Additionally, the utilisation of clinical incident data is core to improving patient safety by ensuring that WA Health produces reports that clearly identify the most significant clinical incidents experienced by our patients. It is only then that appropriate projects/programs can be implemented to tackle these problems and ensure that patient care is made safer.
In order to achieve further reductions in clinical incidents and thereby continue to improve patient safety, WA Health strives to learn from the errors that have occurred. This is evident as demonstrated by the SAC 1 program, which requires the mandatory investigation and analysis of all clinical incidents that result in serious harm or death as well as the investigation, implementation and evaluation of identified recommendations.
23 ACSQHS. National Safety and Quality Health Service Standards. 2011.24 Thomas, M., Schultz, T., Hannaford, N., Runciman, W. 2011. Mappings the limits of patient safety reporting
systems in health care- What lessons can we actually learn? Medical journal of Australia. 194(12): 635-639.

63
A further strategy to enhance patient safety is to focus quality improvement efforts in areas of greatest concern. This integrated annual report has highlighted several areas where improvements are required. These areas include the targeting of quality improvement programs to address:
falls;
the unexpected death of a mental health patient;
complications of surgery;
physical abuse, aggression or assault;
unintended injury from procedures or treatments;
pressure injuries;
medication overdoses and medication omissions;
documentation issues; and
sources of complaints relating to quality of clinical care, communication, rights, respect and dignity, access and corporate services.
Local improvements coupled with the development of a national model will greatly enrich patient safety by utilising a more comprehensive approach to the monitoring of clinical incidents. Specifically, this national model will use multiple datasets and a variety of data sources to measure patient safety and thereby present a more balanced and standardised focus to achieving patient safety within health care delivery.
A fundamental driver in achieving and sustaining quality improvements in patient safety is strong leadership at all levels within WA Health. This leadership is vital if improvements in health care delivery are to be sustained over time. WA Health is committed to fostering and developing clinical leadership as demonstrated by numerous leadership programs and master classes that are available to staff. By continuing to invest in leadership programs and by providing opportunities for professional development, WA Health is building critical leadership mass within the organisation. This type of investment has been shown to translate into reduced clinical incidents and improved patient safety outcomes, as clinical leaders support and champion the significant benefits of quality improvement.25,26
If patient safety is to continue to improve then organisational resistance must continue to be challenged. This report has highlighted that communication problems and failure to follow policy and procedures are dominant factors contributing to the occurrence of clinical incidents. WA Health continues to develop and implement programs to address these types of patient safety issues. One such patient safety program is to do with improving clinical handover, some examples of clinical handover projects include the:
Development of a clinical handover policy;
Implementation of standardised communication briefing techniques and tools such as iSoBar;
Implementation of clinical handover symposiums;
25 Leonard, M., Graham, S., and Bonacum, D. (2004). The human factor: the critical importance of effective teamwork and communication in providing safe care. Qual Saf Health Care, 13 Suppl 1: p. i85-90.
26 Huis, A., Schoonhoven, L., Grol, R., Donders, R., Hulscher, M., van Achterberg, T. (2012). Impact of a team and leaders directed strategy to improve nurses’ adherence to hand hygiene guidelines: A cluster randomised trial. International journal of Nursing Studies. Available on line. Viewed 17 September 2012.

64
Establishment of a clinical handover network; and
Development of clinical hand over resource and education portals.
It is also acknowledged that the pressures of working in a dynamic clinical environment sometimes cause staff to struggle with adopting new health care practices that are current and evidence based. However, effective communication combined with strong leadership can ensure that staff understand the reasons for change and are provided with the necessary support to adopt safer practices.
Demand for health care services in WA continues to rise each year, with episodes of care increasing from 467,237 in 2010/11 to 533,410 in 2011/12. This increased demand has enormous implications on the provision of safe and high quality health care. As such WA Health continues to support and encourage all aspects of clinical incident management from the notification, investigation and implementation of clinical incident recommendations through to the review and analysis of data both locally and nationally, to ensure that improvements in health care delivery continue to be achieved.
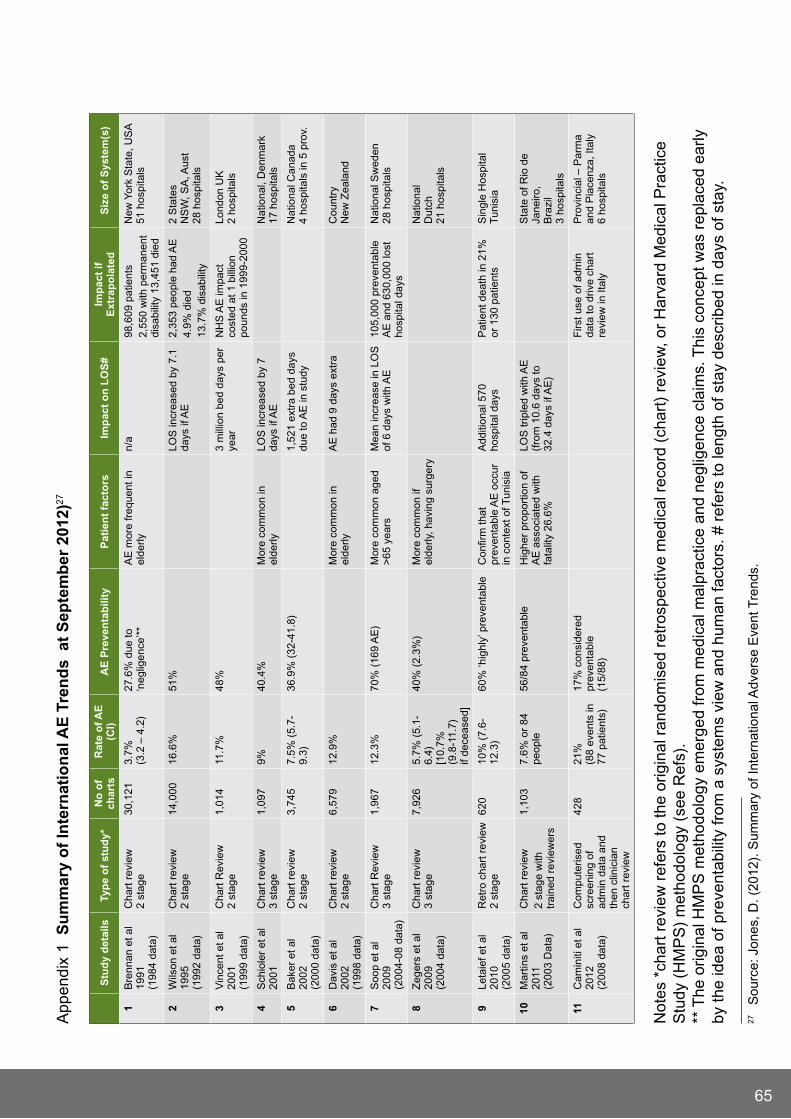
65
App
endi
x 1
Su
mm
ary
of
Inte
rnat
ion
al A
e t
ren
ds
at
Sep
tem
ber
201
2)27
Not
es *
char
t rev
iew
ref
ers
to th
e or
igin
al r
ando
mis
ed r
etro
spec
tive
med
ical
rec
ord
(cha
rt)
revi
ew, o
r H
arva
rd M
edic
al P
ract
ice
Stu
dy (
HM
PS
) m
etho
dolo
gy (
see
Ref
s).
** T
he o
rigin
al H
MP
S m
etho
dolo
gy e
mer
ged
from
med
ical
mal
prac
tice
and
negl
igen
ce c
laim
s. T
his
conc
ept w
as r
epla
ced
early
by
the
idea
of p
reve
ntab
ility
from
a s
yste
ms
view
and
hum
an fa
ctor
s. #
ref
ers
to le
ngth
of s
tay
desc
ribed
in d
ays
of s
tay.
27
Sou
rce:
jon
es, D
. (20
12).
Sum
mar
y of
Inte
rnat
iona
l Adv
erse
Eve
nt T
rend
s.
Stu
dy
det
ails
typ
e o
f st
ud
y*n
o o
f ch
arts
rat
e o
f Ae
(C
I)A
e P
reve
nta
bili
tyP
atie
nt
fact
ors
Imp
act
on
lO
S#
Imp
act
if
ext
rap
ola
ted
S
ize
of
Sys
tem
(s)
1B
renn
an e
t al
1991
(1
984
data
)
Cha
rt r
evie
w
2 st
age
30,1
213.
7%
(3.2
– 4
.2)
27.6
% d
ue to
‘n
eglig
ence
’**
AE
mor
e fr
eque
nt in
el
derly
n/a
98,6
09 p
atie
nts
2,55
0 w
ith p
erm
anen
t di
sabi
lity
13,4
51 d
ied
New
Yor
k S
tate
, US
A
51 h
ospi
tals
2W
ilson
et a
l 19
95
(199
2 da
ta)
Cha
rt r
evie
w
2 st
age
14,0
0016
.6%
51%
LOS
incr
ease
d by
7.1
da
ys if
AE
2,35
3 pe
ople
had
AE
4.9%
die
d13
.7%
dis
abili
ty
2 S
tate
s N
SW
, SA
, Aus
t 28
hos
pita
ls
3V
ince
nt e
t al
2001
(1
999
data
)
Cha
rt R
evie
w
2 st
age
1,01
411
.7%
48%
3 m
illio
n be
d da
ys p
er
year
NH
S A
E im
pact
co
sted
at 1
bill
ion
poun
ds in
199
9-20
00
Lond
on U
K
2 ho
spita
ls
4S
chio
ler
et a
l 20
01C
hart
rev
iew
3
stag
e1,
097
9%40
.4%
Mor
e co
mm
on in
el
derly
LOS
incr
ease
d by
7
days
if A
EN
atio
nal,
Den
mar
k 17
hos
pita
ls
5B
aker
et a
l 20
02
(200
0 da
ta)
Cha
rt r
evie
w
2 st
age
3,74
57.
5% (
5.7-
9.3)
36.9
% (
32-4
1.8)
1,52
1 ex
tra
bed
days
du
e to
AE
in s
tudy
N
atio
nal C
anad
a 4
hosp
itals
in 5
pro
v.
6D
avis
et a
l 20
02
(199
8 da
ta)
Cha
rt r
evie
w
2 st
age
6,57
912
.9%
Mor
e co
mm
on in
el
derly
AE
had
9 d
ays
extr
aC
ount
ry
New
Zea
land
7S
oop
et a
l 20
09
(200
4-08
dat
a)
Cha
rt R
evie
w
3 st
age
1,96
712
.3%
70%
(16
9 A
E)
Mor
e co
mm
on a
ged
>65
yea
rsM
ean
incr
ease
in L
OS
of
6 d
ays
with
AE
105,
000
prev
enta
ble
AE
and
630
,000
lost
ho
spita
l day
s
Nat
iona
l Sw
eden
28
hos
pita
ls
8Z
eger
s et
al
2009
(2
004
data
)
Cha
rt r
evie
w
3 st
age
7,92
65.
7% (
5.1-
6.4)
[1
0.7%
(9
.8-1
1.7)
if
dece
ased
]
40%
(2.
3%)
Mor
e co
mm
on if
el
derly
, hav
ing
surg
ery
Nat
iona
l D
utch
21
hos
pita
ls
9Le
taie
f et a
l 20
10
(200
5 da
ta)
Ret
ro c
hart
rev
iew
2
stag
e62
010
% (
7.6-
12.3
)60
% ‘h
ighl
y’ p
reve
ntab
leC
onfir
m th
at
prev
enta
ble
AE
occ
ur
in c
onte
xt o
f Tun
isia
Add
ition
al 5
70
hosp
ital d
ays
Pat
ient
dea
th in
21%
or
130
pat
ient
sS
ingl
e H
ospi
tal
Tun
isia
10M
artin
s et
al
2011
(2
003
Dat
a)
Cha
rt r
evie
w2
stag
e w
ith
trai
ned
revi
ewer
s
1,10
37.
6% o
r 84
pe
ople
56/8
4 pr
even
tabl
eH
ighe
r pr
opor
tion
of
AE
ass
ocia
ted
with
fa
talit
y 26
.6%
LOS
trip
led
with
AE
(f
rom
10.
6 da
ys to
32
.4 d
ays
if A
E)
Sta
te o
f Rio
de
jane
iro,
Bra
zil
3 ho
spita
ls
11C
amin
iti e
t al
2012
(2
008
data
)
Com
pute
rised
sc
reen
ing
of
adm
in d
ata
and
then
clin
icia
n ch
art r
evie
w
428
21%
(8
8 ev
ents
in
77 p
atie
nts)
17%
con
side
red
prev
enta
ble
(1
5/88
)
Firs
t use
of a
dmin
da
ta to
driv
e ch
art
revi
ew in
Ital
y
Pro
vinc
ial –
Par
ma
and
Pia
cenz
a, It
aly
6
hosp
itals

66
references for Appendix 11 Brennan TA, Leape LL, Laird NM, Hebert L, Localio AR, Lawthers AG, et al. Incidence of
Adverse Events and Negligence in Hospitalized Patients: Results of the Harvard Medical Practice Study I. New England Journal of Medicine. 1991; 324:370–6.
2 Wilson RM, Runciman WB, Gibberd R, Harrison B, Newby L, Hamilton j. The Quality in Australia Health Care Study. Med J Aust. 1995; 163:458-471.
3 Vincent C, Neale G, Woloshynowych M. Adverse Events in British hospitals: Preliminary Retrospective Record Review. BMJ. 2001; 322(7285):517 - 519.
4 Schiøler T LH, Pedersen BL, Mogensen TS, Bech KB, Stockmarr A, Svenning AR, Frølich A;. Danish Adverse Event Study. Ugeskr Laeger. 2001; 163(39):5370-8.
5 Baker GR, Norton PG, Flintoft V, Blais R, Brown A, Cox j, et al. The Canadian Adverse Events Study: The Incidence of Adverse Events among Hospital Patients in Canada. CMAJ. 2004; 170(11):1678-1686.
6 Davis P, Lay-Yee R, Briant R, Schug S, Scott A, johnson S, et al. Adverse Events in New Zealand Public Hospitals: Principal Findings from a National Survey. Wellington: Ministry of Health, New Zealand; 2001.
7 Soop M, Fryksmark U, Koster M, Haglund B. The Incidence of Adverse Events in Swedish Hospitals: A Retrospective Medical Record Review Study. International Journal for Quality in Health Care. 2009; 21(4):285-291.
8 Zegers M, de Bruijne MC, Wagner C, Hoonhout LH, Waaijman R, Smits M, et al. Adverse Events and Potentially Preventable Deaths in Dutch Hospitals: Results of a Retrospective Patient Record Review Study. Qual Saf Health Care. 2009; 18(4):297-302.
9 Letaief M. Adverse Events in a Tunisian Hospital: Results of a Retrospective Cohort Study. International Journal for Quality in Health Care. 2010; 22(5):380-385.
10 Martins M, Travassos C, Mendes W, Pavao ALB. Hospital Deaths and Adverse Events in Brazil. BMC Health Services Research. 2011; 11(1):223.
11 Caminiti C. Evaluation of a Pilot Surgical Adverse Event Detection System for Italian Hospitals. International Journal for Quality in Health Care. 2012; 24(2):114-120.
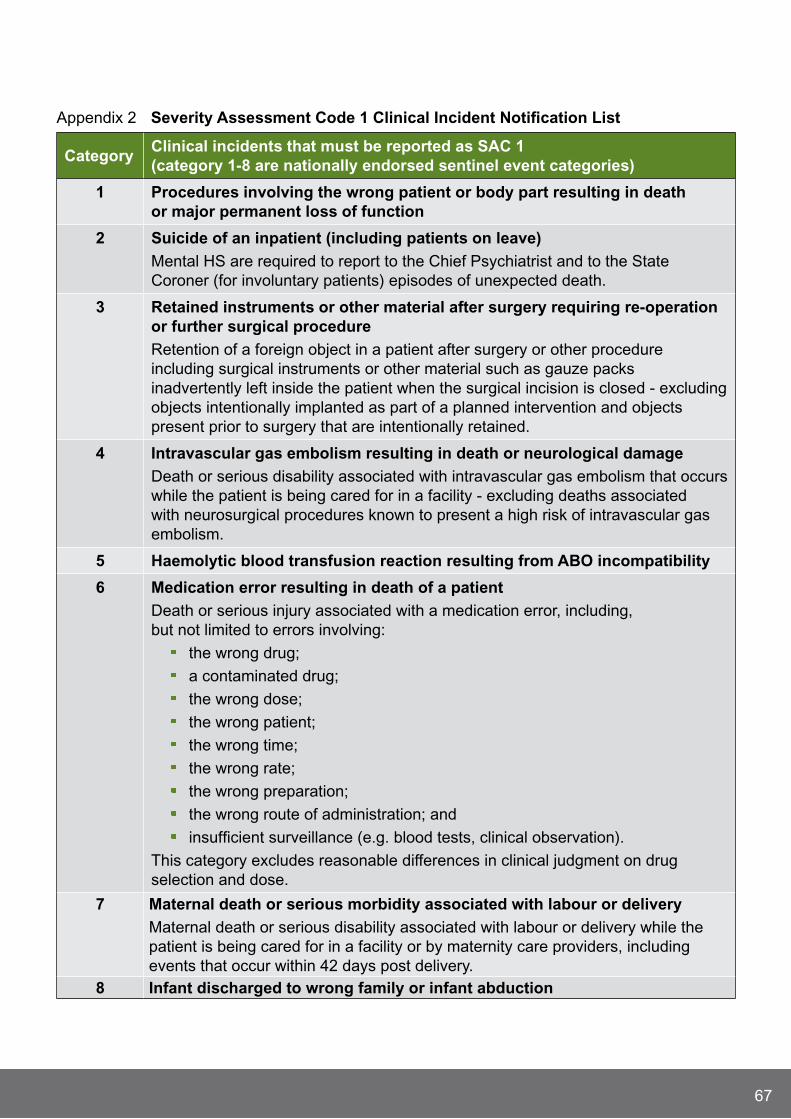
67
Appendix 2 Severity Assessment Code 1 Clinical Incident notification list
CategoryClinical incidents that must be reported as SAC 1 (category 1-8 are nationally endorsed sentinel event categories)
1 Procedures involving the wrong patient or body part resulting in death or major permanent loss of function
2 Suicide of an inpatient (including patients on leave)
Mental HS are required to report to the Chief Psychiatrist and to the State Coroner (for involuntary patients) episodes of unexpected death.
3 retained instruments or other material after surgery requiring re-operation or further surgical procedure
Retention of a foreign object in a patient after surgery or other procedure including surgical instruments or other material such as gauze packs inadvertently left inside the patient when the surgical incision is closed - excluding objects intentionally implanted as part of a planned intervention and objects present prior to surgery that are intentionally retained.
4 Intravascular gas embolism resulting in death or neurological damage
Death or serious disability associated with intravascular gas embolism that occurs while the patient is being cared for in a facility - excluding deaths associated with neurosurgical procedures known to present a high risk of intravascular gas embolism.
5 Haemolytic blood transfusion reaction resulting from ABO incompatibility
6 medication error resulting in death of a patient
Death or serious injury associated with a medication error, including, but not limited to errors involving:
the wrong drug;
a contaminated drug;
the wrong dose;
the wrong patient;
the wrong time;
the wrong rate;
the wrong preparation;
the wrong route of administration; and
insufficient surveillance (e.g. blood tests, clinical observation).
This category excludes reasonable differences in clinical judgment on drug selection and dose.
7 maternal death or serious morbidity associated with labour or delivery
Maternal death or serious disability associated with labour or delivery while the patient is being cared for in a facility or by maternity care providers, including events that occur within 42 days post delivery.
8 Infant discharged to wrong family or infant abduction

68
SAC 1 Clinical Incident notification list (continued)
Clinical incidents that must be reported as SAC 1
Other adverse event resulting in serious patient/consumer harm or death, including:
medication error (not resulting in death)
Fetal complications:
Unrelated to congenital abnormality in an infant having a birth weight greater than 2500 grams causing perinatal death, or serious and/or ongoing perinatal morbidity.
Complications not anticipated yet arose and were not managed in an appropriate or timely manner resulting in death, or serious and/or ongoing morbidity.
Delivery at a site other than where labour commences and which requires transfer to another facility for a higher level of care resulting in death, or serious and/or ongoing morbidity.
misdiagnosis and subsequent management
Delay in recognising/responding to clinical deterioration
Patient/Consumer absconding with adverse outcome
Complications of resuscitation:
Events in which staff experienced problems in managing an emergency situation or resuscitation resulting in death, or serious and/or ongoing morbidity.
Failed resuscitation where resuscitation protocols or guidelines could not be followed due to a deficiency of equipment, communication, or staffing resulting in death, or serious and/or ongoing morbidity.
Complications of anaesthetic management:
Unintended intra-operative awareness.
Anaesthetic events resulting in death, or serious and/or ongoing morbidity.
Complications of surgery
Complications of an inpatient fall
Hospital process issues:
Events in which hospital processes such as triaging, assessment, planning or delivery of care e.g. miscommunication of test results, response to abnormal test results contributed to death, or serious and/or ongoing morbidity.
Transport or transfer – Events in which delays in transport or transfer contributed to death, or serious and/or ongoing morbidity.
Infection control breach
the unexpected death of a mental health client
Absconding of any mental health patient/consumer
69
This list is not exhaustive. Sites are encouraged to seek advice from within their organisation and /or the Patient Safety Surveillance Unit re the potential notification of clinical incidents not included in this list.
Retrieved from 2011 Clinical Incident Management Policy. http://www.safetyandquality.health.wa.gov.au/docs/aims/Incident_Reporting_policy.pdf

70
Appendix 3 WArm Process
The scope of the 2008 WA Review of Mortality (WARM) Policy includes all deaths that occur in public hospitals and licensed private healthcare facilities, deaths that occur in the community under the care of Hospital In The Home (HITH), and Rehabilitation In The Home (RITH), and deaths involving nursing home type and care awaiting placement patients in WA Public hospitals.
The process of mortality review varies between organisations. The WARM Policy acknowledges that HS have established systems for mortality review that vary depending on resources, work practices, and case mix.
After death an initial assessment is made by the clinician who had primary responsibility for the patient, and/or by clinical teams where the death occurred in a country HS. The initial assessment may lead to the referral of deaths for further investigation (using appropriate investigation methodologies) to identify if the death was potentially preventable.
The outcome of mortality review may involve notification of a death as a SAC 1 clinical incident (referred to as a sentinel event in the 2008 WARM Policy). The aim of mortality review is to reduce preventable deaths through the systematic review of deaths. Notification of a clinical incident via the SAC 1 process ensures learning’s can be disseminated to a wider system audience.
Death occurs
the process of mortality review commences, utilising
criteria to facilitate the referral of potentially preventable
deaths
Further investigation may be warranted for some deaths based on initial assessment
the outcome of a mortality review may be the notification
of the death as a SAC 1 clinical incident

71
Appendix 4 WAASm Process
Deaths where a surgeon was involved in the care of the patient are audited, regardless of whether an operation has taken place.
Surgeons are asked to identify any areas for consideration, areas of concern, or AE in addition to other audited information.
Proforma is sent to peer surgeon (same specialty) at a different hospital for review.
The case, with medical notes, is sent to a second peer surgeon for further review. Second-line assessment only occurs if an area of concern or AE is identified, or the potential for learning is recognised.
Data is then analysed and an annual report written and released to enable lessons to be learnt.
Death occurs and WAASm notified
Proforma sent to surgeon involved in patient’s care
First-line assessment
Second-line assessment with medical notes
Aggregate data reported
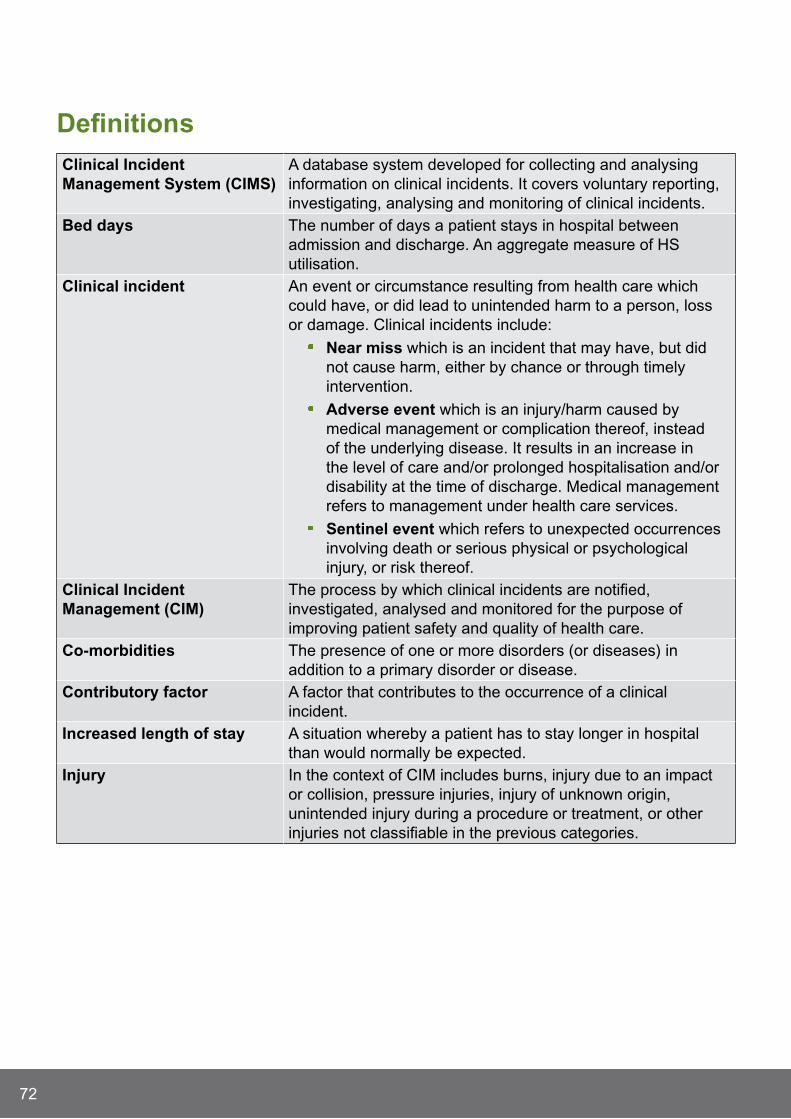
72
DefinitionsClinical Incident management System (CImS)
A database system developed for collecting and analysing information on clinical incidents. It covers voluntary reporting, investigating, analysing and monitoring of clinical incidents.
Bed days The number of days a patient stays in hospital between admission and discharge. An aggregate measure of HS utilisation.
Clinical incident An event or circumstance resulting from health care which could have, or did lead to unintended harm to a person, loss or damage. Clinical incidents include:
near miss which is an incident that may have, but did not cause harm, either by chance or through timely intervention.
Adverse event which is an injury/harm caused by medical management or complication thereof, instead of the underlying disease. It results in an increase in the level of care and/or prolonged hospitalisation and/or disability at the time of discharge. Medical management refers to management under health care services.
Sentinel event which refers to unexpected occurrences involving death or serious physical or psychological injury, or risk thereof.
Clinical Incident management (CIm)
The process by which clinical incidents are notified, investigated, analysed and monitored for the purpose of improving patient safety and quality of health care.
Co-morbidities The presence of one or more disorders (or diseases) in addition to a primary disorder or disease.
Contributory factor A factor that contributes to the occurrence of a clinical incident.
Increased length of stay A situation whereby a patient has to stay longer in hospital than would normally be expected.
Injury In the context of CIM includes burns, injury due to an impact or collision, pressure injuries, injury of unknown origin, unintended injury during a procedure or treatment, or other injuries not classifiable in the previous categories.
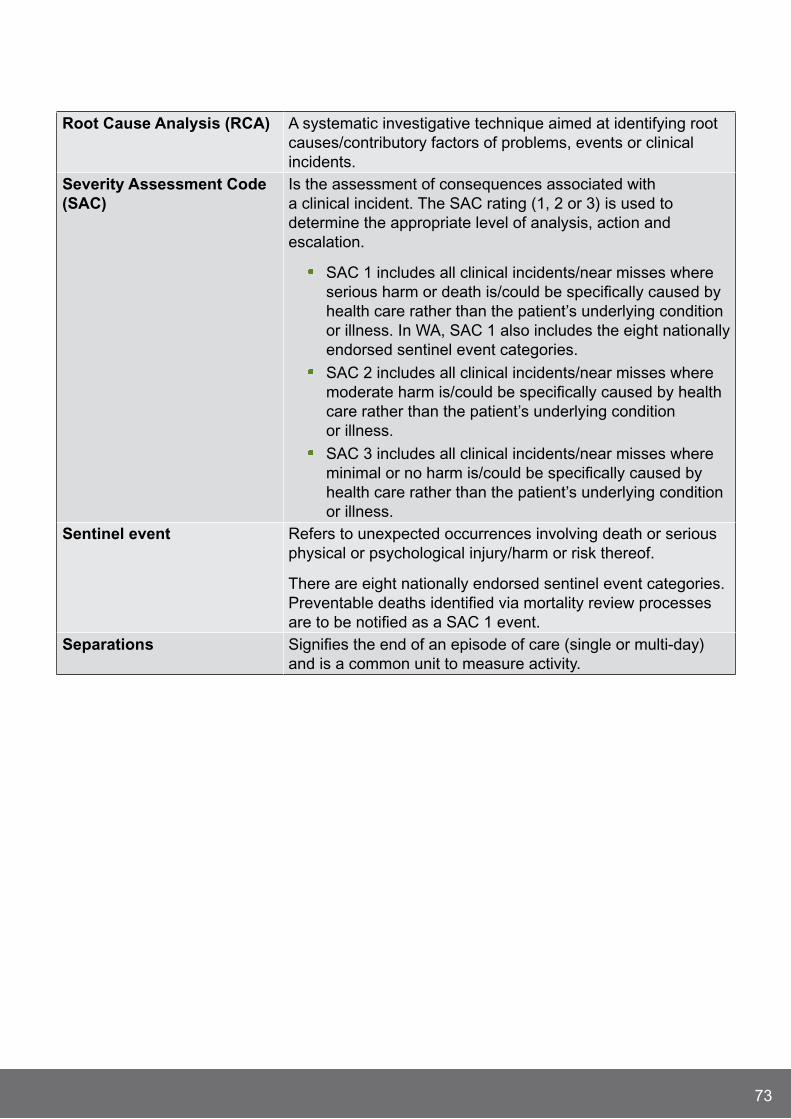
73
root Cause Analysis (rCA) A systematic investigative technique aimed at identifying root causes/contributory factors of problems, events or clinical incidents.
Severity Assessment Code (SAC)
Is the assessment of consequences associated with a clinical incident. The SAC rating (1, 2 or 3) is used to determine the appropriate level of analysis, action and escalation.
SAC 1 includes all clinical incidents/near misses where serious harm or death is/could be specifically caused by health care rather than the patient’s underlying condition or illness. In WA, SAC 1 also includes the eight nationally endorsed sentinel event categories.
SAC 2 includes all clinical incidents/near misses where moderate harm is/could be specifically caused by health care rather than the patient’s underlying condition or illness.
SAC 3 includes all clinical incidents/near misses where minimal or no harm is/could be specifically caused by health care rather than the patient’s underlying condition or illness.
Sentinel event Refers to unexpected occurrences involving death or serious physical or psychological injury/harm or risk thereof.
There are eight nationally endorsed sentinel event categories. Preventable deaths identified via mortality review processes are to be notified as a SAC 1 event.
Separations Signifies the end of an episode of care (single or multi-day) and is a common unit to measure activity.

74
Please note:Severity Assessment Code 1 (SAC 1) data within this report was extracted from the SAC 1 database 27 july 2012.
As of 3 April 2013 a further 16 SAC 1 clinical incidents notified in the 2011-2012 period were declassified following the completion of incident investigation processes confirming healthcare factors were not a contributory factor to the incident outcomes.
Document control
version Date Author Comments
1 01/10/2012 jeanne YoungRobert Fletcher
Sarah Lamb
Final draft version
2 05/07/2013 Anette Tueger Reporting discrepancies of aggregated complaints data provided
by health services subsequently led to a duplication of complaints.
Complaints data have been revised.


© Department of Health 2013
This document can be made available in alternative formats on request for
a person with a disability.H
P01
2535
AU
G’1
3
Patient Safety Surveillance Unit
Performance Directorate
Performance Activity and Quality Division
Department of Health, Western Australia
189 Royal Street
EAST PERTH WA 6004
Tel: (08) 9222 0294
http://www.safetyandquality.health.wa.gov.au