our strategy achieves value proposition -...
TRANSCRIPT
Investor Update
August 2017
Updated: 8/14/2017

2
Cautionary StatementThe following presentation includes forward-looking statements. These statements relate to future events, such as anticipated revenues, earnings, business strategies, competitive position or other aspects of our operations, operating results or the industries or markets in which we operate or participate in general. Actual outcomes and results may differ materially from what is expressed or forecast in such forward-looking statements. These statements are not guarantees of future performance and involve certain risks, uncertainties and assumptions that may prove to be incorrect and are difficult to predict such as our ability to complete the sale of our announced dispositions on the timeline currently anticipated, if at all; the possibility that regulatory approvals for our announced dispositions will not be received on a timely basis, if at all, or that such approvals may require modification to the terms of our announced dispositions or our remaining business; business disruptions during or following our announced dispositions, including the diversion of management time and attention; our ability to liquidate the common stock issued to us by Cenovus Energy Inc. as part of our sale of assets in western Canada at prices we deem acceptable, or at all; the ability to deploy net proceeds from our announced dispositions in the manner and timeframe we currently anticipate, if at all; operational hazards and drilling risks; potential failure to achieve, and potential delays in achieving expected reserves or production levels from existing and future oil and gas development projects; unsuccessful exploratory activities; unexpected cost increases or technical difficulties in constructing, maintaining or modifying company facilities; international monetary conditions and exchange controls; potential liability for remedial actions under existing or future environmental regulations or from pending or future litigation; limited access to capital or significantly higher cost of capital related to illiquidity or uncertainty in the domestic or international financial markets; general domestic and international economic and political conditions, and changes in tax, environmental and other laws applicable to ConocoPhillips’ business; and other economic, business, competitive and/or regulatory factors affecting ConocoPhillips’ business generally as set forth in ConocoPhillips’ filings with the Securities and Exchange Commission (SEC). We caution you not to place undue reliance on our forward-looking statements, which are only as of the date of this presentation or as otherwise indicated, and we expressly disclaim any responsibility for updating such information.
Use of non-GAAP financial information – This presentation may include non-GAAP financial measures, which help facilitate comparison of company operating performance across periods and with peer companies. Any non-GAAP measures included herein will be accompanied by a reconciliation to the nearest corresponding GAAP measure either within the presentation or on our website at www.conocophillips.com/nongaap.
Cautionary Note to U.S. Investors – The SEC permits oil and gas companies, in their filings with the SEC, to disclose only proved, probable and possible reserves. We use the term "resource" in this presentation that the SEC’s guidelines prohibit us from including in filings with the SEC. U.S. investors are urged to consider closely the oil and gas disclosures in our Form 10-K and other reports and filings with the SEC. Copies are available from the SEC and from the ConocoPhillips website.

~$50/BBL Brent Acceleration Actions >$50/BBL Brent
Strategy on a Page – Disciplined and Resilient, Yet Flexible
$50-$60/BBLBrent
• Value-based cash flow allocation • Maintain discipline on costs and capital
• Exercise flexibility
>$60/BBL
<$50/BBL
1st
Priority2nd
Priority3rd
Priority4th
Priority5th
Priority
• Strong balance sheet• Cash flow allocations balanced
between distributions and organic growth
Annual dividend growth
Debt of $15B;
target ‘A’ rating
>5% shares repurchased
Disciplined growth
Flat production
for <$5B capex
Cash allocated to maximize total
shareholder returns
Our goal is to deliver double-digit total
returns to shareholders annually
ChoicesALL PRIORITIES
ACHIEVEDAT ~$50/BBL BRENT
WITH ACCELERATION ACTIONS
3Production is normalized for the full-year impact of 2016 expected dispositions.

The Case For ConocoPhillips: Resilience with Upside
4
Downside Protection at Lower Prices
• Breakeven price below $50/bbl Brent
• Low capital intensity
• Extensive low cost of supply investment portfolio
• Flexible capital program
• Significant balance sheet strength and capacity
Significant Torque to Higher Prices
• Oil-weighted portfolio
• Flexibility to increase capital in unconventionals
• Exposure to favorable fiscal terms
• Unhedged for immediate price upside
• Contingent payments on recent transactions
Breakeven price is a non-GAAP measure, which is defined on our website.Contingent payments are from the Canada transaction and San Juan Basin disposition.
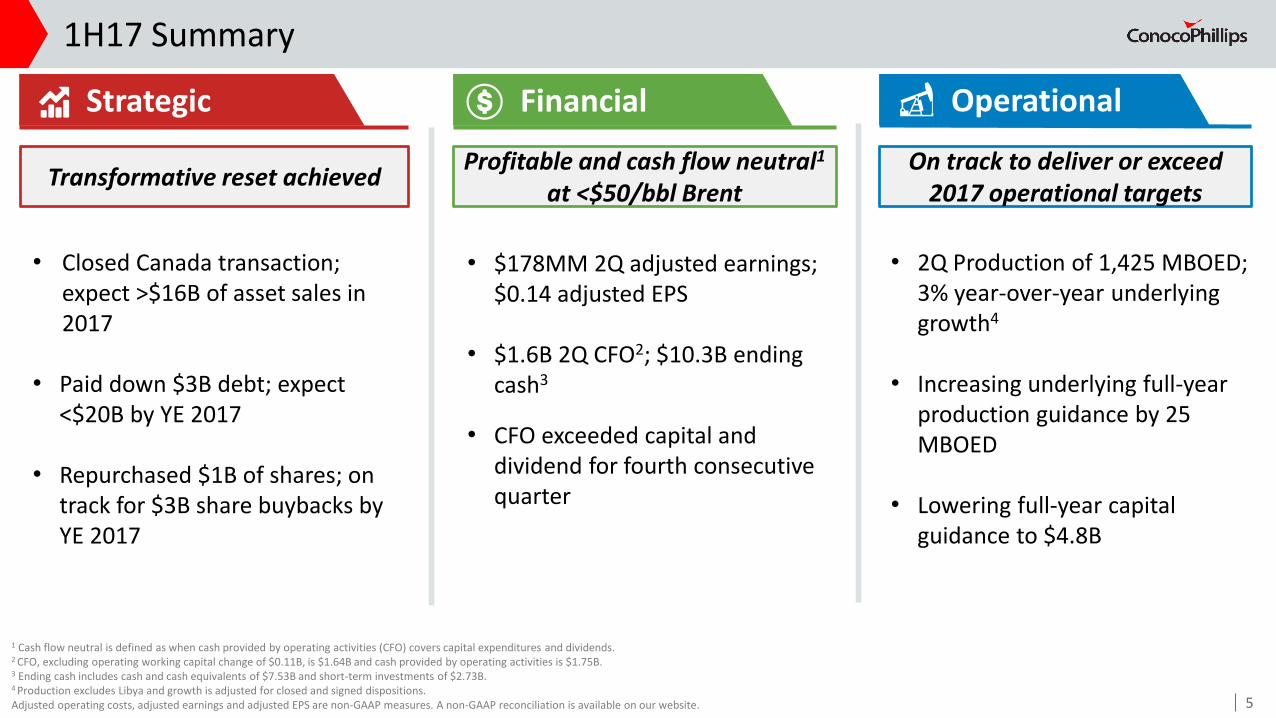
• Closed Canada transaction; expect >$16B of asset sales in 2017
• Paid down $3B debt; expect <$20B by YE 2017
• Repurchased $1B of shares; on track for $3B share buybacks by YE 2017
1H17 Summary
5
Financial Operational
• $178MM 2Q adjusted earnings; $0.14 adjusted EPS
• $1.6B 2Q CFO2; $10.3B ending cash3
• CFO exceeded capital and dividend for fourth consecutive quarter
• 2Q Production of 1,425 MBOED; 3% year-over-year underlying growth4
• Increasing underlying full-year production guidance by 25 MBOED
• Lowering full-year capital guidance to $4.8B
Strategic
1 Cash flow neutral is defined as when cash provided by operating activities (CFO) covers capital expenditures and dividends.2 CFO, excluding operating working capital change of $0.11B, is $1.64B and cash provided by operating activities is $1.75B.3 Ending cash includes cash and cash equivalents of $7.53B and short-term investments of $2.73B.4 Production excludes Libya and growth is adjusted for closed and signed dispositions.Adjusted operating costs, adjusted earnings and adjusted EPS are non-GAAP measures. A non-GAAP reconciliation is available on our website.
Transformative reset achievedProfitable and cash flow neutral1
at <$50/bbl BrentOn track to deliver or exceed
2017 operational targets

Announced Transactions Achieve Priorities in 1 Year
6As of 6/30/2017.Percent of cash returned to shareholders includes dividends and repurchase of company common stock divided by cash from operating activities.
Sources of Cash
Capital for Flat Production
Base Dividend
Dividend Growth
Debt Reduction
Share Repurchases
Disciplined Growth Capital
Exceeding 30% of CFO payout
in the near term
CFO @ ~$50/BBL
Brent
Canada Transaction
Proceeds
Starting Cash
1st
Priority
Debt Reduced $12B
2nd
Priority3rd
Priority4th
Priority5th
Priority
$6B Authorized
Sustainable through the
cyclesAnnual growth
High return organic
investment
Modest Growth
Contingent
payment &
>$50/BBL Cash Allocated to Maximize Total Shareholder Returns
San Juan Sale
New target of~$15B byYE 2019
Additional Disps.
Leverage to Upside
Accelerating Value Proposition
Reduced PortfolioBreakeven
Estimated Sources and Uses of Cash (2017-2019) at $50/BBL Brent

Disciplined, Returns-Focused Strategy Tied to Financial Priorities
Generate free cash flow • Low breakeven price
• Low capital intensity
• Differential upside as prices recover
Maintain a strong balance sheet • Balance sheet a competitive advantage through the cycles; target ‘A’ credit rating
• Viable plan to reduce debt to $15B by year-end 2019
Return cash to shareholders • Provide distinctive shareholder distributions
• Target 20-30% total payout of CFO to shareholders
Focus on financial returns • Improve absolute and relative return on capital employed (ROCE)
7Free cash flow and breakeven price are non-GAAP measures, which are defined in the appendix.

2017 2018 2019 2020 2021
2014 Megaprojects
Complete &
Deepwater
Exit
Capital
Efficiency &
Scope
Operating Cost
Reductions
Reduced
Dividend
Capital
Deflation
Operating Cost
Deflation
2017
Prepared for Commodity Cycles
Capital$17.1B
AdjustedOperating
Costs$9.7B
Dividend$3.5B
~60%REDUCTION
~$30B
8
As of 6/30/2017. Free cash flow and breakeven price are non-GAAP measures, which are defined in the appendix.Adjusted operating costs is a non-GAAP measure and on pre-transaction basis. A non-GAAP reconciliation is available on our website.
Replacing Base Decline
Relative Capital Intensity
Source: Wood Mackenzie (Oct. 2016)U.S. independent E&Ps include: APC, APA, CHK, CLR, COP, DVN, ECA, EOG, HES, MRO, MUR, NBL, NFX, OXY, PXD, RRC and SWN.1 Available cash flow = cash flow from operations less dividend, plus any hedging benefit.
2017 Capital FOR FLAT PRODUCTION / AVAILABLE CASH FLOW1
<$1B Capital/YrTO SUPPORT BASE PRODUCTION
<$4B Capital/YrTO REPLACE BASE DECLINE
Pro
du
ctio
n
LOW-DECLINEBASE PRODUCTION
U.S. Independent E&P’s
Capital$5B
AdjustedOperating
Costs$6B
~$1.3B
~$12B
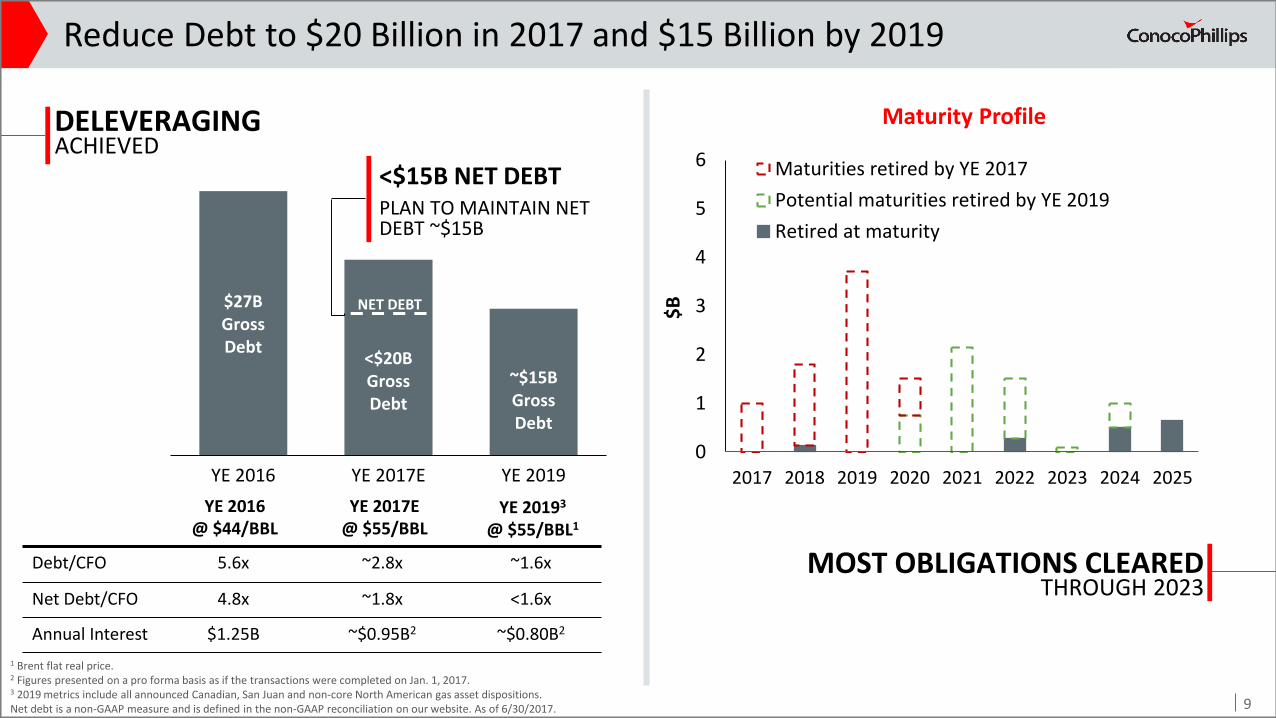
$27BGross Debt
<$20BGross Debt
~$15BGross Debt
YE 2016 YE 2017E YE 2019
Reduce Debt to $20 Billion in 2017 and $15 Billion by 2019
9
1 Brent flat real price.2 Figures presented on a pro forma basis as if the transactions were completed on Jan. 1, 2017.3 2019 metrics include all announced Canadian, San Juan and non-core North American gas asset dispositions.Net debt is a non-GAAP measure and is defined in the non-GAAP reconciliation on our website. As of 6/30/2017.
<$15B NET DEBTPLAN TO MAINTAIN NET DEBT ~$15B
Maturity Profile
$B
0
1
2
3
4
5
6
2017 2018 2019 2020 2021 2022 2023 2024 2025
Maturities retired by YE 2017
Potential maturities retired by YE 2019
Retired at maturity
MOST OBLIGATIONS CLEAREDTHROUGH 2023
Debt/CFO 5.6x ~2.8x ~1.6x
Net Debt/CFO 4.8x ~1.8x <1.6x
Annual Interest $1.25B ~$0.95B2 ~$0.80B2
YE 2017E@ $55/BBL
YE 20193
@ $55/BBL1
YE 2016@ $44/BBL
DELEVERAGINGACHIEVED
NET DEBT

2.3% 5.2%
Integrated Average Yield: 5.3%
Highly Differentiated Shareholder Payout
Shareholder Yield from PeersDividend Yield + 2017 Announced Share Repurchases
Shareholder yield reflects dividend yield as of May 10, 2017 as well as 2017 announced share repurchase programs or annualized 1Q17 buybacks. Dividend-paying companies: APA, APC, BP, COP, CVX, DVN, OXY, RDS, TOT, XOM.
• Current dividend can withstand low prices, with room for annual increases
• Targeting annual growth in per-share dividend rate
• Dividend competitive compared to E&P average and S&P 500
• Dividend supplemented with share repurchases to deliver differential shareholder yield
E&P Average Yield: 2.1%
10
2017 Annualized Share Repurchase Yield
Annualized Dividend Yield
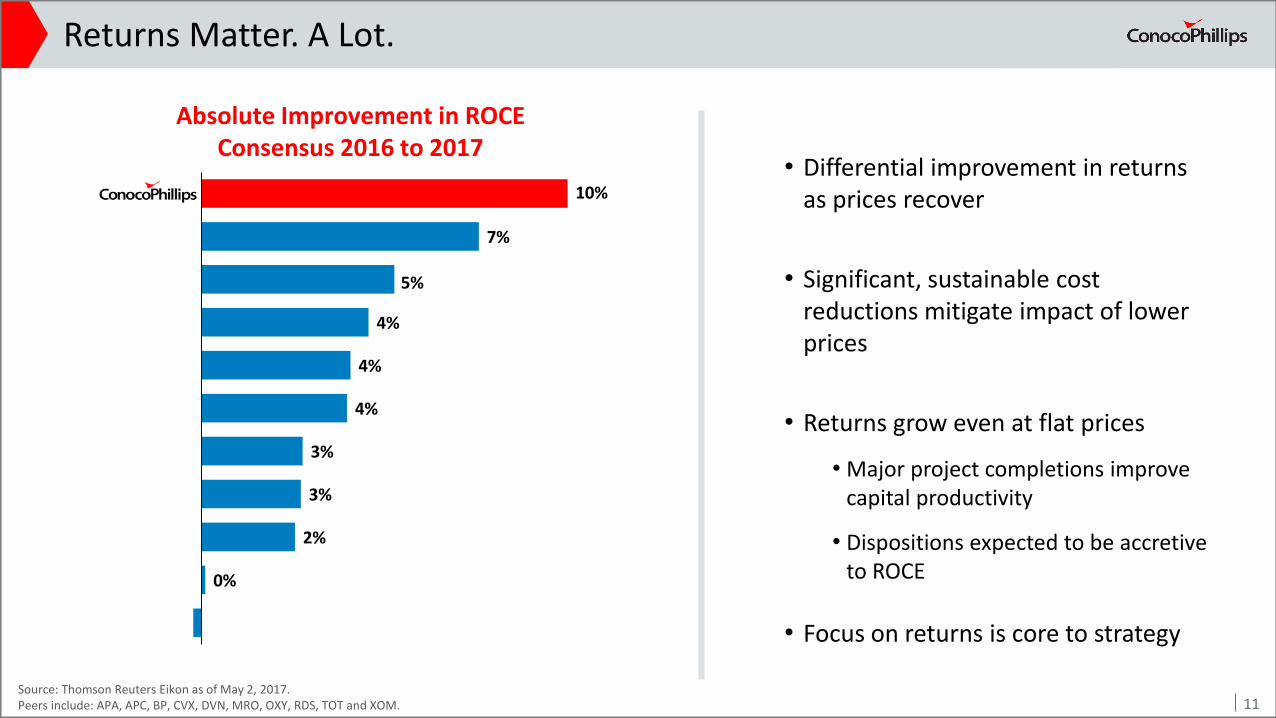
Returns Matter. A Lot.
• Differential improvement in returns as prices recover
• Significant, sustainable cost reductions mitigate impact of lower prices
• Returns grow even at flat prices
• Major project completions improve capital productivity
• Dispositions expected to be accretive to ROCE
• Focus on returns is core to strategy
Absolute Improvement in ROCE Consensus 2016 to 2017
10%
7%
5%
4%
4%
4%
3%
3%
2%
0%
Source: Thomson Reuters Eikon as of May 2, 2017.Peers include: APA, APC, BP, CVX, DVN, MRO, OXY, RDS, TOT and XOM. 11
510
Oil
Bitumen
NGL
Int'l Gas
NA Gas
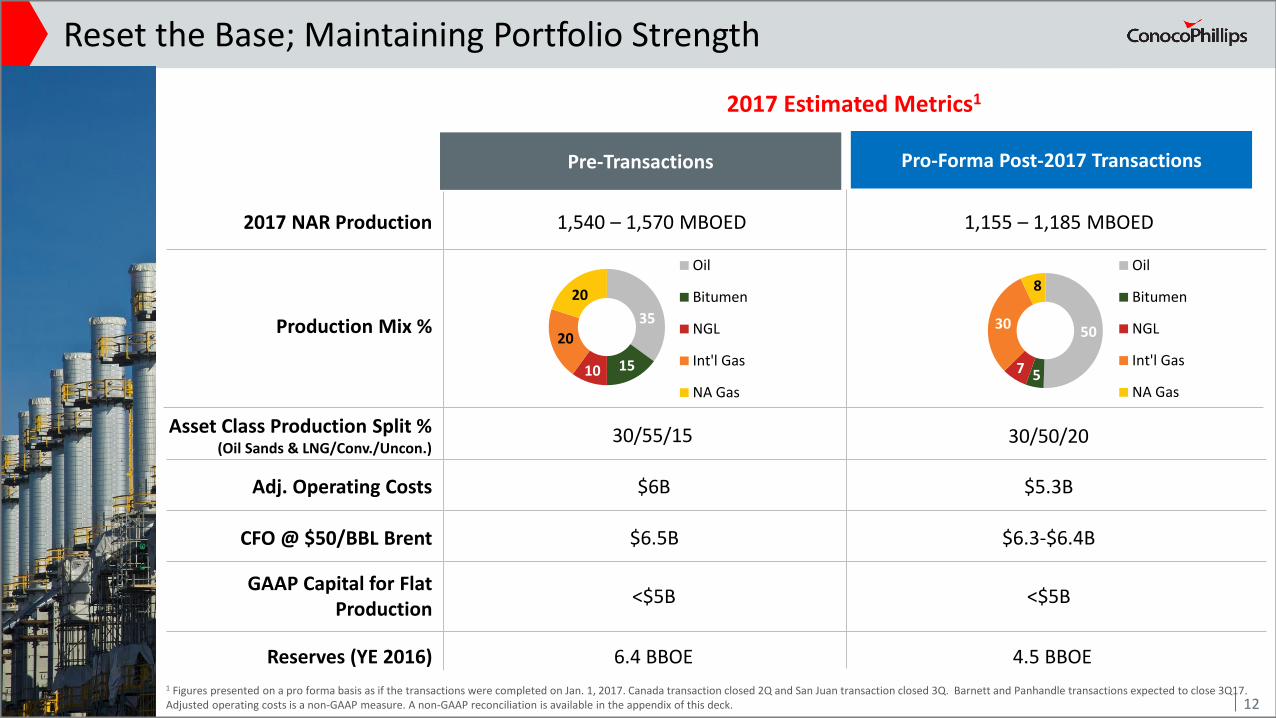
Reset the Base; Maintaining Portfolio Strength
Pre-Transactions
Production Mix %
2017 NAR Production 1,540 – 1,570 MBOED
Reserves (YE 2016) 6.4 BBOE
35
20
20
10
CFO @ $50/BBL Brent $6.5B
Adj. Operating Costs $6B
15
GAAP Capital for Flat Production
<$5B
2017 Estimated Metrics1
Asset Class Production Split % (Oil Sands & LNG/Conv./Uncon.)
30/55/15
1 Figures presented on a pro forma basis as if the transactions were completed on Jan. 1, 2017. Canada transaction closed 2Q and San Juan transaction closed 3Q. Barnett and Panhandle transactions expected to close 3Q17.Adjusted operating costs is a non-GAAP measure. A non-GAAP reconciliation is available in the appendix of this deck.
Pro-Forma Post-2017 Transactions
1,155 – 1,185 MBOED
45
10
<$5B
4.5 BBOE
$6.3-$6.4B
$5.3B
30/50/20
12
5030
Oil
Bitumen
NGL
Int'l Gas
NA Gas
8
7 5

Our Portfolio is Designed to Create Strategic Flexibility…
13
Production Over Time
Unconventionals
Conventionals
LNG & Oil Sands
5-Year Capital Flexibility
0%
100%
Flexibility
Flexible Development
Multi-Year Drilling Contracts
Cost of Supply
<$30/BBL
$30-$40/BBL
$40-$50/BBL
Sanctioned Projects
Future Projects
Exploration
Base

Announced Transactions Reduce Average Cost of Supply to ~$35/BBL
141 Average cost of supply and resource life calculated based on total resources with <$50/BBL Brent cost of supply.
Impact of Transactions on Resource with Cost of Supply <$50/BBL
BB
OE
Avg. CoS1 ~$40/BBL ~$35/BBL
Resource life1 31 Years 31 Years
1814
InvestorMeeting
Nov. 2016
CanadianTransaction
San JuanBasin
Transaction
PostTransactions
San Juan and other
transactions
0
20
40
60
0
14 BBOE with Cost of Supply <$50/BBL
Co
st o
f Su
pp
ly (
$/B
BL)
141050
ConventionalLNG & Oil Sands
AVERAGE COST OF SUPPLYREDUCED FROM ~$40/BBL TO ~$35/BBL
Unconventional
BBOE
Canadian transaction

Fully Burdened Cost of Supply: Everything Including the Kitchen Sink
Direct Capital & Lifting Costs
Product Mix & Differentials
Transportation Single Well Infrastructure G&A Price-Related Inflation
Fully Burdened Program CoS
Fully Burdened Cost of Supply by Component($/BBL) • Cost of supply represents the
flat, real commodity price that yields an after-tax return of 10% on a point-forward and fully burdened basis
• A fully burdened cost of supply includes all direct and indirect costs
• Price-related inflation to $65/BBL Brent and foreign exchange impacts
• Fully burdened cost of supply provides a clearer representation of impacts to corporate returns
Burden = $5-15/BBL
15
0
10
20
30
40
50
0 10%
15%
20%
25%
30%
35%
40%
45%
50%
20 30 40 50 60
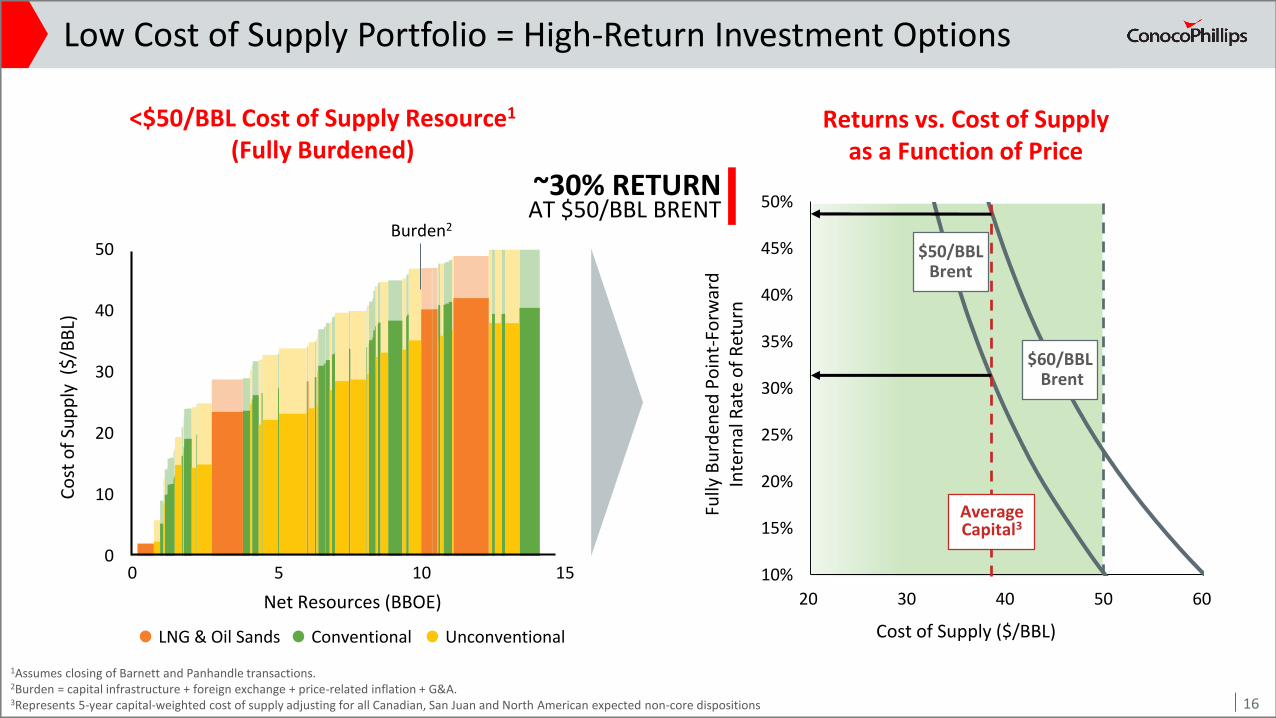
Low Cost of Supply Portfolio = High-Return Investment Options
Returns vs. Cost of Supply as a Function of Price
Fully
Bu
rden
ed P
oin
t-Fo
rwar
d
Inte
rnal
Rat
e o
f R
etu
rn
16
Cost of Supply ($/BBL)
$60/BBLBrent
Average Capital3
<$50/BBL Cost of Supply Resource1
(Fully Burdened)
Conventional UnconventionalLNG & Oil Sands
~30% RETURNAT $50/BBL BRENT
$50/BBL Brent
1Assumes closing of Barnett and Panhandle transactions.2Burden = capital infrastructure + foreign exchange + price-related inflation + G&A. 3Represents 5-year capital-weighted cost of supply adjusting for all Canadian, San Juan and North American expected non-core dispositions
Co
st o
f Su
pp
ly (
$/B
BL)
Net Resources (BBOE)
Burden2
0
10
20
30
40
50
00 5 10 15
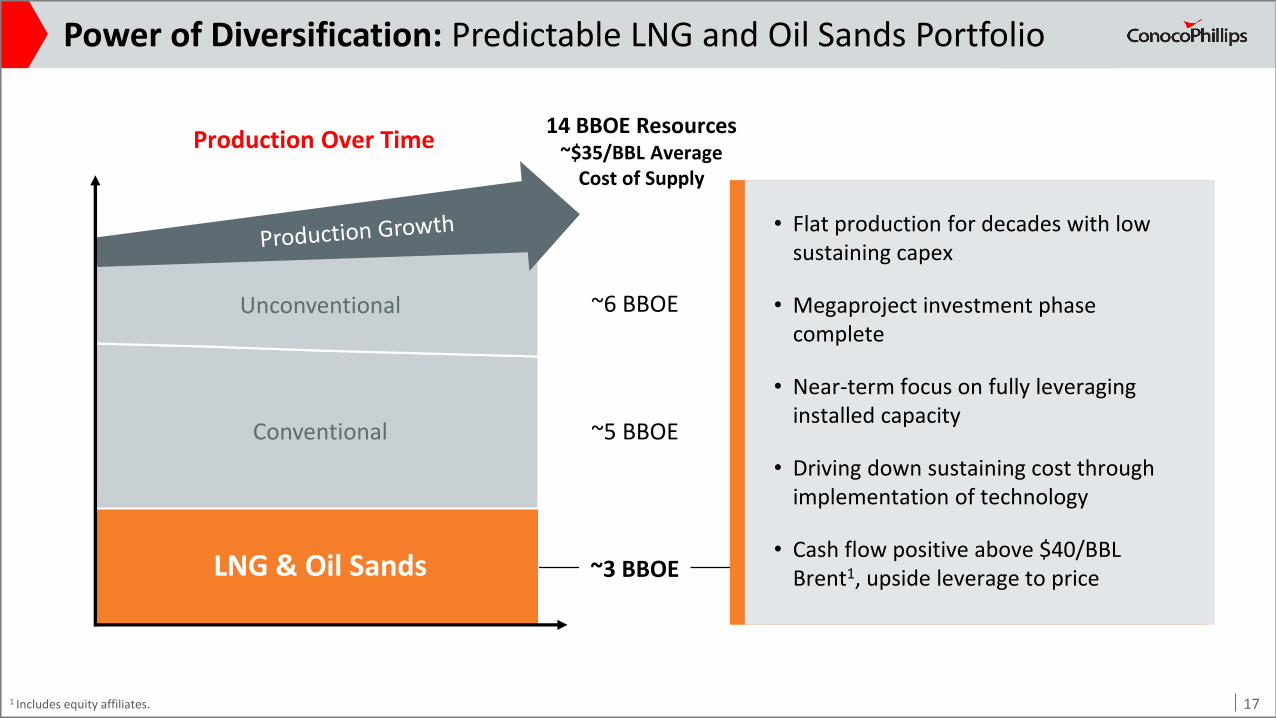
Power of Diversification: Predictable LNG and Oil Sands Portfolio
• Flat production for decades with low sustaining capex
• Megaproject investment phase complete
• Near-term focus on fully leveraging installed capacity
• Driving down sustaining cost through implementation of technology
• Cash flow positive above $40/BBL Brent1, upside leverage to priceLNG & Oil Sands
Conventional
Unconventional
Production Over Time
~6 BBOE
~5 BBOE
~3 BBOE
14 BBOE Resources~$35/BBL Average
Cost of Supply
171 Includes equity affiliates.

0
20
40
60
80
100
2016 2017E
APLNG Net Production(MBOED)
Oil Sands & LNG: Projects Complete and Ramping
• Train 1 performance exceeding design nameplate capacity
• Train 2 first production achieved in September 2016
• 20-year LNG offtake contracts for 8.6 MTPA
• >1 BBOE net resource
• Point-forward cost of supply <$30/BBL
18
APLNG
ConocoPhillips Acreage Pipeline
Australia
• FCD technology accelerating production and reducing GHG intensity
• Standardizing pad/well design to lower costs
• Debottlenecking projects with <$40/BBL cost of supply can contribute ~25% capacity increase after 2018
• Brownfield projects can contribute an additional ~25% capacity increase after 2018
Surmont: Megaproject Complete
APLNG: Two-Train Delivery
0
20
40
60
80
2016 2017E 2018E
Net
Pro
du
ctio
n (
MB
OED
)
Surmont Net ProductionStructurally Lowering Costs ($MM/well)
2014 2016 2018+
~50%DECREASE
Drill & Complete Well Site Facilities

Power of Diversification: Low-Risk Conventional Portfolio
• Short-cycle development drilling in legacy assets expected to add ~140 MBOED over next 5 years
• Low-risk, medium-cycle projects expected to add ~130 MBOED over the next 5 years
• Strong track record of delivering value in legacy assets
• ~$36/BBL average cost of supplyLNG & Oil Sands
Conventional
Unconventional
Production Over Time
~6 BBOE
~5 BBOE
~3 BBOE
14 BBOE Resources~$35/BBL Average
Cost of Supply
19
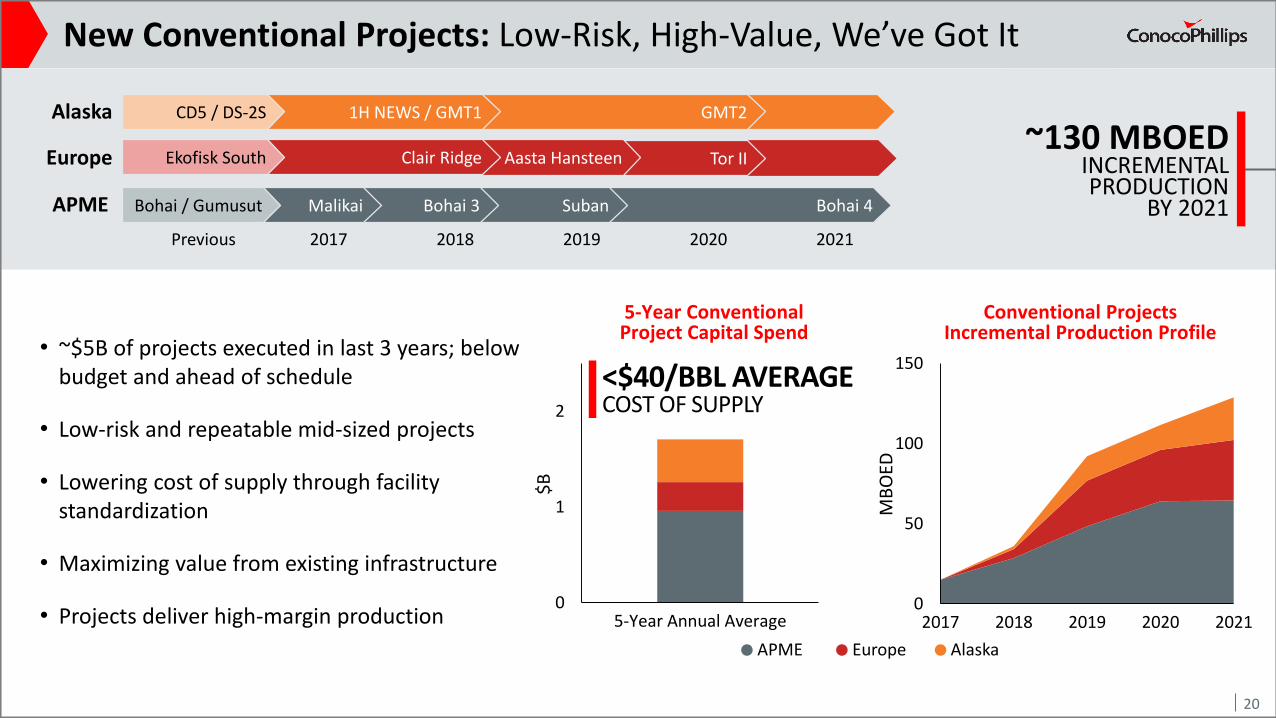
New Conventional Projects: Low-Risk, High-Value, We’ve Got It
• ~$5B of projects executed in last 3 years; below budget and ahead of schedule
• Low-risk and repeatable mid-sized projects
• Lowering cost of supply through facility standardization
• Maximizing value from existing infrastructure
• Projects deliver high-margin production
APME
2018 2019 2021
~130 MBOEDINCREMENTAL PRODUCTION
BY 2021Previous 2017 2020
Europe
Alaska
Bohai 4Suban
GMT21H NEWS / GMT1CD5 / DS-2S
Bohai 3MalikaiBohai / Gumusut
Tor IIAasta HansteenClair RidgeEkofisk South
0
1
2
5-Year Annual Average
5-Year ConventionalProject Capital Spend
Conventional Projects Incremental Production Profile
0
50
100
150
2017 2018 2019 2020 2021
$B
MB
OED
APME Europe Alaska
<$40/BBL AVERAGECOST OF SUPPLY
20

Power of Diversification: Low-Risk Unconventional Portfolio
LNG & Oil Sands
Conventional
Unconventional
Production Over Time
~5 BBOE
~3 BBOE
14 BBOE Resource~$35/BBL Average
Cost of Supply
• Flexible source of production growth
• Industry-leading returns
• Optimizing development of our large resource base
• Utilizing technology to improve productivity and reduce cost of supply
• Leveraging expertise to identify new unconventional opportunities
~6 BBOE
21
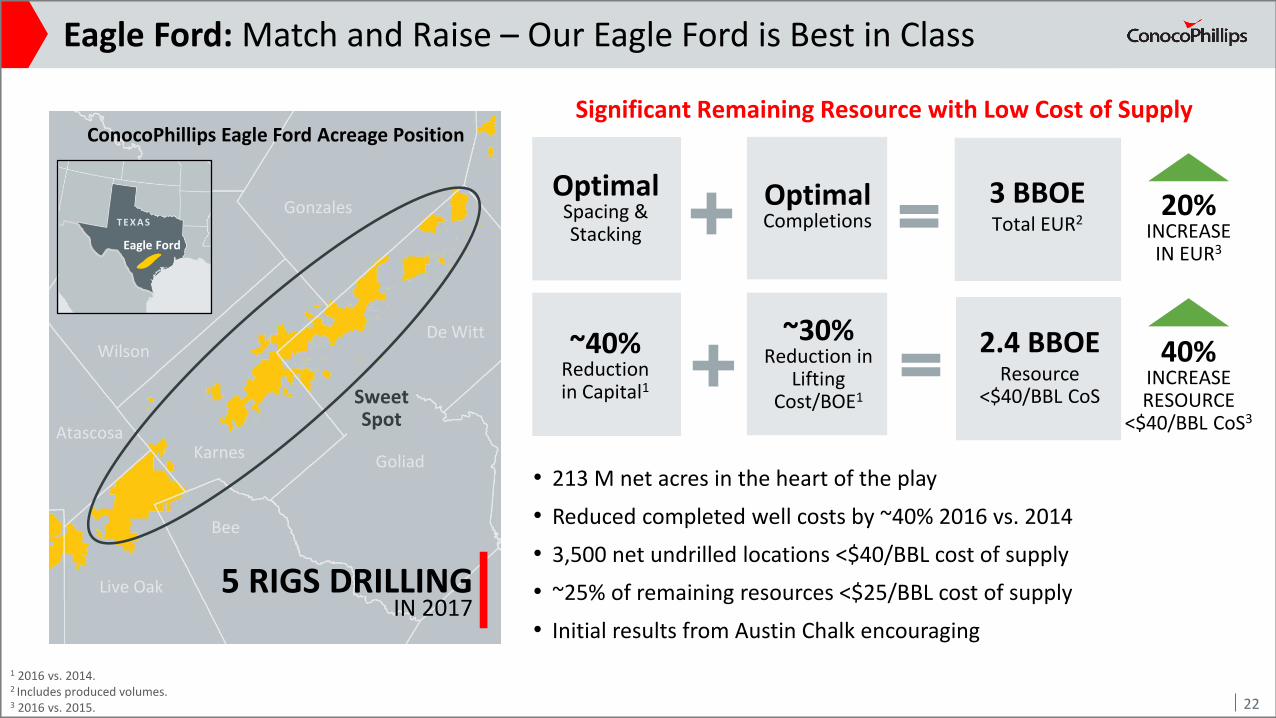
Eagle Ford: Match and Raise – Our Eagle Ford is Best in Class
ConocoPhillips Eagle Ford Acreage Position
De Witt
Goliad
Gonzales
Wilson
Karnes
T e x a s
Sweet Spot
Atascosa
Live Oak
Bee
5 RIGS DRILLING IN 2017
Significant Remaining Resource with Low Cost of Supply
20%INCREASE IN EUR3
OptimalSpacing & Stacking
OptimalCompletions
2.4 BBOEResource
<$40/BBL CoS
~40%Reduction in Capital1
~30%Reduction in
Lifting Cost/BOE1
3 BBOETotal EUR2
40%INCREASE RESOURCE
<$40/BBL CoS3
22
Eagle Ford
T E X A S
1 2016 vs. 2014.2 Includes produced volumes.3 2016 vs. 2015.
• 213 M net acres in the heart of the play
• Reduced completed well costs by ~40% 2016 vs. 2014
• 3,500 net undrilled locations <$40/BBL cost of supply
• ~25% of remaining resources <$25/BBL cost of supply
• Initial results from Austin Chalk encouraging

La SalleMcMullen
BexarMedina
Frio Atascosa
Wilson
T e x a s
ConocoPhillips Acreage
Goliad
De Witt
Gonzales
Bee
Live Oak
Karnes
Eagle Ford: Measured Pace Pays Off
ConocoPhillips AcreageCompetitor WellsConocoPhillips Wells
Eagle Ford
T E X A S
• Maximizing ultimate recovery through improved understanding
• Continuing to refine models; further opportunities to add value through optimization
3,500 REMAINING LOCATIONS<$40/BBL COST OF SUPPLY
23
24
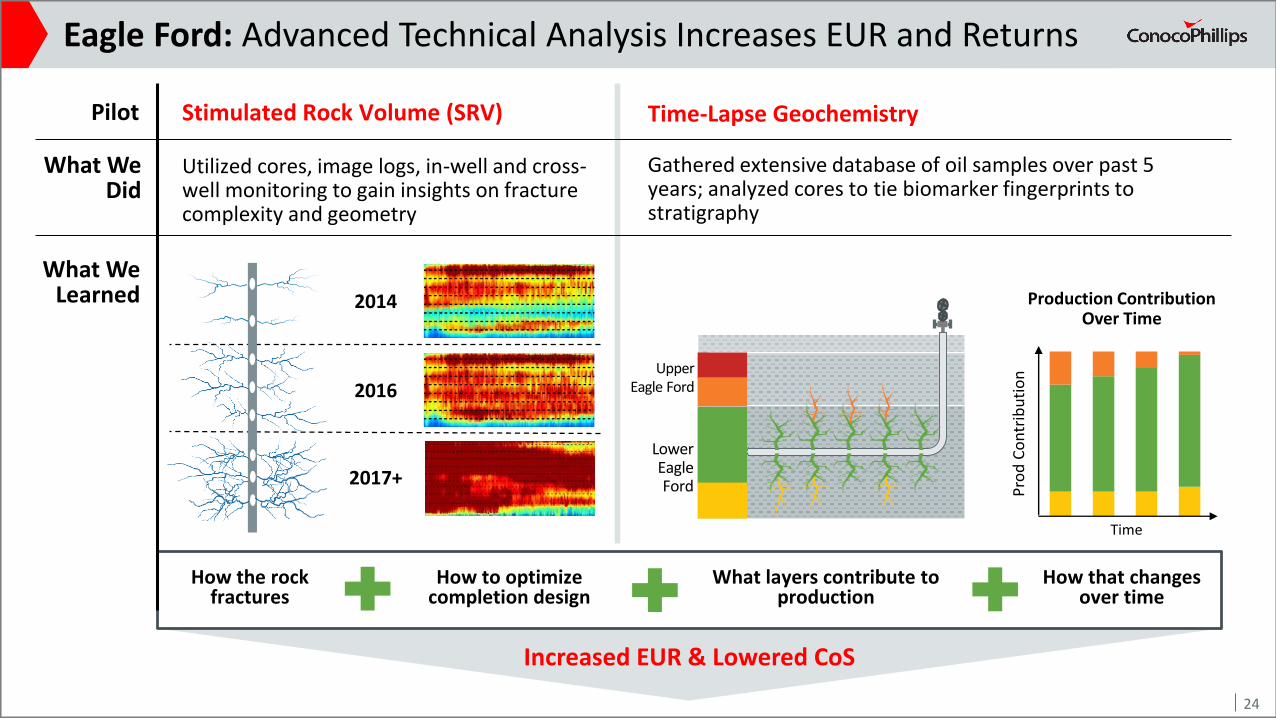
Stimulated Rock Volume (SRV) Time-Lapse Geochemistry
Eagle Ford: Advanced Technical Analysis Increases EUR and Returns
2014
2016
2017+
LowerEagle Ford
UpperEagle Ford
Production ContributionOver Time
Time
Pro
d C
on
trib
uti
on
How the rock fractures
How to optimize completion design
What layers contribute to production
How that changes over time
Pilot
What WeDid
What WeLearned
Gathered extensive database of oil samples over past 5 years; analyzed cores to tie biomarker fingerprints to stratigraphy
Utilized cores, image logs, in-well and cross-well monitoring to gain insights on fracture complexity and geometry
Increased EUR & Lowered CoS
24

Eagle Ford: NPV of Learning Curve > NPV of Acceleration
• Optimal spacing and stacking pattern developed through reservoir understanding
• Different well configurations depending on location and geology
15.5 MMlbs
300 Clusters
7.5 MMlbs
100 Clusters
• Data acquisition and modeling supports tighter cluster spacing and higher proppant loading
• Completion efficiencies resulting in 50% cost reduction vs. 2014, despite larger design
2014 vs. 2016 Completion DesignCustomized Spacing and Stacking to Geology
25
Thinner
Testing the Austin Chalk
Upper Eagle Ford
Lower Eagle Ford
60-AcreHigh Low 60-Acre Triple 80-Acre Triple
0.5 BBOERESOURCE ADDED
VS. 2015
ThickerLower ViscosityHigher Viscosity

Bakken: Increasing EUR While Driving Down Costs
• ~620 M net acres; 0.7 BBOE resource <$35/BBL average CoS
• Optimizing recovery through improved completion design
• Pilot program confirmed spacing and infill potential of Middle Three Forks
• Reduced completed well costs by ~45% 2016 vs. 2014
Middle Bakken2014-2015 Completion Optimization
0
100
200
300
0 100 200 300 400
Cu
mu
lati
ve O
il (M
BO
)
Days Online
40%INCREASE
2011-2013 Design 2014-2015 Design
2016-2017 Completion OptimizationProvides Encouraging Results in Middle Bakken
Cumulative Production (MBOE)
Pro
du
ctiv
ity
Ind
ex
(BO
ED/D
elta
psi
)
Lowest Well Cost/BOE1
Competitors2
Wel
l Co
st (
$/B
OE)
2014-2015 Design2011-2013 Design 2016-2017 Design1 Source: Wood Mackenzie North America Well Analysis Tool.2 Competitors include: CLR, EOG, HES, HK, MRO, OAS, STO, WLL and XOM. 26

Delaware: 1.8 BBOE Resource and Just Getting Started
‘Wolfcamp 1’ – 6 Month Cum. (MBOE)
200
0
ConocoPhillips Focus Areas
• 75 M net unconventional acres
• 1.8 BBOE net resource <$50/BBL cost of supply; 1,400 locations in inventory
• Coring up acreage for 10,000’ laterals, increases value by >30%
• Reduced completed well cost by ~50% since 2014
• Stacking to maximize NPV per acre
Loving
Reeves
Delaware Basin
N e w M e x i c o
ConocoPhillips Acreage
T e x a s
~80%INCREASE IN RESOURCE SINCE 2015
Coring Up Acreage for
10,000’ laterals
Multi-Zone
Development
1.8 BBOENet Resource <$50/BBL CoS
27
China Draw
Red Hills
Source: IHS Enerdeq and ConocoPhillips.

2015 Resource
2016 Resource
Unconventionals: Massive Flexible Growth
~6 BBOE
$40-$50/BBLCoS
$30-$40/BBLCoS
<$30/BBLCoS
Asset
Resource <$50/BBL
CoS(BBOE)
# Remaining Locations
(Net)<$50 CoS
Eagle Ford 2.4 3,500
Delaware 1.8 1,400
Bakken 0.7 900
Sub-Total ~5 5,800
Emerging Plays Under Appraisal
~1 TBD
Total ~6
Eagle Ford, Delaware and Bakken Production (MBOED)
0%
10%
20%
5 10 15
Number of Rigs
3-Y
ear
CA
GR
Fro
m 2
01
7 A
vera
ge
~4 BBOE
$40-$50/BBLCoS
$30-$40/BBL CoS
28
a
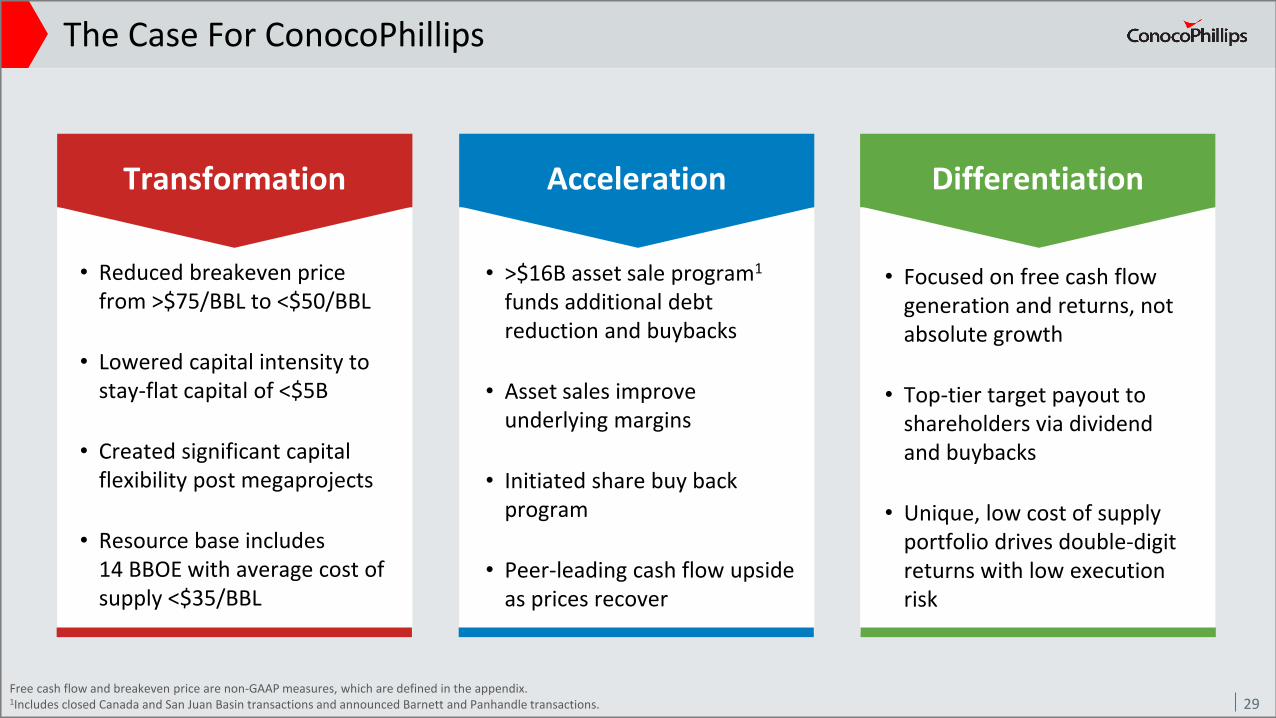
The Case For ConocoPhillips
• Reduced breakeven price from >$75/BBL to <$50/BBL
• Lowered capital intensity to stay-flat capital of <$5B
• Created significant capital flexibility post megaprojects
• Resource base includes 14 BBOE with average cost of supply <$35/BBL
• >$16B asset sale program1
funds additional debt reduction and buybacks
• Asset sales improve underlying margins
• Initiated share buy back program
• Peer-leading cash flow upside as prices recover
• Focused on free cash flow generation and returns, not absolute growth
• Top-tier target payout to shareholders via dividend and buybacks
• Unique, low cost of supplyportfolio drives double-digitreturns with low execution risk
Transformation Acceleration Differentiation
29Free cash flow and breakeven price are non-GAAP measures, which are defined in the appendix.1Includes closed Canada and San Juan Basin transactions and announced Barnett and Panhandle transactions.
Appendix
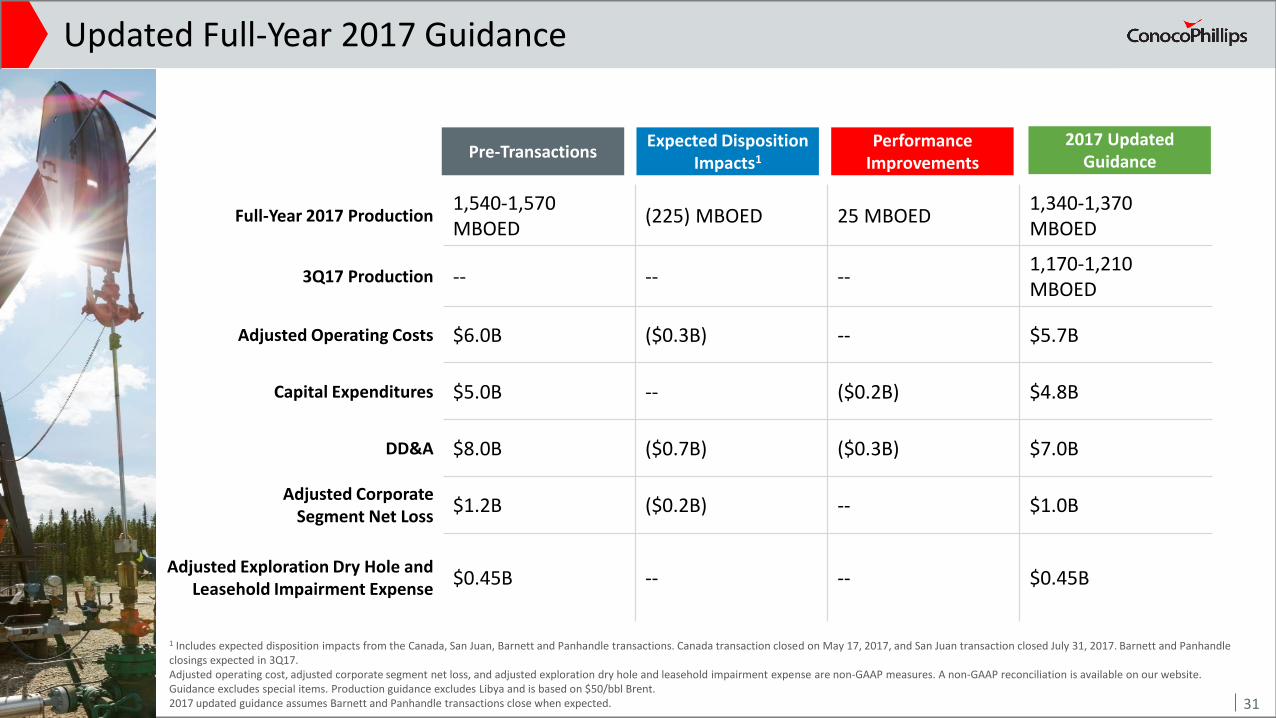
Updated Full-Year 2017 Guidance
31
Full-Year 2017 Production1,540-1,570 MBOED
(225) MBOED 25 MBOED1,340-1,370MBOED
3Q17 Production -- -- --1,170-1,210 MBOED
Adjusted Operating Costs $6.0B ($0.3B) -- $5.7B
Capital Expenditures $5.0B -- ($0.2B) $4.8B
DD&A $8.0B ($0.7B) ($0.3B) $7.0B
Adjusted Corporate Segment Net Loss
$1.2B ($0.2B) -- $1.0B
Adjusted Exploration Dry Hole and Leasehold Impairment Expense
$0.45B -- -- $0.45B
Pre-TransactionsExpected Disposition
Impacts1
2017 Updated Guidance
1 Includes expected disposition impacts from the Canada, San Juan, Barnett and Panhandle transactions. Canada transaction closed on May 17, 2017, and San Juan transaction closed July 31, 2017. Barnett and Panhandle closings expected in 3Q17. Adjusted operating cost, adjusted corporate segment net loss, and adjusted exploration dry hole and leasehold impairment expense are non-GAAP measures. A non-GAAP reconciliation is available on our website.Guidance excludes special items. Production guidance excludes Libya and is based on $50/bbl Brent. 2017 updated guidance assumes Barnett and Panhandle transactions close when expected.
Performance Improvements
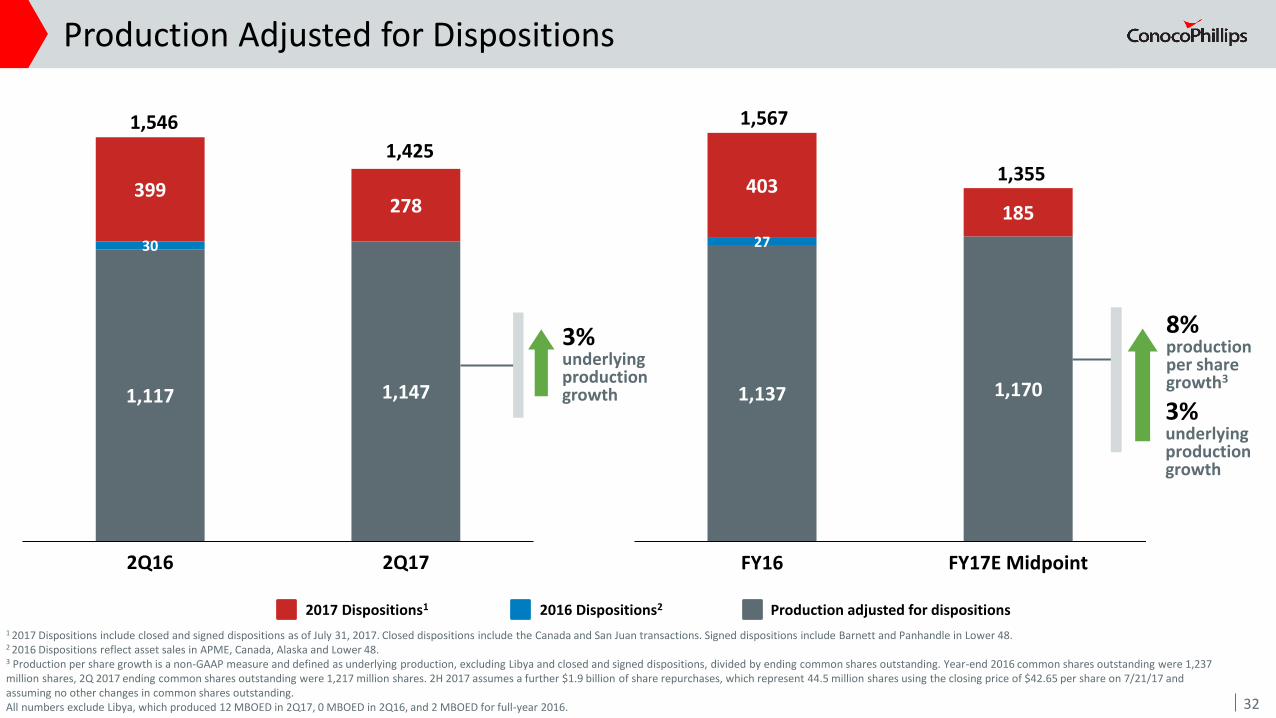
1,117 1,147
30
399278
1,546
1,425
2Q16 2Q17
Production Adjusted for Dispositions
32
2016 Dispositions22017 Dispositions1 Production adjusted for dispositions
1,137 1,170
27
403
185
1,567
1,355
FY16 FY17E Midpoint
3%underlyingproduction growth
8%production per share growth3
1 2017 Dispositions include closed and signed dispositions as of July 31, 2017. Closed dispositions include the Canada and San Juan transactions. Signed dispositions include Barnett and Panhandle in Lower 48.2 2016 Dispositions reflect asset sales in APME, Canada, Alaska and Lower 48.3 Production per share growth is a non-GAAP measure and defined as underlying production, excluding Libya and closed and signed dispositions, divided by ending common shares outstanding. Year-end 2016 common shares outstanding were 1,237 million shares, 2Q 2017 ending common shares outstanding were 1,217 million shares. 2H 2017 assumes a further $1.9 billion of share repurchases, which represent 44.5 million shares using the closing price of $42.65 per share on 7/21/17 and assuming no other changes in common shares outstanding. All numbers exclude Libya, which produced 12 MBOED in 2Q17, 0 MBOED in 2Q16, and 2 MBOED for full-year 2016.
3%underlyingproduction growth
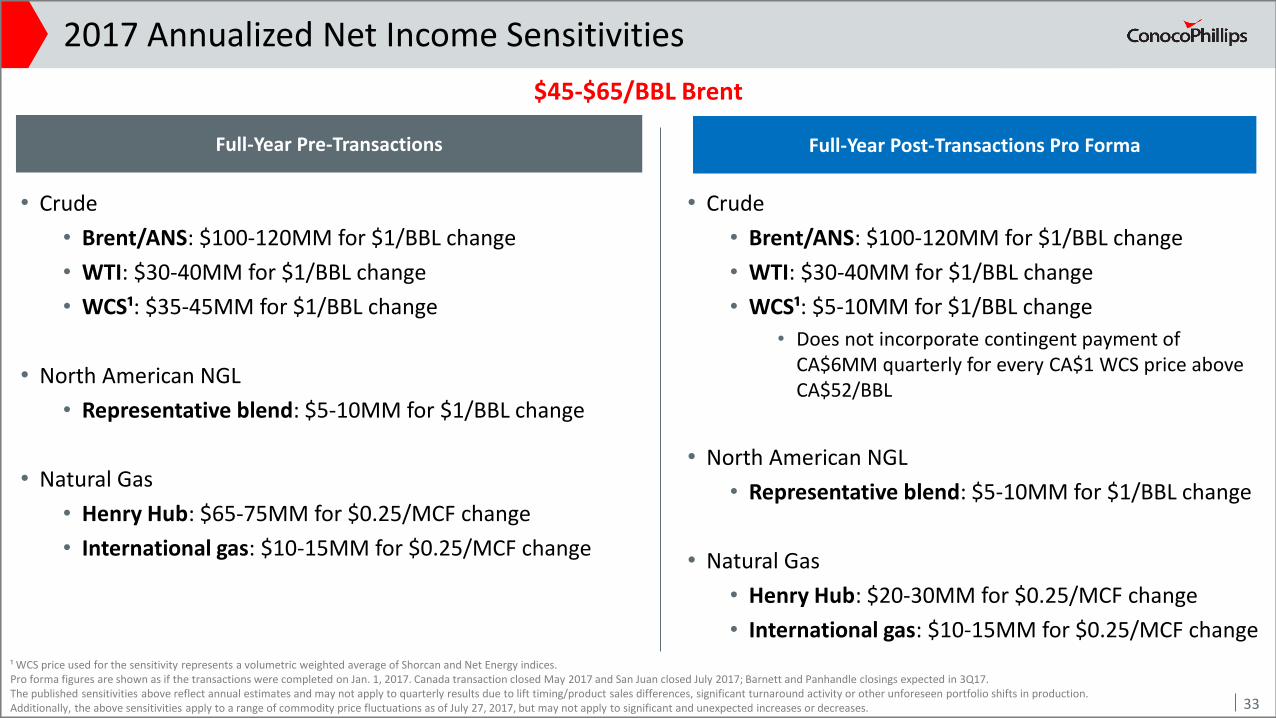
2017 Annualized Net Income Sensitivities
33
• Crude
• Brent/ANS: $100-120MM for $1/BBL change
• WTI: $30-40MM for $1/BBL change
• WCS¹: $35-45MM for $1/BBL change
• North American NGL
• Representative blend: $5-10MM for $1/BBL change
• Natural Gas
• Henry Hub: $65-75MM for $0.25/MCF change
• International gas: $10-15MM for $0.25/MCF change
¹ WCS price used for the sensitivity represents a volumetric weighted average of Shorcan and Net Energy indices.Pro forma figures are shown as if the transactions were completed on Jan. 1, 2017. Canada transaction closed May 2017 and San Juan closed July 2017; Barnett and Panhandle closings expected in 3Q17.The published sensitivities above reflect annual estimates and may not apply to quarterly results due to lift timing/product sales differences, significant turnaround activity or other unforeseen portfolio shifts in production. Additionally, the above sensitivities apply to a range of commodity price fluctuations as of July 27, 2017, but may not apply to significant and unexpected increases or decreases.
$45-$65/BBL Brent
Full-Year Pre-Transactions Full-Year Post-Transactions Pro Forma
• Crude
• Brent/ANS: $100-120MM for $1/BBL change
• WTI: $30-40MM for $1/BBL change
• WCS¹: $5-10MM for $1/BBL change
• Does not incorporate contingent payment of CA$6MM quarterly for every CA$1 WCS price above CA$52/BBL
• North American NGL
• Representative blend: $5-10MM for $1/BBL change
• Natural Gas
• Henry Hub: $20-30MM for $0.25/MCF change
• International gas: $10-15MM for $0.25/MCF change
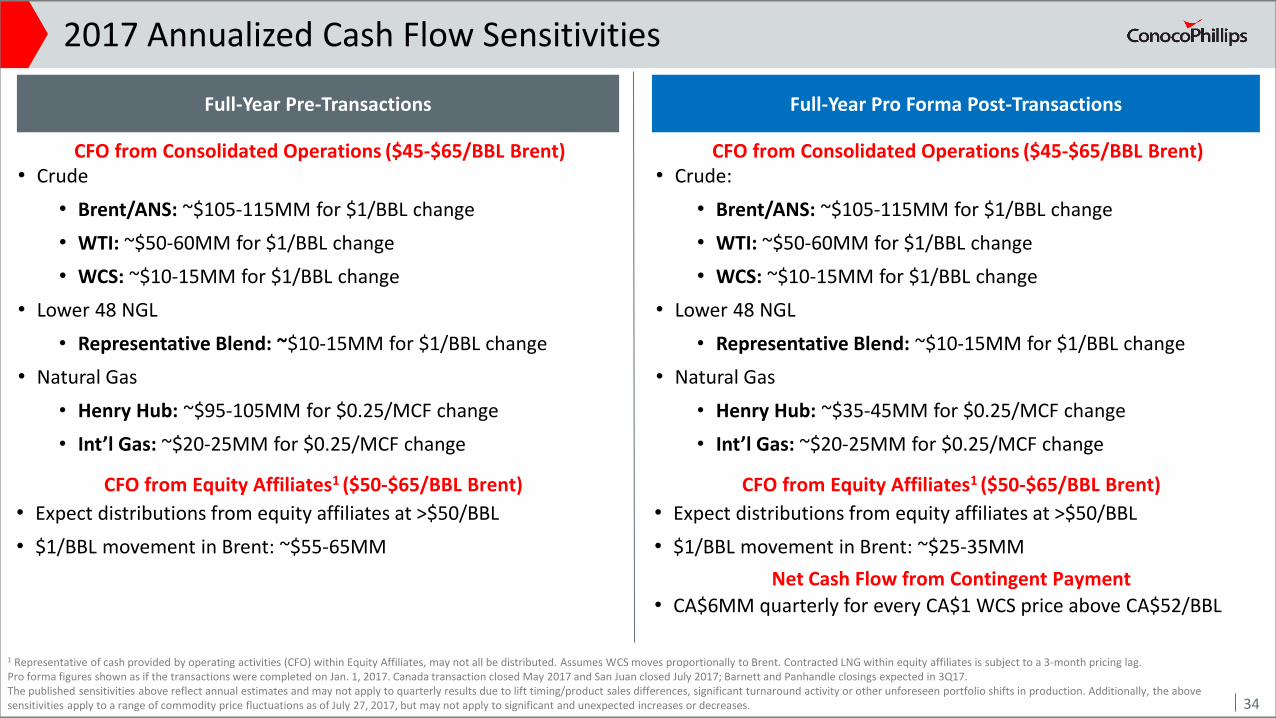
2017 Annualized Cash Flow Sensitivities
• Crude
• Brent/ANS: ~$105-115MM for $1/BBL change
• WTI: ~$50-60MM for $1/BBL change
• WCS: ~$10-15MM for $1/BBL change
• Lower 48 NGL
• Representative Blend: ~$10-15MM for $1/BBL change
• Natural Gas
• Henry Hub: ~$95-105MM for $0.25/MCF change
• Int’l Gas: ~$20-25MM for $0.25/MCF change
1 Representative of cash provided by operating activities (CFO) within Equity Affiliates, may not all be distributed. Assumes WCS moves proportionally to Brent. Contracted LNG within equity affiliates is subject to a 3-month pricing lag. Pro forma figures shown as if the transactions were completed on Jan. 1, 2017. Canada transaction closed May 2017 and San Juan closed July 2017; Barnett and Panhandle closings expected in 3Q17.The published sensitivities above reflect annual estimates and may not apply to quarterly results due to lift timing/product sales differences, significant turnaround activity or other unforeseen portfolio shifts in production. Additionally, the above sensitivities apply to a range of commodity price fluctuations as of July 27, 2017, but may not apply to significant and unexpected increases or decreases.
CFO from Consolidated Operations ($45-$65/BBL Brent)
CFO from Equity Affiliates1 ($50-$65/BBL Brent)
• Expect distributions from equity affiliates at >$50/BBL
• $1/BBL movement in Brent: ~$55-65MM
34
Full-Year Pre-Transactions
• Crude:
• Brent/ANS: ~$105-115MM for $1/BBL change
• WTI: ~$50-60MM for $1/BBL change
• WCS: ~$10-15MM for $1/BBL change
• Lower 48 NGL
• Representative Blend: ~$10-15MM for $1/BBL change
• Natural Gas
• Henry Hub: ~$35-45MM for $0.25/MCF change
• Int’l Gas: ~$20-25MM for $0.25/MCF change
CFO from Consolidated Operations ($45-$65/BBL Brent)
CFO from Equity Affiliates1 ($50-$65/BBL Brent)
• Expect distributions from equity affiliates at >$50/BBL
• $1/BBL movement in Brent: ~$25-35MM
Full-Year Pro Forma Post-Transactions
Net Cash Flow from Contingent Payment
• CA$6MM quarterly for every CA$1 WCS price above CA$52/BBL

• A&D: acquisitions and divestitures
• ANS: Alaska North Slope
• B: billion
• BBL: barrel
• BBOE: billions of barrels of oil equivalent
• BCFD: billions of cubic feet per day
• BOE: barrels of oil equivalent
• BOED: barrels of oil equivalent per day
• Breakeven Price: breakeven price is the Brent price at which cash from operations equals the capital expenditures and investments required to maintain flat production, working capital changes associated with investing activities and dividends paid.
• CAGR: compound annual growth rate
• CFO: cash from operations
• Cost of Supply (CoS): cost of supply is the Brent equivalent price that generates a 10 percent return on a point forward and fully burdened basis.
• Dividend Yield: dividend yield is calculated as: annual dividend per share / price per share.
• EUR: estimated ultimate recovery
• FCD: flow control devices
• Free Cash Flow: free cash flow is cash from operations in excess of capital expenditures and investments required to maintain flat production, working capital changes associated with investing activities, and dividends paid. Free cash flow is not a measure of cash available for discretionary expenditures since the company has certain non-discretionary obligations such as debt service that are not deducted from the measure.
• GAAP: generally accepted accounting principles
• GHG: greenhouse gas emissions
• LNG: liquefied natural gas
• M: thousand
• Margin Growth: increase in cash from operations per barrel
• MM: million
• MBO: thousands of barrels of oil
• MBOE: thousands of barrels of oil equivalent
• MBOED: thousands of barrels of oil equivalent per day
• MMBTU: million British Thermal Units
• MMlbs: million pounds
• MTPA: millions of tonnes per annum
• NGL: natural gas liquids
• NPV: net present value
• Production / DASh: production per debt adjusted share is calculated as: production / (((balance sheet debt – balance sheet cash)/share price) + shares outstanding).
• ROCE: return on capital employed
• SAGD: steam-assisted gravity drainage
• SOR: steam oil ratio
• WCS: Western Canada Select
• WTI: West Texas Intermediate
Abbreviations and Definitions
35
Stock Ticker
NYSE: COP
Website: www.conocophillips.com/investor
Headquarters
ConocoPhillips
600 N. Dairy Ashford Road
Houston, Texas 77079
Investor Relations Contacts:
Telephone: +1 281.293.5000
Ellen DeSanctis: [email protected]
Andy O’Brien: [email protected]
Renee Rosener: [email protected]
Mary Ann Cacace: [email protected]
36
Investor Information