out of home roi and optimization in the media mix · tv ooh (inc cinema) radio print digital...
TRANSCRIPT

Out of Home ROI and Optimization in the Media MixSummary Report
2017

Key Research Findings:
OOH is a significant media channel in the mix
OOH has good ROI
OOH improves campaign ROI
OOH drives brand perceptions
More should be spent on OOH in every category analyzed

What do we know about the ROI for OOH?

42.9%
43.6%
41.6%
41.5%
3.7%
3.5%
3.5%
3.4%
0% 20% 40% 60% 80% 100%
2013
2014
2015
2016
TV OOH +35% Radio Magazine Newspaper Digital Display Digital Video Digital Search Total Digital
4.4%
4.3%
4.4%
4.2%
26.9%
30.2%
35.3%
38.0%
0% 20% 40% 60% 80% 100%
2013
2014
2015
2016
All traditional channels have been squeezed by the growth of digital display
| 4
MAGNA Total US picture covers all ad spend by channel, but not by product category or advertiser
Kantar plus SMI Pool Total US picture combines Kantar’s view of all US advertisers’ offline spending, with SMI’s Pool insight into digital spending 34.8%
25.6%
US – we can now report % of all media spend including digital, total & by category

Automotive Consumer Electronics
Retail (Non-Grocery) CPG Food/Drink
Our brand metrics effect study focussed on four areas
| 5

OOH’s share of media spend for our four categories. Three of the four categories show stability or growth
1.7%
1.9%
2.5%
5.1%
0% 20% 40% 60% 80% 100%
Automotive
Food &
Drink
Consumer
Electonics
Retail Non-
Grocery
TV OOH (incl Cinema) +35%Radio MagazineNewspaper Digital DisplayDigital Video Search
2016 full mix for our four categories OOH % over the last 4 years
1.7%
2.5%
1.9%
5.1%
0%
1%
2%
3%
4%
5%
6%
2013 2014 2015 2016
Automotive Consumer Electronics
Food & Drink Retail Non-Grocery
| 6

Our Sales Revenue ROI knowledge in the US market

Our US multi-media mix cases
100
| 8Revenue ROI = Revenue generated (from the model) divided by the spend
25 20
We have 100 cases in our US SALES results vault
(Omnicom Media Group)
Of these 100 cases, 25 use OOH in their media mix
The largest OOH% is 32%, smallest 2%. Average is 9%
This is of total media mix including digital display,
video and search
20 of those 25 have a reported OOH sales revenue
ROI
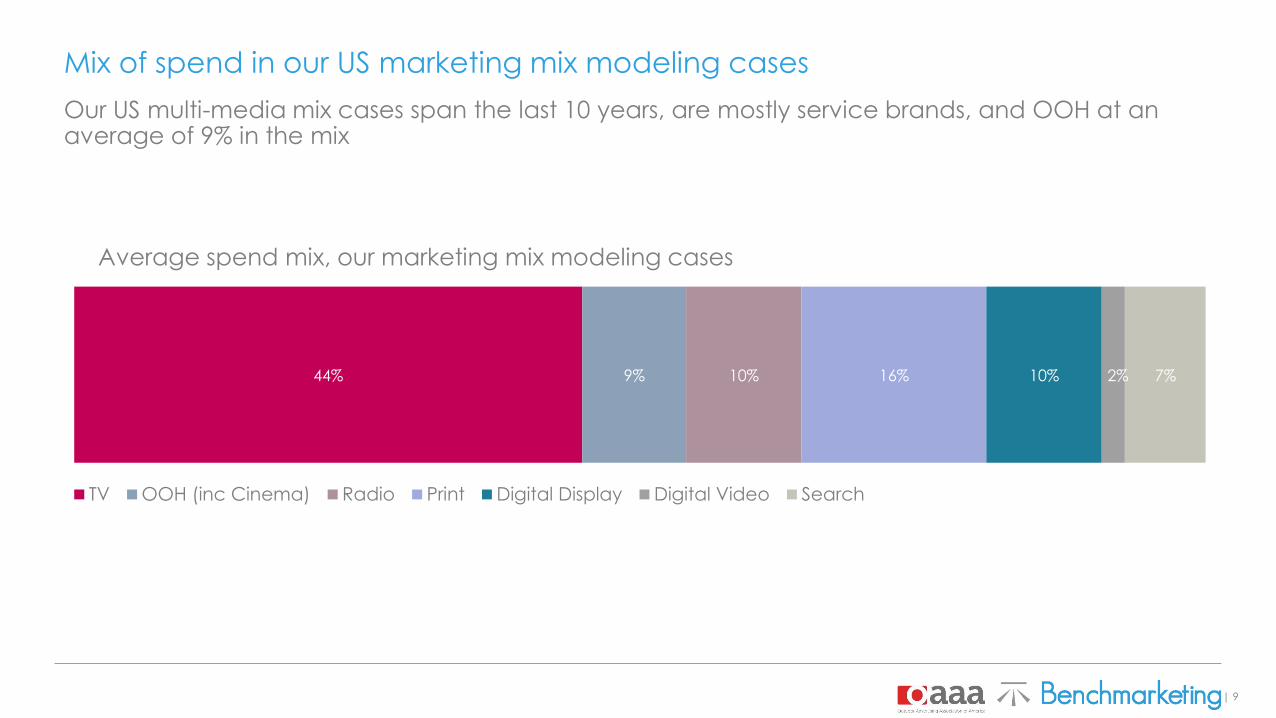
Mix of spend in our US marketing mix modeling cases
Our US multi-media mix cases span the last 10 years, are mostly service brands, and OOH at an average of 9% in the mix
| 9
44% 9% 10% 16% 10% 2% 7%
Average spend mix, our marketing mix modeling cases
TV OOH (inc Cinema) Radio Print Digital Display Digital Video Search
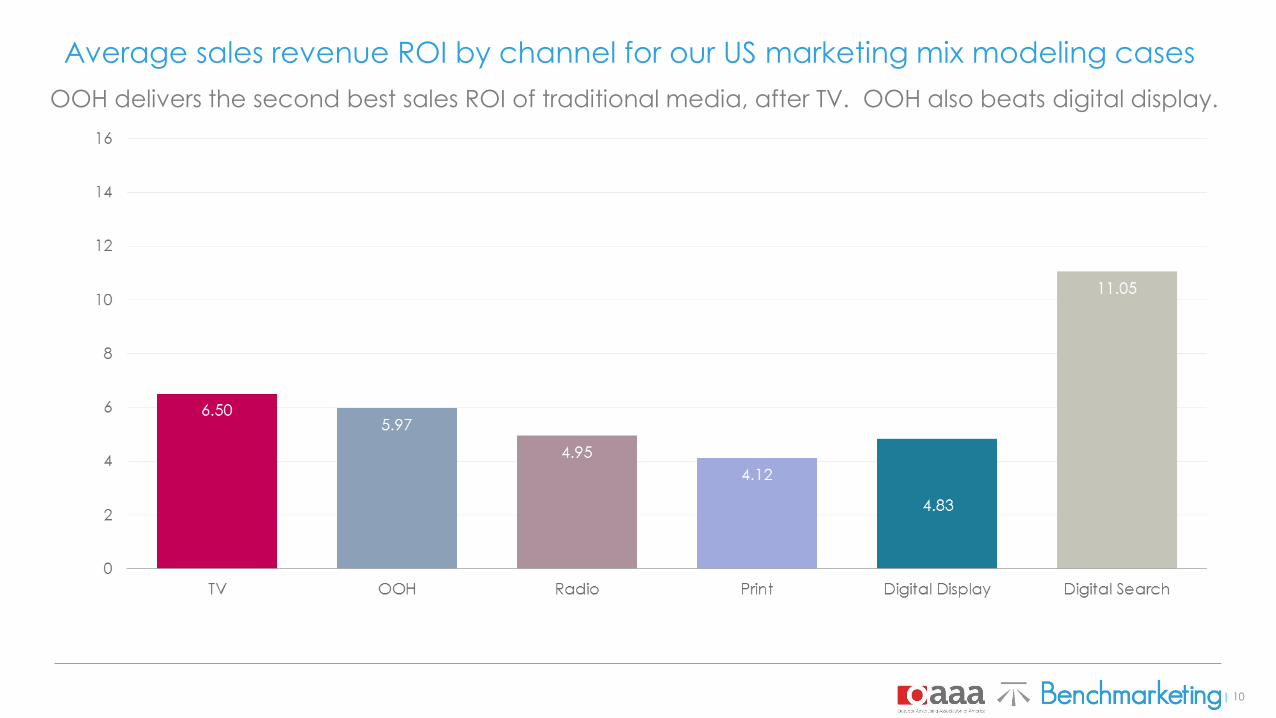
Average sales revenue ROI by channel for our US marketing mix modeling cases
OOH delivers the second best RROI of traditional media, after TV. OOH beats Display
| 10
OOH delivers the second best sales ROI of traditional media, after TV. OOH also beats digital display.

| 11
Including OOH in the mix increases sales revenue ROIs for search +40% and print +14%
Using OOH Not using OOH
Using OOH makes Search and Print work harder. OOH seems to compete with Radio and to lesser extent Display
5.575.97
1.37
4.58
3.73
14.28
0
2
4
6
8
10
12
14
16
TV OOH Radio Print Digital
Display
Digital
Search
6.73
5.85
4.01
5.11
10.24
0
2
4
6
8
10
12
14
16
TV OOH Radio Print Digital
Display
Digital
Search

Example Sales Response curves for a category and campaign burst
The Revenue ROIs are similar but the curves are very different
TV and Radio are in high diminishing returns
If sales are the only objective, money should come out of Radio first, TV next, and allocated to OOH
| 12

• TV and Radio produce diminishing returns, but OOH continues to deliver incremental returns
• If sales are the only objective, budget should be allocated to OOH and taken from:
– Radio first
– TV next
• If new budget is available, it will best be used in OOH
• If budgets are to be cut, OOH should be protected and budget should be taken from Radio, TV, Newspapers, and Display first
The Revenue ROIs are similar but the curves are very different
| 13
OOH provides linear returns, while TV and Radio begin to diminish

OOH’s Role in Driving Brand MetricsAcross Four Product Categories

Consumer purchase funnels deconstruct consumer purchase journeys from the point of advertising spend through to sales, and identify the stages of most importance, and most dynamism
We have generated response curves for these effects, for each main media channel by modelling the brand metric over time (weekly) vs media spends in six reported media channels (weekly)
OOH spend has a proven (statistically significant) effect in driving each of the brand metrics, different by category and by brand metric and we can quantify the OOH recommended media % to maximize each brand metric
Ad AwarenessWhich of the following have you seen
an ad for in the past 2 weeks?
Brand AwarenessHave you ever heard of this brand?
ConsiderationWhen you are in the market next to
purchase, from which of the following would you consider purchasing?
RecommendationWould you recommend the brand toa friend or colleague or tell the friend
or colleague to avoid the brand?
Purchase IntentionFrom which of these would you
be most likely to purchase?
| 15
Our project - to prove how media drive brand perceptions in 4 categories

Working out the optimal OOH use
Data – BrandIndex matched to reported media
400 brands across 8 categories in USA
BrandIndex deconstructs consumer purchase journeys from point of advertising spend through to sales
Analysis then Tool – OMG Brand planning
Models of each brand x each metric vs media channels to produce average response curve sets
Tool reports optimal media mix at a given budget for each point of the funnel
Step 1 – set campaign norms
Identify average annual number, duration and budget of campaigns for typically low, medium and high spenders in each category
Step 2 – produce layer chart
Input these numbers into the tool to calculated ideal distribution of media spend by channel for each element of the purchase funnel
Step 3 – highlight OOH
Isolate recommended spend percentage for OOH by budget
Step 4 – repeat 39 times
…for each dimension in each category
Ad Awareness
Brand Awareness
Consideration
Recommendation
Purchase Intention
14%
10% 9%
0%
10%
20%
10 30 50 70 90 110 130 150 170 190Op
tim
al O
OH
%
Total annual budget ($m)
E.g. Auto Brand Awareness
| 16
0%
50%
100%
10 30 50 70 90 110 130 150 170 190
Total annual budget ($m)
E.g. Auto Brand Awareness Search
VOD
Dig dply
OOH
Radio
TV

Results for USA from our analysis, updated to 2017 media landscape
Automotive results. Current OOH in mix is 2%. Recommendations range is 6-14%
| 17* Automotive budgets are the Masterbrand budget e.g. all Ford, all Nissan
Ad Awareness
Spend much more
Put 11% into OOHTake from TV
Search Print
Put 6% into OOHTake additionally
from Display
Put 6% into OOHTake additionally
from Display
Brand Awareness
Spend much more
Put 14% into OOHTake from TV
Search Print
Put 10% into OOHTake additionally
from Display Radio
Put 9% into OOHTake additionally
from Display Radio
Consideration
Spend much more
Put 14% into OOHTake from TV
Search Print Radio
Put 7% into OOHTake additionally
from Display
Put 6% into OOHTake additionally
from Display
Recommendation
Spend much more
Put 10% into OOHTake from TV
Search Print
Put 7% into OOHTake additionally
from Display
Put 7% into OOHTake additionally
from Display
Purchase Intent
Spend much more
Put 10% into OOHTake from TV
Search Print Radio
Put 6% into OOHTake from TV
Search Print Radio
Put 5% into OOHTake from TV
Search Print Radio
Budget
$40m
Budget
$100m
Budget
$150m

Results for USA from our analysis, updated to 2017 media landscape
Consumer Electronics results. Current OOH in mix is 3%. Recommendations range is 4-17%
| 18
Ad Awareness
Spend more
Put 4% into OOHTake from TV
Display Search
Put 4% into OOHTake additionally
from Radio TV
Put 4% into OOHTake additionally
from Radio Digital
Brand Awareness
Spend more
Put 4% into OOHTake from TV
Display Search
Put 4% into OOHTake additionally
from Radio TV
Put 5% into OOHTake additionally
from TV Radio
Display
Consideration
Spend much more
Put 9% into OOHTake from TV
Display Search
Print Radio
Put 11% into OOHTake additionally
from Radio TV
Put 12% into OOHTake additionally
from Radio TV
Recommendation
Spend much more
Put 17% into OOHTake from TV
Display Search
Put 18% into OOHTake additionally
from Radio TV
Put 16% into OOHTake additionally
from Radio
Purchase Intent
Spend more
Put 4% into OOHTake from TV
Display Search
Print Radio
Put 4% into OOHTake additionally
from Radio
Put 5% into OOHTake additionally
from Radio TV
Budget
$20m
Budget
$50m
Budget
$100m

Results for USA from our analysis, updated to 2017 media landscape
CPG Food and Drink results. Current OOH in mix is 2%. Recommendations range is 5-15%
| 19
Ad Awareness
Spend much more
Put 8% into OOHTake from TV Print
Radio
Put 6% into OOHTake additionally
from TV Radio
Display
Put 5% into OOHTake additionally
from Radio Display
Brand Awareness
Spend much more
Put 11% into OOHTake from Radio
Put 10% into OOHTake additionally
from Radio TV
Put 10% into OOHTake additionally
from Radio TV
Consideration
Spend much more
Put 14% into OOHTake from TV
Display Print
Put 9% into OOHTake additionally
from TV Display Print
Put 8% into OOHTake additionally
from TV Display Print
Recommendation
Spend much more
Put 8% into OOHTake from TV
Display Print
Put 7% into OOHTake additionally
from TV Display Print
Put 7% into OOHTake additionally
from TV Radio
Display
Purchase Intent
Spend much more
Put 15% into OOHTake from TV
Display Print
Put 9% into OOHTake additionally
from TV Display
Put 8% into OOHTake additionally
from TV Display
Budget
$10m
Budget
$40m
Budget
$80m

Results for USA from our analysis, updated to 2017 media landscape
Retail Non Grocery. Current OOH in mix is 5%. Recommendations range is 8-24%
| 20
Ad Awareness
Spend much more
Put 15% into OOHTake from TV Print
Put 11% into OOHTake additionally
from TV Print
Put 8% into OOHTake additionally
from TV Print
Brand Awareness
Spend much more
Put 15% into OOHTake from TV Print
Put 14% into OOHTake additionally
from TV Display
Radio
Put 13% into OOHTake additionally
from TV Display
Radio
Consideration
Spend much more
Put 17% into OOH
Take from TV Print
Radio
Put 12% into OOH
Take additionally
from TV Print Radio
Put 11% into OOH
Take additionally
from TV Print Radio
Recommendation
Spend much more
Put 17% into OOHTake from TV Print
Radio
Put 17% into OOHTake additionally
from TV Print
Display
Put 16% into OOHTake additionally
from Display
Purchase Intent
Spend much more
Put 24% into OOHTake from TV Print
Radio
Put 15% into OOHTake additionally
from TV Print Radio
Put 13% into OOHTake additionally
from TV Print Radio
Budget
$30m
Budget
$100m
Budget
$200m
1
2 3 2
54 5
5 5
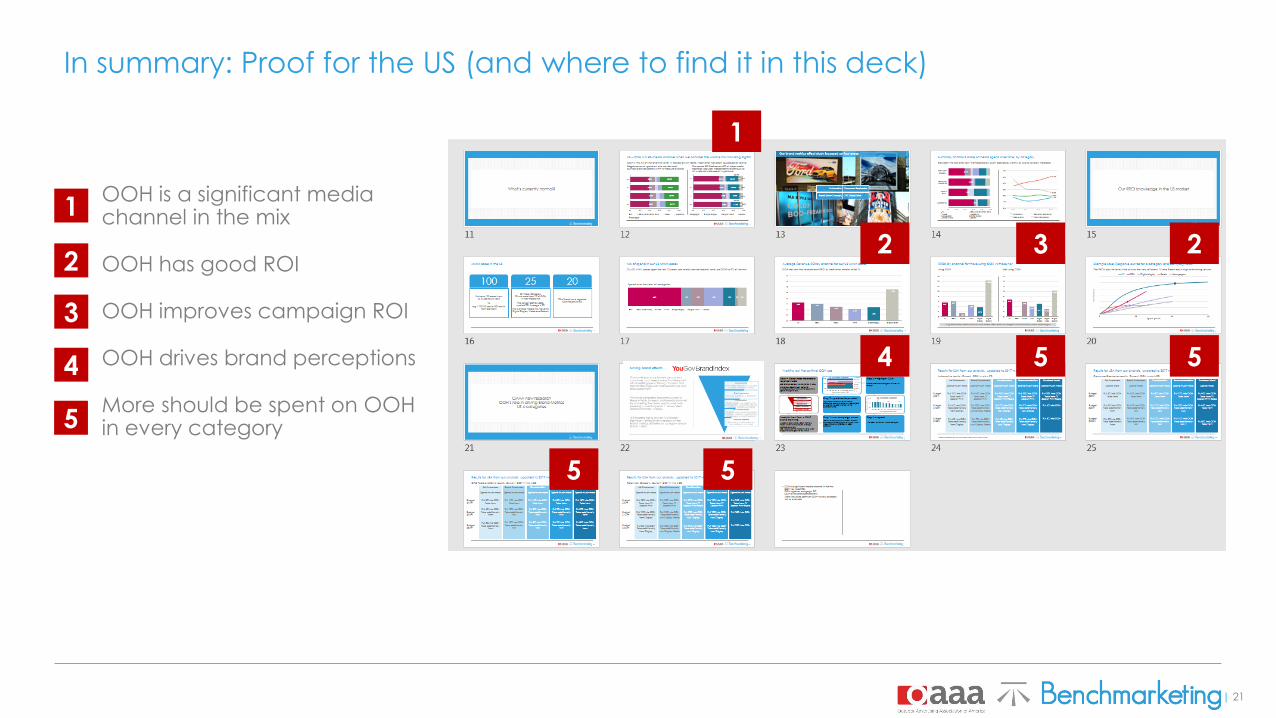
OOH is a significant media channel in the mix
OOH has good ROI
OOH improves campaign ROI
OOH drives brand perceptions
More should be spent on OOH in every category
1
2
3
5
4
| 21
In summary: Proof for the US (and where to find it in this deck)

About Benchmarketing
A division of the Omnicom Media Group, Benchmarketing creates marketing effectiveness knowledge and benchmarks on brands, businesses and categories to power strategic marketing decisions
Data
Organising data to
understand market,
category and brand
dynamics
Benchmarks
What is normal?
What does good look like?
Learning
Case studies and insights
on what works for other
brands in your category
Consultancy
Consultancy projects to
leverage our category
and media channel
knowledge
| 22