out of the deep: cryptic speciation in a neotropical gecko
TRANSCRIPT

Molecular Phylogenetics and Evolution 80 (2014) 113–124
Contents lists available at ScienceDirect
Molecular Phylogenetics and Evolution
journal homepage: www.elsevier .com/ locate /ympev
Out of the deep: Cryptic speciation in a Neotropical gecko (Squamata,Phyllodactylidae) revealed by species delimitation methods
http://dx.doi.org/10.1016/j.ympev.2014.07.0221055-7903/� 2014 Elsevier Inc. All rights reserved.
⇑ Corresponding author.E-mail address: [email protected] (F.M.C.B. Domingos).
Fabricius M.C.B. Domingos a,⇑, Renan J. Bosque b, José Cassimiro c, Guarino R. Colli d, Miguel T. Rodrigues c,Marcella G. Santos b, Luciano B. Beheregaray a
a Molecular Ecology Laboratory, School of Biological Sciences, Flinders University, Adelaide, SA 5001, Australiab Department of Biology, University of Mississippi, Box 1848, University, MS 38677-1848, USAc Departamento de Zoologia, Instituto de Biociências, Universidade de São Paulo, Cidade Universitária, 05508-090 São Paulo, SP, Brazild Departamento de Zoologia, Universidade de Brasília, 70910-900 Brasília, DF, Brazil
a r t i c l e i n f o a b s t r a c t
Article history:Received 14 March 2014Revised 21 July 2014Accepted 29 July 2014Available online 8 August 2014
Keywords:Bayesian species delimitationCoalescent analysesCerradoGymnodactylusMorphologyPhylogeography
Levels of biodiversity in the Neotropics are largely underestimated despite centuries of research interest inthis region. This is particularly true for the Cerrado, the largest Neotropical savanna and a formally recog-nized biodiversity hotspot. Molecular species delimitation methods have become essential tools touncover cryptic species and can be notably robust when coupled with morphological information. Wepresent the first evaluation of the monophyly and cryptic speciation of a widespread Cerrado endemiclizard, Gymnodactylus amarali, using phylogenetic and species-trees methods, as well as a coalescent-based Bayesian species delimitation method. We tested whether lineages resulting from the analyses ofmolecular data are morphologically diagnosed by traditional meristic scale characters. We recovered eightdeeply divergent molecular clades within G. amarali, and two additional ones from seasonally dry tropicalforest enclaves between the Cerrado and the Caatinga biomes. Analysis of morphological data statisticallycorroborated the molecular delimitation for all groups, in a pioneering example of the use of supportvector machines to investigate morphological differences in animals. The eight G. amarali clades appearmonophyletic and endemic to the Cerrado. They display several different properties used by biologiststo delineate species and are therefore considered here as candidates for formal taxonomic description.We also present a preliminary account of the biogeographic history of these lineages in the Cerrado,evidence for speciation of sister lineages in the Cerrado–Caatinga contact, and highlight the need forfurther morphological and genetic studies to assess cryptic diversity in this biodiversity hotspot.
� 2014 Elsevier Inc. All rights reserved.
1. Introduction legal protection (Klink and Machado, 2005), one of the first steps
Biodiversity in the Neotropical region has been a matter of greatinterest of biologists for centuries (Humboldt, 1849; Rull, 2011;Spix and Martius, 1824). The levels of biodiversity in this regionremain relatively unknown (Fouquet et al., 2007, 2014; Schefferset al., 2012) and a large amount of species is still waiting to be dis-covered (Costello et al., 2013; Mora et al., 2011; Wheeler et al.,2012). The Brazilian Cerrado is the largest Neotropical savanna(Eiten, 1972; Oliveira and Marquis, 2002) and one of the world’sformally recognized biodiversity hotspots (Myers et al., 2000).However, most of its area lacks adequate sampling efforts (Costaet al., 2007, 2010), which makes the discovery of new taxa notuncommon. Considering that only 2.2% of the Cerrado is under
towards the conservation of this biome is to investigate the taxo-nomic diversity and phylogenetic relationships of its endemicbiota.
In early studies, the Cerrado herpetofauna was consideredimpoverished compared to surrounding biomes, such as theCaatinga (seasonally dry tropical forests – SDTF) and the Amazon(Vanzolini, 1948, 1976; Vitt, 1991). This paradigm has changedsubstantially with improved sampling efforts (Colli et al., 2002),and currently 267 squamate species (39% endemics) are recog-nized to occur in the Cerrado (Nogueira et al., 2011). Moreover,the number of species descriptions is still increasing (e.g. Colliet al., 2009; Giugliano et al., 2013; Nogueira and Rodrigues,2006; Rodrigues et al., 2007, 2008; Teixeira et al., 2013), as wellas the recognition of previously unknown cryptic lineages(Gamble et al., 2012; Giugliano et al., 2013; Prado et al., 2012),mostly in the light of new data from populations previouslyassigned to the same species.

114 F.M.C.B. Domingos et al. / Molecular Phylogenetics and Evolution 80 (2014) 113–124
Cryptic lineage recognition can be severely impacted bymorphological stasis (Pfenninger and Schwenk, 2007) and as suchit is not surprising that the majority of recent cryptic species stud-ies rely largely on genetic data (Beheregaray and Caccone, 2007;Bickford et al., 2007). Coalescent-based methods have recentlybecome popular to assist in species delimitation (Carstens et al.,2013; Fujita et al., 2012; Knowles and Carstens, 2007; Yang andRannala, 2010), especially regarding cryptic speciation in biodiver-sity hotspots (Nair et al., 2012). Despite the unquestionable valueof those methods in assessing cryptic diversity (Leaché andFujita, 2010), it is advisable to use independent morphological orecological data to corroborate molecular-based hypotheses ofcryptic diversification (Bauer et al., 2011; Burbrink et al., 2011;Sistrom et al., 2012). In this context, morphological data can beused to test the placement of individuals within the reconstructedmolecular clades and evaluate the validity of such lineages (Hebertet al., 2004; Sistrom et al., 2013; Tan et al., 2010). This integrativeapproach can provide valuable support when delimiting ‘candidatespecies’ for conservation management strategies (Morando et al.,2003; Padial et al., 2010).
The gecko Gymnodactylus amarali Barbour, 1925 is a Cerradoendemic with a wide distribution in the central and northern por-tions of the biome (Vanzolini, 2005). It was synonymized withGymnodactylus geckoides Spix, 1825 by Vanzolini (1953), but laterresurrected and restricted to the ‘Alto Parnaíba’ region (close tothe type locality of Barbour, Vanzolini, 2005). A new species,Gymnodactylus carvalhoi Vanzolini, 2005, was described as thewidespread form in the Cerrado (Vanzolini, 2005), but soonsynonymized with G. amarali after Cassimiro and Rodrigues(2009) rechecked the type specimen and found that the diagnosticcharacters were highly variable within all Gymnodactylus sampledin the Cerrado. Thus, five species of Gymnodactylus are currentlyrecognized, all within the Brazilian territory: G. amarali, endemicto the Cerrado; Gymnodactylus darwinii (Gray, 1845), endemic tothe Atlantic Rainforest; G. geckoides, endemic to the Caatinga;and two other species restricted to the Espinhaço mountainrange, known only from the surroundings of their type localities:Gymnodactylus guttulatus Vanzolini, 1982, in the southernmostsegment of the Espinhaço, and Gymnodactylus vanzoliniiCassimiro and Rodrigues, 2009, in the northern portion. Neverthe-less, only one study evaluated phylogenetic relationships withinGymnodactylus, addressing the phylogeography and crypticspeciation of G. darwinii (Pellegrino et al., 2005). The G. darwiniispecies group is monophyletic in relation to at least G. geckoidesfrom Caatinga (Pellegrino et al., 2005), and G. vanzolinii appearsto be more closely related to G. guttulatus (Cassimiro andRodrigues, 2009). Apart from these two assertions, no other evolu-tionary relationships among Gymnodactylus species are known.
The evolution of groups sharing a Caatinga–Cerrado distributionremains a poorly understood subject in South American biogeogra-phy (Werneck, 2011) and few studies have implemented moleculartechniques to investigate the relationship between those biomes(Almeida et al., 2007; Faria et al., 2013; Moraes et al., 2009;Recoder et al., 2014; Werneck et al., 2012). Dissimilarities notedbetween G. amarali and G. geckoides include ecological differencessuch as clutch and egg sizes (Colli et al., 2003), karyological differ-ences in chromosome number and type (Pellegrino et al., 2009),and morphological differences in pholidosis and coloration pat-terns (Cassimiro and Rodrigues, 2009; Vanzolini, 1953, 2005).Nonetheless, it remains unclear whether the widespread Cerradopopulations of G. amarali form a monophyletic group in relationto its Caatinga counterpart. In fact, it was proposed that relict pop-ulations of G. geckoides might be present in the core of the Cerradoregion (Pellegrino et al., 2009), because the karyotype of one spec-imen was identical to the karyotype observed in G. geckoides pop-ulations. In addition, extensive chromosomal polymorphism has
been observed within and between G. amarali populations(Pellegrino et al., 2009), as well as great morphological variationamong populations (Cassimiro and Rodrigues, 2009; Vanzolini,1953, 2005). As such, it is possible that populations treated underthe name G. amarali are paraphyletic in relation to G. geckoides and,moreover, that differences among G. amarali populations reflectthe existence of cryptic species. Thus, in order to investigate theevolution of G. amarali in the Cerrado it is also important to assessits contact zone with G. geckoides, accounting for the shared evolu-tionary history of the two biomes.
Here we investigate the potential cryptic diversity within Gym-nodactylus amarali by implementing a framework that includesmolecular and morphological data, phylogenetic and ‘species tree’methods, and coalescent-based Bayesian species delimitationapproaches. Our hypotheses are that (1) G. amarali in the Cerradois a monophyletic group; (2) there are relict Gymnodactylus gecko-ides populations inside the Cerrado biome, and (3) several crypticspecies exist within G. amarali. Evolutionary relationships arereconstructed using samples spanning the entire distribution ofG. amarali in the Cerrado, Gymnodactylus populations from SDTFenclaves in the contact zone between Cerrado and Caatinga, andpopulations of G. geckoides as outgroups. This framework enabledtesting for an important contact zone between two understudiedbiomes and allowed us to conduct the first assessment of howmolecular diagnosis predicts morphology-based cryptic divergencein a vertebrate endemic to the Cerrado.
2. Material and methods
2.1. Taxon sampling
We obtained samples of Gymnodactylus amarali from 24 sites inthe Cerrado, as well as two populations inhabiting SDTF enclaves(Fig. 1). Three New World gecko species (Phyllodactylidae) wereused as outgroups: Gymnodactylus darwinii, Gymnodactylus gecko-ides and Phyllopezus pollicaris (Spix, 1825). Specimens were curatedat the ‘Coleção Herpetológica da Universidade de Brasília’ (CHUNB)and ‘Museu de Zoologia da Universidade de São Paulo’ (MZUSP).Our final dataset consisted of 83 G. amarali, 4 G. geckoides, 4 G. dar-winii and 3 P. pollicaris. Voucher numbers, localities, geographicalinformation and GenBank accession numbers are in Supplemen-tary Table 1.
2.2. Molecular methods and analyses
We extracted genomic DNA using a modified salting-out tech-nique (Sunnucks and Hales, 1996) and used PCR to amplify frag-ments of the mitochondrial DNA (mtDNA) cytochrome b (cytb)and the exonic locus Kinesin Family Member 24 (KIF24). Primersand PCR cycle protocols are in Supplementary Table 2. The PCRproducts were visualized on a 1.5% agarose gel and sequencedusing Big Dye v3.1 on an ABI 3130xl at the Flinders SequencingFacility, SA Pathology. We assembled and visually inspected chro-matograms using SEQUENCHER 4.9 (Gene Codes Corporation, AnnArbor, MI USA). Sequences were codon aligned using MUSCLE(Edgar, 2004) as implemented in MEGA 5.2.2 (Tamura et al.,2011) applying a gap open penalty of 3 and a gap extension penaltyof 1. Prior to analyses, we tested for third codon saturation usingXia et al. (2003) index of substitution saturation as implementedin DAMBE5 (Xia, 2013). The index suggested that saturation wasnegligible (cytb: Iss 0.165 < Issc 0.810, p < 0.001; KIF24: Iss0.36 < Issc 0.792, p < 0.001) and we proceeded with analyses usingthe complete alignments.
Our molecular hypothesis-testing framework aimed to concom-itantly test the monophyly of G. amarali and identify possible

Fig. 1. Partial map of Brazil with Gymnodactylus and outgroup samples, in the context of the distribution of the Cerrado and Caatinga biomes. Symbols indicate clades selectedby the GMYC analysis. Inset map detail show the populations of ‘Manga’ and ‘Matias Cardoso’ separated by the São Francisco River.
F.M.C.B. Domingos et al. / Molecular Phylogenetics and Evolution 80 (2014) 113–124 115
cryptic lineages within the species, based on the followingapproach: (1) reconstructing phylogenetic trees with the concate-nated dataset using two methods; (2) building a ‘species tree’ thatincorporates individual gene genealogies using a coalescentmethod; and (3) test the fit of the data from both genes to differentevolutionary hypotheses generated by the previous analyses via aBayesian coalescent species delimitation method.
2.2.1. Phylogenetic reconstructionsAll downstream phylogenetic analyses used the partition strat-
egies and models of sequence evolution selected based on theBayesian Information Criterion (BIC) in PartitionFinder (Lanfearet al., 2012, 2014). Partition strategies and evolution models wereseparately estimated for the concatenated and individual locusalignments, and for each phylogenetic software used (MrBayes,RAxML or Beast). Selected evolution models and partitions are inSupplementary Table 3.
We used Bayesian inference implemented in MrBayes v3.2.2(Ronquist et al., 2012), to investigate phylogenetic relationshipswith the concatenated dataset and separately for each gene frag-ment. We conducted two independent runs using four parallelMarkov Chain Monte Carlo (MCMC) chains for 5 million genera-tions, sampling every 500th generation. Substitution rates, charac-ter state frequencies, gamma shape parameters and proportion ofinvariable sites were all unlinked. We used a minimum acceptableeffective sample size (ESS) of 200 for each parameter, and assessedstationarity and convergence of Bayesian analysis respectively byplotting MCMC generations versus the log-likelihood values ofthe data and checking the potential scale reduction factor inMrBayes. Stationarity and convergence were also visuallyinspected by plotting likelihood values in Tracer v1.5 (Rambautand Drummond, 2009). Phyllopezus pollicaris was used as outgroup.
We also implemented a maximum likelihood (ML) phylogeneticanalysis on the concatenated dataset using RAxML (Stamatakis,2014), with unlinked partitions as selected by PartitionFinder.We used 1000 bootstrap replicates in a rapid bootstrap analysis,and a thorough search for the best-scoring ML tree.
2.2.2. Species discovery methods and species treeWe explored the performance of two coalescent species discov-
ery methods (sensu Carstens et al., 2013). First, we used spede-STEM discovery (Satler et al., 2013), a method that usesinformation theory to compare models of lineage compositionthrough Akaike Information Criterion (AIC) and returns the ranked‘species tree’ models. The spedeSTEM software takes as input genetrees that we separately estimated for both genes using RAxML (asabove), and converted to ultrametric trees using package APE(Paradis et al., 2004) in R v3.0.1 (R Core Team, 2013). It alsorequires a h = 4Nel value that we estimated with Migrate-nv3.6.1 (Beerli and Felsenstein, 2001). We ran Migrate-n using arandom starting tree and four multiple Markov chains for 1 � 107
generations sampled every 20th generation, discarding 10% asburn-in. Second, we used the Generalized Mixed Yule Coalescent(GMYC), a method especially developed for only one mitochondriallocus (Pons et al., 2006). Using unique haplotypes of cytb (Supple-mentary Table 1) we built an ultrametric phylogenetic tree inBEAST v1.7.5 (Drummond et al., 2012) required to run the GMYCalgorithm. This algorithm estimates the number of ‘‘species’’ byclassifying the branching rates of a phylogram as being the resultof interspecific or intraspecific lineage branching patterns (Ponset al., 2006).
We implemented two versions of the GMYC algorithm: the orig-inally proposed ML-based calculation in package splits (Fujisawaand Barraclough, 2013; Pons et al., 2006), and a Bayesian imple-mentation that accounts for uncertainty in phylogenetic estima-tion in package bGMYC (Reid and Carstens, 2012), using R v3.0.1(R Core Team, 2013). In BEAST, we ran phylogenetic analysis undera strict molecular clock set to an evolutionary rate of 1.0 (i.e., noattempt to estimate divergence time) considering a coalescent treewith constant population size, using an UPGMA starting tree, andwith 1 � 107 Markov Chain Monte Carlo (MCMC) generations sam-pled every 1,000th generation. We implemented three indepen-dent runs and combined results using LogCombiner v1.7.5(Drummond et al., 2012), burning the first 10% of the samplesand subsequently used Tracer v1.5 (Rambaut and Drummond,

116 F.M.C.B. Domingos et al. / Molecular Phylogenetics and Evolution 80 (2014) 113–124
2009) to check for minimum adequate ESS (200) and visuallyinspect stationarity and convergence by plotting likelihood values.We summarized the resulting trees into a target maximum cladecredibility tree to use in the ML implementation, and alternativelykept 100 random trees for the Bayesian implementation, using Tre-eAnnotator v1.7.5 (Drummond et al., 2012). For the ML-GMYC wealso performed a log-likelihood ratio test of the fitted modelagainst a null model of no distinct species clusters, and calculatedAIC-based support values for the species clusters with a p < 0.05(Fujisawa and Barraclough, 2013).
To investigate the phylogenetic relationship between the spe-cies retrieved by the GMYC analyses in a multilocus perspective,and also estimate divergence times between the putative species,we ran a *Beast analysis (Heled and Drummond, 2010) as imple-mented in BEAST v.1.7.5. The lack of Gymnodactylus fossils pre-vented a more robust calibration, and we estimated divergencetimes based in the putative substitution rate of 2% changes mil-lion/year (Johns and Avise, 1998). We used the evolutionary mod-els selected for each locus under a relaxed lognormal molecularclock set for cytb, and the KIF24 evolution rate dependent on cytb.We selected a Yule process prior for the tree using an UPGMA start-ing tree and performed the analysis with 5 � 107 MCMC genera-tions sampled every 1,000th generation. We implemented threeindependent runs and combined results using LogCombinerv1.7.5 (Drummond et al., 2012), burning the first 10% of the sam-ples. We summarized resulting trees into a target tree using Tre-eAnnotator v1.7.5 (Drummond et al., 2012), and used Tracer v1.5(Rambaut and Drummond, 2009) to check for minimum adequateESS (200) and visually inspect stationarity and convergence.
We also calculated cytb and KIF24 net between-group distancesusing lineages selected by the GMYC analysis with MEGA 5.2.2(Tamura et al., 2011). We computed both uncorrected p-distancesand ML corrected distances with standard error estimates calcu-lated using 1,000 bootstrap replicates.
2.2.3. Bayesian coalescent species delimitationWe used a coalescent approach implemented in the software
Bayesian Phylogenetics and Phylogeography (BPP) (Yang andRannala, 2010) to test the performance of different ‘species trees’by assessing their posterior probabilities considering both loci. Thismethod accommodates the species phylogeny, as well as lineagesorting due to ancestral polymorphism, by comparing the posteriorprobability of an a priori user-specified phylogenetic (‘species’) treewith the posterior probability of all possible variations of the sametree when branches of a particular node are collapsed (Yang andRannala, 2010). After initial trials testing different parameters(Supplementary Material), we used a gamma prior of G(2,1000)for population size (hs) and the age of the root in the species tree(s0), and the Dirichlet prior (Yang and Rannala, 2010: Equation 2)for other divergence time parameters. We ran analyses for5 � 105 MCMC generations, taking samples every five and using1 � 104 burn-in generations. To check for consistency of results,we conducted three independent runs, starting at two random treemodels, and the fully resolved tree model, using both availablereversible-jump MCMC species delimitation algorithms (Yangand Rannala, 2010). We repeated this process for three different‘species trees’: (1) the one generated by spedeSTEM, and two con-sidering the GMYC groups – (2) with the *Beast topology and, (3)the tree topology generated by the concatenated dataset (ML andBayesian analysis).
2.3. Morphological analyses
We performed analyses to evaluate whether divergence pat-terns based on morphology were concordant with the retrievedmolecular lineages. From the 94 samples used in the molecular
analyses we had access to 81 preserved museum specimens.Because we did not have access to the same Gymnodactylus darwin-ii specimens, we generated data from other three available speci-mens (Supplementary Table 1). Thus, our total morphologicaldataset comprised 84 specimens from all the cryptic and describedspecies. With the aid of a stereomicroscope, a single person(FMCBD) processed all specimens and generated the data to avoidbias. Morphological characters were selected in order to maximizevariation among G. amarali morphotypes. The data consisted of 21pholidosis variables and 8 categorical variables (see Appendix A fora detailed description of characters). From a total of 2,436 observa-tions (29 characters of 84 specimens), 255 (10.5%) were missingvalues because of damaged specimens. In multivariate approaches,a missing value usually means that the whole case should be omit-ted, resulting in loss of information (Rubin, 2003) and biased evo-lutionary estimations (Nakagawa and Freckleton, 2008). To avoidsuch problems, we imputed missing values through chained equa-tions using a predictive mean matching algorithm implemented inR package mice (Buuren and Groothuis-Oudshoorn, 2011). All mor-phological analyses were carried out in R v3.0.1 (R Core Team,2013).
Because specimen-lineage affiliation retrieved by the GMYC andall phylogenetic analyses were exactly the same (see Section 3.2),we could assign each individual to a unique ‘species’ in the follow-ing analyses. In a multivariate space, to statistically classify andpredict cases belonging to different groups, one would generallyemploy a Discriminant Function Analysis (DFA) (Quinn andKeough, 2002). However, the DFA linear analytical process assumesnormality, no collinearity, and homoscedasticity; in addition, itcannot be applied when the number of cases is smaller than thenumber of variables (Quinn and Keough, 2002). Meristic charactersare known not to be normally distributed (Houle, 1992), and forsome clades we had a maximum number of two individuals. Toovercome those limitations, we employed a Support VectorMachine (SVM), which is a sophisticated model-training approachfor classifying and predicting sample-affiliation based on learningtheory (Schölkopf et al., 2000). The SVM builds a kernel functionthat maps cases into a high-dimensional space, subsequently find-ing a ‘‘margin’’ in the hyperspace that maximizes the separationbetween the groups (Cortes and Vapnik, 1995). Although success-fully used in computational biology (Ben-Hur et al., 2008), someareas of molecular biology (Park and Kanehisa, 2003; Xue et al.,2005), and ecological distribution modeling (Giovanelli et al.,2010; Kelly et al., 2007), to the best of our knowledge, this is thefirst time that SVM is used to investigate morphological segrega-tion in animals.
We performed the SVM analysis using R package e1071 (Meyeret al., 2014). Initially, we implemented a manual search for the bestfine tune parameters for the model, i.e. the ones that minimizedthe error-rate estimated via cross-validation (Chang and Lin,2011). We then trained the model using the fine tuned C-classifica-tion SVM algorithm on the whole morphological dataset, setting‘species’ to be explained by the 29 morphological characters.Lastly, we tested the predictive power of the generated modelusing the default predict.svm function of the package, which pre-dicts case affiliation to groups (individual to ‘species’) based inthe model trained by the SVM. More details about the SVM analysisand implementation are in the Supplementary Material.
3. Results
3.1. Taxon sampling and molecular data
We sequenced both fragments for all Gymnodactylus amarali(n = 83) and G. geckoides (4) specimens, and downloaded GenBank

F.M.C.B. Domingos et al. / Molecular Phylogenetics and Evolution 80 (2014) 113–124 117
sequences for Phyllopezus pollicaris (3). We did not have access to G.darwinii tissue samples and available cytb sequences wereobtained from GenBank (n = 4). The aligned cytb fragment was749 bp long from which 369 were variable sites, and KIF24 was486 bp with 123 variable sites (i.e. 1,235 aligned base pairs inthe concatenated dataset). A few contiguous deletions comprisingdifferent numbers of codons were found in KIF24: P. pollicaris pre-sented two gaps, one with two codons and another with threecodons; the two Gymnodactylus populations from SDTF enclaves(‘Manga’ and ‘Matias Cardoso’) presented different non-shared pat-terns of deletions, where ‘Matias Cardoso’ had two gaps of twocodons each, and ‘Manga’ had only one gap of four codons inanother position, the latter shared by G. geckoides. All specimensof G. amarali presented no deletions.
3.2. Monophyly of Gymnodactylus amarali and cryptic speciesrecognition in the G. amarali species group.
All phylogenetic analyses (using both the concatenated datasetand the two genes separately) supported the monophyly ofGymnodactylus amarali from the Cerrado region, excluding thetwo populations from SDTF enclaves (‘Manga’ and ‘Matias Car-doso’) (Fig. 2, Supplementary Fig. 1). Bayesian and ML phylogeneticanalyses of the concatenated dataset returned the same topology(Fig. 2).
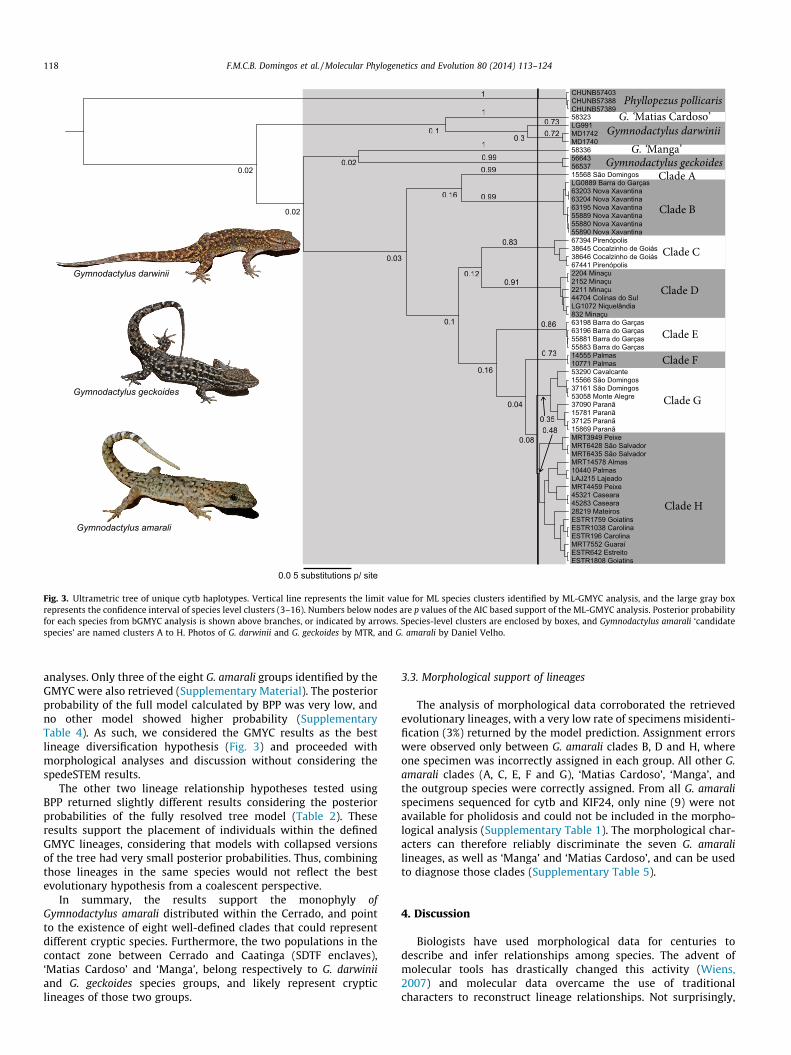
The ML-GMYC analysis returned 14 ML entities (‘species’),including outgroups, with a confidence interval from three to 36.The log-likelihood ratio test was significant (p = 0.037), i.e. the nullhypothesis of a single species was rejected. Most ‘species’ nodeshad p < 0.05 in the AIC based support value of the ML-GMYC anal-ysis, and high posterior probability in the bGMYC (Fig. 3). The 14entities were: Phyllopezus pollicaris, two Gymnodactylus darwiniiclusters, ‘Matias Cardoso’, G. geckoides, ‘Manga’, and eight clustersfor G. amarali, which were named A to H (Fig. 3).
0.07 substitutions/site
Fig. 2. Maximum likelihood tree of the concatenated dataset for all samples. Bayesian anBayesian posterior probabilities. Clades A to H refer to Gymnodactylus amarali clades ide
‘Matias Cardoso’ and ‘Manga’ were very divergent from theGymnodactylus amarali clusters: cytb uncorrected distances rangedfrom 19.1% to 21.4% and ML corrected distances from 27.4% to32.1% for the former and 18.3% to 21.5% and from 25.7% to 32.8%,respectively, for the latter. Cytb levels of uncorrected sequencedivergence were lower among G. amarali clusters, ranging from1.8% to 17.5% and ML corrected distances from 2.1% to 23.7%(Table 1). Levels of divergence were lower for KIF24: uncorrectedand ML corrected distances respectively ranged from 5.8% to 8.0%and from 6.7% to 9.1% for ‘Matias Cardoso’, from 5.9% to 8.0% andfrom 6.7% to 9.1% for ‘Manga’, and from 0.2% to 4.2% and from0.2% to 4.7% among G. amarali clusters. Interestingly, ‘Manga’ ismore related to G. geckoides of the Caatinga, and ‘Matias Cardoso’to G. darwinii of the Atlantic Rainforest (Figs. 2–4 and Supplemen-tary Material).
The *Beast ‘species tree’ also supports the monophyly of Gymno-dactylus amarali with ‘Matias Cardoso’ and ‘Manga’ nested outsidethe G. amarali clade (Fig. 4). The position of some G. amarali cladesdiffered between the *Beast and the concatenated dataset phyloge-netic tree (Table 2) because clades that shared specimens fromgeographically close localities were recovered as sister species (Band E, F and H; Fig. 1). Divergence time between the most basalclade of G. amarali and remaining clades was �5 million years(MY) ago, while most other clades diverged within the last 2 MY(Fig. 4). Support was high (>0.95) for most nodes in the ⁄Beast con-sensus tree. Considering that our main interest was in the relation-ships among Gymnodactylus amarali clades, although we couldhave used a G. darwinii KIF 24 alignment with nothing but missingdata, because we only had two loci and the position of G. darwiniias the sister group of ‘Gymnodactylus Matias Cardoso’ was unlikelyto change, we adopted a conservative approach and omittedG. darwini from this analysis.
The spedeSTEM analysis returned 14 groups as the most likelymodel, but lineage composition was different from previous
G. amarali Clade H
G. amarali Clade G
G. amarali Clade F
G. amarali Clade E
G. amarali Clade D
G. amarali Clade C
G. amarali Clade B
G. amarali Clade A
alysis returned the same topology. Numbers in nodes are ML bootstrapping scores/ntified by GMYC analysis.
1Phyllopezus pollicaris
G. ‘Matias Cardoso’ Gymnodactylus darwinii
G. ‘Manga’ Gymnodactylus geckoides
Clade A
Clade B
Clade C
Clade D
Clade E
Clade F
Clade G
Clade H
0.02
0.10.3
0.16
0.02
0.02
0.03
0.12
0.1
0.16
0.04
0.08
1
1
0.99
0.99
0.99
0.91
0.86
0.83
0.73
0.730.72
0.350.48
Gymnodactylus darwinii
Gymnodactylus geckoides
Gymnodactylus amarali
0.0 5 substitutions p/ site
0.73
0.91
0.99
0.16
0.83
0.020.99
0.350.48
0.73
0.99
0.72
1
0.10.3
1
0.12
0.86
37090 Paranã15781 Paranã37125 Paranã15869 Paranã
63203 Nova Xavantina 63204 Nova Xavantina 63195 Nova Xavantina 55889 Nova Xavantina 55880 Nova Xavantina 55890 Nova Xavantina
MRT3949 Peixe MRT6428 São Salvador MRT6435 São Salvador MRT14578 Almas10440 Palmas LAJ215 Lajeado MRT4459 Peixe 45321 Caseara 45283 Caseara 28219 Mateiros ESTR1759 Goiatins ESTR1038 Carolina ESTR196 Carolina MRT7552 Guaraí ESTR642 Estreito ESTR1808 Goiatins
58323 LG991MD1742MD1740 5833656643 5653715568 São Domingos LG0889 Barra do Garças
67394 Pirenópolis38645 Cocalzinho de Goiás 38646 Cocalzinho de Goiás 67441 Pirenópolis2204 Minaçu2152 Minaçu2211 Minaçu44704 Colinas do SulLG1072 Niquelândia832 Minaçu63198 Barra do Garças 63196 Barra do Garças 55881 Barra do Garças 55883 Barra do Garças
CHUNB57403CHUNB57388CHUNB57389
14555 Palmas10771 Palmas53290 Cavalcante 15566 São Domingos 37161 São Domingos 53058 Monte Alegre
Fig. 3. Ultrametric tree of unique cytb haplotypes. Vertical line represents the limit value for ML species clusters identified by ML-GMYC analysis, and the large gray boxrepresents the confidence interval of species level clusters (3–16). Numbers below nodes are p values of the AIC based support of the ML-GMYC analysis. Posterior probabilityfor each species from bGMYC analysis is shown above branches, or indicated by arrows. Species-level clusters are enclosed by boxes, and Gymnodactylus amarali ‘candidatespecies’ are named clusters A to H. Photos of G. darwinii and G. geckoides by MTR, and G. amarali by Daniel Velho.
118 F.M.C.B. Domingos et al. / Molecular Phylogenetics and Evolution 80 (2014) 113–124
analyses. Only three of the eight G. amarali groups identified by theGMYC were also retrieved (Supplementary Material). The posteriorprobability of the full model calculated by BPP was very low, andno other model showed higher probability (SupplementaryTable 4). As such, we considered the GMYC results as the bestlineage diversification hypothesis (Fig. 3) and proceeded withmorphological analyses and discussion without considering thespedeSTEM results.
The other two lineage relationship hypotheses tested usingBPP returned slightly different results considering the posteriorprobabilities of the fully resolved tree model (Table 2). Theseresults support the placement of individuals within the definedGMYC lineages, considering that models with collapsed versionsof the tree had very small posterior probabilities. Thus, combiningthose lineages in the same species would not reflect the bestevolutionary hypothesis from a coalescent perspective.
In summary, the results support the monophyly ofGymnodactylus amarali distributed within the Cerrado, and pointto the existence of eight well-defined clades that could representdifferent cryptic species. Furthermore, the two populations in thecontact zone between Cerrado and Caatinga (SDTF enclaves),‘Matias Cardoso’ and ‘Manga’, belong respectively to G. darwiniiand G. geckoides species groups, and likely represent crypticlineages of those two groups.
3.3. Morphological support of lineages
The analysis of morphological data corroborated the retrievedevolutionary lineages, with a very low rate of specimens misidenti-fication (3%) returned by the model prediction. Assignment errorswere observed only between G. amarali clades B, D and H, whereone specimen was incorrectly assigned in each group. All other G.amarali clades (A, C, E, F and G), ‘Matias Cardoso’, ‘Manga’, andthe outgroup species were correctly assigned. From all G. amaralispecimens sequenced for cytb and KIF24, only nine (9) were notavailable for pholidosis and could not be included in the morpho-logical analysis (Supplementary Table 1). The morphological char-acters can therefore reliably discriminate the seven G. amaralilineages, as well as ‘Manga’ and ‘Matias Cardoso’, and can be usedto diagnose those clades (Supplementary Table 5).
4. Discussion
Biologists have used morphological data for centuries todescribe and infer relationships among species. The advent ofmolecular tools has drastically changed this activity (Wiens,2007) and molecular data overcame the use of traditionalcharacters to reconstruct lineage relationships. Not surprisingly,

Table 1Net among-group distances between GMYC clades for cytb data. ML corrected distances using the Tamura-Nei model are above the diagonal, and uncorrected p-distances below.Standard error estimates, calculated using 1000 bootstrap replicates, are shown in parentheses.
Taxa G. amarali Clade A G. amarali Clade B G. amarali Clade C G. amarali Clade D G. amarali Clade E G. amarali Clade F G. amarali Clade G
G. amarali Clade A – 0.158 (0.019) 0.237 (0.027) 0.230 (0.026) 0.255 (0.028) 0.233 (0.026) 0.211 (0.024)G. amarali Clade B 0.122 (0.011) – 0.220 (0.026) 0.174 (0.021) 0.203 (0.023) 0.192 (0.022) 0.178 (0.022)G. amarali Clade C 0.163 (0.012) 0.153 (0.013) – 0.131 (0.017) 0.162 (0.020) 0.157 (0.019) 0.141 (0.018)G. amarali Clade D 0.161 (0.012) 0.131 (0.012) 0.102 (0.010) – 0.154 (0.018) 0.150 (0.019) 0.127 (0.016)G. amarali Clade E 0.175 (0.013) 0.149 (0.013) 0.122 (0.011) 0.119 (0.011) – 0.122 (0.015) 0.092 (0.012)G. amarali Clade F 0.166 (0.013) 0.142 (0.012) 0.119 (0.011) 0.115 (0.011) 0.097 (0.010) – 0.054 (0.010)G. amarali Clade G 0.150 (0.012) 0.131 (0.011) 0.106 (0.010) 0.099 (0.010) 0.075 (0.009) 0.047 (0.007) –G. amarali Clade H 0.144 (0.012) 0.133 (0.011) 0.103 (0.010) 0.100 (0.010) 0.079 (0.009) 0.044 (0.006) 0.018 (0.003)Manga 0.211 (0.014) 0.188 (0.013) 0.215 (0.014) 0.183 (0.014) 0.215 (0.013) 0.211 (0.014) 0.189 (0.013)Matias Cardoso 0.194 (0.014) 0.204 (0.014) 0.212 (0.014) 0.202 (0.015) 0.212 (0.015) 0.214 (0.015) 0.191 (0.014)G. geckoides 0.195 (0.012) 0.183 (0.013) 0.187 (0.013) 0.173 (0.012) 0.199 (0.013) 0.189 (0.013) 0.182 (0.013)G. darwinii A 0.212 (0.015) 0.208 (0.015) 0.222 (0.015) 0.200 (0.014) 0.223 (0.014) 0.214 (0.015) 0.183 (0.014)G. darwinii B 0.211 (0.014) 0.204 (0.014) 0.226 (0.014) 0.197 (0.014) 0.222 (0.014) 0.203 (0.014) 0.185 (0.014)Phyllopezus
pollicaris0.261 (0.015) 0.253 (0.015) 0.239 (0.014) 0.243 (0.015) 0.265 (0.015) 0.256 (0.015) 0.246 (0.015)
Taxa G. amarali Clade H Manga Matias Cardoso G. geckoides G. darwinii A G. darwinii B Phyllopezuspollicaris
G. amarali Clade A 0.203 (0.023) 0.310 (0.030) 0.274 (0.029) 0.280 (0.028) 0.315 (0.032) 0.312 (0.033) 0.417 (0.041)G. amarali Clade B 0.187 (0.022) 0.263 (0.026) 0.299 (0.030) 0.257 (0.026) 0.308 (0.030) 0.294 (0.029) 0.397 (0.040)G. amarali Clade C 0.139 (0.018) 0.328 (0.032) 0.321 (0.033) 0.270 (0.027) 0.351 (0.037) 0.358 (0.038) 0.369 (0.036)G. amarali Clade D 0.132 (0.016) 0.257 (0.027) 0.307 (0.034) 0.246 (0.026) 0.300 (0.032) 0.291 (0.031) 0.381 (0.040)G. amarali Clade E 0.099 (0.013) 0.319 (0.029) 0.312 (0.031) 0.290 (0.029) 0.344 (0.033) 0.335 (0.032) 0.429 (0.041)G. amarali Clade F 0.050 (0.009) 0.310 (0.030) 0.319 (0.032) 0.272 (0.028) 0.323 (0.033) 0.293 (0.030) 0.403 (0.040)G. amarali Clade G 0.021 (0.004) 0.269 (0.026) 0.274 (0.028) 0.264 (0.027) 0.265 (0.027) 0.265 (0.027) 0.389 (0.039)G. amarali Clade H – 0.281 (0.027) 0.286 (0.029) 0.266 (0.027) 0.285 (0.030) 0.282 (0.029) 0.417 (0.042)Manga 0.192 (0.013) – 0.275 (0.028) 0.248 (0.026) 0.278 (0.028) 0.284 (0.029) 0.430 (0.043)Matias Cardoso 0.192 (0.014) 0.194 (0.014) – 0.262 (0.026) 0.163 (0.018) 0.172 (0.020) 0.368 (0.035)G. geckoides 0.180 (0.012) 0.178 (0.013) 0.186 (0.013) – 0.273 (0.027) 0.270 (0.027) 0.408 (0.041)G. darwinii A 0.189 (0.014) 0.195 (0.014) 0.126 (0.012) 0.190 (0.014) – 0.061 (0.009) 0.393 (0.038)G. darwinii B 0.190 (0.013) 0.199 (0.014) 0.132 (0.012) 0.190 (0.013) 0.055 (0.008) – 0.403 (0.038)Phyllopezus
pollicaris0.252 (0.015) 0.266 (0.016) 0.241 (0.016) 0.254 (0.015) 0.248 (0.015) 0.255 (0.015) –
3. 0 substitutions/site
0.02.55.07.510.012.515.017.520.022.525.027.5
Phyllopezus pollicaris
0.9 3/1
0.9 9/1
1/1
0.9 9/1
0.9 8/1
0.9 5/0.99
0.9 6/1
0.9 3/0.91
1/1
0.9 2/1
0.9 3/1
Pleist.Plioc.MioceneOligocene
Gymnodactylus‘Matias Cardoso’
Gymnodactylus ‘Manga’
Gymnodactylus geckoides
G. amarali A
G. amarali D
G. amarali C
G. amarali B
G. amarali E
G. amarali G
G. amarali F
G. amarali H
Fig. 4. Phylogenetic relationships and divergence times between Gymnodactylus clades estimated using a Bayesian ‘species tree’ coalescent analysis with *Beast. Numbersinside nodes indicates Bayesian posterior probabilities/posterior probabilities of the species splits estimated by BPP. Clades A to H refer to Gymnodactylus amarali cladesidentified by GMYC analysis. Photo of G. amarali by Daniel Velho.
F.M.C.B. Domingos et al. / Molecular Phylogenetics and Evolution 80 (2014) 113–124 119
the use of molecular tools also became the major approach to rec-ognize cryptic species (Bickford et al., 2007). On the other hand,morphological data are still essential for species description andplay an important role to make uncovered cryptic lineagesidentifiable and available for scientific and conservation purposes(Beheregaray and Caccone, 2007).
Under the Generalized Lineage Concept (De Queiroz, 2007) wepresented species hypotheses using two lines of evidence, geneticand morphological, and provided the first example of crypticspecies identified by coalescent lineage delimitation analyses in aCerrado endemic vertebrate. Moreover, no ‘species’ are sharedbetween the Cerrado and the Caatinga, reinforcing a still

Table 2Different ‘species trees’ used in the Bayesian species delimitation analysis (BPP), based on the groups defined by the GMYC analysis. The lowest and highest posterior probabilityof the model for different BPP runs is shown. Phy = Phyllopezus pollicaris, Dar = Gymnodactylus darwinii, MaC = ‘Matias Cardoso’, Gec = Gymnodactylus geckoides, Ma = ‘Manga’, A toH = G. amarali clades A to H.
Analysis with concatenated dataset Resulting species tree Posterior probabilities of full model
Bayesian and ML (Phy,((MaC,(DarA,DarB)),((Ma,Gec),(A,(B,((C,D),(E,(F,(G,H))))))))) 0.963–0.982*Beast (Phy,(MaC,((Ma,Gec),(A,((C,D),((E,B),(G,(F,H)))))))) 0.891–0.914
120 F.M.C.B. Domingos et al. / Molecular Phylogenetics and Evolution 80 (2014) 113–124
understudied evolutionary pattern between these two biomes(Werneck, 2011; Werneck and Colli, 2006).
4.1. Monophyly of Gymnodactylus amarali in the Cerrado
Molecular and morphological results corroborate the mono-phyly of Gymnodactylus amarali within the Cerrado region andthe existence of multiple cryptic lineages within this taxon. Thetwo populations sampled in the contact zone between Cerradoand Caatinga, SDTF enclaves, do not belong to the G. amarali spe-cies group but are recovered as sister groups to G. geckoides(‘Manga’) and G. darwinii (‘Matias Cardoso’).
Our samples cover the whole distribution of the species, whichsuggests that the herein recognized G. amarali species complex isthe only Gymnodactylus lineage to inhabit the Cerrado biome. Wefound no evidence for the existence of G. geckoides populations inthe Cerrado as previously suggested by Pellegrino et al. (2009).These authors found one specimen in ‘Barra do Garças’ (one ofour sampled locations in central Cerrado) to have an identicalkaryotype to G. geckoides, and suggested it was a potential relictpopulation of G. geckoides. Considering the heterogeneous land-scape that characterizes the region of ‘Barra do Garças’ and thattwo different clades of G. amarali (B and E) inhabit the area, thepresence of an additional species remains to be tested. Additionalsampling and chromosome data from ‘Barra do Garças’ as well asa complete phylogeny of the genus are critical to understand geo-graphical patterns of karyotypic evolution in Gymnodactylus. Test-ing phylogenetic hypotheses for the genus would require amultilocus dataset for all five currently described taxa, as well asfor different cryptic species recognized for G. darwinii (Pellegrinoet al., 2005) and G. amarali (this study). Nonetheless, our resultssuggest a (G. darwinii, (G. geckoides, G. amarali)) topology.
4.2. Cryptic species in the Gymnodactylus amarali species complex
We uncovered eight cryptic lineages within Gymnodactylusamarali. Levels of mtDNA divergence between recovered clades(2.1–23.7%, Table 1) were higher than usually observed betweenspecies of lizards or other vertebrate groups (Avise et al., 1998;Fouquet et al., 2007; Oliver et al., 2009) and consistent with thoserecently reported for cryptic lineages of New World geckos(Gamble et al., 2012; Werneck et al., 2012).
Regarding lineage relationships, the phylogenetic and ‘speciestree’ methods resulted in different placements of some clades(Table 2). This is a common issue comparing ‘gene trees’ and ‘spe-cies trees’ (Degnan and Rosenberg, 2009; Pamilo and Nei, 1988)and can probably be suppressed by the use of more loci (but seeDegnan and Rosenberg, 2006).
Despite this topological disagreement between the results ofthe two methods, the Bayesian species delimitation analysis per-formed by BPP resulted in similar posterior probabilities for bothhypotheses (Table 2). From a coalescent perspective, these resultsimply that every option where different clades are collapsed intoone would be a worse diversification scenario. A similar resultwas found for geckos of the Hemidactylus fasciatus complex, whereBPP also returned very limited differences between different
phylogenetic hypotheses (Leaché and Fujita, 2010). Based on a ser-ies of simulations and different a priori phylogenetic trees, theauthors concluded that when divergent populations are placed assister taxa, large divergences among the species are artificially cre-ated, and the algorithm interprets those divergences as speciationevents. This suggestion likely reflects the trend of our results, andreinforces the placement of the eight different clades as ‘candidatespecies’ in the G. amarali complex (Fig. 4, Supplementary Fig. 2).Another simulation study showed that even when only one indi-vidual is sampled, the accuracy of BPP using two loci is almost asgood as using 10 loci (Camargo et al., 2012). Divergence timesand migration rates also did not substantially influence the perfor-mance of the algorithm (Camargo et al., 2012), and we believe ourresults depict a real trend in the evolution of G. amarali, in spite ofour limited number of loci and the fact that we had as few as 2individuals for at least one ‘species’.
Incomplete lineage sorting (Degnan and Rosenberg, 2009) andgene flow among lineages (Leaché et al., 2014) are also known toaffect ‘species tree’ reconstruction. These two processes wouldhave an effect on the input phylogenetic tree to be used in BPP,interfering with the species delimitation algorithm (Leaché andFujita, 2010; Yang and Rannala, 2010). On the other hand, concor-dant reciprocal monophyly between lineages in different genetrees is not essential when delimiting species (Knowles andCarstens, 2007) and the morphological analyses supported theplacement of individuals in the clades using a different dataset.This suggests that our hypotheses testing framework was strongenough to support the recovered clades as distinct evolutionarylineages. Finally, given that the multi-species coalescent is morelikely to recover a pattern of diversification than gene genealogies(McVay and Carstens, 2013), we suggest that the *Beast topology isa better provisionary arrangement for the G. amarali ‘candidatespecies’, and discuss the evolution of the group considering thisphylogenetic hypothesis below.
4.3. Evolution of Gymnodactylus amarali in the Cerrado
This study was not aimed at reconstructing the biogeographichistory of Gymnodactylus amarali but it has enabled a number ofinferences about the evolution of the species in the Cerrado. Thefact that G. amarali inhabiting the Cerrado form a monophyleticgroup suggests that they diversified within this biome, likely influ-enced by landscape evolution of the Cerrado (Prado et al., 2012;Werneck et al., 2012). Moreover, the two populations from SDTFenclaves in the border of Cerrado are clearly distinct lineages, sup-porting the view that G. amarali does not occur in SDTF physiogno-mies. The transition between the Caatinga and Cerrado is notmarked by topographical barriers (Ab’Sáber, 1974, 1998), indicat-ing that environmental filters are probably responsible for theabsence of G. geckoides from the Cerrado and the absence ofG. amarali from the Caatinga (Colli et al., 2003).
Traditional hypotheses for the origins of the high Neotropicalbiodiversity include vegetation refugia created by Pleistocene cli-matic fluctuations (Vanzolini, 1968; Williams and Vanzolini,1966), a scenario suggested to account for the diversification of for-est animals (Fouquet et al., 2012; Haffer, 1969; Moraes-Barros

F.M.C.B. Domingos et al. / Molecular Phylogenetics and Evolution 80 (2014) 113–124 121
et al., 2006) and SDTF endemic Drosophila species (Franco andManfrin, 2013; Moraes et al., 2009). However, recent studies pointtowards ancient events of lineage diversification for Cerrado verte-brates, dating back to the Neogene (Giugliano et al., 2013; Pradoet al., 2012; Werneck et al., 2012). Three main Neogene vicariantevents were proposed to influence the diversification of endemicherpetofauna in the Cerrado: the formation of a latitudinal temper-ature gradient in the early Paleogene, the Miocene marine trans-gression, and the final uplift of the Central Brazilian Plateau inthe Miocene-Pliocene transition (Colli, 2005). The latter event isresponsible for the major compartmentalization currentlyobserved in the Cerrado landscape: a mosaic of plateaus separatedby valleys excavated by river drainages (Ab’Sáber, 1998; King,1956). It is possible that an ancestral G. amarali lineage was distrib-uted over the landscape before the compartmentalization, which isconsistent with our estimated divergence times starting at approx-imately five MY ago (Fig. 4). This assumption is also corroboratedby estimated divergence times for other Cerrado vertebrates(Giugliano et al., 2013; Prado et al., 2012) and Neotropical geckos(Werneck et al., 2012).
Clades A, D and C are distributed in different plateaus and showdeep divergences (Figs. 1 and 4). Clade E lizards were collected in aplateau �630 m above sea level that is only �50 km apart from the�300 m valley inhabited by lizards from a sister clade (clade B).These two groups showed a cytb genetic distance of 20% and only0.02% for the nuclear gene KIF24. Similarly, sister clades F and H,(5% divergent at cytb and 0.08% at KIF24), were also distributedacross different elevations (650 m and mostly 150–350 m, respec-tively; Supplementary Table 1). The above results might reflectancient events of gene flow during early stages of landscape com-partmentalization, a pattern still apparent in the slower evolvingnuclear gene (Supplementary Fig. 1). Gene flow estimation usingstatistical phylogeography are beyond the aims of this study andwould be an ideal tool to evaluate such a pattern (Knowles andMaddison, 2002).
4.4. Status of Gymnodactylus amarali species group and conservationin the Brazilian Cerrado
Using ‘species tree’ reconstructions based on molecular dataand a Bayesian species delimitation method we identified tennovel clades in the genus Gymnodactylus in a pattern concordantwith morphology. In addition, the low assignment error (3%) ofthe SVM analysis shows that these lineages are morphologicallydistinguishable. We acknowledge that prompt descriptions ofidentified cryptic species are needed to avoid delays of taxonomicavailability (Schlick-Steiner et al., 2007), but assessing morpholog-ical diagnostic characters is essential when proposing taxonomicrevisions (Bauer et al., 2011). Because species’ descriptions canbe time consuming and laborious, we argue that the uncoveredclades should be referred to as ‘candidate species’ for conservationdelineation and management purposes (Bickford et al., 2007;Whittaker et al., 2005). Moreover, knowledge on the evolutionaryrelationship between newly discovered lineages can efficientlyimprove potential conservation initiatives (Diniz-Filho et al.,2013). To our knowledge, only two other studies (Giuglianoet al., 2013; Recoder et al., 2014) focused on squamate cryptic spe-cies recognition in the Cerrado using both molecular and morpho-logical datasets. We suggest that using both types of data should bea priority in studies on squamate diversity in the Cerrado.
The rate of species description in the Brazilian Cerrado is biasedby unequal distribution of sampling efforts across the biome(Diniz-Filho et al., 2005, 2008). Even large-bodied cryptic squamatespecies were recently described following expeditions to previ-ously unsampled regions (Giugliano et al., 2013; Nogueira and
Rodrigues, 2006). Sampling in remote areas is an expensive activity(Costa et al., 2010) and we suggest that funding should be directedtowards research projects that combine faunal inventories withcollection of data useful for assessing putative cryptic diversifica-tion. This is especially important if we seek to understand the evo-lution of the endemic biota and to inform conservationmanagement strategies.
Acknowledgments
FMCBD was supported by scholarships from ‘Coordenação deAperfeiçoamento de Pessoal de Nível Superior’ (CAPES) and ‘Conse-lho Nacional de Desenvolvimento Científico e Tecnológico’ (CNPq).This work was funded by CAPES, CNPq, ‘Fundação de Apoio à Pes-quisa do Distrito Federal’ (FAPDF), ‘GENPAC15’ and ‘Rede de Pesqu-isa Biota do Cerrado’, coordinated by GRC. MTR and JCacknowledge ‘Fundação de Amparo à Pesquisa do Estado de SãoPaulo’ (FAPESP) for funding and D. Pavan, F. Curcio, M. Dixo, M.Teixeira Jr., N. Silva P. Nunes and, T. Mott for collecting tissuesand help in field. LBB thanks additional support provided by theAustralian Research Council (ARC DP0556496). We are grateful toFernanda Werneck for collecting the Gymnodactylus specimens ofManga and Matias Cardoso. We also acknowledge two anonymousreviewers for comments that improved the quality of the manu-script. FMCBD is also grateful to Marina Scalon for commentingon early drafts of the manuscript.
Appendix A. Morphological characters of Gymnodactylus
For every specimen used in the morphological analyses the fol-lowing meristic (1–21) and qualitative (22–29) variables wererecorded:
1.
Number of scales in canthus rostralis, counted from postnasal to the eye2.
Number of scales above and in contact with thesupralabials, counted from frontonasal to last supralabial3.
Number of scales below and in contact with theinfralabials, counted from mental to last infralabial4.
Number of supralabials (sum of both sides) 5. Number of infralabials (sum of both sides) 6. Number of enlarged supraciliary scales 7. Number of dorsal scales, counted from rostral scale toposterior margin of thigh (before tail)
8. Number of keeled scale rows in tail 9. Number of keeled scales in one row in tail, counted in thethird keeled scales row
10. Number of paramedian tubercles, counted fromtympanum to posterior margin of thigh (before tail)
11. Number of paramedian ocelli, counted in one row fromrostral to posterior margin of thigh (before tail)
12. Number of longitudinal ocelli at midbody 13. Number of longitudinal tubercles rows at midbody 14. Number of longitudinal rows of ventral scales atmidbody
15. Number of scales between enlarged post mentals, incontact with mental
16. Number of subdigital lamellae on fourth finger 17. Number of transverse rows of ventral scales, countedfrom mental to cloaca
18. Number of femoral and tibial ventral scale rows, countedfrom cloaca (start of thigh) to foot at mid part of the limb
19. Number of subdigital lamellae on fourth toe(continued on next page)

122 F.M.C.B. Domingos et al. / Molecular Phylogenetics and Evolution 80 (2014) 113–124
20.
Number of granule like scales from cloaca to firstenlarged subcaudal21.
Number of white bands in tail 22. Relative size of post nasals in relation to supranasal – (0):both post nasals smaller than supranasal; (1): secondpost nasal as large as supranasal
23.
Contact between supranasals – (0): in full contact; (1): inpartial contact, with distal indentation; (2): no contact,with scales in the space between them24.
Alignment between frontonasals division and theincomplete suture of rostral – (0): aligned; (1) notaligned25.
Ear opening shape – (0) circular; (1) sagitally elliptic; (2)dorsally elliptic26.
Ear opening position– (0) aligned with supralabials; (1)aligned with eye27.
Dorsal ocelli – (0): present; (1) absent 28. Ocelli in limbs – (0): present; (1) band pattern (non-round ocelli); (2) absent
29. Bands in tail – (0): present; (1) absentAppendix B. Supplementary material
Supplementary data associated with this article can be found, inthe online version, at http://dx.doi.org/10.1016/j.ympev.2014.07.022.
References
Ab’Sáber, A.N., 1974. O domínio morfoclimático semiárido das caatingas Brasileiras.Geomorfologia 43, 1–19.
Ab’Sáber, A.N., 1998. Participação das depressões periféricas e superfíciesaplainadas na compartimentação do planalto brasileiro – considerações finaise conclusões. Revista do Instituto Geológico 19, 51–69.
Almeida, F.C., Bonvicino, C.R., Cordeiro-Estrela, P., 2007. Phylogeny and temporaldiversification of Calomys (Rodentia, Sigmodontinae): implications for thebiogeography of an endemic genus of the open/dry biomes of South America.Mol. Phylogenet. Evol. 42, 449–466.
Avise, J.C., Walker, D.E., Johns, G.C., 1998. Speciation durations and Pleistoceneeffects on vertebrate phylogeography. Proc. Roy. Soc. London. Ser. B: Biol. Sci.265, 1707–1712.
Bauer, A.M., Parham, J.F., Brown, R.M., Stuart, B.L., Grismer, L., Papenfuss, T.J.,Böhme, W., Savage, J.M., Carranza, S., Grismer, J.L., 2011. Availability of newBayesian-delimited gecko names and the importance of character-based speciesdescriptions. Proc. Roy. Soc. B: Biol. Sci. 278, 490–492.
Beerli, P., Felsenstein, J., 2001. Maximum likelihood estimation of a migrationmatrix and effective population sizes in n subpopulations by using a coalescentapproach. Proc. Natl. Acad. Sci. USA 98, 4563–4568.
Beheregaray, L.B., Caccone, A., 2007. Cryptic biodiversity in a changing world. J. Biol.6, 9.
Ben-Hur, A., Ong, C.S., Sonnenburg, S., Schölkopf, B., Rätsch, G., 2008. Support vectormachines and kernels for computational biology. PLoS Comput. Biol.: Edu. 4,e1000173.
Bickford, D., Lohman, D.J., Sodhi, N.S., Ng, P.K., Meier, R., Winker, K., Ingram, K.K.,Das, I., 2007. Cryptic species as a window on diversity and conservation. TrendsEcol. Evol. 22, 148–155.
Burbrink, F.T., Yao, H., Ingrasci, M., Bryson Jr., R.W., Guiher, T.J., Ruane, S., 2011.Speciation at the Mogollon Rim in the Arizona Mountain Kingsnake(Lampropeltis pyromelana). Mol. Phylogenet. Evol. 60, 445–454.
Buuren, S.V., Groothuis-Oudshoorn, K., 2011. MICE: Multivariate Imputation byChained Equations in R. J. Stat. Softw. 45, 1–67.
Camargo, A., Morando, M., Avila, L.J., Sites, J.W., 2012. Species delimitation with ABCand other coalescent-based methods: a test of accuracy with simulations and anempirical example with lizards of the Liolaemus darwinii Complex (Squamata:Liolaemidae). Evolution 66, 2834–2849.
Carstens, B.C., Pelletier, T.A., Reid, N.M., Satler, J.D., 2013. How to fail at speciesdelimitation. Mol. Ecol. 22, 4369–4383.
Cassimiro, J., Rodrigues, M.T., 2009. A new species of lizard genus GymnodactylusSpix, 1825 (Squamata: Gekkota: Phyllodactylidae) from Serra do Sincorá,Northeastern Brazil, and the status of G. carvalhoi Vanzolini, 2005. Zootaxa2008, 38–52.
Chang, C.C., Lin, C.J., 2011. LIBSVM: a library for support vector machines. ACMTrans. Intell. Syst. Technol. 2, 1–27.
Colli, G.R., 2005. As origens e a diversificação da herpetofauna do Cerrado. In:Scariot, A., Souza-Silva, J.C., Felfili, J.M. (Eds.). Cerrado: Ecologia, Biodiversidadee Conservação, Ministério do Meio Ambiente, Brasília, pp. 247–264.
Colli, G.R., Bastos, R.P., Araujo, A.F.B., 2002. The character and dynamics of theCerrado herpetofauna. In: Oliveira, P.S., Marquis, R.J. (Eds.), The Cerrados ofBrazil: Ecology and Natural History of a Neotropical Savanna. ColumbiaUniversity Press, New York, pp. 223–241.
Colli, G.R., Mesquita, D.O., Rodrigues, P.V.V., Kitayama, K., 2003. Ecology of the geckoGymnodactylus geckoides amarali in a Neotropical Savanna. J. Herpetol. 37, 694–706.
Colli, G.R., Giugliano, L.G., Mesquita, D.O., França, F.G.R., 2009. A new species ofCnemidophorus from the Jalapão region, in the central Brazilian Cerrado.Herpetologica 65, 311–327.
Cortes, C., Vapnik, V., 1995. Support-vector networks. Mach. Learn. 20, 273–297.Costa, G.C., Nogueira, C., Machado, R.B., Colli, G.R., 2007. Squamate richness in the
Brazilian Cerrado and its environmental climatic associations. Divers. Distrib.13, 714–724.
Costa, G.C., Nogueira, C., Machado, R.B., Colli, G.R., 2010. Sampling bias and the useof ecological niche modeling in conservation planning: a field evaluation in abiodiversity hotspot. Biodivers. Conserv. 19, 883–899.
Costello, M.J., May, R.M., Stork, N.E., 2013. Can we name Earth’s species before theygo extinct? Science 339, 413–416.
De Queiroz, K., 2007. Species concepts and species delimitation. Syst. Biol. 56, 879–886.
Degnan, J.H., Rosenberg, N.A., 2006. Discordance of species trees with their mostlikely gene trees. PLoS Genet. 2, e68.
Degnan, J.H., Rosenberg, N.A., 2009. Gene tree discordance, phylogenetic inferenceand the multispecies coalescent. Trends Ecol. Evol. 24, 332–340.
Diniz-Filho, J.A.F., Bastos, R.P., Rangel, T.F.L.V.B., Bini, L.M., Carvalho, P., Silva, R.J.,2005. Macroecological correlates and spatial patterns of anuran descriptiondates in the Brazilian Cerrado. Glob. Ecol. Biogeogr. 14, 469–477.
Diniz-Filho, J.A.F., Bini, L.M., Vieira, C.M., Blamires, D., Terribile, L.C., Bastos, R.P., deOliveira, G., Barreto, B.D.S., 2008. Spatial patterns of terrestrial vertebratespecies richness in the Brazilian Cerrado. Zool. Stud. 47, 146–157.
Diniz-Filho, J.A., Loyola, R.D., Raia, P., Mooers, A.O., Bini, L.M., 2013. Darwinianshortfalls in biodiversity conservation. Trends Ecol. Evol. 28, 689–695.
Drummond, A.J., Suchard, M.A., Xie, D., Rambaut, A., 2012. Bayesian phylogeneticswith BEAUti and the BEAST 1.7. Mol. Biol. Evol. 29, 1969–1973.
Edgar, R.C., 2004. MUSCLE: multiple sequence alignment with high accuracy andhigh throughput. Nucleic Acids Res. 32, 1792–1797.
Eiten, G., 1972. The cerrado vegetation of Brazil. Bot. Rev. 38, 201–341.Faria, M.B., Nascimento, F.F., Oliveira, J.A., Bonvicino, C.R., 2013. Biogeographic
determinants of genetic diversification in the mouse opossum Gracilinanus agilis(Didelphimorphia: Didelphidae). J. Heredity 104, 613–626.
Fouquet, A., Gilles, A., Vences, M., Marty, C., Blanc, M., Gemmell, N.J., 2007.Underestimation of species richness in Neotropical frogs revealed by mtDNAanalyses. PLoS ONE 2, e1109.
Fouquet, A., Noonan, B.P., Rodrigues, M.T., Pech, N., Gilles, A., Gemmell, N.J., 2012.Multiple Quaternary refugia in the eastern Guiana shield revealed bycomparative phylogeography of 12 frog species. Syst. Biol. 61, 461–489.
Fouquet, A., Cassini, C.S., Haddad, C.F.B., Pech, N., Rodrigues, M.T., 2014. Speciesdelimitation, patterns of diversification and historical biogeography of theNeotropical frog genus Adenomera (Anura, Leptodactylidae). J. Biogeogr. 41,855–870.
Franco, F.F., Manfrin, M.H., 2013. Recent demographic history of cactophilicDrosophila species can be related to Quaternary palaeoclimatic changes inSouth America. J. Biogeogr. 40, 142–154.
Fujisawa, T., Barraclough, T.G., 2013. Delimiting species using single-locus data andthe Generalized Mixed Yule Coalescent approach: a revised method andevaluation on simulated data sets. Syst. Biol. 62, 707–724.
Fujita, M.K., Leache, A.D., Burbrink, F.T., McGuire, J.A., Moritz, C., 2012. Coalescent-based species delimitation in an integrative taxonomy. Trends Ecol. Evol. 27,480–488.
Gamble, T., Colli, G.R., Rodrigues, M.T., Werneck, F.P., Simons, A.M., 2012. Phylogenyand cryptic diversity in geckos (Phyllopezus; Phyllodactylidae; Gekkota) fromSouth America’s open biomes. Mol. Phylogenet. Evol. 62, 943–953.
Giovanelli, J.G.R., de Siqueira, M.F., Haddad, C.F.B., Alexandrino, J., 2010. Modeling aspatially restricted distribution in the Neotropics: how the size of calibrationarea affects the performance of five presence-only methods. Ecol. Model. 221,215–224.
Giugliano, L.G., Nogueira, C.C., Valdujo, P.H., Collevatti, R.G., Colli, G.R., 2013. Crypticdiversity in South American Teiinae (Squamata, Teiidae) lizards. Zool. Scr. 42,473–487.
Haffer, J., 1969. Speciation in Amazonian forest birds. Science 165, 131–137.Hebert, P.D., Penton, E.H., Burns, J.M., Janzen, D.H., Hallwachs, W., 2004. Ten
species in one: DNA barcoding reveals cryptic species in the neotropicalskipper butterfly Astraptes fulgerator. Proc. Natl. Acad. Sci. USA 101, 14812–14817.
Heled, J., Drummond, A.J., 2010. Bayesian inference of species trees from multilocusdata. Mol. Biol. Evol. 27, 570–580.
Houle, D., 1992. Comparing evolvability and variability of quantitative traits.Genetics 130, 195–204.
Humboldt, A.V., 1849. Aspects of nature, in different lands and different climateswith scientific elucidations. J. Murray, London.

F.M.C.B. Domingos et al. / Molecular Phylogenetics and Evolution 80 (2014) 113–124 123
Johns, G.C., Avise, J.C., 1998. A comparative summary of genetic distances in thevertebrates from the mitochondrial cytochrome b gene. Mol. Biol. Evol. 15,1481–1490.
Kelly, M., Guo, Q., Liu, D., Shaari, D., 2007. Modeling the risk for a new invasiveforest disease in the United States: an evaluation of five environmental nichemodels. Comput. Environ. Urban Syst. 31, 689–710.
King, L.C., 1956. A geomorfologia do Brasil Oriental. Revista Brasileira de Geografia18, 147–265.
Klink, C.A., Machado, R.B., 2005. Conservation of the Brazilian Cerrado. Conserv. Biol.19, 707–713.
Knowles, L.L., Carstens, B.C., 2007. Delimiting species without monophyletic genetrees. Syst. Biol. 56, 887–895.
Knowles, L.L., Maddison, W.P., 2002. Statistical phylogeography. Mol. Ecol. 11,2623–2635.
Lanfear, R., Calcott, B., Ho, S.Y., Guindon, S., 2012. Partitionfinder: combinedselection of partitioning schemes and substitution models for phylogeneticanalyses. Mol. Biol. Evol. 29, 1695–1701.
Lanfear, R., Calcott, B., Kainer, D., Mayer, C., Stamatakis, A., 2014. Selecting optimalpartitioning schemes for phylogenomic datasets. BMC Evol. Biol. 14, 82.
Leaché, A.D., Fujita, M.K., 2010. Bayesian species delimitation in West African forestgeckos (Hemidactylus fasciatus). Proc. Biol. Sci. 277, 3071–3077.
Leaché, A.D., Harris, R.B., Rannala, B., Yang, Z., 2014. The Influence of Gene Flow onSpecies Tree Estimation: A Simulation Study. Syst. Biol. 63, 17–30.
McVay, J.D., Carstens, B., 2013. Testing monophyly without well-supported genetrees: evidence from multi-locus nuclear data conflicts with existing taxonomyin the snake tribe Thamnophiini. Mol. Phylogenet. Evol. 68, 425–431.
Meyer, D., Dimitriadou, E., Hornik, K., Weingessel, A., Leisch, F., 2014. e1071: MiscFunctions of the Department of Statistics (e1071), TU Wien. R package version1.6-2.
Mora, C., Tittensor, D.P., Adl, S., Simpson, A.G., Worm, B., 2011. How many speciesare there on Earth and in the ocean? PLoS Biol. 9, e1001127.
Moraes, E.M., Yotoko, K.S.C., Manfrin, M.H., Solferini, V.N., Sene, F.M., 2009.Phylogeography of the cactophilic species Drosophila gouveai: demographicevents and divergence timing in dry vegetation enclaves in eastern Brazil. J.Biogeogr. 36, 2136–2147.
Moraes-Barros, N., Silva, J.A.B., Miyaki, C.Y., Morgante, J.S., 2006. Comparativephylogeography of the Atlantic forest endemic sloth (Bradypus torquatus) andthe widespread three-toed sloth (Bradypus variegatus) (Bradypodidae,Xenarthra). Genetica 126, 189–198.
Morando, M., Avila, L.J., Sites Jr., J.W., 2003. Sampling strategies for delimitingspecies; genes, individuals, and populations in the Liolaemus elongatus-kriegicomplex (Squamata; Liolaemidae) in andean-patagonian South America. Syst.Biol. 52, 159–185.
Myers, N., Mittermeier, R.A., Mittermeier, C.G., da Fonseca, G.A.B., Kent, J., 2000.Biodiversity hotspots for conservation priorities. Nature 403, 853–858.
Nair, A., Gopalan, S.V., George, S., Kumar, K.S., Teacher, A.G.F., Merilä, J., Garner, T.,Austin, J., 2012. High cryptic diversity of endemic Indirana frogs in the WesternGhats biodiversity hotspot. Anim. Conserv. 15, 489–498.
Nakagawa, S., Freckleton, R.P., 2008. Missing inaction: the dangers of ignoringmissing data. Trends Ecol. Evol. 23, 592–596.
Nogueira, C., Rodrigues, M.T., 2006. The genus Stenocercus (Squamata: Tropiduridae)in Extra-Amazonian Brazil, with the description of two new species. South Am.J. Herpetol. 1, 149–165.
Nogueira, C., Ribeiro, S., Costa, G.C., Colli, G.R., 2011. Vicariance and endemism in aNeotropical savanna hotspot: distribution patterns of Cerrado squamatereptiles. J. Biogeogr. 38, 1922.
Oliveira, P.S., Marquis, R.J., 2002. The Cerrados of Brazil: Ecology and NaturalHistory of a Neotropical Savanna. Columbia University Press.
Oliver, P.M., Adams, M., Lee, M.S., Hutchinson, M.N., Doughty, P., 2009. Crypticdiversity in vertebrates: molecular data double estimates of species diversity ina radiation of Australian lizards (Diplodactylus, Gekkota). Proc. Biol. Sci. 276,2001–2007.
Padial, J.M., Miralles, A., De la Riva, I., Vences, M., 2010. The integrative future oftaxonomy. Front Zool. 7, 16.
Pamilo, P., Nei, M., 1988. Relationships between gene trees and species trees. Mol.Biol. Evol. 5, 568–583.
Paradis, E., Claude, J., Strimmer, K., 2004. APE: analyses of phylogenetics andevolution in R language. Bioinformatics 20, 289–290.
Park, K.J., Kanehisa, M., 2003. Prediction of protein subcellular locations by supportvector machines using compositions of amino acids and amino acid pairs.Bioinformatics 19, 1656–1663.
Pellegrino, K.C.M., Rodrigues, M.T., Waite, A.N., Morando, M., Yassuda, Y.Y., Sites,J.W., 2005. Phylogeography and species limits in the Gymnodactylus darwiniicomplex (Gekkonidae, Squamata): genetic structure coincides with riversystems in the Brazilian Atlantic Forest. Biol. J. Linn. Soc. 85, 13–26.
Pellegrino, K.C.M., dos Santos, R.M.L., Rodrigues, M.T., Laguna, M.M., Amaro, R.C.,Yonenaga-Yassuda, Y., 2009. Chromosomal evolution in the brazilian geckos ofthe genus Gymnodactylus (Squamata, Phyllodactylidae) from the biomes ofcerrado, caatinga and atlantic rain forest: evidence of robertsonian fusionevents and supernumerary chromosomes. Cytogenet. Genome Res. 127, 191–203.
Pfenninger, M., Schwenk, K., 2007. Cryptic animal species are homogeneouslydistributed among taxa and biogeographical regions. BMC Evol. Biol. 7, 121.
Pons, J., Barraclough, T., Gomez-Zurita, J., Cardoso, A., Duran, D., Hazell, S., Kamoun,S., Sumlin, W., Vogler, A., 2006. Sequence-based species delimitation for theDNA taxonomy of undescribed insects. Syst. Biol. 55, 595–609.
Prado, C.P., Haddad, C.F., Zamudio, K.R., 2012. Cryptic lineages and Pleistocenepopulation expansion in a Brazilian Cerrado frog. Mol. Ecol. 21, 921–941.
Quinn, G.P., Keough, M.J., 2002. Experimental Design and Data Analysis forBiologists. Cambridge University Press, Cambridge, UK.
R Core Team, 2013. R: A Language and Environment for Statistical Computing. RFoundation for Statistical Computing, Vienna, Austria.
Rambaut, A., Drummond, A.J., 2009. Tracer v1.5, <http://tree.bio.ed.ac.uk/software/tracer/>.
Recoder, R.S., Werneck, F.P., Teixeira, M., Colli, G.R., Sites, J.W., Rodrigues, M.T., 2014.Geographic variation and systematic review of the lizard genus Vanzosaura(Squamata, Gymnophthalmidae), with the description of a new species. Zool. J.Linn. Soc. 171, 206–225.
Reid, N.M., Carstens, B.C., 2012. Phylogenetic estimation error can decrease theaccuracy of species delimitation: a Bayesian implementation of the generalmixed Yule-coalescent model. BMC Evol. Biol. 12, 196.
Rodrigues, M.T., Pavan, D., Curcio, F.F., 2007. Two new species of lizards of the genusBachia (Squamata, Gymnophthalmidae) from Central Brazil. J. Herpetol. 41,545–553.
Rodrigues, M.T., Camacho, A., Sales Nunes, P.M., Recoder, R.S., Teixeira, M., Valdujo,P.H., Ghellere, J.M.B., Mott, T., Nogueira, C., 2008. A new species of the lizardgenus Bachia (Squamata: Gymnophthalmidae) from the Cerrados of CentralBrazil. Zootaxa 1875, 39–50.
Ronquist, F., Teslenko, M., van der Mark, P., Ayres, D.L., Darling, A., Hohna, S., Larget,B., Liu, L., Suchard, M.A., Huelsenbeck, J.P., 2012. MrBayes 3.2: efficient Bayesianphylogenetic inference and model choice across a large model space. Syst. Biol.61, 539–542.
Rubin, D.B., 2003. Discussion on multiple imputation. Int. Statist. Rev. 71, 619–625.Rull, V., 2011. Neotropical biodiversity: timing and potential drivers. Trends Ecol.
Evol. 26, 508–513.Satler, J.D., Carstens, B.C., Hedin, M., 2013. Multilocus species delimitation in a
complex of morphologically conserved trapdoor spiders (Mygalomorphae,Antrodiaetidae, Aliatypus). Syst. Biol. 62, 805–823.
Scheffers, B.R., Joppa, L.N., Pimm, S.L., Laurance, W.F., 2012. What we know anddon’t know about Earth’s missing biodiversity. Trends Ecol. Evol. 27, 501–510.
Schlick-Steiner, B.C., Seifert, B., Stauffer, C., Christian, E., Crozier, R.H., Steiner, F.M.,2007. Without morphology, cryptic species stay in taxonomic crypsis followingdiscovery. Trends Ecol. Evol. 22, 391–392.
Schölkopf, B., Smola, A.J., Williamson, R.C., Bartlett, P.L., 2000. New support vectoralgorithms. Neural Comput. 12, 1207–1245.
Sistrom, M., Edwards, D.L., Donnellan, S., Hutchinson, M., 2012. Morphologicaldifferentiation correlates with ecological but not with genetic divergence in aGehyra gecko. J. Evol. Biol. 25, 647–660.
Sistrom, M., Donnellan, S.C., Hutchinson, M.N., 2013. Delimiting species in recentradiations with low levels of morphological divergence: a case study inAustralian Gehyra geckos. Mol. Phylogenet. Evol. 68, 135–143.
Spix, J.B.v., Martius, C.F.P.v., 1824. Travels in Brazil, in the years 1817–1820.Longman, Hurst, Rees, Orme, Brown and Green, London.
Stamatakis, A., 2014. RAxML version 8: a tool for phylogenetic analysis and post-analysis of large phylogenies. Bioinformatics 30, 1312–1313.
Sunnucks, P., Hales, D.F., 1996. Numerous transposed sequences of mitochondrialcytochrome oxidase I–II in aphids of the genus Sitobion (Hemiptera: Aphididae).Mol. Biol. Evol. 13, 510–524.
Tamura, K., Peterson, D., Peterson, N., Stecher, G., Nei, M., Kumar, S., 2011. MEGA5:molecular evolutionary genetics analysis using maximum likelihood,evolutionary distance, and maximum parsimony methods. Mol. Biol. Evol. 28,2731–2739.
Tan, D.S.H., Ang, Y., Lim, G.S., Ismail, M.R.B., Meier, R., 2010. From ‘cryptic species’ tointegrative taxonomy: an iterative process involving DNA sequences,morphology, and behaviour leads to the resurrection of Sepsis pyrrhosoma(Sepsidae: Diptera). Zool. Scr. 39, 51–61.
Teixeira, M.J., Recoder, R.S., Camacho, A., De Sena, M.A., Navas, C.A., Rodrigues, M.T.,2013. A new species of Bachia Gray, 1845 (Squamata: Gymnophthalmidae) fromthe Eastern Brazilian Cerrado, and data on its ecology, physiology and behavior.Zootaxa 3616, 173–189.
Vanzolini, P.E., 1948. Notas sobre os ofídios e lagartos da Cachoeira de Emas nomunicípio de Pirassununga, Estado de São Paulo. Rev. Bras. Biol. 8, 377–400.
Vanzolini, P.E., 1953. Sobre a diferenciação geográfica de Gymnodactylus geckoides(Sauria, Gekkonidae). Papéis Avulsos do Departamento de Zoologia 11, 225–262.
Vanzolini, P.E., 1968. Geography of the South American Gekkonidae (Sauria).Arquivos de Zoologia 17, 85–112.
Vanzolini, P.E., 1976. On the lizards of a Cerrado–Caatinga contact: evolutionaryand zoogeographical implications (Sauria). Papéis Avulsos de Zoologia 29,111–119.
Vanzolini, P.E., 2005. On Gymnodactylus amarali Barbour, 1925, with the descriptionof a new species (Sauria, Gekkonidae). An. Acad. Bras. Cienc. 77, 595–611.
Vitt, L.J., 1991. An introduction to the ecology of Cerrado lizards. J. Herpetol. 25, 79–90.
Werneck, F.P., 2011. The diversification of eastern South American open vegetationbiomes: historical biogeography and perspectives. Quaternary Sci. Rev. 30,1630–1648.
Werneck, F.P., Colli, G.R., 2006. The lizard assemblage from seasonally dry tropicalForest enclaves in the Cerrado biome, Brazil, and its association with thePleistocenic Arc. J. Biogeogr. 33, 1983–1992.
Werneck, F.P., Gamble, T., Colli, G.R., Rodrigues, M.T., Sites Jr, J.W., 2012. Deepdiversification and long-term persistence in the South American ‘dry diagonal’:

124 F.M.C.B. Domingos et al. / Molecular Phylogenetics and Evolution 80 (2014) 113–124
integrating continent-wide phylogeography and distribution modeling ofgeckos. Evolution 66, 3014–3034.
Wheeler, Q.D., Knapp, S., Stevenson, D.W., Stevenson, J., Blum, S.D., Boom, B.M.,Borisy, G.G., Buizer, J.L., De Carvalho, M.R., Cibrian, A., Donoghue, M.J., Doyle, V.,Gerson, E.M., Graham, C.H., Graves, P., Graves, S.J., Guralnick, R.P., Hamilton, A.L.,Hanken, J., Law, W., Lipscomb, D.L., Lovejoy, T.E., Miller, H., Miller, J.S., Naeem, S.,Novacek, M.J., Page, L.M., Platnick, N.I., Porter-Morgan, H., Raven, P.H., Solis,M.A., Valdecasas, A.G., Van Der Leeuw, S., Vasco, A., Vermeulen, N., Vogel, J.,Walls, R.L., Wilson, E.O., Woolley, J.B., 2012. Mapping the biosphere: exploringspecies to understand the origin, organization and sustainability of biodiversity.Syst. Biodivers. 10, 1–20.
Whittaker, R.J., Araújo, M.B., Jepson, P., Ladle, R.J., Watson, J.E.M., Willis, K.J., 2005.Conservation biogeography: assessment and prospect. Divers. Distrib. 11, 3–23.
Wiens, J.J., 2007. Species delimitation: new approaches for discovering diversity.Syst. Biol. 56, 875–878.
Williams, E.E., Vanzolini, P.E., 1966. Studies on South American Anoles. Anolistransversalis A. Duméril. Papéis Avulsos do Departamento de Zoologia 19.
Xia, X., 2013. DAMBE5: a comprehensive software package for data analysis inmolecular biology and evolution. Mol. Biol. Evol. 30, 1720–1728.
Xia, X., Xie, Z., Salemi, M., Chen, L., Wang, Y., 2003. An index of substitutionsaturation and its application. Mol. Phylogenet. Evol. 26, 1–7.
Xue, C., Li, F., He, T., Liu, G.P., Li, Y., Zhang, X., 2005. Classification of real and pseudomicroRNA precursors using local structure-sequence features and supportvector machine. BMC Bioinform. 6, 310.
Yang, Z., Rannala, B., 2010. Bayesian species delimitation using multilocus sequencedata. Proc. Natl. Acad. Sci. 107, 9264–9269.