outcomes assessment without the elbow patches
TRANSCRIPT
Outcomes Assessment without the Elbow Patches:
Examining the Value of Continuous Improvement outside the Classroom
Zaneta WoodAssessment Coordinator

Learning Outcomes1. Discover ways to stay abreast of shifting changes within the
organization to maintain the engagement of college personnel in assessment processes and new accreditation requirements.
2. Practice strategies for guiding individuals and teams through customized assessment consultation.
3. Develop a feedback rubric customized for your institution to engage assessment planners through motivating summative and formative feedback.
4. Identify ways to quantify feedback to determine training and resources needed across the institution.

Responding to Organizational Change
• Organizational analysis each year– Review org charts and position descriptions – 34 units with 10 more on board this fall
• Gain support from leadership (Division VPs) and stay in the loop
CHALLENGES
• Satellite campuses managed by several individuals reporting through separate divisions (Student Affairs, Academic Affairs, and President)
• “Hidden Hybrids” – if you can improve, you can assess


Shifting Accreditation Requirements
• Academic and Student Support Services departments must now assess student learning (new SACSCOC standard 8.2.c)
• Council for the Advancement of Standards in Higher Education (CAS) student learning and development outcomes

Sample CAS Student Learning and Development Outcomes
Source: Council for the Advancement of Standards in Higher Education (CAS) student development outcomes https://www.cas.edu/learningoutcomes

Communication and Productivity Tools• Email merge with excel –
customize messages to make it more personal
• Adobe fillable forms for rubrics and data analysis
• Training and Consultation Sessions – signup.com

Setting up Consultation Sessions
http://www.signup.com

Create Value through Consultation“to deliberate together”
• Acknowledge that not everyone understands assessment the way you do – meet them where they are – global thinkers following a linear process
• Start with a simple conversation to build rapport– Give them a chance to show their passion– Ask lots of questions– Take notes and paraphrase to check for mutual understanding

Make the “A” Word Less Intimidating
• Break out the process into smaller steps within several emails, phone calls, and meetings
• Set baselines to see “where we are now” instead of jumping into where we think we should be
• Hold off on getting into the technology until there is a full understanding of the process and plans are well developed

Keep outcomes general and adjust measures each year as needed
Simplify the Process
The Center for Professional Excellence will provide ongoing professional development opportunities to equip faculty with the resources, tools, and skills needed to enhance teaching and learning.
2015‐2016 2016‐2017 2017‐2018MEASURE: Through mastery quizzes new faculty will demonstrate the ability to perform required teaching tasks in Blackboard.TARGET: 90% of new faculty will score 100% on the mastery quizzes on basic tasks in Blackboard
MEASURE: The CPE will provide training to instructors who teach online and blended courses.TARGET: In consultation with Academic Leadership, the CPE will upgrade and enhance the Teaching with Blackboard Course by December 31, 2016 to ensure that knowledge and skills required for online teaching are addressed.
MEASURE: In response to faculty members who experienced Soft Chalk lessons in the Teaching with Blackboard course, the CPE will collaborate with CISC to offer professional development sessions in the use of Soft Chalk for developing course content.TARGET: The CPE will offer at least three professional development sessions in the use of developing course content in Soft Chalk.

• Not all assessment needs to be in big data (persistence, retention, etc.) What can be controlled within individual departments?
The Value of Internal Measures
The Student Success Center will develop and implement efficient and effective pathways to enrollment.
Measure Target ResultsThe SSC will work to resolve student challenges through a variety of communication mediums.
As a result of working with individual students, the SSC will retain 45% of the students with whom they work.
Files were kept on 232 individual students so that the SSC could track students who contacted the office more than once. 97 students were retained to Fall 2017 (42%)
The primary cohorts were: Student who had directly contacted the SSC for Assistance; and Students who had signed an Academic Plan via Financial Aid. The cohort expanded as students made contact with the department. As faculty members sent Kudos or raised grade and/or attendance flags for this group, the SSC followed up with an email offering information, help, and encouragement. The students in the academic plan cohort were assigned to a Progress Coordinator. Each Progress Coordinator communicated with the assigned cohort members throughout the semester reminding them of deadlines and upcoming events.

Create Value through Consultation“to deliberate together”
PRACTICE• Ask questions• Take notes • Check for mutual understanding• Write a general outcome together• Determine possible internal measures

Create Value through Consultation“to deliberate together”
OBSERVATIONS
• Planners: what did you find particularly engaging about the consultation process?
• Coordinators: what did you find particularly challenging about the consultation process?

• Invite teams together in assessment planning so everyone has a voice – sometimes good old fashioned complaining can bring many unknown successes and potential opportunities to the surface
• For those new to assessment, provide a chance to apply the process to departmental history
Collaborate and Apply

1. Brain Dump – struggles and accomplishments over three years (planner)2. Meet to discuss brain dump and look for patterns (together)3. Create outcomes and measures (together)4. Fill out one outcome by cycle on chart as an example (coordinator)5. Fill out remaining outcomes, measures, and results on chart (planner)6. Provide feedback on outcomes, measures and results (coordinator)7. Add analysis and action plans ‐ the glue between cycles ‐ for one
outcome (coordinator)8. Fill out remaining analysis and action plans (planner)
Applying the Process to Departmental History
EXAMPLE

Summative Feedback
• Rubric / Checklist – decide what is expected in every assessment record by component and how they meet or exceed the standard
• Review records from the last two to three cycles

Summative Feedback PRACTICE
• Indicate descriptors met with a check mark• Highlight the strengths• Motivate through language• Ask questions• Provide suggestions
How do we compare?

Quantify Feedback Results
• Total possible points for each criteria by standard
Does not Meet Standard (1 point per descriptor)
Meets Standard (3 points per descriptor)
Exceeds Standard (5 points per descriptor)
• Based on summative feedback from several cycles, award points by standard
Criteria Meets Standard Exceeds Standard
Mission and Purpose at least 6 11‐21
Outcomes at least 18 23‐33
Measures at least 9 14‐24
Baselines / Targets at least 9 14‐19
Results at least 9 14‐19
Analysis at least 6 11‐16
Action Plan at least 6 11‐31

Sample Output to Excel from Adobe Fillable Form

Training Needs Analysis
Adjust rubric based on observations during use (Analysis)– Added one descriptor for “does not meet standard”– Edited one descriptor for “meets standard”– Removed one descriptor for “exceeds standard”– Added one descriptor for “exceeds standard”
Greenville Tech ResultsCriteria Did not
Meet StandardMet Standard Exceeded
Standard
Mission and Purpose 3% 32% 65%
Outcomes 24% 32% 44%
Measures 15% 32% 53%
Baselines / Targets 32% 33% 38%
Results 24% 33% 43%
Analysis 53% 30% 17%
Action Plan 30% 47% 23%
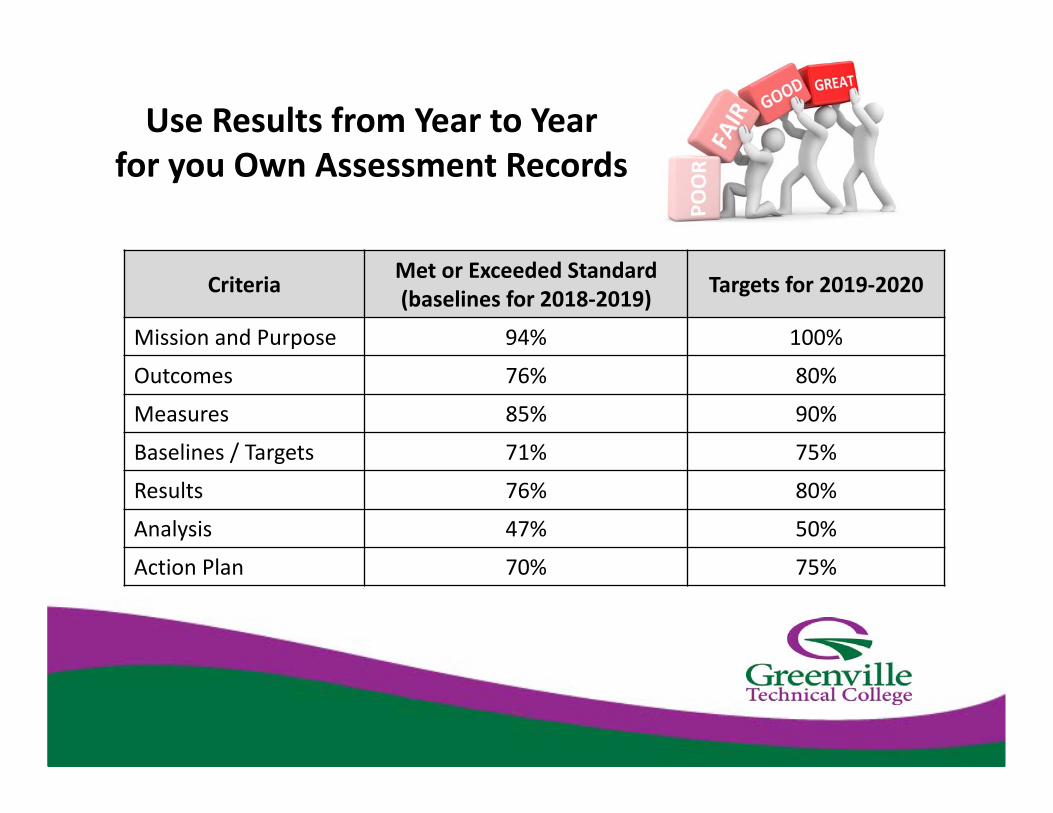
Use Results from Year to Year for you Own Assessment Records
Criteria Met or Exceeded Standard(baselines for 2018‐2019) Targets for 2019‐2020
Mission and Purpose 94% 100%
Outcomes 76% 80%
Measures 85% 90%
Baselines / Targets 71% 75%
Results 76% 80%
Analysis 47% 50%
Action Plan 70% 75%

Formative FeedbackDivide the plan year into steps providing
feedback after each step

Future Goals for Assessment at GTC
• Produce a promotional video highlighting one academic program, one student support services department, and one administrative unit that improved services by participating in assessment.
• Develop a resource manual to be used throughout the plan year organized by phase availability and deadlines.
• Incorporate peer feedback.

Questions or Comments?