outcomes of strategic urban development master plan … · outcomes of strategic urban development...
TRANSCRIPT

1
2nd SeminarJICA Study Team
June 2008
Outcomes of Strategic Urban Development Master Plan and Pre-Feasibility Study
Ministry of Housing, Utilities & Urban Development
General Organization for Physical Planning
Greater Cairo Region Urban Planning Center
The Strategic Urban Development Master Plan Studyfor Sustainable Development of the Greater Cairo Region
In Arab Republic of Egypt
Japan International Cooperation Agency
JICA Study Team
Phase 1: Outcomes of Strategic Urban Development Master Plan for the Greater Cairo Region

2
Study Area and Work Flow“Study area including Cairo, part of Giza and Qaliobeya, and 10th or Ramadan”
1. Analysis of Cairo Region's Role in Egypt
1) Population and its D istribution2) Late st Sixth Five Year Plan (2007/2008-2011/2012)3) Econom ic and Industrial D evelopm ent in Egy pt4) Soc ial D eve lopm ent in Egypt
1) Populat ion and it s D ist r ibut ion in the North Egypt Se ct or2) Economic and Social P rofile in the N ort h Egypt Sec tor3) Urban, Indust ria l, and T ra nspor t at ion D evelopme nt in t heNor t h Egypt Sect or
O pinion PollSurvey
D emographicAnaly sis
Existing Land Usein 2007
Infrastructure Close Cooperationwith Exp erts
2. Existing Conditions of Study AreaWorkshop for
Planning Zone
Traffic Dema nd andCapa city Ana lysis
LandCoverAnalysis
Context byPlanning Zone
Technic alSeminar
W ebsite
National Level Regional Level
Development Growth Orientation in the Region
Inte rv iewing1,241 house holds
and 297e nterprises
Using latestcensus by shiakha
in 2006
Updating G IS dataand supple mental
survey s
Discussing withGO PP,
governorate s, andlocal consultants
Conducting 7-days workshop
with gove rnorateofficials
Main Challenges and Assets
Modelling trafficdemand and
transportationne twork
Analyzing satelliteimages in 2001
and 2007
Providing issuesand constraints of16 planning zones
Ex changingexper iences of urb anp lanning and urban
d evelopment
O pening a websitefor public relation
SWOT Analysis
Prov iding demandprojection andkey issue s forwate r supply,
sewerage, powersupply , and solid
waste
Note: SWOT means Stre ngth, We akness, O pportunity, andThreats
3. Goal, Spatial Development Plan, and Transportation Plan for the Study Area until 2027
Planning Framework in the Study Area until 2027
Sub-sector Strategy in 11 Different Issues related to Urban Planning in 2027
Transportation Plan in 2027
Key Diagram in 2027
General Land Use Plan in 2027
Action Plan until 2027
Socio-economic framework of the study area until 2027
Population projection until 2027 at governorates and study area
Future growth pattern in the s tudy area until 2027
Distribution of population, employment, and education until 2027
Goal, Objective, and Development Strategy in the Study Area until 2027
Governorate Admin. Area Growth Rate(km2) in 1996-2006
1996 2006 (% per year)Cairo 1,636 6,801 7,787 1.4(%within S.A.) (100.0) (100.0)Giza 1,550 3,876 5,131 2.9(%within S.A.) (81.0) (81.8)Qaliobeya 788 2,207 3,059 3.3(%within S.A.) (66.9) (72.2)Sub-tot al 3,974 12,884 15,997 2.2(%within S.A.) (86.5) (87.3)10th of Ramadan 393 48 124 10.0Total 4,367 13,045 16,101 2.2
Population(1,000)
Study Area of Master PlanNote: In April 2008 after the completion of draftfinal report , the Presintial Decree declared to dividethe Cairo governorate into Cairo and Helwangovernorates and the Giza governorate into Giza and6th of October governorates. This administrativechange does not affect the outcomes of the masterplan, since the MP was formulated based on thephysical condistions of the city, and theadministrative changes meet the recommendations
h h bWorkflow of Master Plan
Population Projection for Governorates in Cairo Region“Population estimated at 27million in 2027”
5074 6059 6801 77872417
3719 47846273
16812512
33014237
0
5000
10000
15000
20000
25000
30000
1976 1986 1996 2006
Popu
latio
n (1
,000
)
Cairo Giza Qaliobeya
9,17212,290
14,88618,297
5074 60 59 6801 778 7 7893 8490 9144 98071 0487241737 19 4784
627 3 6445 7360 8206 9037 9797
168125 12
3301423 7 4344
48845429
59686446
0
5000
1 0000
1 5000
2 0000
2 5000
3 0000
1976 19 86 1996 200 6 2007 2012 2017 2022 2027
Popu
latio
n (1
,000
)
Cairo Giza Qal iobeya
9,17212,290
14,88618,297
18,68220,734
22,77924,813
26,73013.8
12.611.5 10.7
1.99
2.80
2.08 2.04
02468
10121416
1976 1986 1996 2006
Shar
e to
Tot
al P
opul
atio
n (%
)
0
0.5
1
1.5
2
2.5
3
Gro
wth
Rat
e (%
per
yea
r)
Growth Rate Share of Cairo Region
Existing Conditions Analysis Proposal
Growth Rate and Share to Total Populaiton in the Coutnry Estimated Population in 1976-2027Existing Population in 1976-2006
Growth Rate Estimated by Caior Demographic Center Estimated Growth Rate in 1976-2027Growth Rate in 1976-2006
1.531.711.881.95
0.00
1.00
2.00
3.00
4.00
5.00
'01'-06 '06'-11 '11'-16 '016'-21
Gro
wth
Rat
e (%
per
yea
r)
Cairo Giza Qaliobeya Total
1.501.731.90
2.112.102.081.93
2.97
0.000.501.001.502.002.503.003.504.004.505.00
76-86 86-96 96-06 06-07 07-12 12-17 17-22 22-27
Gro
wth
Rate
(% p
er y
ear)
Cairo Giza Qaliobeya Total
2.97
1.932.08
0.000.501.001.502.002.503.003.504.004.505.00
76-86 86-96 96-06
Gro
wth
Rate
(% p
er y
ear)
Cairo Giza Qaliobeya Total
-Existing Population of 18million in 2006-Growth Rate increasing from 1.93% per year in 1986-2006to 2.08% in 1996-2006
-Actual growth rate in 96-06 higher than High-case at1.95% per year by Cairo Demographic Center--Share to the total population decreasing to 10.7%
-Estimated growth rate slowing down to the level (1.5%per year) estimated by CDC-Estimated population of 27million in 2027
Note: Cairo includes Cairo and Helwan governorates.Note: GIza includes Giza and 6th of October governorates and a part of Helwan governorate.
3
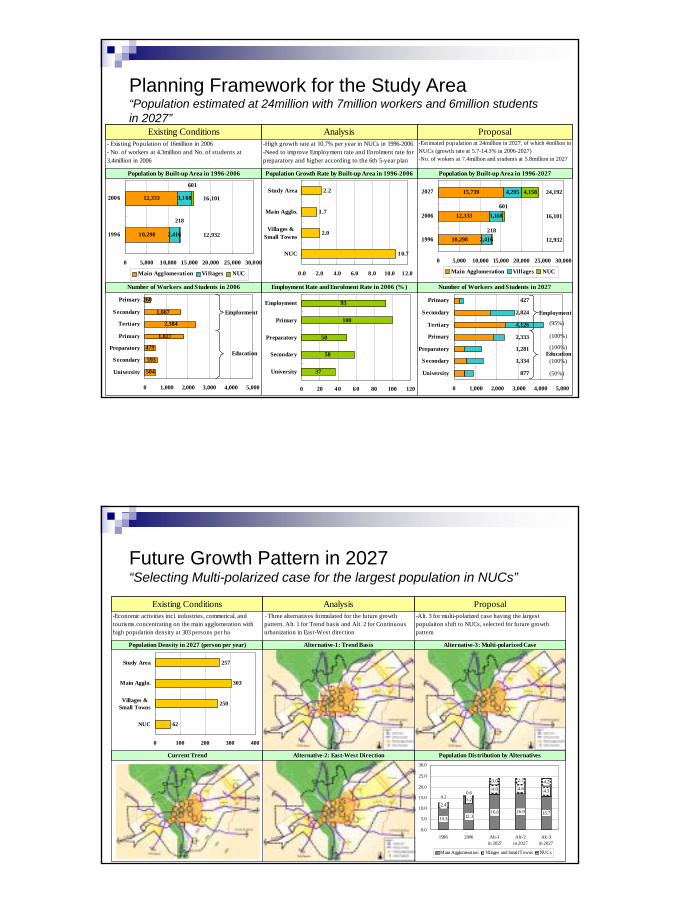
Planning Framework for the Study Area“Population estimated at 24million with 7million workers and 6million students in 2027”
10,298
12,333
15,739
2,416
3,168
4,295 4,158
218
601
0 5,000 10,000 15,000 20,000 25,000 30,000
1996
2006
2027
Main Agglomeration Villages NUC
12,932
16,101
24,192
37
58
50
100
93
0 20 40 60 80 100 120
University
Secondary
Preparatory
Primary
Employment
0 1,000 2,000 3,000 4,000 5,000
University
Secondary
Preparatory
Primary
Tertiary
Secondary
Primary 427
2,333
2,824
4,126
1,281
1,334
877
Education
Employment
10,298
12,333
2,416
3,168
218
601
0 5,000 10,000 15,000 20,000 25,000 30,000
1996
2006
Main Agglomerati on Vi llages NUC
12,932
16,101
Existing Conditions Analysis Proposal
Population Growth Rate by Built-up Area in 1996-2006 Population by Built-up Area in 1996-2027Population by Built-up Area in 1996-2006
Employment Rate and Enrolment Rate in 2006 (% ) Number of Workers and Students in 2027Number of Workers and Students in 2006
- Existing Population of 16million in 2006- No. of workers at 4.3million and No. of students at3.4million in 2006
-High growth rate at 10.7% per year in NUCs in 1996-2006-Need to improve Employment rate and Enrolment rate forpreparatory and higher according to the 6th 5-year plan
-Estimated population at 24million in 2027, of which 4million inNUCs (growth rate at 5.7-14.3% in 2006-2027)-No. of wokers at 7.4million and students at 5.8million in 2027
10.7
2.0
1.7
2.2
0.0 2.0 4.0 6.0 8.0 10.0 12.0
NUC
Villages &Small Towns
Main Agglo.
Study Area
(95%)
(100%)
(100%)
(100%)
(50%)504
593
479
1,827
2,384
1,667
260
0 1,000 2,000 3,000 4,000 5,000
University
Secondary
Preparatory
Primary
Tertiary
Secondary
Primary
Education
Employment
Future Growth Pattern in 2027“Selecting Multi-polarized case for the largest population in NUCs”
Proposal
10.3 12.316.6 16.9 15.7
2.43.2
4.6 4.6 4.3
3.0 2.7 4.2
0.20.6
0.0
5.0
10.0
15.0
20.0
25.0
30.0
1996 2006 Alt-1in 2027
Alt-2in 2027
Alt -3in 2027
Main Agglomerat ion Villages and Small Towns NUCs
Existing Conditions Analysis
Alternative-1: Trend Basis Alternative-3: Multi-polarized CasePopulation Density in 2027 (person per year)
Alternative-2: East-West Direction Population Distribution by AlternativesCurrent Trend
-Alt. 3 for multi-polarized case having the largestpopulaiton shift to NUCs, selected for future growthpattern
-Economic activities incl. industries, commerical, andtourisms.concentrating on the main agglomeration withhigh population density at 303 persons per ha
-Three alternatives formulated for the future growthpattern. Alt. 1 for Trend basis and Alt. 2 for Continuousurbanization in East-West direction
62
250
303
257
0 100 200 300 400
NUC
Villages &Small Towns
Main Agglo.
Study Area

4
Future Urban Area in 2027“Encroachment on agricultural lands slowing down in 2001-2007”“Enhance the urban growth boundary to secure the preservation areas and the efficient investment”
-Enhance urban growth boundary to (i) Preserve thenatural, archeological and agricultural lands fromurbanization and (ii) Provide land for for 24million people
-Negative population growth in main agglomeratoin, whilerelatively high rates around main agglomerattion and inNUCs
-Encroachment on agricultural lands slowing down in2001-2007, which population increasing in NUCs andVillages & small towns
Existing Conditions Analysis Proposal
Growth Rate and Population Density by Built-up Area Natural and Archeological Reservation AreaPopulation Growth Rate by Shiakha in 1996-2006
Annually Encorached Agricultural Land in 1968-2007 General Land Use PlanUrban Area Change in 2001-2007
0.002.004.00
6.008.00
10.00
12.00
0 100 200 300 400
Density (person per ha)G
row
th R
ate
(% p
er y
ear)
Main Agglo Village & Small Town NUC Total
328
593
447
0
100
200
300
400
500
600
700
1968-1977 1977-1982 2001-2007
Ave
rage
Enc
roac
hed
Lan
d (h
a pe
rye
ar)
General Land Use Plan“Misuses including Insufficient green areas and Environmentally-affected industrial areas“Land use plan for efficient and environmental city
-Key diagram for new urban centers to alter the urbanstructure. General land use to create Efficient andenvironmental city based on the proposed goals
-Existing land use for the study area and 16 planningzones formulated to recogniza existing conditions
-Misuses incl. (i) Insufficient green areas in mainagglomeration, (ii) Industrial uses in residential areas, (iii)insufficient lands for new urban centers
Existing Conditions Analysis Proposal
Factories to be Relocated Key Diagram in 2027Existing Land Use Map for Study Area
Green Area per Capita General Land Use Plan in 2027Existing Land Use Map for Planning Zone 1
29.3
27.4
26.9
11.8
5.5
3.2
1.5
0 5 10 15 20 25 30 35
New York ('97)
Berlin ('97)
London ('97)
Paris ('97)
Tokyo ('04)
Study Area ('06)
Main Agglo. ('06)
Green Area per Capita (sq.m per capita)

5
Transportation Plan“Assessment based on the planning framework in 2027 and the updated CREATS system”
26,578
24,984
22,790
21,278
18,655
0 5,000 10,000 15,000 20,000 25,000 30,000
2027
2022
2017
2012
2007
Change LRT No. 1 from Girls Collegetowards New Cairo to Extention forMetro Line 3 Red line of V/C is over 1.00
Red line of V/C is over 1.50
(Private Mode)
(Public Mode)
Existing Conditions Analysis Proposal
V/C Analysis for Road Transport in 2027 Strengthen Cross Section E1-E2-E3 by CorridorUpdated CREATS System
V/C Analysis for PublicTransport in 2027 Strengthen Cross Section E1-E2-E3 by ExpresswayTrip Generation (1,000trips per day)
-Modification on Updated CREATS system to meet thetraffic demand in 2027 in the east side by Extention ofMetro Line 3 and Expressway (E12)
-Assessment based on conditions;i) Updated CREATS systemii) Trip demand following the planning framework in 2027
-Volume/Capacity analysis identifying cross-sections,which will be saturated in 2027 and need improvement
ExpresswayPrimary RdMetro
ExpresswayPrimary RdMetro
CREATS: Transportation Master Plan andFeasibility Study of Urban TransportProjects in Greater Cairo Region
CREATS+Expressway+On-going &Approved Projects
Infrastructure“Capacity analysis and efficient issues for water supply, wastewater, solid waste management, and power supply””
Qaliob eya
C ai roGiza
E xist ing W WTPs in S tud y Are a
1 212
3
109
F i 2 7 7 L i M f WWTP i S d A
8
4
5
7
6
13
11
G ov ern orat e B u il t - up A r ea N o . N ame o f WWT P
C ai r o 1 G a ba l Al As fe r2 A l B er k a3 H e lw an
10 th o f R am ada n 4 1 0t h of R am ad anB adr 5 B a drA l Sh or ou q 6 S h or ouq15 th o f M a y 7 1 5t h of M ayN ew Ca ir o 8 N e w C ai r o
G i za 9 Z en ei n10 A b u Ra w ash
6t h of O ct ob er 11 6 t h of O c to berQ a li obe ya M ai n ag gl om e ra ti on 12 B a lak s/ Sh obr a A l
K h eim aA l O bo ur 13 O b ou r
M ai n ag gl om e ra ti on
M ai n ag gl om e ra ti on
02,0004,0006,0008,000
10,00012,00014,00016,000
2007 2027Wat
er V
olum
e (1,
000m
3/da
y
Sup ply Capacity Demand (Scenario 1)
Deman d (Scenario 2)
0
2,000
4,000
6,000
8,000
10,000
12,000
2007 2027
Wat
er V
olum
e (1
,000
m3/
day)
Capacity Generation (Scenario 1)Generation (Scenario 2)
Qal iobe ya
C air oGiza
E xist ing W PPs in S tud y Ar ea
1
2
3
4
5
6
7
1 0
8
9
1 1
12
13
14
15
16
17
18
F i gur e 2 .7 .2 Loc at io n Map of WPP s in St ud y Are a
G ov erno rat e Bu i lt - up A rea No . N ame o f WP P
1 M ust or od2 Am e ri a
3 Ro d Al F ar ag4 Al R od a
5 Fus ta t6 M aad i
7 He lw an8 Al M a rg9 Al T ab een
1 0 Ka fr Al E l w10t h of Ra m ad an 1 1 10t h of Ra m ada n
1 2 Gi za1 3 Em b aba
1 4 Ge zir a t A l Da habAl She ik h Zaye d 1 5 Sh eik h Zay ed6t h of O ct ob er 1 6 6t h of O ct ob erM ai nagg lo m er at io n
1 7 Sh obr a A l Kh ei m a
Al Ob our 1 8 Ob our
Q al io bey a
C ai r o M ai nagg lo m er at io n
G i za M ai nagg lo m er at io n
Existing Conditions Analysis Proposal
Water Demand and Supply Capacity in 2027 Efficient IssuesWater Demand and Supply Capacity in 2007
Generated Wastewater and Treatment Capacity in 2027 Efficient IssuesGenerated Wastewater and Treatment Capacity in 2007
[Review of water distribution]Six NUCs of 10 of Ramadan, Al Obour, Badr, 15th of Mayand Al Shorouk will have shortage of water supply,though the total supply capacity is adequate for the totaldemand.in 2027. Water distribution will need to bereviewed.[Improvement for quality of water supply]Studies will be necessary to;1) Review the water leakage, water tariff, and improper water uses for better operation.2) Monitor the groundwater used in Villages & Small Towns.
Water Demand in 2007:4,119,000m3/day
Supply Capacity in 2007:8,742,000m3/day
18 Water PurificationPlant in the Study Area
Generated Wastewater in2007: 3,790,000m3/day
Treatment Capacity in2007: 4,557,000m3/day
13 Watewater TreatmentPlant in the Study Area
[Review of service area by treatment plant]Three NUCs of 10 of Ramadan, 15th of May and Badr willhave shortage of treatment capacity, though the total capacity isenough for the total generated volume .in 2027. Collection andtreatment system will need to be reviewed.[Improvements of quality of wastewater treatment]1) Provide secondary treatment step of Abu Rawash WWTP2) Conduct studies for the Treatment system in Villages &Small Towns, Reuse of treated water and Better treatmentfor industrial effluents.
-Restructuing the water distribution system and serviceareas for water supply and waste water, even in sufficienttotal capacity. Needs to improve the service quality.
-Existing capacity for purification and treatment sufficientfor water demand and wastewater generation
-Sufficient capacity for purification and treatment to meetwater demand and wastewater generatoin in 2027 aftercompletion of on-going and planned projects

6
Development Corridor in 2027“Needs to strengthen transport systems and urban centers in NUCs”
Promoting Industrial and R&D Area
Key Diagram in 2027
Promoting New Business and Commercial Area
Three Development Corridors in 2027Transport Project in 2027
Needs to strengthen the transport in east andwest direction
Needs to reform the urban structure byenhancing the urban centers in NUCs
Phase 2: Outcomes of Pre-Feasibility Study for Western Development Corridor

7
Work Flow of Pre-Feasibility Study
1. Urban Planning for Western Development Corridor

8
The study area including the existing main agglomeration in Giza and 6th of October/ Shiekh Zayed NUCs.
Continuous urban areas in southern part of Giza up to Pyramids
Two archeological and one natural (geological) protectorates
Study Area for Pre-FS
4,0581000Population in 2006
843km2Land Area
Q’tyUnitItem
Existing Land Use Map in the Study Area
On-going urban development between NUCs and main agglomeration including;
Grand Egyptian MuseumLarge tourism investment zoneSmart village and Abu Rawash
industrial area
On-going Urban Development Projects
Future Growth Pattern of Western Development Corridor in 2027
On-going Project in the Study Area

9
Planning Framework for Western Development Corridor in 2027
Population by built-up area in 2027
Framework based on the master plan for the GCR in the 1st phase
2,386 3,232 3,321 3,716 4,001 4,236 4,448427639 663
822 965 1,099 1,216565831
1,068
341177157
27
30 3665
106155 199
20
01,0002,0003,0004,0005,0006,0007,0008,000
1996 2006 2007 2012 2017 2022 2027
Main agglomeration Villages & small towns 6th of October Al Sheikh Zayed
2,860 6,9316,3205,6374,9444,1974,058
2,0331,6671,3911,1429319281,000Total
3863303002772622551,000University
1,6471,3371,0918656696741,000Pri., Pre., and Sec.No. of Student
1,5101,4131,2511,1149879641,000Total
9078497586786015871,000Tertiary
5395054403883433351,000Secondary
6460534843421,000PrimaryNo. of Workers
6,931 6,320 5,637 4,944 4,1974,0581,000Population
202720222017201220072006UnitCategory
Population, Workers, Students in 2006-2027 in the Study Area for Pre-FS
Continuous urban areas unserved by public transport in south Giza up to Pyramids
New development taking place in areas between NUC and main agglomeration
Active development near Sheikh Zayedalong Alex. Desert Road and 26th July road
Mid/high density area along the existing and new urban centers
General Land Use Plan of the Study Area in 2027
Park
Commercial
Housing
Tourism
Business
SportGeneral Land Use Plan in the Study Area

10
65 62
51
3629 25
0
1020
30
40
5060
70
Availability ofmeans of
transportation
Reasonable price Availability ofservice and
utilities
Availability ofhealth careservices
Availability of alleducational
services
Standard of living
Peop
le's
Perc
eptio
n (%
)
Candidate Routes for Pre-Feasibility Study
Rail66.39Utilization of Egypt Railway Plan
8
Rail39.99Railway Plan on Extension Road of North Expressway
7
Rail32.31Extension of Metro 4 to 6th of October
6
Rail35.19Extension of Metro 4 to 6th of October
5
Rail40.73Railway Plan on the Same Track of Option 3
4
Bus40.73Bus Plan3
Rail35.9Railway Plan on the Same Track of Option 1
2
Bus35.9Bus Plan1
ModeLength (km)
Name of Option
Description of Eight OptionsEight Options of Transport Route
People’s Perception for Conditions to Move to NUC
Not recommended
Considered Necessary as a
point-to-point road
Alt. Option to Option 5
Recommended as medium & long
term
Not recommended
Recommended as short term plan
Not recommended
Not recommended
Overall Evaluation
633
1,004
1,606
1,605
969
578
977
545
Construc-tion cost(US$ mil.)
7,190LittlePoint to point
74Utilization of Egypt Railway Plan
8
2,600SomePoint to point
324Road and Railway Plan on Extension of North Expressway
7
2,270A littleCorridor dev.
594Extension of Metro No 4 to 6th of October Road
6
2,030A littleCorridor dev.
666Extension of Metro No 4 to 6th of October Road
5
1,240ManyPoint to point
660Railway Plan on Saft-El Laban Axes and 26th of July Road
4
2,510LittlePoint to point
318Busway Plan on Saft El Laban Axes and 26th of July Road
3
1,330SomePoint to point
620Railway Plan on 26th of July Road
2
2,330A littlePoint to point
324Busway Plan on 26th of July Road
1
Investment per
pass. (US$/Pa.)
Socio-Environ-mental aspect
Urban Develop-
mentDirection
Magnitude of Traffic
Demand in 2027 (‘000)
Name of Option
Comparative Analysis for Alternative Routes
Option 3 and Option 5 selected for the transport route of development corridor

11
Routes and Stations (Railway and Busway)
Giza City(main
agglomeration)
6th of OctoberIndustrial Area
6th of OctoberUrban Center
University
Al SheikhZayed Urban
Center
Athletic Park incl.International
Football Stadium
NationalMuseum
InternationalConvention
Area
IT andManuracturingIndustrial Area
Central PublicPark
Pyramid Area
The western development corridor will interlink CBD of main agglomeration, urban centers of NUCs, industrial areas, public parks and a new national museum (Greater Egyptian Museum), and a new international convention area, and so on.
Main Activities along Corridor
2. Traffic Demand

12
0.8Bus
2.2Passenger Car
2.8Minibus
3.4Taxi
88.0Shared Taxi
Share (%)Transport Mode
High rate of shared taxis (88%) for tripsVery limited use of cars.Main destinations of 80% to Giza (36%), Pyramids area (20-40%) and Imbaba (20%), Very long travel time of 104 minutes (incl. 74minutes for vehicle trip)
1.6%3.2%7.9%39.7%39.7%Share
DokkiShubraMaadiEl AhramGizaArea
From 6th of October
2.4%4.1%19.8%21.2%36.3%Share
DokkiKhalifahEl AhramImbabaGizaArea
To 6th of October
3.0 LEFare
73.8Vehicle Time
7.6Waiting Time for Transfer
2.1Walking Time for Transfer
13.2Waiting Time
3.15.0Walking Time to/from Mode (min.)
Last Mode
Linked Trip
First Mode
Item
Travel Mode, Travel Destination and Travel Time
Share by Transport Mode
Share by “Origin to” and “Destination from” 6th of October
Travel Time and Fare of 6th of October Residents
Location of Traffic Count Survey
Future Demand by Bus and Railway Station until 2027
Traffic demands are estimated for each station based on the traffic model of SDMP as updated with the surveys and socio economic/population framework

13
Short term: Busway along 26th of July and Metro 3
Public Transport Network ImprovementImprovement in 2008-2012
80,700229,650202772,800209,2502022 with 6th of October Line120,700313,8002022 w/o 6th of October Line61,700157,450201740,400100,800Year 2012
Bus Exclusive Lane Operation221,000795,800Year 2027201,400679,9002022 with 6th of October Line151,500439,0502022 w/o 6th of October Line144,800425,8002017
6th of October Line
Max. through-Pax
Passengers
Summary of Demands of Railway and Busway
Demand for busway exceeding capacity of 300,000 in 2022.Railway starting serve until 2022.Busway for short term and railway for medium-long term
Improvement in 2018-2022Improvement in 2013-2017
Medium term: Metro 4 up to Pyramids and Metro Line 3 westward to Imbaba and eastward
Long term: 6th October Line from Pyramids to 6th
October, and Metro 3 eastwards and East Wing
3. Railway Plan

14
Routes and Stations (Railway)
Interlinking the existing and planned urban area
Running existing roads to minimize the land acquisition
Convenient transit to Line 1, 2, and 4Mitigating environmental impact and cost
reduction by mixture of underground, elevated, and on-ground.
1st Phase (15.2km) and 2nd Phase (25.3km)
9th District Central
El Malek El Saleh (Metro 1)
Giza Square (Metro 2)
Al Wahat Rd.
Bank Str.
Interlinked Underground and Elevated Railway Elevated Railway
Phase 1 and Phase 2 of Railway
15.2km in 1st Phase and 25.3km in 2nd Phase44.5min from CBD to 6th of October
40.519.213.87.5
Total
10025.315.2Total4717.71.5At-Grade347.66.2Elevated190.07.5Underground
%Ph. 2Ph. 1Type
Less than Heavy Rail(not so favorable for at-grade section as it shall
require a girder.)
Less than Heavy Rail(Difficult to maintain at-
grade for most part.)
Most appropriate to 6th
Oct LineOverall Evaluation
Example
Smallest because rubber tire use
Smaller noise due to no traction gear
Noisy (protection measure required)
Noise, Vibration and Scenery
within 30kmwithin 40kmwithin 100kmTravel Distance
Easy construction Girder type mitigates traffics
Girder type mitigates traffics
Easiness of Viaduct Construction
Smaller than Heavy RailSmaller than Heavy RailLargeTransportation Capacity
Good for elevatedGood for elevated/underground
Good for any alignment
Compatibility with Route Condition
MonorailLinear Motor Heavy RailEvaluation Item
Evaluation of Suitable Railway System
Comparison by Three Railway Systems

15
31,00020,300pax/hr/wayTransport Capacity
4.55min.Train Headway (peak hr)
159153train/day/directionTrains per Day
26(3)
14(2)
set(set)
Required Train Set (excl. reserved)
20884carRequired No. of Car
8 (1,266)
6(942)
car/train(pax./car)
Cars per Train(Nominal pax. per car)
km/h
min.
pax/hr/way
Unit
44.5(Express)
61.0 (Ordinary)
24.5Traveling Time
54.6 (Express)
39.8 (Ordinary)
37.2Scheduled Speed
30,94020,272Max Traffic Volume
Phase II (2027)
Phase I (2017)
Item
Train Operation Condition and Construction Standard
Basic Operation Conditions for Railway
Phase 1 and Phase 2 of Railway
Phase 2 Phase 1
DC 1,500 VFeeding Line Volt.
Slab TrackMain Line ViaductBallast TrackMain Line Ground170 mPlatform Length
3,000 mMin Vertic. Radius of C.
Overhead Catenary
Power Collection S.
LevelCar Depot35 ‰Max Gradient R=100 mSide Track, Depot R=400 mPlatformR=600 mMain Line
Min Radius Of Curve110km/hOperation Max S.120km/hDesign Max Speed1,435mmTrack GaugeSpecificationItem
Basic Construction Standard
15.2km in 1st Phase and 25.3km in 2nd Phase44.5min from CBD to 6th of October
Location Map
Typical Plan for Station and Depot
Typical Layout of Depot
Typical Layout of Station (elevated)
Typical Layout of
Station(at ground)

16
2,100.8Total Costs
191.0Custom Duties (Total to the above)
304.9Contingency and Management
36.0Whole lineCar Depot
98.0Whole lineSignaling and Telecommunication
146.0Whole linePower Station/Distribution
198.4124 carsCars Costs (Phase II)
134.484 carsCars Costs (Phase I)
270.325.3 kmConstruction Costs (Phase II)
721.815.2 kmConstruction Costs (Phase I)
Cost (mil. USD)RequirementItem
Preliminary Cost Estimate and Construction Schedule
Project approvalVarious formalitiesBasic design and biddingCivil & architectural worksElectrical & mechanical worksTraining & testStart of Operation
2008 2009 2010 2011 2012 2013 2014 2015 2016 20182017 20222019 2020 2021
Project approvalVarious formalitiesBasic design and biddingCivil & architectural worksElectrical & mechanical worksTraining & testStart of Operation
Phase 1
Phase 2▼
▼
Preliminary Cost Estimate
Construction Schedule
Opened in 2017 (1st Phase) and 2022 (2nd
Phase)Investment amounted 2,101million LE
4. Preliminary Study on 26th of July Busway
17
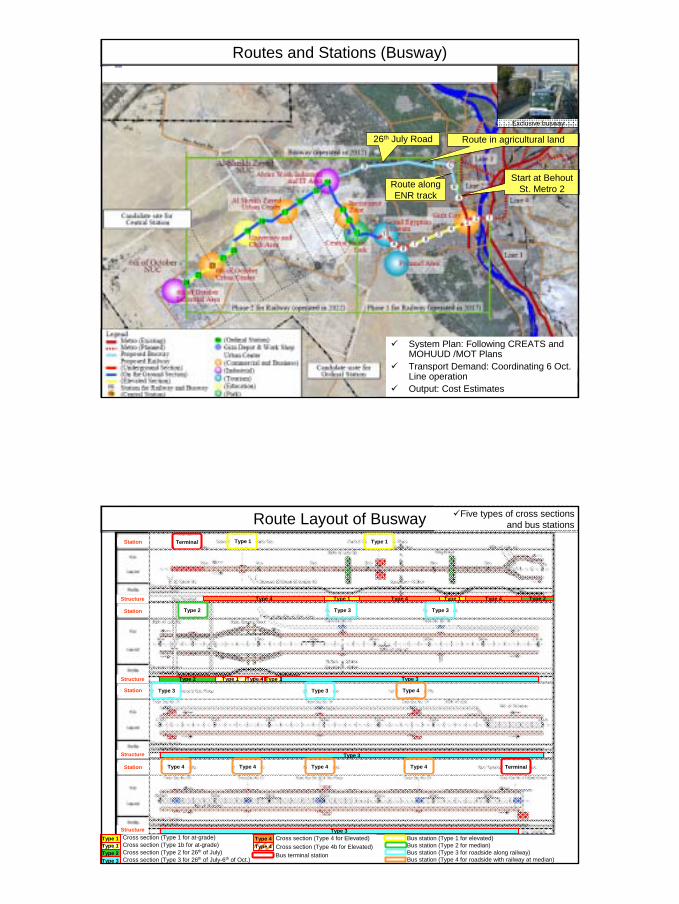
Routes and Stations (Busway)
Start at BehoutSt. Metro 2Route along
ENR track
Route in agricultural land26th July Road
System Plan: Following CREATS and MOHUUD /MOT PlansTransport Demand: Coordinating 6 Oct. Line operationOutput: Cost Estimates
Exclusive busway
Type 1Type 4 Type 2Type 1 Type 4 Type 4
Type 3Type 2 Type 1 Type 1Type 4
Type 3
Type 3
Route Layout of Busway Five types of cross sections and bus stations
Cross section (Type 1 for at-grade)Cross section (Type 1b for at-grade)Cross section (Type 2 for 26th of July)Cross section (Type 3 for 26th of July-6th of Oct.)
Type 4Type 4
Cross section (Type 4 for Elevated)Cross section (Type 4b for Elevated)Bus terminal station
Bus station (Type 1 for elevated)Bus station (Type 2 for median)Bus station (Type 3 for roadside along railway)Bus station (Type 4 for roadside with railway at median)
Type 1
Type 3Type 2Type 1
Type 3 Type 4
Type 4Type 4 Type 4Type 4
Type 3
Type 3Type 3Type 2
Type 1 Type 1Terminal
Terminal
Structure
Station
Structure
Station
Structure
Station
Structure
Station
18
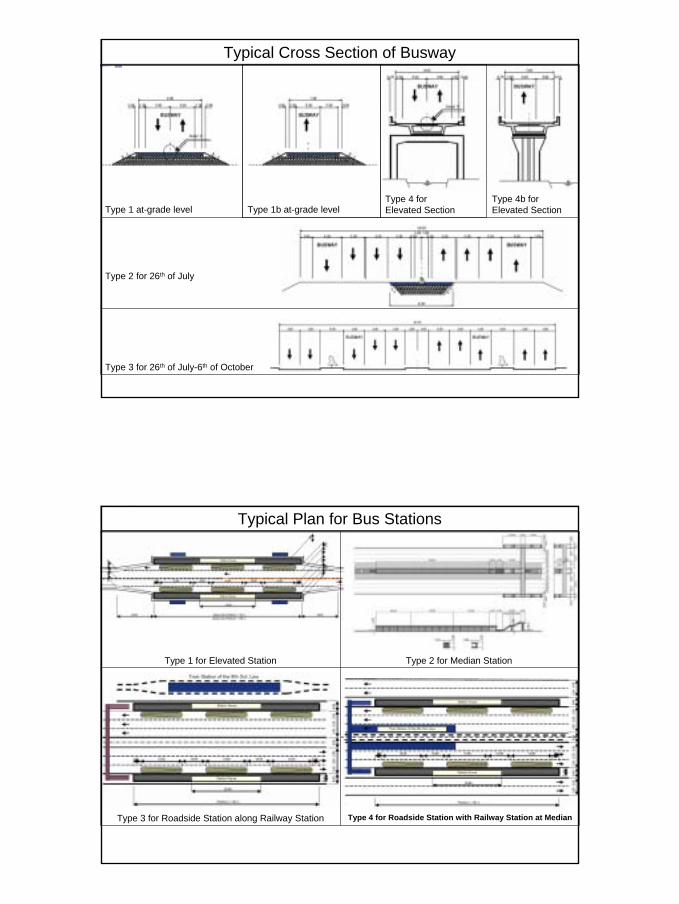
Typical Cross Section of Busway
Type 1 at-grade level
Type 2 for 26th of July
Type 3 for 26th of July-6th of October
Type 4 for Elevated SectionType 1b at-grade level
Type 4b for Elevated Section
Typical Plan for Bus Stations
Type 1 for Elevated Station Type 2 for Median Station
Type 3 for Roadside Station along Railway Station Type 4 for Roadside Station with Railway Station at Median

19
Typical Plan for Bus Terminals and Depot
Bus Terminal at Bohooth Station Bus Terminal in 6th of October
N
Underground Pedestrian WayTo Bahooth Sta. (Metro Line 2)
Proposed Site for Depot in 6th of October
Preliminary Cost Estimate and Construction Schedule for Busway
67.83Stations (At Grade & Elevated)
Cost(mil. LE)
Item
78.12Sales Tax
1,654.12Total
119.13Engineering and Const. Management, Local Admin, and Contingency
908.00Bus
46.85Depot and Workshop
130.11Bus Terminal
47.71Station Plaza
5.77Intermediate Station
328.72Busway
Preliminary Cost Estimate
7 8 9 10 11 12 1 2 3 4 5 6 7 8 9 10 11 12 1 2 3 4 5 6 7 8 9 10 11 12
1. Detailed Design
2. Tendering
3. Land Acquisition
4. Busway Construction
1) Mobilization
2) Preparatory Work
3) Temporary Work
4) Earth Work
5) Foundation Work
6) Substructural Work
7) Superstructural Work
8) Incidental Work
a) Bus terminal & StationPlaza includingPedestrian Bridge
b) Depot Facility
c) Others IncidentalConstruction (Drainage,Curb, Pavement,Marking, etc.)
9) Environmental Work
10) Cleaning & Demobilization
5. Start of Operation January 2012
Work Item2009 2010 2011
Construction ScheduleOpened in 2012Investment amounted to
1,654.12million LE (incl. busway, buses, and stations)

20
5. Urban Development Plan for Major Stations
Railway
Mixed Use(incl. public services)
Residential Use(medium density)
Residential Use(low density)
Public &TransitSpace
Commercial& Business
Commercial& Business
Development of the railway station and its surrounding areas aims at;Providing efficient transit of the different transportation modesCreating a focal point in the urban areas around to generate passengers
Concept of Land Use Plan for Transport-Oriented Development at Station
Land Use Pattern around Station Station Square and UrbanDevelopment in its Surrounding Area

21
In 6th of October, the 9th District was provisionally selected for central station location in consultation with NUCA
Existing Condition for Central Station AreaLocation Map
Existing Conditions (Vacant Land)(Satellite Imagery in 2008)
Designated Land Use
According to NUCA land use plan, this area is planned for commercial area
The central station area will provide an ideal site for Business headquarters, branches,Services, commercial, financesHigh-rise residentialPublic services, etc.
Land Use Plan for Central Station Area
Land Use Plan for Central
Station Area
Location Map
Site Plan for Station Square
A station square located for assuring the easy transit between different transportation modes.

22
BCR and FAR as the basic tools for building control.
Higher density for areas near the station, lower with the distance
Red: about 15 floorsOrange: about 10 floors
Development Image
Planning Parameters and Development Image
Building Coverage and Floor Area Ratios
100.0560,000Total
76.0425,500Urban Development
24.0134,500Sub-total
3.218,000Park
2.313,000Station Square
18.5103,500Road
Public Facility
Share(%)
Land Area(m2)Land Use Category
Area by Land Use Category
Other ordinary station area will provide at smaller scale
ResidentialNeighborhood shopping and
servicesPublic services
Land Use Plan for Typical Ordinary Station
Land Use Plan(to be adjusted with Existing Conditions)
Location Map Site Plan for Station Square
23
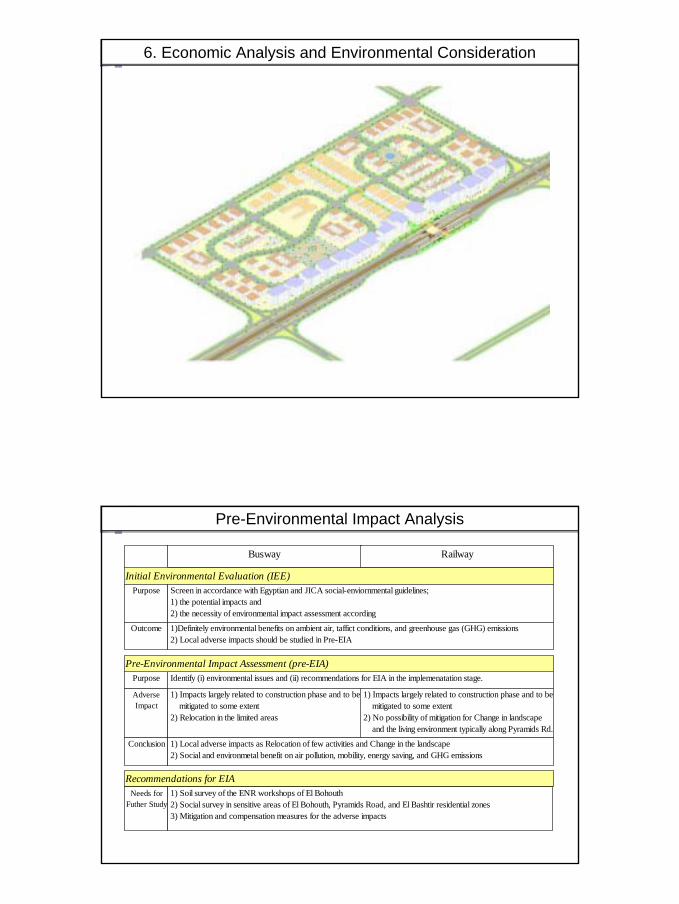
6. Economic Analysis and Environmental Consideration
Pre-Environmental Impact Analysis
Busway Railway
Outcome
Identify (i) environmental issues and (ii) recommendations for EIA in the implemenatation stage.
1)Definitely environmental benefits on ambient air, taffict conditions, and greenhouse gas (GHG) emissions 2) Local adverse impacts should be studied in Pre-EIA
AdverseImpact
Purpose
Initial Environmental Evaluation (IEE)
Pre-Environmental Impact Assessment (pre-EIA)
1) Impacts largely related to construction phase and to be mitigated to some extent 2) Relocation in the limited areas
1) Impacts largely related to construction phase and to be mitigated to some extent 2) No possibility of mitigation for Change in landscape and the living environment typically along Pyramids Rd.
Purpose Screen in accordance with Egyptian and JICA social-enviornmental guidelines; 1) the potential impacts and 2) the necessity of environmental impact assessment according
Recommendations for EIANeeds for
Futher Study 1) Soil survey of the ENR workshops of El Bohouth 2) Social survey in sensitive areas of El Bohouth, Pyramids Road, and El Bashtir residential zones 3) Mitigation and compensation measures for the adverse impacts
Conclusion 1) Local adverse impacts as Relocation of few activities and Change in the landscape 2) Social and environmetal benefit on air pollution, mobility, energy saving, and GHG emissions

24
Economic and Financial Analysis
1) Economically preferable to implement the projects as a whole2) Busway is commercially feasible, if part of the invetment cost is borne by the public sector
3) Subsidy or low interest rated fund required for railway for sound business model
Conclusion
EIRR
NPV
Case 1 Case 2
21.3% 14.1% 16.5%
LE1,017 million LE1,360 million LE3,057 million
Case 1 Case 3Case 2
Subcidyto Const.
Cost
Case
Economic Analysis
Financial Analysis
0% 100% 0% 100%57%
Distance-based Fare (due to long travel distance)0.6LE/time+0.03LE/km in 2008 (5% increase per year similar to actual fare chane in 2000-2006)
NPV LE186 million LE438 million LE(968)million LE1,300 millionLE5 million
Conclu-sion
FIRR 18.46% 35.7% 8.04% n.a.12.03%
Fare
Feasible in any case with and without subcidy for construction costinstalled.
Marginally feasible, if more than 57% of infurastructure cost is borne bythe purbli sector
Conclu-sion
Economically feasible
Benefit Cost saving by travel time and vehicle operation Increase value added byindustry + Cost saving
Busway Railway OverallUrban Development
17.5%
LE2,285 million
Increase value added byindustry
Busway Railway
Thank you!