outcomes of workplace training - kompetansenorge.no€¦ · pb arbeidsledige innvandrere og...
TRANSCRIPT

OUTCOMES OF WORKPLACE TRAINING IN BASIC SKILLS ARBEIDSLEDIGE INNVANDRERE OG VIDEREGÅENDE UTDANNING FOR VOKSNE PB 1
Note 14/2014
Outcomes of Workplace Training in Basic Skills
Results for Norway
Norwegian results from the collaborative project between the Policy Research Directorate of Employment and Social Development Canada, the Department of Post-Secondary Education, Training and Labour, New Brunswick, Canada, and Vox, Norwegian Agency for Lifelong Learning
October 2014

Outcomes of Workplace Training in Basic SkillsResults for Norway
© Vox 2014ISBN: 978-82-7724-213-2Design/produksjon: Vox

OUTCOMES OF WORKPLACE TRAINING IN BASIC SKILLS ARBEIDSLEDIGE INNVANDRERE OG VIDEREGÅENDE UTDANNING FOR VOKSNE PB 3
Table of Contents
1. Introduction .........................................................................................................................................................................................42. The Norwegian Basic Skills in Working Life Program (BCWL) ....................................................................................52.1 Program priorities ................................................................................................................................................................................52.2 The Framework for Basic Skills ........................................................................................................................................................63. Data and methodology................................................................................................................................................................... 73.1 Data........................................................................................................................................................................................................... 73.2 Research questions ............................................................................................................................................................................94. Profile of participants ................................................................................................................................................................... 105. Results ................................................................................................................................................................................................... 115.1 Pre-training skill level ........................................................................................................................................................................ 115.2 Training outcome ............................................................................................................................................................................... 216. Concluding remarks ...................................................................................................................................................................... 307. References ...........................................................................................................................................................................................31 Tables..................................................................................................................................................................................................... 32 Figures ................................................................................................................................................................................................... 32 Appendix ................................................................................................................................................................................................33

OUTCOMES OF WORKPLACE TRAINING IN BASIC SKILLS ARBEIDSLEDIGE INNVANDRERE OG VIDEREGÅENDE UTDANNING FOR VOKSNE PB 4
1. Introduction
This report presents the Norwegian findings from a study of outcomes of workplace training in basic skills. The study was executed as part of a collaborative project between Norwegian and Canadian government agencies.
The purpose of the project was to explore and compare initiatives in Norway and the province of New Brunswick (Canada) directed towards workplace training in basic skills, identifying how they are similar and how they are different, and what impacts the initia-tives have on learners’ skills.

OUTCOMES OF WORKPLACE TRAINING IN BASIC SKILLS ARBEIDSLEDIGE INNVANDRERE OG VIDEREGÅENDE UTDANNING FOR VOKSNE PB 5
2. The Norwegian Basic Skills in Working Life Program (BCWL)
Norway has taken part in three large OECD surveys that measure basic skills in the adult population: the International Adult Literacy Survey (IALS), the Adult Literacy and Life Skills Survey (ALL), and the Program for the International Assessment of Adult Competencies (PIAAC).
Although Norway performs well in all three surveys compared to other countries, there is still a large amount of adults whose basic skills need to be addressed. According to PIAAC, 400 000 adults are at risk (Bjørkeng & Lagerstrøm, 2014, p. 11). The total population of Norway is 5.1 million. This means that almost one out of ten Norwegians lack a sufficient skill level in order to function well in the workforce and in society in general.
As a response to the challenges presented by the results of the OECD surveys, the Norwegian government established a national program called Basic Skills in Working Life (BCWL) in 2006. The rationale behind the program was that by organizing courses taking place at the partici-pants’ workplace, we would be able to reach the adults that were in most need of increasing their basic skills levels. BCWL courses are flexible and adapted to the needs of both the enter-prise and the workers. The training is also contextualized in order to ensure that all the tasks are relevant to the particular sector, branch or workplace. Courses for people currently unemployed have also been organized in cooperation with the Norwegian Labour and Welfare Service.
The BCWL program aims to increase the adult population’s social inclusion and general welfare as well as their access to further learning and their employability. All efforts concern-ing adult learning in Norway are meant to serve this holistic triangle. Although the program is adapted to the needs of a particular enterprise or sector aiming to increase the employ-ability of the individual worker through increasing their efficiency and competence in per-forming sector or enterprise-specific tasks, it will also enhance social inclusion, self-esteem, and motivation participants for further learning.
2.1 Program priorities
The program’s learning objectives are reading, writing, numeracy and digital skills. From 2014, oral communication has been included as a fifth learning objective.
Any enterprise in Norway private or public, that seeks to provide training to workers, can apply for funding. When assessing applications and granting funds, Vox emphasize the following criteria:
1. The training should be combined with regular work and preferably be linked to other types of job-relevant learning. 2. The training should strengthen the participants’ motivation for learning. 3. The training have to correspond to the competence goals expressed in the Framework for Basic Skills developed by Vox and approved by the Ministry of Education and Research.

OUTCOMES OF WORKPLACE TRAINING IN BASIC SKILLS ARBEIDSLEDIGE INNVANDRERE OG VIDEREGÅENDE UTDANNING FOR VOKSNE PB 6
4. Special efforts are made to include Small and Medium Enterprises (SMEs) in the program and to encourage applications from sectors which employ people with relatively low formal skills. Informing and motivating target groups are important in securing the successful implementa-tion of the BCWL program. In addition to our centralized efforts in spreading information about the program, Vox is supported by one contact person in each of the 19 Norwegians counties. The contact persons provide information and guidance for potential applicants, and also assist them with their applications.
Most of the projects financed through the BCWL program include a phase aimed at informing and motivating potential participants as well as mapping out the training needs of the potential participants. This phase also includes adapting course materials to the specific environment and activities of each workplace.
In order to track the progress and results of the program, Vox keeps a database with infor-mation about the BCWL projects and participants. Demographic variables (gender, age, education level, work sector etc.) concerning the participants are registered, and as a result of this, it is possible to assess to which degree the program reaches its intended target groups. The database also makes it easier to evaluate the long term impacts of the program.
2.2 The Framework for Basic Skills
As mentioned above, all training that is funded through the BCWL program must be based on the Framework for Basic Skills. This framework contains competence goals (national standards) for reading and writing, numeracy, digital competence and oral communication, as well as teacher guidelines, professional development systems, tests and tools.
The competence goals for each basic skill have three different levels, ranging from the very basic to the more advanced.
The competence goals mainly function as a tool for the teacher who can adapt the different goals to contextualized situations at the workplace. To further assist the teacher in this process, Vox has produced a handbook which describes the background for the framework, key issues associated with training adults, and their basic skills and how the competence goals can provide support in the process of preparing and implementing training activities for each basic skill. The handbook is also available in English.

OUTCOMES OF WORKPLACE TRAINING IN BASIC SKILLS ARBEIDSLEDIGE INNVANDRERE OG VIDEREGÅENDE UTDANNING FOR VOKSNE PB 7
3. Data and methodology
3.1 Data
The data in this project are collected from three basic skills courses arranged through the Norwegian program for Basic Competence in Working Life (BCWL) in 2012. One of the courses had participants from a painting factory in the Eastern part of Norway. The other two courses had participants from the retail sector and the transport sector (taxi drivers), and took place in Western Norway. There were 53 participants in total.
3.1.1 QuestionnairesThe study employed a quantitative method. Data was collected through questionnaires using the Educational Testing Service’ (ETS) tool for assessing literacy: the Prose, Document and Quantitative (PDQ) Profile Series.
Two self-assessment questionnaires were completed by the participants: one when the training started and one by the time the training had ended. In these questionnaires, the participants were asked to rate their own reading, writing, numeracy and computer skills. They were also asked to rate their ability and confidence in performing various tasks involving the use of these basic skills. In addition they were asked how often they performed various tasks that involved reading, writing, using numeracy skills and using a computer.
The two questionnaires were almost identical, but the post-training questionnaire included a part where the participants were asked to rate themselves both before and after the training, and a section where the participants were asked to give a specific example of how the training had impacted their ability or attitude towards learning as an adult.
The local administrators were responsible for collecting the post-training questionnaires.
3.1.2 The PDQ Profile SeriesThe Prose, Document and Quantitative (PDQ) Profile Series were developed by the Educa-tional Testing Service (ETS). The series provides information about an individual’s skill in using written and printed information on three literacy scales: prose, document and quantita-tive. Prose literacy measures how well information found in newspapers, magazines, novels, brochures etc. are understood. Document literacy measures how well information is found and used in forms, schedules, tables and graphs, etc. Quantitative literacy measures how well numbers found in ads, forms, articles or other printed materials can be used. As a result, quantitative literacy to a large degree measures math skills (ETS).
The series consists of two assessments: one full-length assessment that takes approximately 90 minutes to complete and one «locator test» that has fewer tasks than the full-length test and takes approximately 50 to 60 minutes to complete. Both are only available electronically. Both assessments have three scales: prose, document, and quantitative literacies. The scores of the assessment are reported in terms of levels. In the full length test there are five levels while the locator test has four levels: Level 1, Level 2, and Level 3 or higher. This study used the locator test.

OUTCOMES OF WORKPLACE TRAINING IN BASIC SKILLS ARBEIDSLEDIGE INNVANDRERE OG VIDEREGÅENDE UTDANNING FOR VOKSNE PB 8
The participants completed the PDQ assessment at the start of their training after they had completed the pre-training questionnaire. Two experts on the PDQ assessment from Vox visited the local venues where the training was held. They assisted the local teachers in introducing the assessment to the participants, as well as in more practical matters concerning the testing.
3.1.3 Data collection46 participants completed the pre-training questionnaire and the PDQ assessment. Only 35 participants completed the post-training questionnaire. Table 1 and Table 2 show the timeline of the training and the data collection from each of the three courses and business sectors.
Table 1 Timeline data collection
Sector Pre-training questionnaire and PDQ assessment Post-training questionnaire
Retail (N=7) February 2012 May 2012
Transport (N=22) February 2012 November 2012
Painting Industry (N=24) April 2012 June 2012
The participants from the transport and retail sector completed 60 hours of training. The participants from the transport sector received training in literacy and computer skills, while the participants from the retail sector also received training in numeracy. A small group of the participants from the transport sector (6 in total) did not attend the last part of the training, and therefore completed fewer hours of training than the others.
Table 2 Participants, by sector/courses and data collection
Sector Pre-training Questionnaire (N=53)
PDQ assessment (N=46)
Post-training Questionnaire (N=35)
Retail 7 7 6
Transport 22 17 11
Painting Industry 24 22 18
The participants from the painting industry received more extensive training than the partici-pants from the other sectors. When these participants answered their post-training question-naire, they had completed about two thirds of a total of 100 hours of training in literacy, 50 hours of training in numeracy, and 60 hours of training in computer skills.
The courses held for the participants from the transport and retail sector had just started when the first part of the data collection was done. The participants from the painting industry, however, started their training in August 2011. Their training had been going on for six months before any data were collected, and their training did not finish until December 2012. The course held for the participants from the transport sector started in the spring of 2012 and finished late the same year. As mentioned, six participants at this course did not com-plete their training. We tried to reach them by both phone and e-mail. These attempts were unsuccessful, and we were not able to obtain the post-training questionnaires from these participants.

OUTCOMES OF WORKPLACE TRAINING IN BASIC SKILLS ARBEIDSLEDIGE INNVANDRERE OG VIDEREGÅENDE UTDANNING FOR VOKSNE PB 9
3.2 Research questions
The research questions explored in the study were the following:•What skill level did the participants possess before the training took place? •What were the outcomes of the training?

OUTCOMES OF WORKPLACE TRAINING IN BASIC SKILLS ARBEIDSLEDIGE INNVANDRERE OG VIDEREGÅENDE UTDANNING FOR VOKSNE PB 10
4. Profile of participants
The participants in the study were mostly male, ethnic Norwegians. Only three participants were women. Five participants were born foreign-born. Six participants learned another language than Norwegian before starting primary school. Approximately half of the partici-pants had only completed lower secondary education, thirty percent had completed upper secondary education, and twenty percent had completed higher education. Almost all partici-pants considered their health to be good. Almost everyone was working full-time.
The participants from the transport sector were all male. They were the oldest group of participants, and the ones that were most unpleased with their current health condition. The participants from the retail sector, on the other hand, were quite young and included two women. All of them believed their current health condition were excellent or very good. They were all native-born Norwegians, and none of them had higher education. The partici-pants from the painting industry had the highest share of foreign-born participants who spoke another language than Norwegian before starting primary school.
Table 3 shows the demographic characteristics of those participating in the study.
Table 3 Participants, by sector and selected demographic characteristics (percent, N=53)
Sector Percent
Retail 13
Transport 42
Painting Industry 45
Gender
Male 94
Female 6
Age group
16-35 11
36-55 74
56+ 15
Highest level of educational attainment
Lower secondary education 48
Upper secondary education 32
Post-secondary education 20
Health status
Excellent/Very good 54
Good 39
Fair/Poor 7
Country of birth
Norwegian-born 89
Abroad 11
First learned language as a child
Norwegian 87
Other 13

OUTCOMES OF WORKPLACE TRAINING IN BASIC SKILLS ARBEIDSLEDIGE INNVANDRERE OG VIDEREGÅENDE UTDANNING FOR VOKSNE PB 11
5. Results
In the remaining parts of this report, we present the results of the study. We begin with describing the skill level of the participants before they started their training, and then describe how the training affected their skill level.
5.1 Pre-training skill level
The participants pre-training skill level were measured both through self-assessments and the PDQ profile series test.
5.1.1 Self-assessment of skillsFigure 1 shows how the participants rated their own skills before they started their training. The general impression is that the participants were quite confident in their skill level. The majority of the participants rated themselves as Good or Very good in all the four skills: numeracy, writing, reading and using a computer.
About 73 percent rated their reading skills as Good or Very good in reading. Using a com-puter were the biggest challenge for the participants. More than twice as many rated them-selves as Unable/Poor in this skill compared to writing, reading and numeracy.
Figure 1 Participants’ pre-training self-assessed skill level (percent, N=53)
28
12
12
12
22
16
28
28
51
73
61
61
0 % 10 % 20 % 30 % 40 % 50 % 60 % 70 % 80 % 90 % 100 %
Computer
Unable/Poor Fair Good/Very good
Reading
Writing
Numeracy
The foreign-born participants rated themselves a bit higher in computer skills and numeracy than those who were born in Norway. Not surprisingly, the participants with higher educa-tion generally rated themselves higher than the participants with lower and upper secondary education. Numeracy was an exception, as the participants with upper secondary education rated themselves slightly higher than the participants with higher education. The correlation between self-assessed computer skills and age is significant (and negative).

OUTCOMES OF WORKPLACE TRAINING IN BASIC SKILLS ARBEIDSLEDIGE INNVANDRERE OG VIDEREGÅENDE UTDANNING FOR VOKSNE PB 12
Participants from the retail sector assessed their skills the highest whileparticipants from the painting industry assessed their skills slightly lower than the taxi drivers from the transport sector. The participants from all three sectors followed the same pattern, giving their reading abilities the highest score, numeracy the second highest, writing the second lowest, and computer skills the lowest (with a slight exception for those in the painting industry, who rated their writing skills the lowest) (see table 4).
Table 4 Participants with good or very good pre-training skills, by sector (percent, N=53)
Skill type Retail Transport Painting Industry
Numeracy 86 64 50
Writing 86 68 46
Reading 100 77 59
Computer 57 50 50
As table 4 shows, participants rated their skills differently depending on the type of skill. Table 5 shows how the participants rated their ability in performing various tasks and activi-ties linked with basic skills.
Table 5 Participants’ pre-training ability to perform various activities (percent, N=53)
Activities Unable/Poor Fair Good/Very Good
Doing calculations 23 44 33
Reading brief documents 6 16 78
Reading large documents 8 20 65
Working with what you read 16 20 65
Writing short messages 14 22 65
Using technology 16 14 69
We see that participants rated their ability in reading quite high and their calculating ability rather low.
When it comes to how often the participants performed various types of activities where basic skills is essential, Internet related activities is the most common (see table 6).
Table 6 Participants pre-training assessment of frequency in performing various tasks (percent, N=53)
Activities Never/Rarely Little Regularly/Often
Reading emails 20 10 70
Reading on the Internet 14 12 74
Reading books 50 25 25
Using Internet 16 8 76
Using social media 32 14 54
5.1.2 Proficiency levels in prose, document and quantitative literacyOut of the three different literacy scales, participants performed best on the Quantitative scale. They obtained the lowest score on the Document scale (see figure 2).

OUTCOMES OF WORKPLACE TRAINING IN BASIC SKILLS ARBEIDSLEDIGE INNVANDRERE OG VIDEREGÅENDE UTDANNING FOR VOKSNE PB 13
Figure 2 Participants’ pre-training proficiency levels in Prose, Document and Quantitative literacy (percent, N=46)
Level 1 Level 2 Level 3
37
48
9
28
46
48
35
7
44
0 % 10 % 20 % 30 % 40 % 50 % 60 % 70 % 80 % 90 % 100 %
Prose
Document
Quantitative
The foreign-born participants and those who spoke another language than Norwegian before they started primary school had lower scores on all PDQ scales than the native-born. The correlation between the PDQ Document scale and country of birth is significant.
The correlations between age groups and the PDQ Prose and Document scales are also significant. The youngest participants obtained the highest score on all three scales, and the oldest obtained the lowest score. Also, participants with higher education had the highest score on the Quantitative scale, while those with upper secondary education performed best on the Prose and Document scales.
Figure 3 shows the amount of participants at level 3 by scale and sector. The retail sector had the highest share of participants at level 3. Every participant in the retail sector had a level 3 score in Prose. The painting industry and the transport sector both had relatively few partici-pants at level 3.
Figure 3 Participants with level 3 PDQ scores, by scale and sector (percent, N=46)
14
57
24
0
41
23
9
41
0 10 20 30 40 50 60 70 80 90 100
Prose
Document
Quantitative
Painting Industry Transport Retail

OUTCOMES OF WORKPLACE TRAINING IN BASIC SKILLS ARBEIDSLEDIGE INNVANDRERE OG VIDEREGÅENDE UTDANNING FOR VOKSNE PB 14
As shown in Figure 3, the correlations between the Prose and the Document scales as well as between the Prose and the Quantitative scales were significant and positive. This indicates that participants who perform well in one scale also perform well in the other scales and vice versa.
5.1.3 Association between self-assessed skills and PDQ proficiency levelsIn the following sections we compare the results from the self-assessments and the PDQ tests. It is important to note that the self-assessments and the PDQ tests measure somewhat different skills. For instance, although the quantitative scale measures how well individuals can use numbers, it does so through a literary approach, and as a result does not give a «clean» measure of skill levels in numeracy. Moreover, since the measuring scales differ, we cannot directly compare the results.
In the pre-training self-assessments, participants gave their reading skills the highest rate, while the results from the PDQ tests indicated that participants had the highest skills in quantitative literacy (see figure 4 and 5).
Figure 4 Participants with high skill levels*, self-assessed skill level in numeracy and Quantitative literacy score (percent, N=46)
0 %
10 %
20 %
30 %
40 %
50 %
60 %61
44
70 %
80 %
90 %
100 %
Numeracy Quantitative

OUTCOMES OF WORKPLACE TRAINING IN BASIC SKILLS ARBEIDSLEDIGE INNVANDRERE OG VIDEREGÅENDE UTDANNING FOR VOKSNE PB 15
Figure 5 Participants with high skill levels*, self-assessed skill level in reading and Prose and Document literacy score (percent, N=46)
73
35
7
0 %
10 %
20 %
30 %
40 %
50 %
60 %
70 %
80 %
90 %
100 %
Reading Prose Document
* High skill levels mean Good/Very Good in the self-assessment and level three in the PDQ test.
As we saw above, the participants from the retail sector rated their skills the highest and also showed the best performance in the PDQ assessments. On the other end, the participants from the painting industry rated themselves their skills the lowest and also had the lowest PDQ scores (see figure 6 and 7). This indicates that the self-assessments and the PDQ scores are correlated.
Figure 6 Participants with high skill levels, self-assessed skill level in numeracy and Quantitative literacy score, by sector (percent, N=46)
0 % 10 % 20 % 30 % 40 %
41
41
57
50
64
86
50 % 60 % 70 % 80 % 90 % 100 %
Numeracy
Quantitative
Painting Industry Transport Retail

OUTCOMES OF WORKPLACE TRAINING IN BASIC SKILLS ARBEIDSLEDIGE INNVANDRERE OG VIDEREGÅENDE UTDANNING FOR VOKSNE PB 16
Figure 7 Participants with high skill levels, self-assessed skill level in reading and Prose and Document literacy score, by sector (percent, N=46)
0 % 10 % 20 % 30 % 40 % 50 %
59
77
100
100
23
24
9
14
0
60 % 70 % 80 % 90 % 100 %
Reading
Prose
Document
Painting Industry Transport Retail
Pre-training skill level and demographic characteristics
As expected, the pre-training skill level also varied between demographic characteristics. The youngest participants rated their skills the highest in all four skills. They were also the ones that obtained the best scores on all three PDQ scales. The oldest participants, on the other hand, rated their skills the lowest and scored the lowest on all PDQ scales (see figure 8 and 9).
Figure 8 Participants with high skill levels, self-assessed skill level in Reading and Document and Prose literacy score, by age group (percent, N=46)
0 %
40
3
0
0
100
40
40
50
73
10 % 20 % 30 % 40 % 50 % 60 % 70 % 80 % 90 % 100 %
Reading
Prose
Document
16-35 36-55 56+

OUTCOMES OF WORKPLACE TRAINING IN BASIC SKILLS ARBEIDSLEDIGE INNVANDRERE OG VIDEREGÅENDE UTDANNING FOR VOKSNE PB 17
Figure 9 Participants with self-assessed high skill level in numeracy and Quantitative literacy score, by age group (percent, N=46)
0 % 10 % 20 % 30 % 40 % 50 % 60 %
60
43
33
25
65
83
70 % 80 % 90 % 100 %
Numeracy
Quantitative
16-35 36-55 56+
In the self-assessments, the participants with higher education had the best rates in all skills except numeracy. However, in the PDQ assessments, they only performed better than those with less education in numeracy (see figure 10 and 11). The PDQ results show that the participants with upper secondary education performed best in both the Prose and Docu-ment scales. The participants with lower secondary education performed slightly worse than those with upper secondary education in reading, but obtained the same score in numeracy.
Figure 10 Participants with high skill levels, self-assessed skill level in numeracy and Quantitative literacy score, by education (percent, N=46)
0 % 10 % 20 % 30 % 40 %
48
33
56
50
73
67
50 % 60 % 70 % 80 % 90 % 100 %
Numeracy
Lower Secondary Upper Secondary Tertiary
Quantitative

OUTCOMES OF WORKPLACE TRAINING IN BASIC SKILLS ARBEIDSLEDIGE INNVANDRERE OG VIDEREGÅENDE UTDANNING FOR VOKSNE PB 18
Figure 11 Participants with high skill levels, self-assessed skill level in Reading and Document and Prose literacy score, by education (percent, N=46)
0 %
0
13
11
29
47
33
64
73
89
20 % 40 % 60 % 80 % 100 %
Reading
Prose
Document
Lower Secondary Upper Secondary Tertiary
All foreign-born participants, and also those who learned another language than Norwegian before starting school, rated themselves higher in computer skills and numeracy than the native-born participants. Perhaps surprisingly, they also assessed their skills in reading and writing to be just as good as the native-born.
These results are similar to the findings of a study of basic skills training in the Norwegian Postal Service (Hansen, Larsen, & Lønvik, 2013, pp. 10-14).
In the PDQ assessments, however, these participants perform systematically poorer than the native-born and those who learned Norwegian before school on all three scales, and on the quantitative scale.
The IALS survey, which the PDQ assessment is based upon, has also been criticized for cultural bias (Hamilton & Barton, 2000, p. 382). Nevertheless, this does not explain why the foreign-born rate themselves higher than the native-born in numeracy and computer skills.
Correlations between skill levels in the self-assessments and in the PDQ tests
Although the results between the self-assessments and the PDQ tests cannot be compared directly, we were interested in exploring the relationship between the self-assessed skill levels and the PDQ proficiency levels in the specific skills.
As mentioned, while participants gave their reading skills the highest rate in pre-training self-assessments, the PDQ results indicated that the participants had the highest skills in Quantitative literacy (see figure 4). There were, nonetheless, a certain degree of correlation between the results of the self-assessments and the PDQ tests. Figure 12, 13 and 14 illustrate this.

OUTCOMES OF WORKPLACE TRAINING IN BASIC SKILLS ARBEIDSLEDIGE INNVANDRERE OG VIDEREGÅENDE UTDANNING FOR VOKSNE PB 19
Figure 12 Quantitative literacy proficiency levels, by self-assessed skill level in numeracy (percent, N=46)
12 7
53 45
35
48
0 %
10 %
20 %
30 %
40 %
50 %
60 %
70 %
80 %
90 %
100 %
Unable/Poor/Fair Good/Very GoodLevel 1 Level 2 Level 3
Figure 13 Document literacy proficiency level, by self-assessed skill level in reading (percent, N=46)
69
31
0
39
52
9
0 %
10 %
20 %
30 %
40 %
50 %
60 %
70 %
80 %
90 %
100 %
Unable/Poor/Fair Good/Very GoodLevel 1 Level 2 Level 3
Figure 14 Prose literacy proficiency level, by self-assessed skill level in reading (percent, N=46)
0 %
10 %
20 %
30 %
40 %
50 %
60 %62
39
0
27 24
49
70 %
80 %
90 %
100 %
Unable/Poor/Fair Good/Very GoodLevel 1 Level 2 Level 3

OUTCOMES OF WORKPLACE TRAINING IN BASIC SKILLS ARBEIDSLEDIGE INNVANDRERE OG VIDEREGÅENDE UTDANNING FOR VOKSNE PB 20
There was a significant correlation (Pearson’s r) between the results from the PDQ Prose scale and the self-assessed skill level in all four skills. The correlation between the results from the PDQ Document scale and the self-assessed skill level in writing and using a com-puter was also significant.
The results from the PDQ Quantitative scale do not significantly correlate with the self- assessed skill level in numeracy. Nevertheless, they correlate with the self-assessed skill level in the other three skills.
No participants rated their numeracy skills as unable or poor scored at level 1 on the PDQ Quantitative scale. Twenty percent of those who rated their numeracy skills as unable or poor scored at level 3 on the PDQ Quantitative scale. A high share of those who scored at level 3 on the PDQ Quantitative scale rated their numeracy skills as lower than Good/Very good.
On the other hand, we do not find the same tendency when it comes to the PDQ Prose and Document scales. One way of understanding this is that the participants perhaps underesti-mated their numeracy skills and overestimated their literacy skills. In the Norwegian IALS sur-vey, the respondents overestimated their skills on the Prose and Document scales (Gabrielsen, 2000, p. 118). They did not, however, underestimate their numeracy skills like the participants in this study seemed to have done, but rather seemed to have a more realis-tic impression regarding their Quantitative literacy skills (Gabrielsen, 2000, p. 119).
Good readers read more often than others
PISA research shows that there is a correlation between how often young people read for their own pleasure and their reading skills (OECD, 2010, p. 32). Our study showed the same «Matthew effect»: There were significant correlations between the participants’ basic skills and how often they read – particularly how often they read on the Internet (see figure 15).
Figure 15 Reading skills, by frequency of reading on the Internet (percent, N=53)
0 %
10 %
20 %
30 %
40 %
50 %
60 %
70 %
80 %
90 %
100 %
Unable/Poor/Fair Good/Very GoodLevel 1 Level 2 Level 3
75
25
75
25
13
87
Out of the different measures of skill in reading, the self-assessed skill level had the most significant correlation with the frequency of reading (emails, Internet, newspapers, books, workplace materials). There were also significant correlations between the frequency of some types of reading and the PQD Prose score (emails, Internet, books) and the PDQ Document score (emails and Internet).

OUTCOMES OF WORKPLACE TRAINING IN BASIC SKILLS ARBEIDSLEDIGE INNVANDRERE OG VIDEREGÅENDE UTDANNING FOR VOKSNE PB 21
5.2 Training outcome
In this study, training outcome is understood as the difference between participants’ pre and post training skill level. Unfortunately we were not able to obtain post training PDQ scores. The post training skill level is thus based only on self-assessments. In order to get as much information about the outcome of the training, the participants were asked to give a specific example of how the training had impacted their abilities or attitude towards learning as an adult. None of the participants gave such an example, however.
5.2.1 Increased basic skillsIn general, the post-assessment skill rates were higher than the pre training rates (see table 7). Some of the differences were significant. The most interesting of these significant differ-ences was the difference between the pre and post computer skills rate.
Table 7 Proportion of participants with self-assessed good or very good skills, before and after training (percent, N=35)
Type of skills Pre training Post training
Numeracy 64 68
Writing 61 77
Reading 76 88
Computer 55 77
5.2.2 Increased abilities to perform tasksIn the participants’ post-assessment of their abilities to perform various tasks, two of the three tasks were given a higher score than in the pre-assessment. The difference between the pre and post rates in «Doing calculations» was the only one of those differences that was significant (p-value of 0.006).
Figure 16 shows the change in the amount of participants who assessed their ability in performing various tasks as good or very good.
Figure 16 Participants with self-assessed good or very good ability to perform tasks, before and after training (percent, N=35)
0 %
10 %
20 %
30 %
40 %
50 %
60 %
70 %
80 %
90 %
100 %
23
78 76
64 67
72
48
79
71
80 82 83
Doingcalculations
Reading briefdocuments
Readingcomprehensive
documents
Working withwhat you read
Writing shortmessages
Using technology
Before training After training

OUTCOMES OF WORKPLACE TRAINING IN BASIC SKILLS ARBEIDSLEDIGE INNVANDRERE OG VIDEREGÅENDE UTDANNING FOR VOKSNE PB 22
5.2.3 Increased frequency in performing tasksIn general the participants’ frequency in performing various tasks and engaging in various basic skills related activities increased after the training.
With regards to reading, all tasks and activities except for reading newspapers have a higher proportion of participants saying that they read «Often» or «Regularly» after the training (see figure 17). However, reading workplace documents and reading to a family member were the only tasks and activities that showed a significant increase (p-values 0.007 and 0.024 respectively).
In almost all of the tasks, the post frequency rate was higher than the pre frequency rate. However, while the increase in computer skills was relatively large, none of the differences in the frequency of performing computer related tasks were significant (see figure 17).
Figure 17 Participants reading «Often» or «Regularly», before and after training (percent, N=35)
0 %
10 %
20 %
30 %
40 %
50 %
60 %
70 %73 73
86
24
31
79
60 64
83
55
73
21
31
7480 %
90 %
100 %
Before training After training
Emails Internet Books Newspapers Workplacedocuments
Directions ina recipe
Reading to afamily member
The frequency in using specific types of documents also increased for some of the document types after the training (see figure 18). None of these differences were significant, however.
Figure 18 Participants using documents «Often» or «Regularly», before and after training (percent, N=35)
0 %
10 %
20 %
30 %
40 %
50 %
60 %
70 %
80 %
90 %
100 %
Before training After training
33
49
27
49 43
57
26
47
Instructions Flyers Games Schedules

OUTCOMES OF WORKPLACE TRAINING IN BASIC SKILLS ARBEIDSLEDIGE INNVANDRERE OG VIDEREGÅENDE UTDANNING FOR VOKSNE PB 23
The frequency in performing different tasks involving numeracy increased as well (see figure 19). The increase in calculating value-added tax (VAT) (HST in Canada) was the only signifi-cant increase (p-value of 0.001).
Figure 19 Participants that perform tasks that involve numeracy «Often» or «Regularly», before and after training (percent, N=35)
0 %
10 %
20 %
30 %
40 %
50 %
60 %
70 %
80 %
90 %
100 %
Before training After training
76
39
21 27
18
69
46 37 37 37
Paying bills Keeping scores in agame
Calculating VAT Using measurementsin a recipe
Personal budgeting
Figure 20 Participants that write «Often» or «Regularly», before and after training (percent, N=35)
0 %
10 %
20 %
30 %
40 %
50 %
60 %
70 %
80 %
90 %
100 %
Before training After training
31 38
44
54
43
63
Writing short messages Writing down phone messages Typing message on computer
OUTCOMES OF WORKPLACE TRAINING IN BASIC SKILLS ARBEIDSLEDIGE INNVANDRERE OG VIDEREGÅENDE UTDANNING FOR VOKSNE PB 24
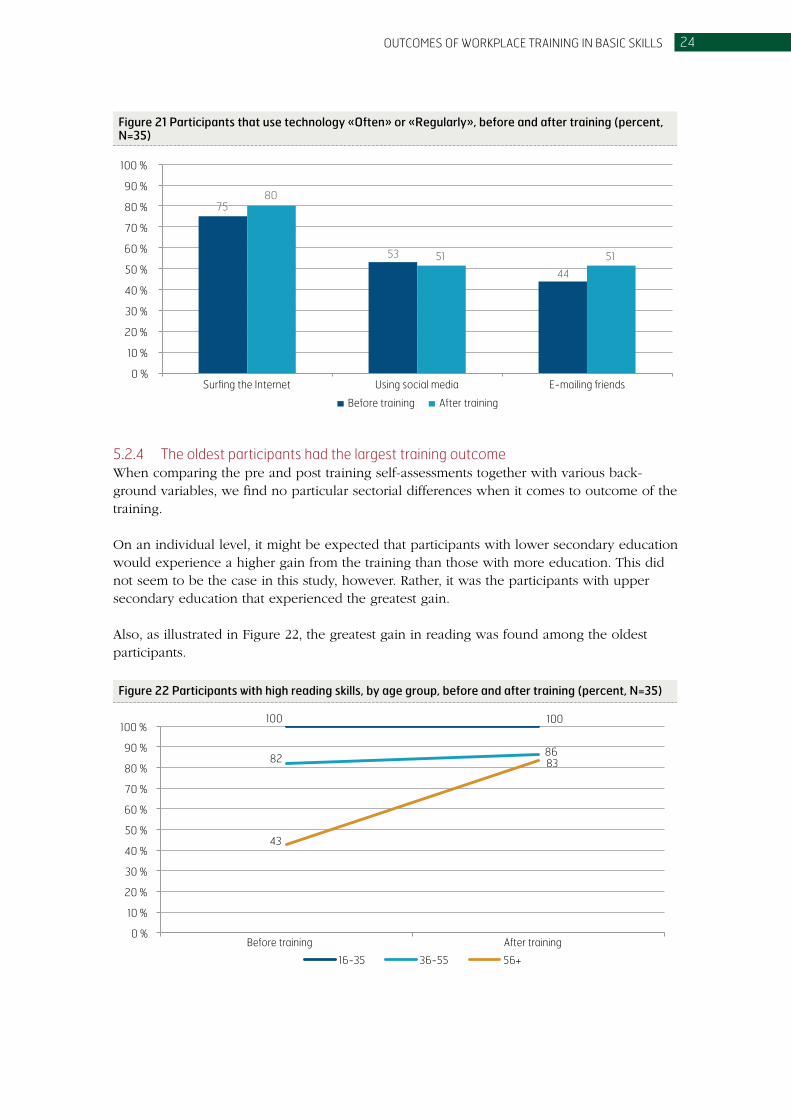
Figure 21 Participants that use technology «Often» or «Regularly», before and after training (percent, N=35)
0 %
10 %
20 %
30 %
40 %
50 %
60 %
70 %
80 %
90 %
100 %
Before training After training
75
53
44
80
51 51
Surfing the Internet Using social media E-mailing friends
5.2.4 The oldest participants had the largest training outcomeWhen comparing the pre and post training self-assessments together with various back-ground variables, we find no particular sectorial differences when it comes to outcome of the training.
On an individual level, it might be expected that participants with lower secondary education would experience a higher gain from the training than those with more education. This did not seem to be the case in this study, however. Rather, it was the participants with upper secondary education that experienced the greatest gain.
Also, as illustrated in Figure 22, the greatest gain in reading was found among the oldest participants.
Figure 22 Participants with high reading skills, by age group, before and after training (percent, N=35)
0 %
10 %
20 %
30 %
40 %
50 %
60 %
70 %
80 %
90 %
100 %100 100
82
43
8683
Before training After training
16-35 36-55 56+

OUTCOMES OF WORKPLACE TRAINING IN BASIC SKILLS ARBEIDSLEDIGE INNVANDRERE OG VIDEREGÅENDE UTDANNING FOR VOKSNE PB 25
Those who had at least one level 1 score in the PDQ assessment were the other group with the greatest gain. Figure 23 show how these compared to the ones who had at least one level 3 score in the PDQ assessment with regards to reading.
Figure 23 Participants with high reading skills, by PDQ scores, before and after training (percent, N=35)
0 %
10 %
20 %
30 %
40 %
50 %
60 %
70 %
80 %
90
67
94
79
90 %
100 %
Before training After training
PDQ level 1, at least one scale PDQ level 3, at least one scale
Figure 24, 25 and 26 show the share of participants with high reading skills by their skill level in Prose, Document, and Quantitative literacy, before and after training.As should be expected, the participants with the lowest skill level in every literacy scale experienced the greatest gain.
Figure 24 Participants with high reading skills, by pre-training Prose literacy score, before and after training (percent, N=35)
100 100
78
60
0 %
10 %
20 %
30 %
40 %
50 %
60 %
70 %
80 %
90 %
100 %
Before training After training
Low skill in prose High skill in prose

OUTCOMES OF WORKPLACE TRAINING IN BASIC SKILLS ARBEIDSLEDIGE INNVANDRERE OG VIDEREGÅENDE UTDANNING FOR VOKSNE PB 26
Figure 25 Participants with high reading skills, by pre-training Document literacy score, before and after training (percent, N=35)
100 100
77
64
0 %
10 %
20 %
30 %
40 %
50 %
60 %
70 %
80 %
90 %
100 %
Before training After training
Low skill in document High skill in document
Figure 26 Participants with high reading skills, by pre-training Quantitative literacy score, before and after training (percent, N=35)
0 %
10 %
20 %
30 %
40 %
50 %
60 %
70 %
80 %
90 %
100 %
86
69
80
92
Before training After training
Medium skill in quantitative High skill in quantitative
We also found that the participants who reported never, rarely, or little when asked how much they read on the Internet in the pre-assessment, experienced a certain progress in reading skills from the pre to the post assessment compared to those who read frequently on the Internet in the first place (see figure 27).

OUTCOMES OF WORKPLACE TRAINING IN BASIC SKILLS ARBEIDSLEDIGE INNVANDRERE OG VIDEREGÅENDE UTDANNING FOR VOKSNE PB 27
Figure 27 Participants with high reading skills, by reading on the Internet, before and after training (percent, N=35)
0 %
10 %
20 %
30 %
40 %44
8891
75
50 %
60 %
70 %
80 %
90 %
100 %
Before training After training
Use of Internet, never/rarely/little Use of Internet, often/regularly
5.2.5 Participants’ retrospective evaluation of their pre-training skill levelAfter they had received their training, participants assessed their pre-training skill level, retrospectively. We expected that the participants would rate their pre-training skill level lower after they had received their training.
This was not the case. Rather, the participants rated their pre-training skill level higher in the retrospective assessment, and also rated their pre-training reading frequency exact the same way (see figure 28).
Figure 28 Participants with good or very good skills, before, in retrospect, and after training (percent, N=35)
0 %
10 %
20 %
30 %
40 %
50 %
60 %
70 %
80 %
90 %
100 %
7676 77
68
88 88
646155
67
Before Before, in retrospect After
Reading Writing Numeracy Computer
We are not able to fully explain this finding. It might suggest that the participants had diffi-culties in estimating their own competence in the near past. But it could also be that they do not think that they learned anything even if they actually did learn quite a lot. Moreover the high retrospective assessments may also be a result of embarrassment of the low skills the participants had before the training started. Another issue that perhaps affected the results is the fact that the retrospective assessment was done at the same time as the post assessment.

OUTCOMES OF WORKPLACE TRAINING IN BASIC SKILLS ARBEIDSLEDIGE INNVANDRERE OG VIDEREGÅENDE UTDANNING FOR VOKSNE PB 28
As we stated above, the participants from the painting industry got quite a lot of instructions on how to fill in the form before doing the pre-training self-assessment in the beginning of their course. We might therefore imagine that they were more conscious towards their low skill level than the other participants were before they started their training. However, com-paring the pre, retrospective, and post assessment in reading by sector shows that this was not the case (Figure 29).
Figure 29 Participants with good or very good reading skills, before, in retrospect, and after training (percent, N=35)
0 %
10 %
20 %
30 %
40 %
50 %
60 %
70 %
80 %
90 %
100 % 100
77
91
80
75
59
100 100
Before Before, in retrospect After
Retail Transport Painting Industry
5.2.6 Participants’ own explanation for learning outcomeThe participants were asked to assess what had caused the potential change in their ability to perform tasks, and in their confi-dence and frequency in performing these tasks. Approximately one fifth of the partici-pants thought that any changes were mostly due to the training, while approximately one third thought that any change was mostly caused by other factors in their lives. Figure 30-32 illustrate this.
Figure 30 Participants’ explanation for change in ability to perform tasks (percent, N=35)
28 %
53 %
19 %
Mostly other factors
Mostly the training
50/50
Figure 31 Participants’ explanation for change in confidence in doing tasks (percent, N=35)
Mostly other factors
Mostly the training
50/50
34 %
44 %
22 %
Figure 32 Participants’ explanation for change in frequency of doing tasks (percent, N=35)
Mostly other factors
Mostly the training
50/50
37 %
44 %
19 %

OUTCOMES OF WORKPLACE TRAINING IN BASIC SKILLS ARBEIDSLEDIGE INNVANDRERE OG VIDEREGÅENDE UTDANNING FOR VOKSNE PB 29
A breakdown by sector shows that the participants from the painting industry thought that the changes were due to the training to a greater degree than the participants from the other sectors (see figure 33).
Figure 33 Participants that said that any change to a high/very high degree was a result of the training, by sector (percent, N=35)
29
0
17
35
0
17
24
22
0
0 % 10 % 20 % 30 % 40 % 50 %
Painting Industry
Transport
Retail
Frequency Confidence Ability

OUTCOMES OF WORKPLACE TRAINING IN BASIC SKILLS ARBEIDSLEDIGE INNVANDRERE OG VIDEREGÅENDE UTDANNING FOR VOKSNE PB 30
6. Concluding remarks
In summary, the results show that training had a positive outcome. Participants rated their skills higher after the training than before in all four skills. The progress in computer skills is significant. Given that the use of Internet is a crucial skill for citizens of the 21th century (OECD, 2012, p. 11) this is very positive.
Many participants also performed various tasks and activities more frequently after the training than before.
Participants with the lowest PDQ scores as well as the oldest participants experienced the greatest training outcome. This indicates that training – across the sectors – had the greatest effect for the participants who needed it the most.
A few central weaknesses in this study are worth highlighting.
Firstly, the fact that we were not able to obtain post training PDQ scores makes the real outcome of the training more difficult to assess.
Secondly, as the post-assessment was done at the end of the training period, participants had not been given time to digest and process what they had learned when they were asked how often they read, used the Internet and so forth. It is not unlikely that the difference between the pre and post training frequency of reading, surfing the Internet etc. would have been bigger if the participants completed their post training self-assessments sometime after the training was completed.
This is particular an issue concerning the participants from the painting industry, who com-pleted their post training self-assessment before they had finished their training.
Thirdly, the project has a small sample size. Only 66 percent (35 out of the original 53) participants completed their post training self-assessment, which is a low response rate.
Fourthly, research shows that an important factor for the outcome of training for adult participants is that the participants are motivated and that they find the training useful (Wahlgren, 2009, p. 6). We have reasons to believe that some of the drivers included in our research project were not particularly motivated for the basic skills training. In telephone conversations with participants that were made in order to collect some missing post training assessments, it was said that the drivers were persuaded to attend the training, and that some of them were reluctant because they ran a risk of losing money as each of them owned their own taxi company. It was also said that many of the drivers found the level of the provision, particularly the computer lessons, too elementary.
Ultimately we do not know if this affected the outcome of the training here, but it is not unlikely.

OUTCOMES OF WORKPLACE TRAINING IN BASIC SKILLS ARBEIDSLEDIGE INNVANDRERE OG VIDEREGÅENDE UTDANNING FOR VOKSNE PB 31
7. References
Bjørkeng, B., & Lagerstrøm, B. O. (2014). Voksnes leseferdigheter – resultater fra PIAAC. Retrieved from
http://www.ssb.no/utdanning/artikler-og-publikasjoner/_attachment/195061?_ts=1483b732920
ETS. Types of Literacy. from https://www.ets.org/literacy/research/literacy_types
Gabrielsen, E. (2000). Slik leser voksne i Norge: en kartlegging av leseferdigheten i aldersgruppen 16 - 65 år.
Høgskolen i Stavanger: Senter for leseforskning.
Hamilton, M., & Barton, D. (2000). The international adult literacy survey: What does it really measure?
International Review of Education, 46(5), 377-389.
Hansen, Ø. L., Larsen, M. F., & Lønvik, K. (2013). Basiskompetanse i Posten og Bring - delrapport 2 om
kurseffekter. Oslo: Vox.
OECD. (2010). PISA 2009 Results: Learning to Learn – Student Engagement, Strategies and Practices (Vol. 3).
Paris: OECD.
OECD. (2012). Literacy, Numeracy and Problem-Solving in Technology-Rich Environments. Framework for
the OECD survey of adult skills. Paris: OECD.
Wahlgren, B. (2009). Transfer mellem uddannelse og arbejde. Copenhagen: NCK.

OUTCOMES OF WORKPLACE TRAINING IN BASIC SKILLS ARBEIDSLEDIGE INNVANDRERE OG VIDEREGÅENDE UTDANNING FOR VOKSNE PB 32
Tables
Table 1 Timeline data collection ................................................................................................................................................................................... 8
Table 2 Participants, by sector/courses and data collection ........................................................................................................................... 8
Table 3 Participants, by sector and selected demographic characteristics (percent, N=53) ............................................................10
Table 4 Participants with good or very good pre-training skills, by sector (percent, N=53) ................................................................12
Table 5 Participants’ pre-training ability to perform various activities (percent, N=53) .......................................................................12
Table 6 Participants pre-training assessment of frequency in performing various tasks (percent, N=53) ....................................12
Table 7 Proportion of participants with self-assessed good or very good skills, before and after training
(percent, N=35) ..................................................................................................................................................................................................21
Figures
Figure 1 Participants’ pre-training self-assessed skill level (percent, N=53) ...............................................................................................11
Figure 2 Participants’ pre-training proficiency levels in Prose, Document and Quantitative literacy (percent, N=46) ............. 13
Figure 3 Participants with level 3 PDQ scores, by scale and sector (percent, N=46) ............................................................................... 13
Figure 4 Participants with high skill levels*, self-assessed skill level in numeracy and Quantitative literacy score
(percent, N=46) .................................................................................................................................................................................................14
Figure 5 Participants with high skill levels*, self-assessed skill level in reading and Prose and Document literacy
score (percent, N=46) .....................................................................................................................................................................................15
Figure 6 Participants with high skill levels, self-assessed skill level in numeracy and Quantitative literacy score,
by sector (percent, N=46) .............................................................................................................................................................................15
Figure 7 Participants with high skill levels, self-assessed skill level in reading and Prose and Document literacy score,
by sector (percent, N=46) .............................................................................................................................................................................16
Figure 8 Participants with high skill levels, self-assessed skill level in Reading and Document and Prose literacy score,
by age group (percent, N=46)......................................................................................................................................................................16
Figure 9 Participants with self-assessed high skill level in numeracy and Quantitative literacy score, by age group
(percent, N=46) ................................................................................................................................................................................................. 17
Figure 10 Participants with high skill levels, self-assessed skill level in numeracy and Quantitative literacy score,
by education (percent, N=46) ...................................................................................................................................................................... 17
Figure 11 Participants with high skill levels, self-assessed skill level in Reading and Document and Prose literacy score,
by education (percent, N=46) ......................................................................................................................................................................18
Figure 12 Quantitative literacy proficiency levels, by self-assessed skill level in numeracy (percent, N=46) ..................................19
Figure 13 Document literacy proficiency level, by self-assessed skill level in reading (percent, N=46) .............................................19
Figure 14 Prose literacy proficiency level, by self-assessed skill level in reading (percent, N=46) .......................................................19
Figure 15 Reading skills, by frequency of reading on the Internet (percent, N=53) .................................................................................. 20
Figure 16 Participants with self-assessed good or very good ability to perform tasks, before and after training
(percent, N=35) ..................................................................................................................................................................................................21
Figure 17 Participants reading «Often» or «Regularly», before and after training (percent, N=35) ...................................................22
Figure 18 Participants using documents «Often» or «Regularly», before and after training (percent, N=35) ................................22
Figure 19 Participants that perform tasks that involve numeracy «Often» or «Regularly», before and after
training (percent, N=35) ................................................................................................................................................................................23
Figure 20 Participants that write «Often» or «Regularly», before and after training (percent, N=35)................................................23
Figure 21 Participants that use technology «Often» or «Regularly», before and after training (percent, N=35) ..........................23
Figure 22 Participants with high reading skills, by age group, before and after training (percent, N=35) ..........................................24
Figure 23 Participants with high reading skills, by PDQ scores, before and after training (percent, N=35) .......................................24
Figure 24 Participants with high reading skills, by pre-training Prose literacy score, before and after training
(percent, N=35) .................................................................................................................................................................................................25
Figure 25 Participants with high reading skills, by pre-training Document literacy score, before and after
training (percent, N=35) ................................................................................................................................................................................25

OUTCOMES OF WORKPLACE TRAINING IN BASIC SKILLS ARBEIDSLEDIGE INNVANDRERE OG VIDEREGÅENDE UTDANNING FOR VOKSNE PB 33
Figure 26 Participants with high reading skills, by pre-training Quantitative literacy score, before and after
training (percent, N=35) ............................................................................................................................................................................... 26
Figure 27 Participants with high reading skills, by reading on the Internet, before and after training (percent, N=35) ............... 26
Figure 30 Participants’ explanation for change in ability to perform tasks (percent, N=35) ..................................................................28
Figure 31 Participants’ explanation for change in confidence in doing tasks (percent, N=35) .............................................................28
Figure 32 Participants’ explanation for change in frequency of doing tasks (percent, N=35) ...............................................................28
Figure 33 Participants that said that any change to a high/very high degree was a result of the training, by sector
(percent, N=35) .................................................................................................................................................................................................28
Appendix
Table A.1 Participants’ pre-training self-assessment of their frequency in performing various tasks (percent, N=53)
Percent
Various reading materials Never/Rarely Little Often/Regularly
Reading
Emails 10 71
Internet 14 12 74
Books 49 25 26
Newspapers 8 20 72
Workplace documents 14 18 68
Directions in a recipe 29 32 39
Using documents
Instructions 18 45 37
Flyers/Ads/Signs 26 29 45
Schedules 22 33 45
Working with numbers
Paying bills 14 10 76
Keeping score 43 33 24
Using measurements 29 41 30
Calculating VAT 59 16 25
Personal budgeting 48 31 21
Writing
Short messages 20 46 34
Typing a message on a computer 30 28 42
Using technology
Internet 16 8 76
Social media 32 14 54
Emailing friends and family 30 26 44
19

OUTCOMES OF WORKPLACE TRAINING IN BASIC SKILLS ARBEIDSLEDIGE INNVANDRERE OG VIDEREGÅENDE UTDANNING FOR VOKSNE PB 34
Table A.2 High self-assessed frequency in performing various activities (percent, N=53)
Sectors (Percent)
Various activities Retail Transport Painting Industry
Reading
Emails 100 73 59
Internet 100 73 71
Books 57 36 5
Newspapers 71 77 68
Workplace documents 100 68 59
Directions in a recipe 43 46 32
Using documents
Instructions 29 50 27
Flyers 86 41 36
Schedules 71 41 41
Activities involving numbers
Paying bills 71 77 77
Keeping score 29 23 23
Using measurements 43 36 18
Calculating VAT 43 41 5
Personal budgeting 29 0 22
Writing
Short messages 57 32 29
Typing a message on a computer 71 41 33
Using technology
Internet 100 73 71
Social media 57 50 57
Emailing friends and family 57 41 43
